Review

A Review of Sand–Clay Mixture and Soil–Structure Interface Direct Shear Test

by
Kexin Yin
1,*,
Anne-Laure Fauchille
1,
Eugenia Di Filippo
1,2,
Panagiotis Kotronis
1 and
Giulio Sciarra
1
1
Institut de Recherche en Génie Civil et Mécanique (GeM), Ecole Centrale de Nantes, UMR 6183 CNRS, 1 Rue de la Noë, CEDEX 3, 44321 Nantes, France
2
Department of Civil and Environmental Engineering, University of Perugia, via G. Duranti 93, 06125 Perugia, Italy
*
Author to whom correspondence should be addressed.
Geotechnics 2021, 1(2), 260-306; https://doi.org/10.3390/geotechnics1020014
Submission received: 5 May 2021 / Revised: 7 September 2021 / Accepted: 28 September 2021 / Published: 4 October 2021
(This article belongs to the Special Issue Soil-Water-Structure Interaction)

Abstract

:
Natural soils are usually heterogeneous and characterized with complex microstructures. Sand–clay mixtures are often used as simplified soils to investigate the mechanical properties of soils with various compositions (from clayey to sandy soils) in the laboratory. Performing laboratory tests on a sand–clay mixture with definite clay fraction can provide information to understand the simplified soils’ mechanical behavior and better predict natural soils’ behavior at the engineering scale. This paper reviews previous investigations on sand–clay mixture and soil–structure interface direct shear test. It finds that even though there are many investigations on sand–clay mixtures and soil–structure interfaces that consider pure sand or pure clay, limited data on the mechanical behavior of the interface between sand–clay mixture and structure materials are available. Knowledge is missing on how the clay content influences the mechanical behavior of interface and how the soil particles’ arrangement changes as the clay content increases. Further study should be performed to investigate the interface in terms of a reconstituted sand–clay mixture and structure by interface direct shear test, to highlight the influence of clay fraction on the interface response, under various loading conditions.

1. General Introduction

In geotechnical engineering, the soil–structure interface is a vital part of the design of civil engineering structures because it ensures the stability of the supporting structure by transferring the load from the structural materials to the surrounding soils. The characterization of the soil–structure interface for such purpose is met for very variable structures and contexts such as shallow foundations, deep foundations, earth dams, geothermal piles, nuclear waste disposal, retaining walls, coal mine shaft failure, geogrid reinforcement, etc. [1,2,3,4,5,6,7,8,9]. The soil–structure interface is defined as a thin zone of surrounding soil near the structure, generally considered as a few times the mean soil particle diameter [10,11,12,13,14]. Although the interface zone is significantly much thinner than the surrounding soil volume, it is the zone where major stress and strain develop [11,13,15,16]. In the literature, the mechanical behavior of this interface mainly concerns structural materials (steel, wood, concrete, or geomembrane) at the interface of typical soils, such as sand and clay [8,13,17,18,19,20]. However, natural soils are very often intermediate between sand and clay. Using natural soils to characterize the mechanical behavior of the soil–structure interface is adapted to singular systems but increases the difficulty to obtain well repeatable results of laboratory studies, due to the complex nature and the multi-scale heterogeneities of soil materials encountered in the field. Reconstituted (or simplified) soils composed of sand and clay with controlled fractions of their components are used in the laboratory instead of natural soils to investigate the mechanical behavior of clayey and sandy materials with better control of their contents and their petrophysical properties. The number of studies on the mechanical behavior of those soils is widely significant in the literature, but, to our knowledge, it is relatively poorly documented on the interface between these soils and structural materials, whereas their response to mechanical loadings is very different. Interface direct shear experiments are usually performed to characterize the response of soil–structure interface to mechanical loadings, with classical centimeter-size cells to larger cells, up to several decimeters [11,17,19,21,22,23,24,25]. The mechanical behavior of the soil–structure interface can be investigated by an interface direct shear device, to represent the interface of a pile foundation in the laboratory, and sand–clay mixtures at controlled fractions of clay can be used as the simplified soil. The effect of the clay content, e.g., from 0% (sand) to 100% (clay), on the interface’s mechanical response can be therefore investigated and clarified. Sand–clay mixtures are wildly used or met in the field of construction, e.g., pavements, underground mining, nuclear waste disposal, and polluted product storage, as well as artificial muds for drilling. Understanding the fundamental response of sand–clay mixtures provides insights to improve the design of construction foundations and to ensure their stability.
This review paper is divided into two sections. The goal of the first section was to provide the state of the art on the clay influence on the mechanical behavior of clayey soils. It reviews the typical experiments (particularly triaxial and direct shear) employed on sand–clay mixtures to describe how clay controls the mechanical response of such mixed soils. It also identifies the main factors that strongly participate in controlling the soil response, such as fines contents, intergranular void ratio, and transitional fines content. These parameters are not independent and definitely related to the clay fraction. This part concludes that there are still some unclear mechanisms to understand the mechanical behavior of sand–clay mixture, which is why further research concerning this topic should be carried out.
The second section presents the interface direct shear test and the controlling factors of the interface behavior between structural and granular materials. First of all, it reviews the basic theory and the state of the art of interface direct shear tests, how the interface direct shear test is derived from the classical one, the mechanisms of shearing at the interface, and the summary of interface thickness. The main factors affecting the soil–structure interface are then introduced: boundary conditions (CNL, CNS, and CV), normal stress, soil density, water content, structure surface roughness, shearing velocity, and temperature. Particle movement and arrangement at the soil–structure interface during shearing are also presented. Although there are a lot of studies on sand–clay mixture and a substantial amount of interfaces’ studies on classical or natural soils, there is still a lack of data about interface mechanical behavior involving soils at controlled clay contents, which represent better the natural soils, but without scattered heterogeneities at multiple scales.

2. The Role of Clay on the Mechanical Behavior of Sand–Clay Mixtures

2.1. State of the Art of the Mechanical Behavior of Sand–Clay Mixtures

The state of the art on the mechanical behavior of sand–clay mixtures is presented in the following. This overview defines the sand–clay mixture and presents typical experiments (especially direct shear tests) employed in sand–clay mixture research in the laboratory.

2.1.1. Definition of Sand–Clay Mixture

• Definition
According to the fines content classification systems, in geotechnics, natural soils are generally classified as sandy or clayey soils [26,27]. Natural clayey soils containing gravel, sand, and silt or clay are studied in situ and in the laboratory. The mechanical behavior of these soils is strongly affected by their intrinsic properties, in particular, heterogeneity, anisotropy, and geological history [28,29,30,31,32]. The complexity of soil specimens can sometimes lead to not always consistent testing results, which increase the challenge to determine a finite set of intrinsic parameters that characterize their main features.
Experimental and theoretical studies of soil behavior have often concentrated on ideal soils (pure clay or uniform sand), and soil mechanics have been mainly developed based on test results of these ideal soils. To better understand the mechanical behavior of natural soils, simplified and controlled soils are often used in laboratory testing instead of natural ones. The simplified soils can be reconstituted sand–silt or sand–clay mixture soils with fabric similar to natural soils. The properties of such simplified mixtures are, thus, expected to be intermediate or transitional between the properties of the constituent materials. The engineering behavior of a mixture matrix of coarse–fine grains can be explained by the nature of the interaction between coarse and fine grains [30,33].
Sand–clay and sand–silt mixtures are often termed as sand–fines mixtures. A sand–fines mixture is made up of a granular material with larger particles (e.g., gravel, sand, glass beads) and a material with finer particles (e.g., silt, clay). The mineral structures of clay and sand are pretty different, so that the behavior of the sand–clay mixture is influenced both by the particle sizes and the physico-chemical characteristics of each material present.
• Study history on sand–clay mixtures
Since the last century, a great deal of research has been conducted on many types of sand–clay mixtures. The influence of the proportions of sand or clay in a mixture has always been of interest [3,34,35,36,37,38,39,40,41,42]. Miller and Sowers [41] first investigated the effects of varying the proportions of coarse- and fine-grained soils on the strength of the resulting mix. They prepared samples with various mixtures of river sand and sandy clay ranging from 100% sand to 100% clay and then performed triaxial tests. The authors found that cohesion and internal friction angle of a soil increase with an increase in density; the highest density is produced by 26% of clay and 74% of sand by weight. That may suggest that up to clay fraction of 26%, clay gradually fills the voids between the sand grains; beyond this percentage, the sand grains start to float in a matrix of compacted clay, and there is no more grain-to-grain contact. Havens and Goodwin [38] described the relationship between the percentage of clay in a sand–clay mixture and soil properties. As the percentage of clay increases, the maximum density of the mass increases up to the point where clay begins to overfill the voids. When this occurs, the clay begins to expand the granular structure. Consequently, further consolidation of the mass depends upon the susceptibility of the clay–water system to consolidate. Furthermore, the results from both Havens and Goodwin [38] and Miller and Sowers [41] affirmed that the cohesion increases and the angle of internal friction decreases with increasing clay content.
Other studies showed that the mechanical behavior of sand–clay mixtures highly depends on mineralogical composition, mineral structure of clay, clay proportions, temperature, and hydrogeological characteristics [42,43,44,45,46,47,48,49,50,51,52,53,54]. Further studies have also investigated the effect of water content [34,55,56], the swelling properties and the suction distribution [34,55,57], the porosity and permeability [56,58], and the volume changes [36] on sand–clay mixtures, pointing out that each of them has non-negligible effects on the behavior of such mixtures.

2.1.2. Experimental Studies on Sand–Clay Mixtures’ Mechanical Behavior

Following the previous remarks, it is clear that a sand–clay mixture behaves as “sand-like” soil at low clay content, while behaves as “clay-like” soil at high clay content. Simpson and Evans [59] stated that the limit of clay content at which behavior changes from “sand-like” to “clay-like” might differ and depend on the measured experimental properties such as cohesion, peak and residual strength, friction angle, etc. An increasing clay content increases cohesion for low clay content (5% and 10%). At a higher clay content than 20%, cohesion decreases [60]. The undrained peak shear strength and the undrained residual strength decrease with the increasing of clay content, from 0% to 20% [61]. Kim et al. [39] prepared sand–clay mixtures for direct shear tests with clay contents varying from 5, 10, 15, 20, 25, and 30%. The internal friction angle of the sand–clay mixtures reaches a peak at a clay fraction of 10%. Mollins et al. [62] pointed out that bentonite has very little influence on the drained strength of sand–bentonite mixtures at the studied contents (5, 10, and 20%). However, at very high bentonite contents, the mixture strength tends towards the strength of the clay. Nagaraj [63] conducted unconfined compressive tests using different sand–clay mixtures and found out that the mixtures had the highest unconfined compressive strength at 40% to 60% clay fractions regardless of clay type.
Dash and Sitharam [64] performed undrained monotonic triaxial tests on clean sand with varying silt fractions from 5% to 75%. Results reveal that the peak strength initially increases up to 5% of silt fraction and thereafter decreases rapidly until around the limiting silt content and finally remains relatively constant for all the silt fractions up to pure silt. In dense sand–clay mixtures with clay contents from 0% to 100%, the cyclic shear strength decreases rapidly by increasing clay content since the sand skeleton structure becomes loose due to the increase of occupied clays between sand particles. In contrast, the strength of loose samples of sand–clay mixtures generally increases by increasing clay content [27]. These test results confirm that the mechanical response of sand–clay mixture varies with clay fraction, and a threshold indicating a transition from a sand-like behavior to a clay-like one can typically be defined.
Studies were also carried out on the effect of clay content on the response of sand–fines mixtures by using different experimental tests, such as oedometer, fall cone, triaxial, and direct shear tests [32,36,42,50,59,60,64,65,66,67,68,69,70]. The most important tests used to characterize the mechanical behavior of the mixtures under different loading conditions and to investigate the role of clay in the mechanical behavior of sand–clay mixtures are triaxial and direct shear tests.
• Triaxial tests
Graham et al. [36] presented triaxial tests at pressures up to 3 MPa to obtain a compacted sand–bentonite mixture’s strength and volume change behavior. Undrained triaxial compression tests were performed on host sand mixed with different amounts of fines by Thevanayagam [71] to find how the fines and confining stress affect the undrained shear strength of silty sand. Thevanayagam et al. [32] also performed undrained triaxial compression tests to characterize the relationship between the collapse potential of silty sand and the fines content.
Benahmed et al. [72] published a comparison of three drained triaxial tests on specimens prepared at different fines percentages (5%, 10%, and 15%) (see Figure 1). Results showed a slight increase in drained shear strength with the increase in fines. Volumetric strains proved to be very sensitive to the percentage of fines, and the sand–fines mixture became less contractive with increasing fines content. This trend is quite evident since the specimens have the same amount of sand, and the addition of fines leads to denser and, hence, less contractive specimens [72]. The effect of nonplastic fines on the sand–silt mixtures’ mechanical response was also studied with triaxial tests by Dash and Sitharam [64], who found that fines significantly influence the response of specimens from a loose to a medium dense state.
• Direct shear tests
The direct shear test is of significant importance to study the mechanical response of sand–clay mixture [39,42,60,73]. Direct shear tests were performed on the mixture of dry Ottawa sand and kaolinite clay by Vallejo and Mawby [42] to determine how the shear strength is influenced by the sand (or clay) fractions. Results are presented in Figure 2a, showing that the shear strength of the mixture is provided by both sand and clay, at clay content between 25% and 60%.
Apart from sand and clay with different particle sizes and shapes, a mixture of bigger and smaller glass beads (i.e., perfect spherical shape material) was tested on a direct shear device [74]. Results showed that shear strength depends on the weight fraction of the large and small bead in the binary granular mixtures (see Figure 2b). There is clear the larger grain-controlled and the smaller grain-controlled phases in Figure 2b compared to the sand–clay mixture case in Figure 2a. It seems that in the case of glass beads, the peak shear strength reduces when increasing the fines content (Figure 2b), while in the case of sand–clay mixture, it remains constant or increases (Figure 2a). It can be attributed to the fact that the sand is characterized by higher angularity than the glass beads. The contact is mainly point–point between larger glass beads and smaller ones, thanks to the perfect spherical shape, which will show less particle friction than sand–clay during shearing.
Unlike the results in Figure 2a, direct shear test results from Monkul and Ozden [50] showed that the mixture shear stress decreases gradually (Figure 3). In addition, the transitional fines content FCt (threshold between fines-dominated and sand-dominated behavior) becomes higher as the normal stress increases (FCt at 49.03 kPa < FCt at 98.07 kPa < FCt at 196.13 kPa). The values of FCt are 31.4%, 33.7%, and 36.6% for normal stress of 49.03 kPa, 98.07 kPa, and 193.13 kPa, respectively (Figure 3). It should be noticed that the corresponding FCt (i.e., the three dashed lines) in Figure 3 was obtained from oedometer tests. The three shear stress curves do not have obvious trough points to determine the transitional fines content FCt (Figure 3).
Direct shear tests were also performed on a rotund sand–angular sand mixture [75] (angular sand has finer grain); the shear strength of the mixed soil starts to decrease up to the average threshold fines content (i.e., the dashed line in Figure 4, about 11%). Results from low normal stress (14 kPa) in Figure 4 indicate, however, a different shear stress curve shape compared with the one in Figure 3 (49.03 kPa) and Figure 2a (54.2 kPa). At low normal stress of 54.2 kPa, the shear strength curve of sand–clay mixtures is relatively flat without too much change with clay content increases (Figure 2a and Figure 3). In contrast, at lower vertical stress than 14 kPa (Figure 4) and 13.9 kPa (Figure 2b) for sand–sand and glass bead–glass bead mixtures, there are transitional points at the fines content of FCt. This may be caused by the different particle contacts between sand–clay and sand–sand/glass bead–glass bead. Additionally, it can be concluded that the shear strength grows considerably with increasing confining stress (Figure 2, Figure 3 and Figure 4).
Looking at the Mohr–Coulomb failure envelopes from direct shear tests of Ottawa sand–kaolinite clay mixture, Figure 5 shows that the envelopes are linear and without any large variation of slope, which depends on the concentration of clay in the mixture [42]. The cohesion values are relatively small, and the friction angle variation is without any clear trend as a function of the clay content (see Figure 5).
Water content is another factor that has significant effects on the mechanical behavior of sand–clay mixtures. Dafalla [60] investigated sand–clay mixtures through direct shear tests at different clay fractions and water contents (w) (Figure 6).
The cohesion of the mixture is found increasing with the increase of clay content, except for at the water content of 20%. However, the influence of clay content on the cohesion and friction angle is unknown when the clay fraction is higher than 15% (lack of data). Moreover, an increase in moisture content at one specific clay content causes a drop in both cohesion and internal friction angle (Figure 6). It seems that when the water content overwhelms a given threshold, the cohesion significantly changes (Figure 6a).
The angle of repose and the internal friction angle of the sand–clay mixture are found higher than that of pure sand, according to the results of direct shear and angle of repose tests that were measured by Kim et al. [39]. Moreover, the peak value occurs at a clay percentage of 10% (Figure 7a). Several results from the literature on the internal friction angle function of the fines content are summarized in Figure 7, indicating an overall decrease of internal friction angle with increasing clay content.

2.2. Influence Factors on the Mechanical Response of Sand–Clay Mixtures

This part presents the most critical parameters that affect the mechanical response of the sand–clay mixture, such as the fines fraction, the intergranular void ratio, and the transitional fines content. All those parameters will be compared and discussed to identify better the role of clay in the mechanical response of sand–clay mixtures and the role of the mean microstructure in a more general view.

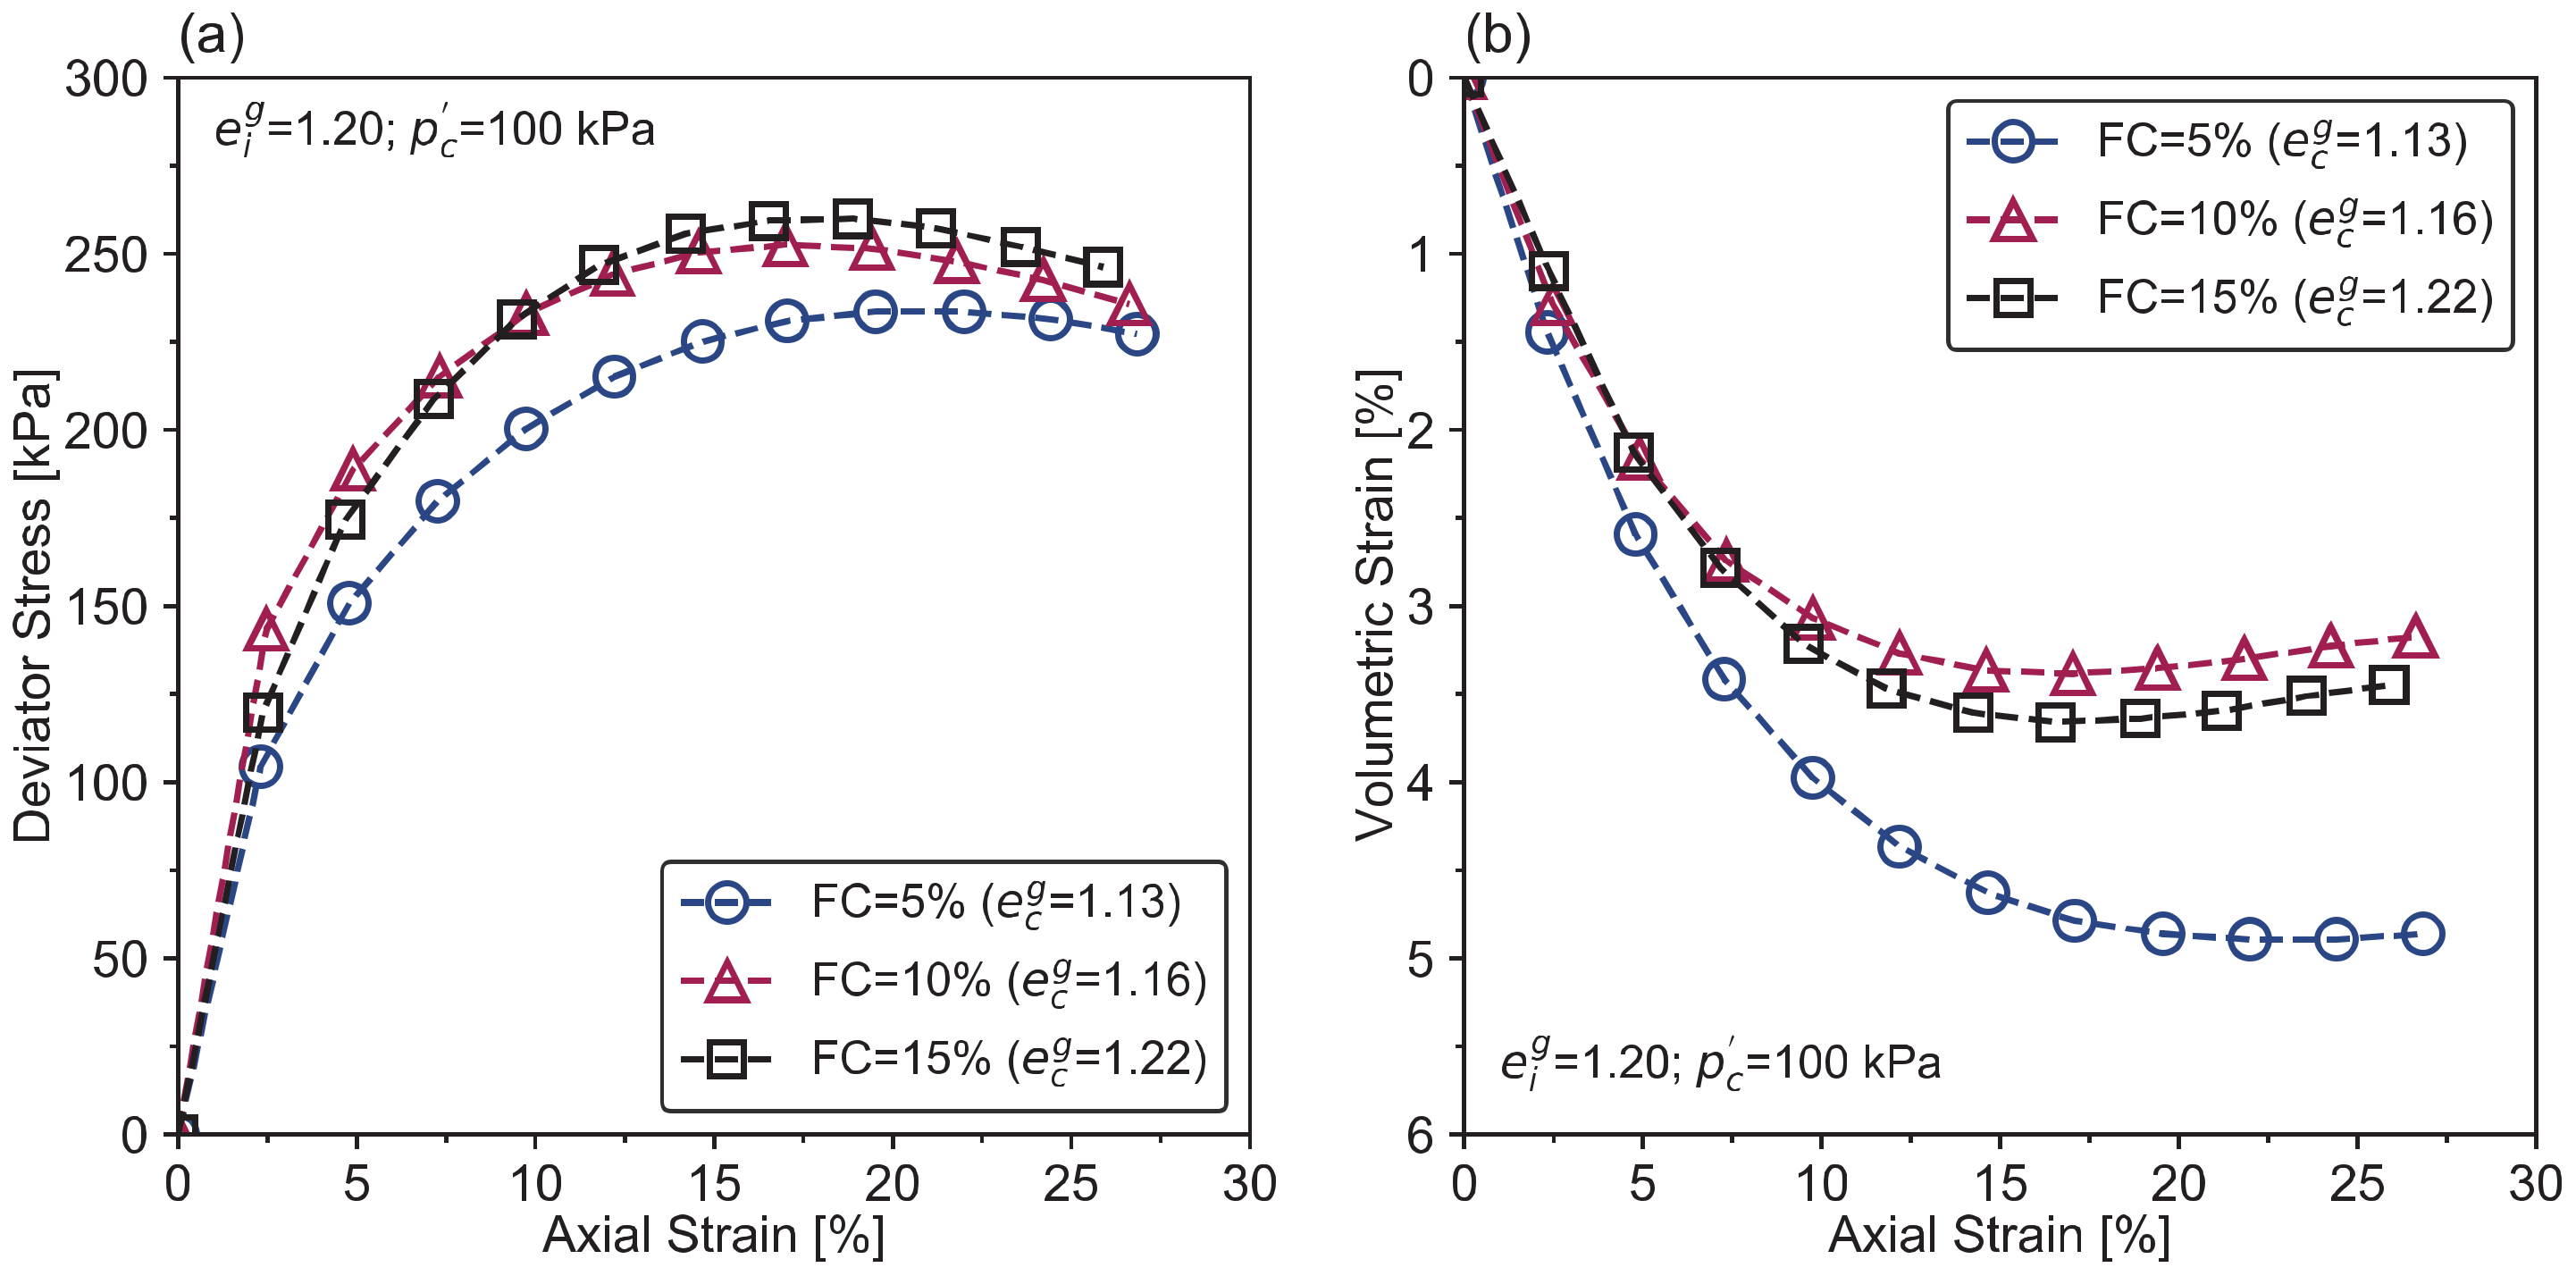
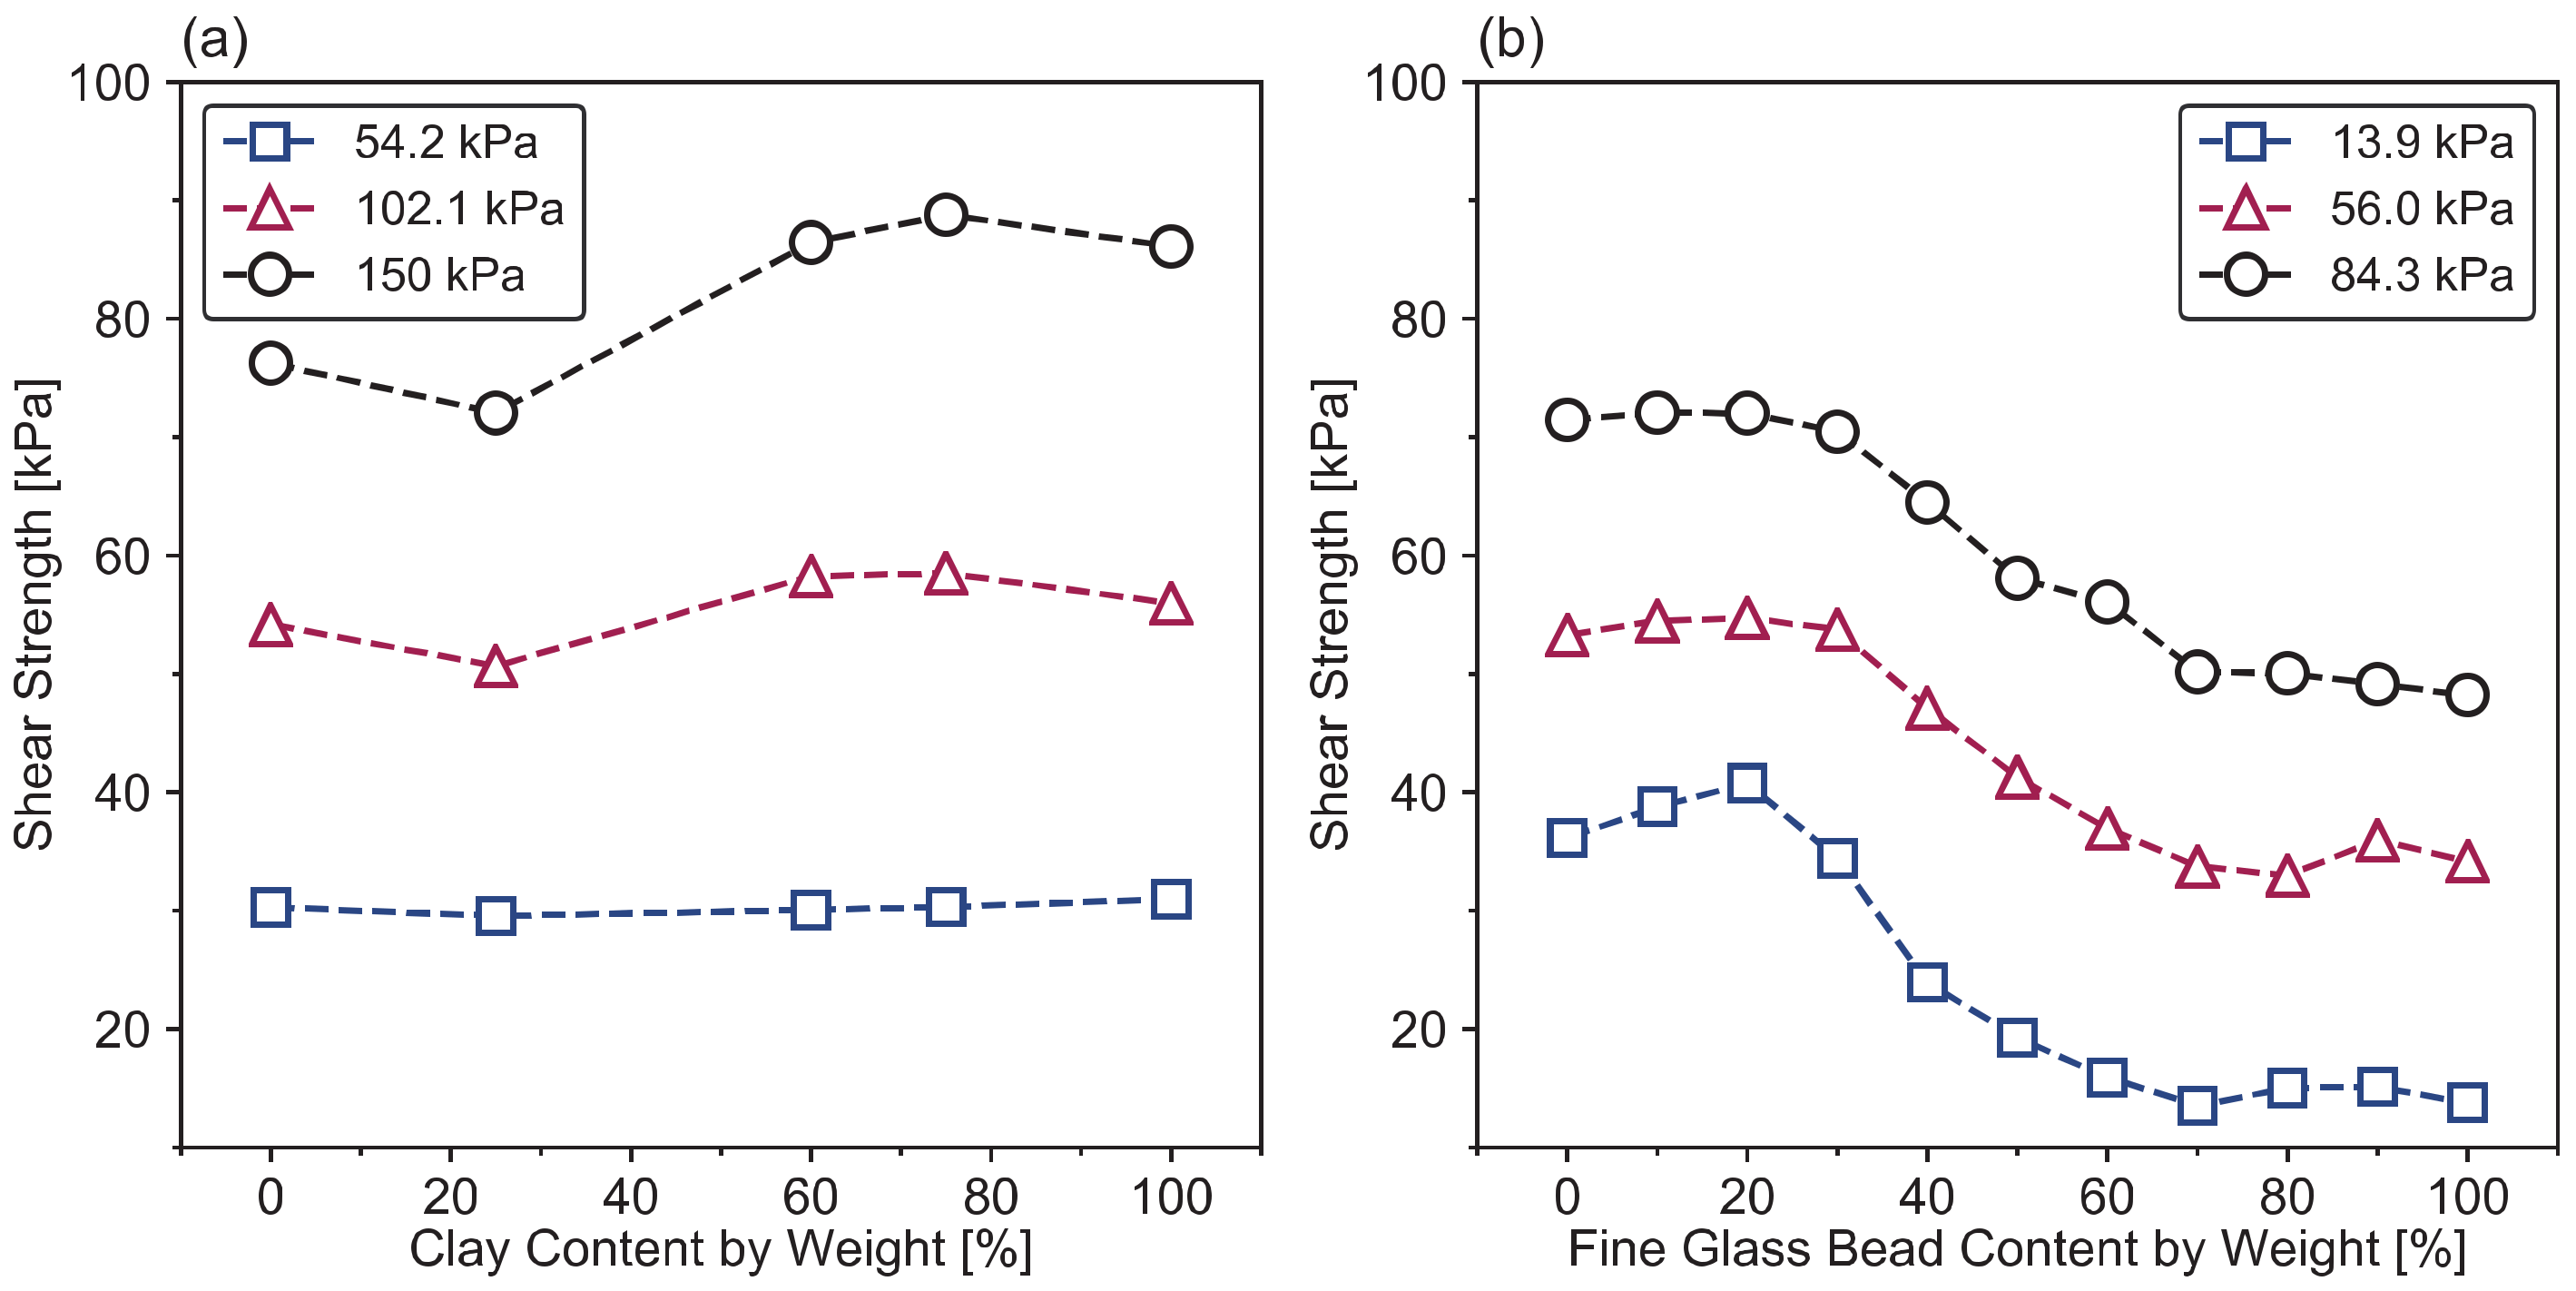
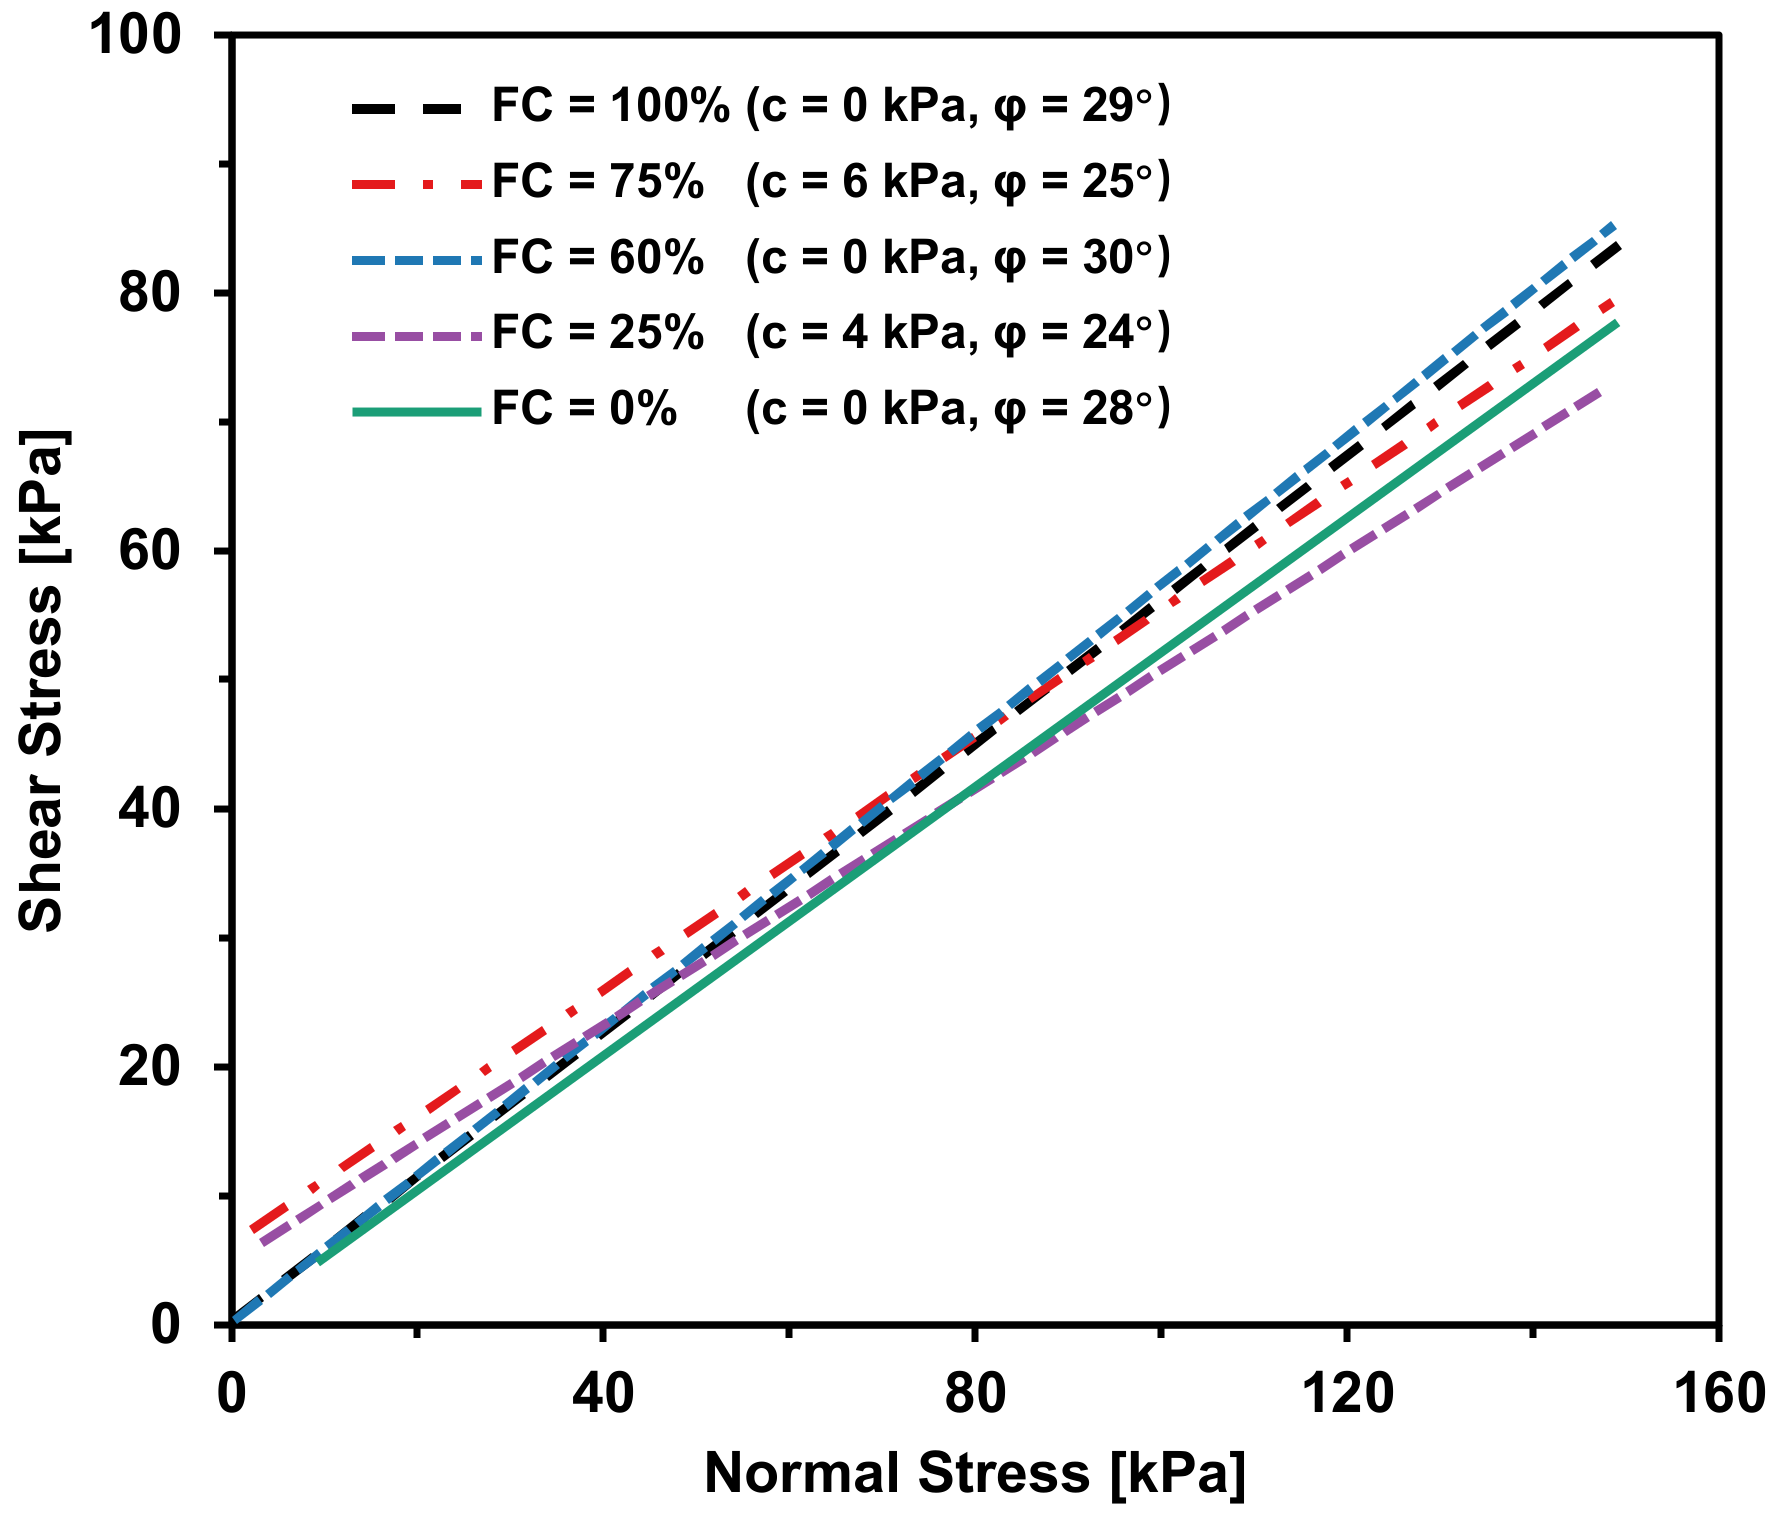
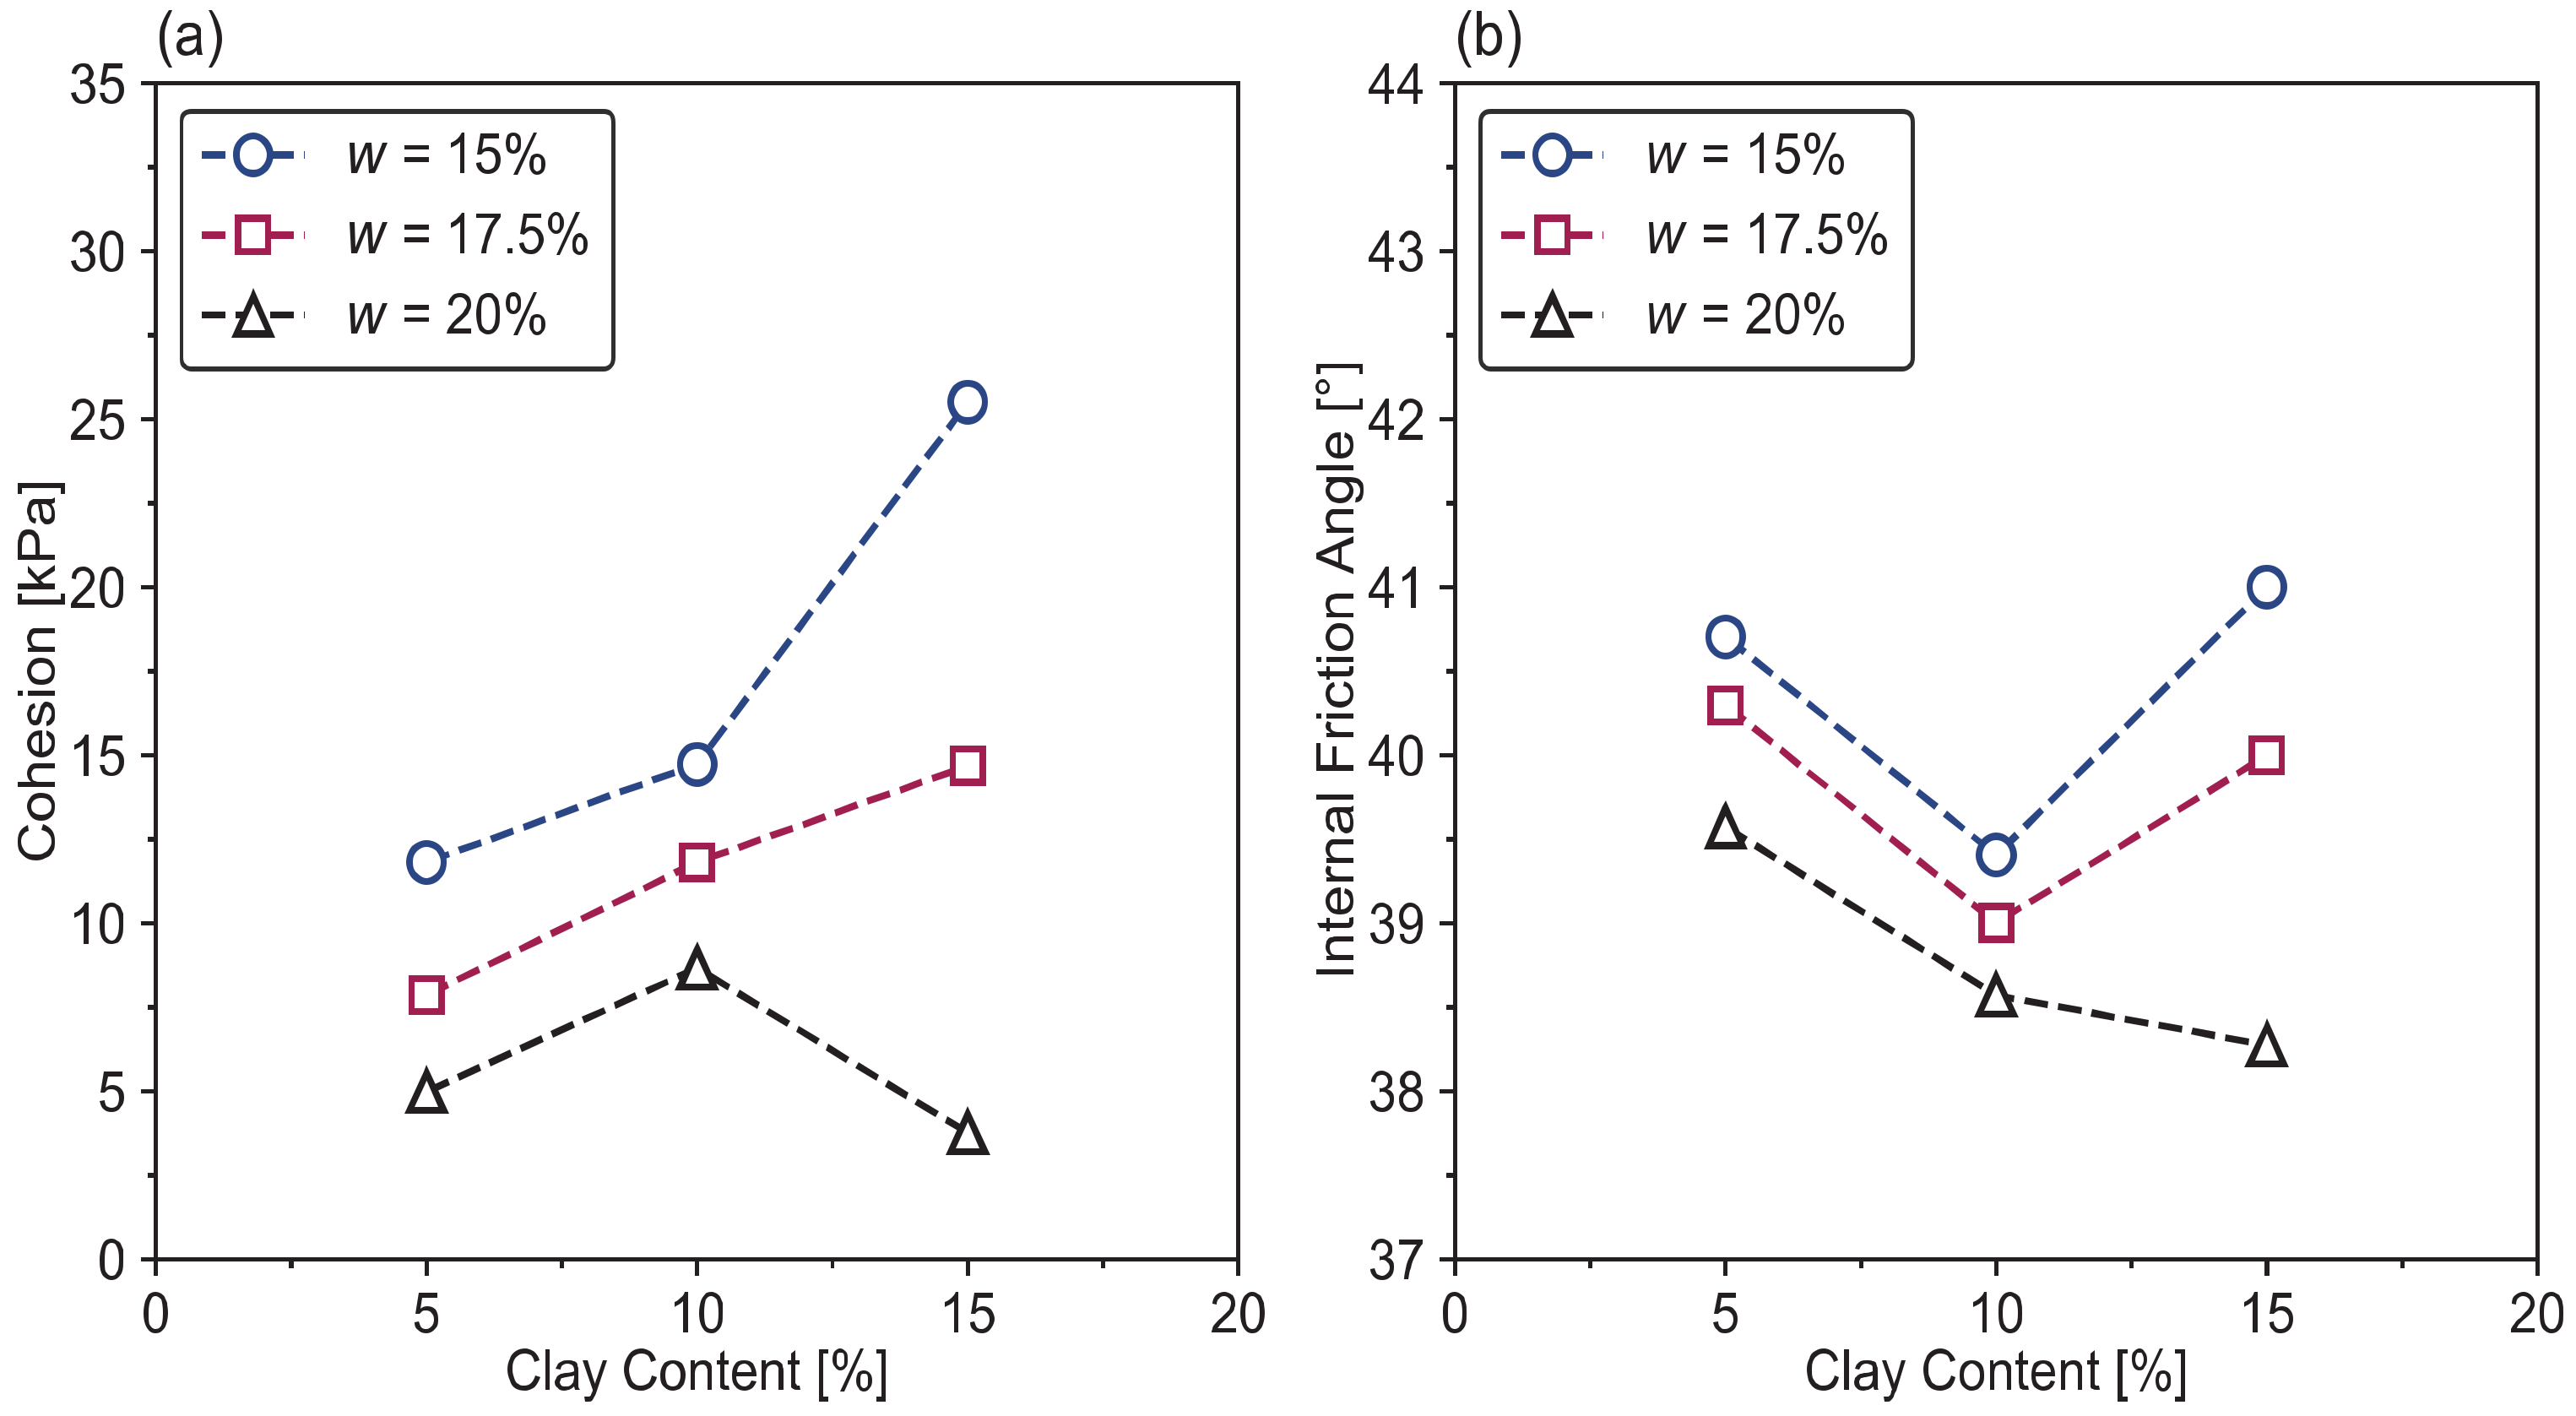
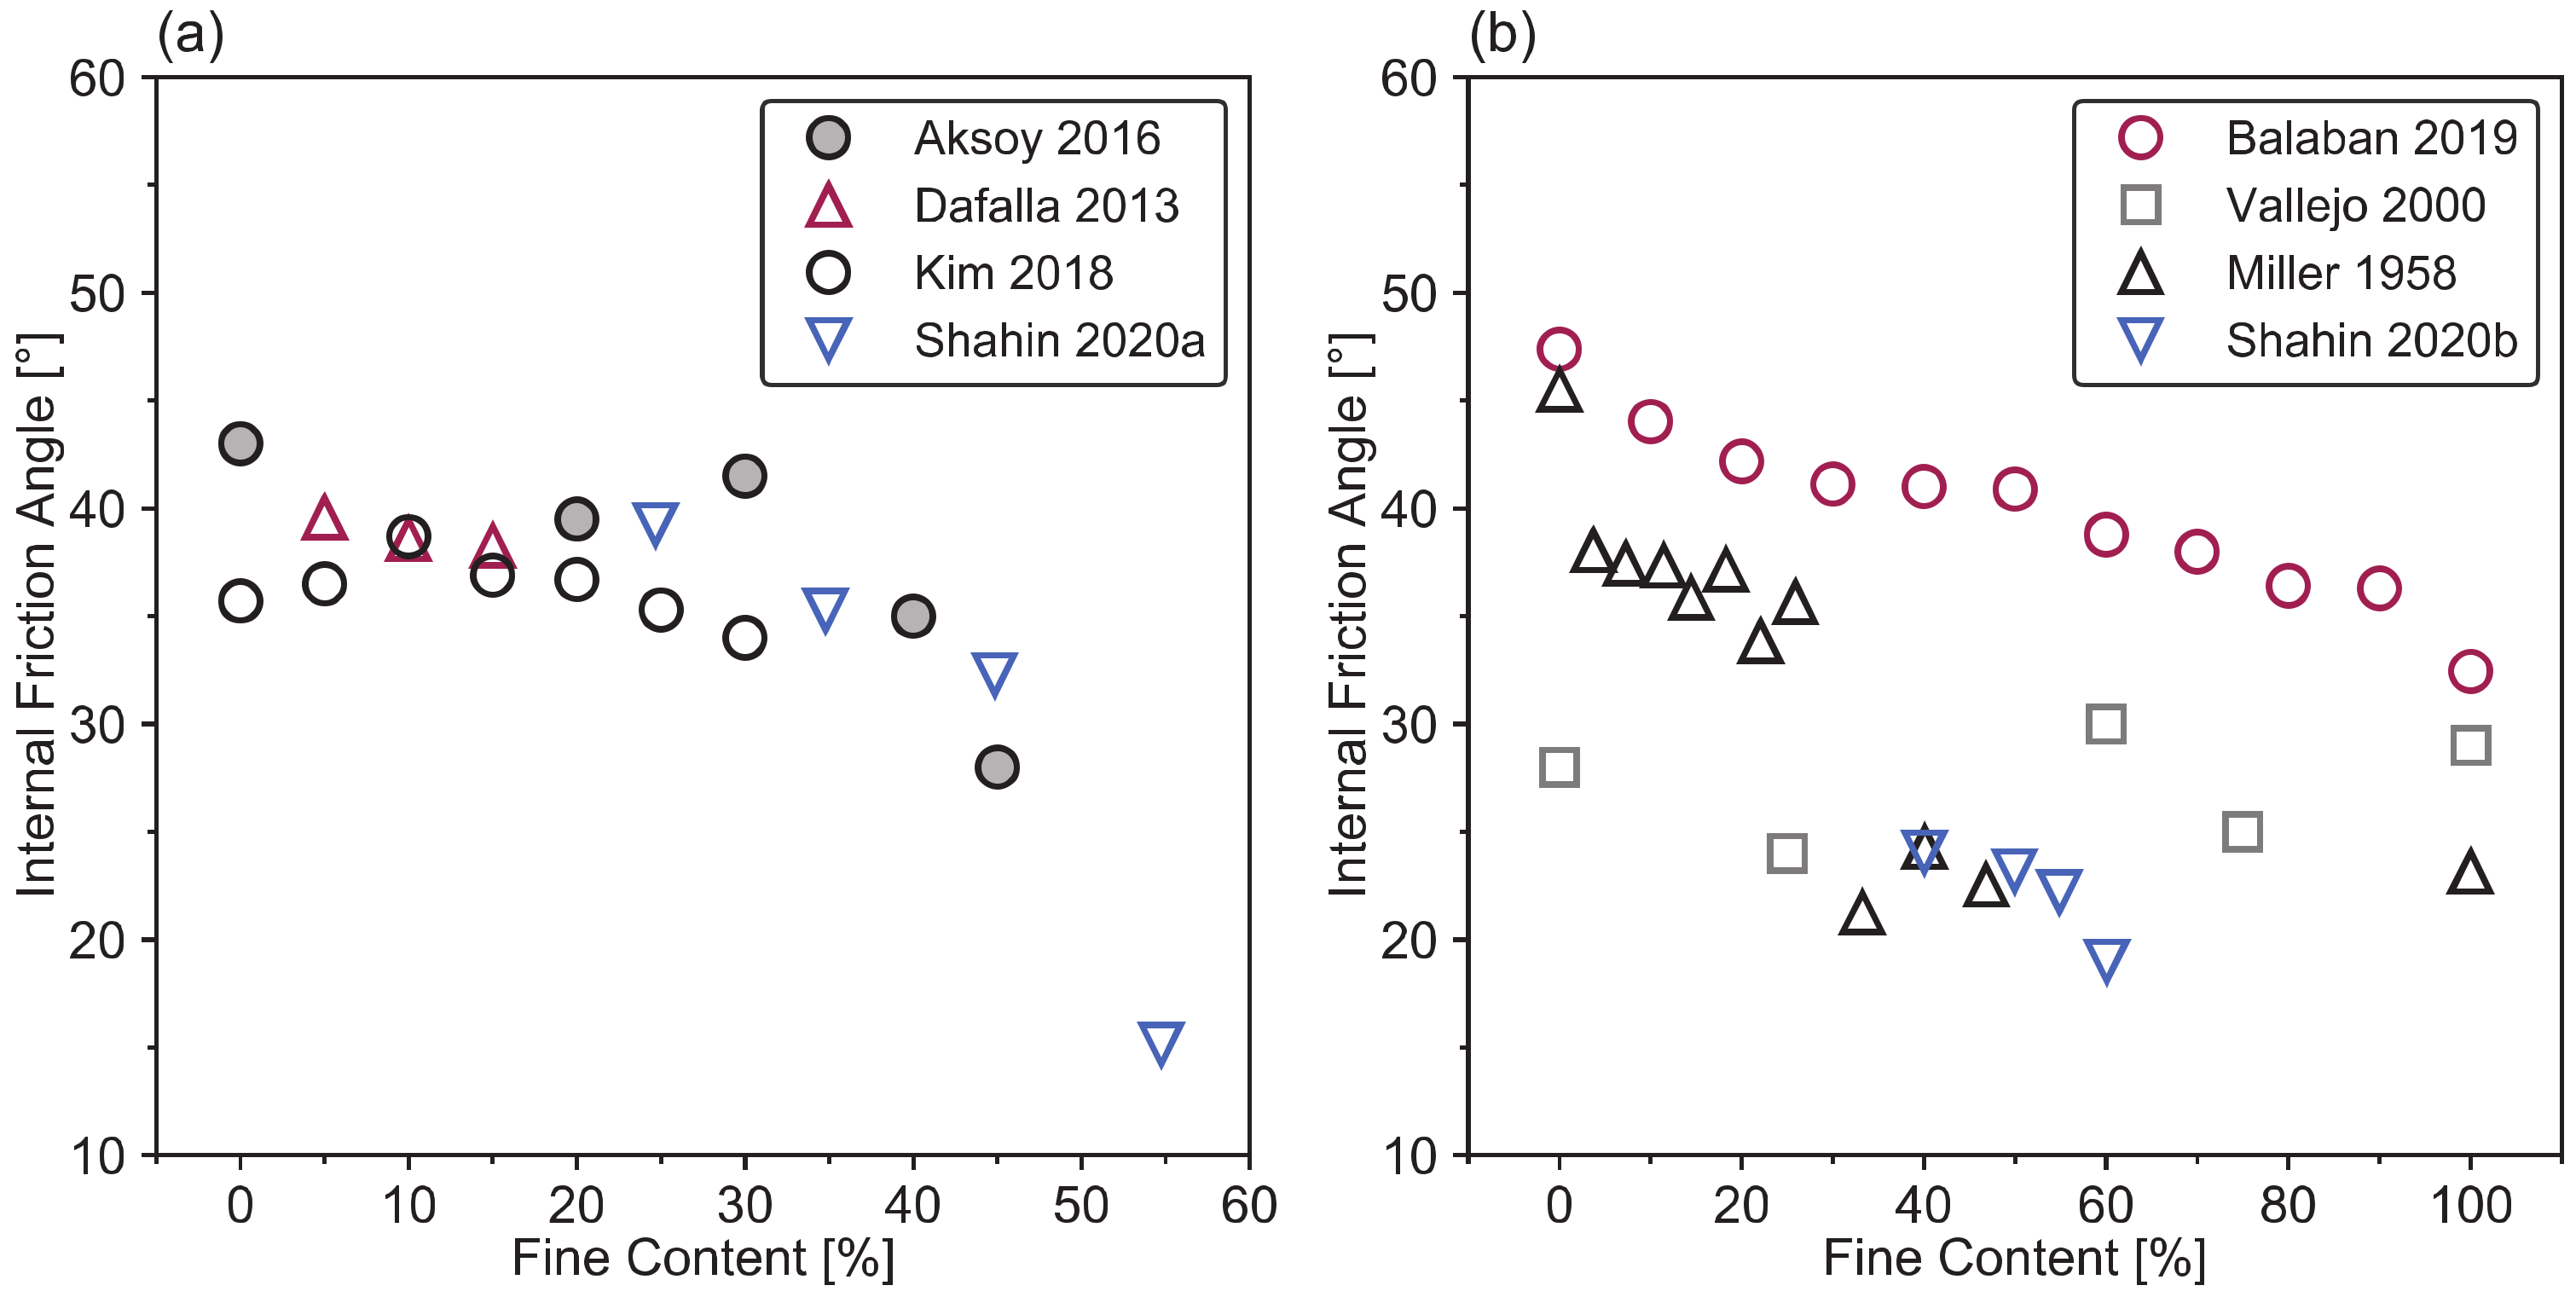
2.2.1. Fines Content

Previous works highlighted different factors that may control how the fines fraction influences the mechanical behavior of the mixed material and especially contribute to a better understanding of the influence of fines on the shear characteristics. Hence, the knowledge of the fines fraction behavior appears essential to understand the behavior of heterogeneous soils containing a significant clay fraction [47].
Figure 8 is employed to explain the particles’ packing and porosity of sand and clay mixtures under different clay fractions [42]. Figure 8a shows five grains of sands enclosing a void space and may clarify the changes in the mixture’s structure when the clay is added to the sand. In fact, according to several studies [31,33,40,42,45,76], when a small amount of clay is added to the sand, the clay particles and their enclosed void space (i.e., the bulk volume of the clay) will occupy a proportion of the sand void space (Figure 8b). If more clay is added to the sand, it goes to the state of Figure 8c and the void between sand grains is entirely occupied by the bulk volume of clay. At the clay fraction in Figure 8c, a condition with a minimum porosity is developed in the sand–clay mixture. After the minimum porosity condition is reached in the mixture (Figure 8c), there is no more space between the sand grains for adding more clay [42]. Thus, if more clay is added beyond the minimum porosity condition (Figure 8d), the only way to contain the volume of the additional clay in the mixture is that the sand grains become separated and make more space for the increased clay. In this case, the sand grains are floating in the clay and the clay becomes the dominant component in the binary mixture (Figure 8e).
Investigations on this type of behavior are looking for the percentages of clay (or sand) at which there is a change in the mixture’s structure (i.e., the threshold clay content). In Table 1, a summary of previous results [31,33,42,45,50,75,76,77,78,79,80,81] is collected: it shows the percentages of sand or clay in the mixture above or under which the mixture’s behavior is controlled by the sand or the clay or both.
Consequently, laboratory tests on these types of mixtures indicate that their shear strength depends upon the relative concentrations of the large particles and the clay. If the weight percentage of the clay material in the sand–clay mixture is less than 25% (see Table 1), the shear strength of the mixture is that of the granular material alone. When the weight fraction of clay in these mixtures is higher than around 41% (Table 1), the shear strength of the mixtures is that of the clay. In this case the shear strength of the mixture is equal to that of the clay without granular material. For the case of the percentage of the clay material in the mixture being between these values, the shear strength is partially controlled by both phases. It increases gradually from the shear strength provided by the pure sand to that offered by the pure clay (Table 1).
Thus, a transition zone exists between the sand-controlled and the clay-controlled sand–clay mixture (Table 1). The transitional fines content, named FCt, as mentioned in Section 2.1.2, represents a changing point for the behavior of the sand–clay mixture from the sand-controlled to the transition zone or the clay-controlled phase.

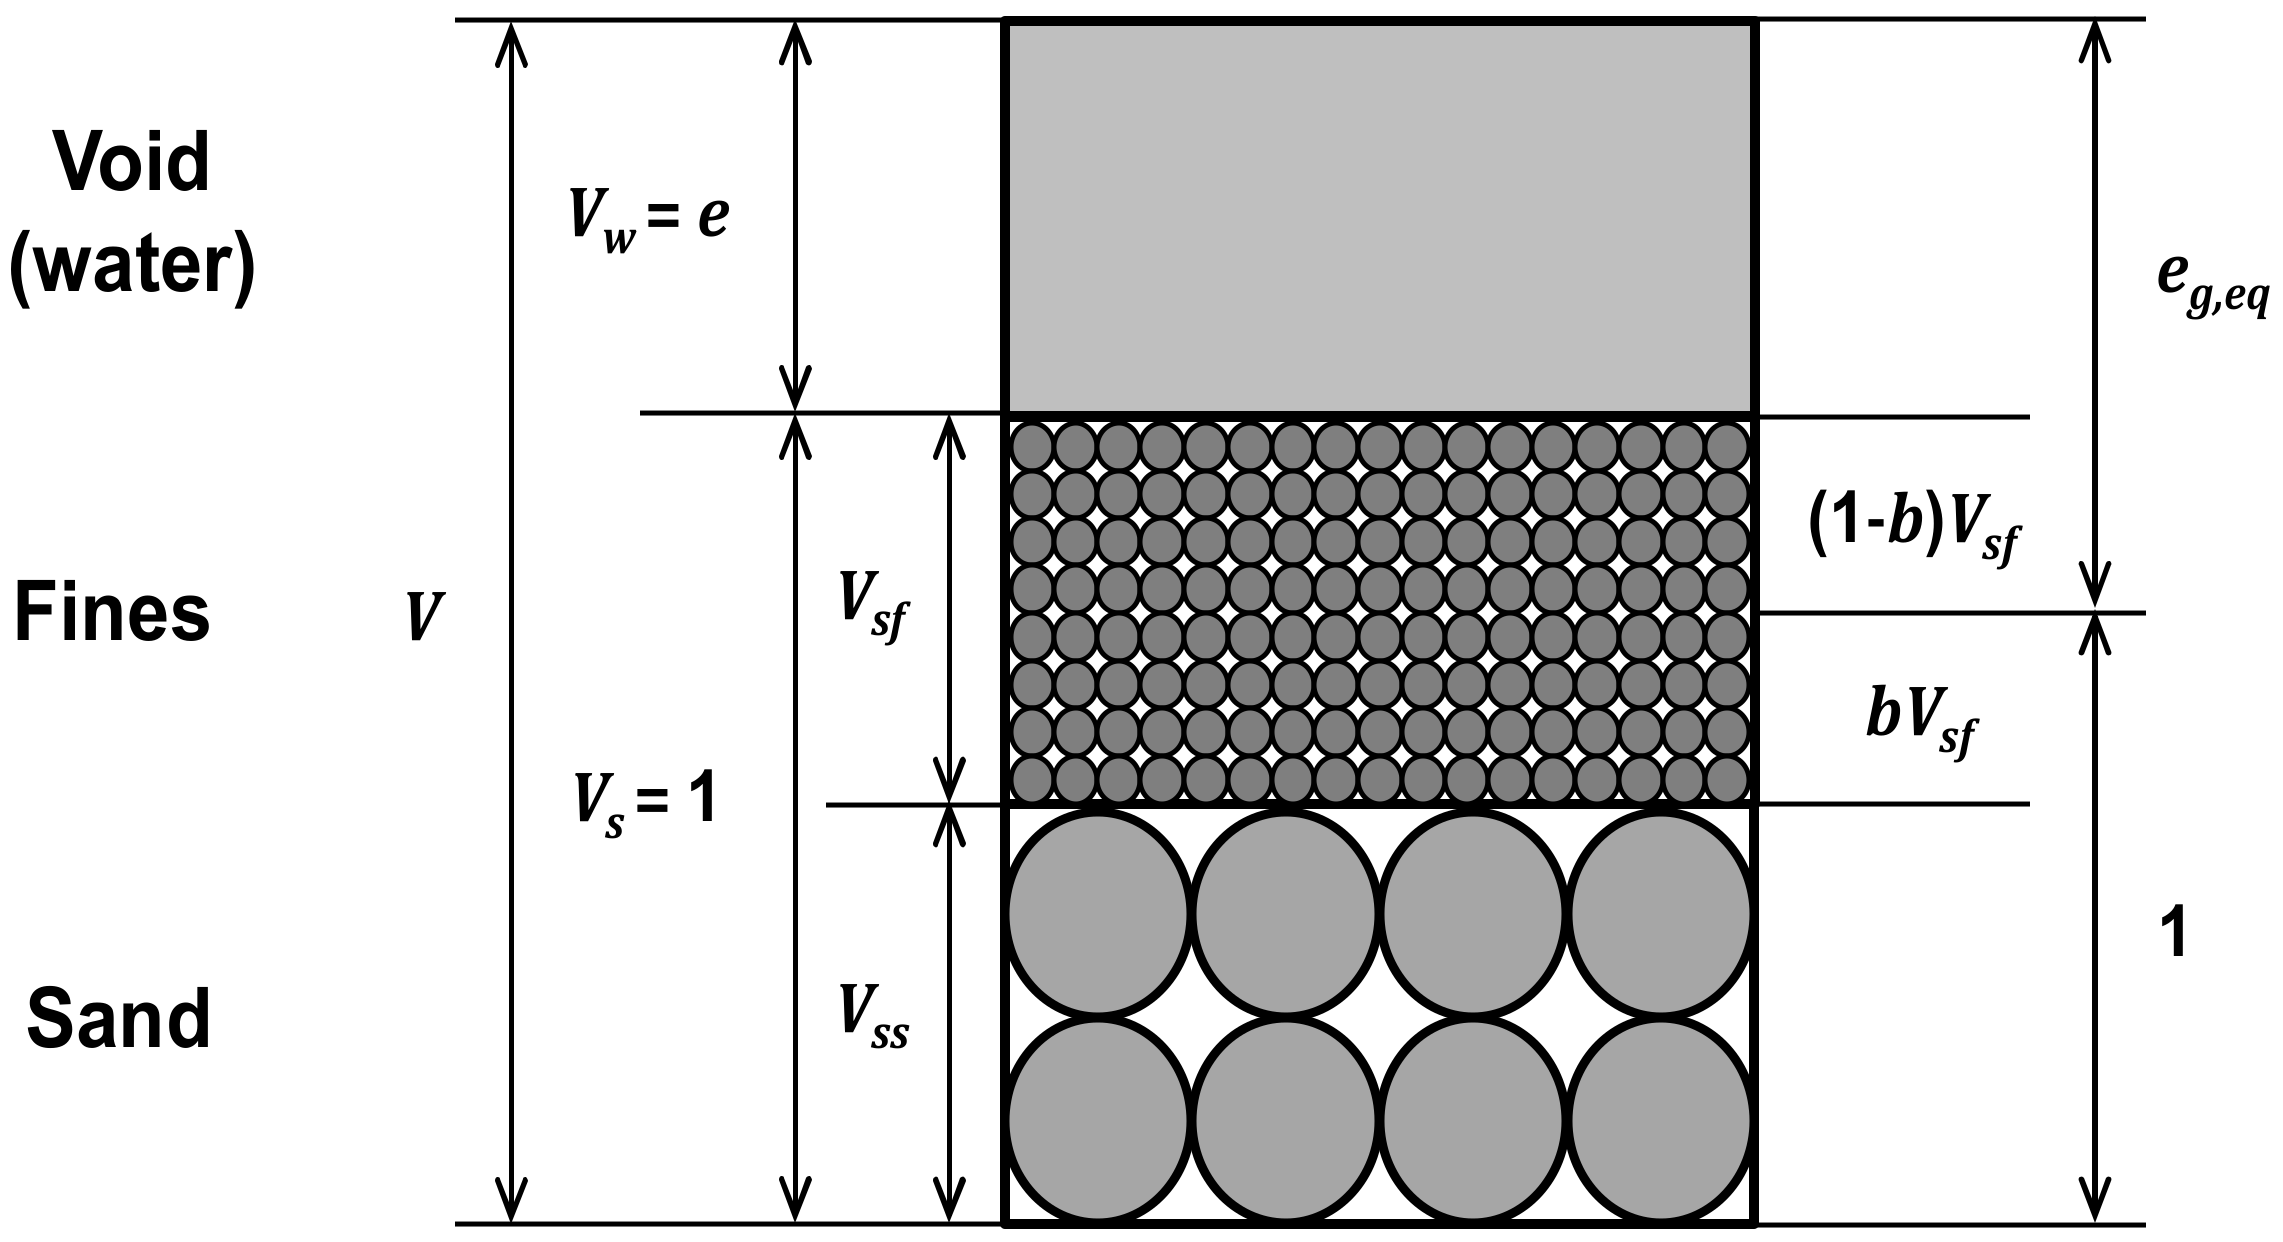
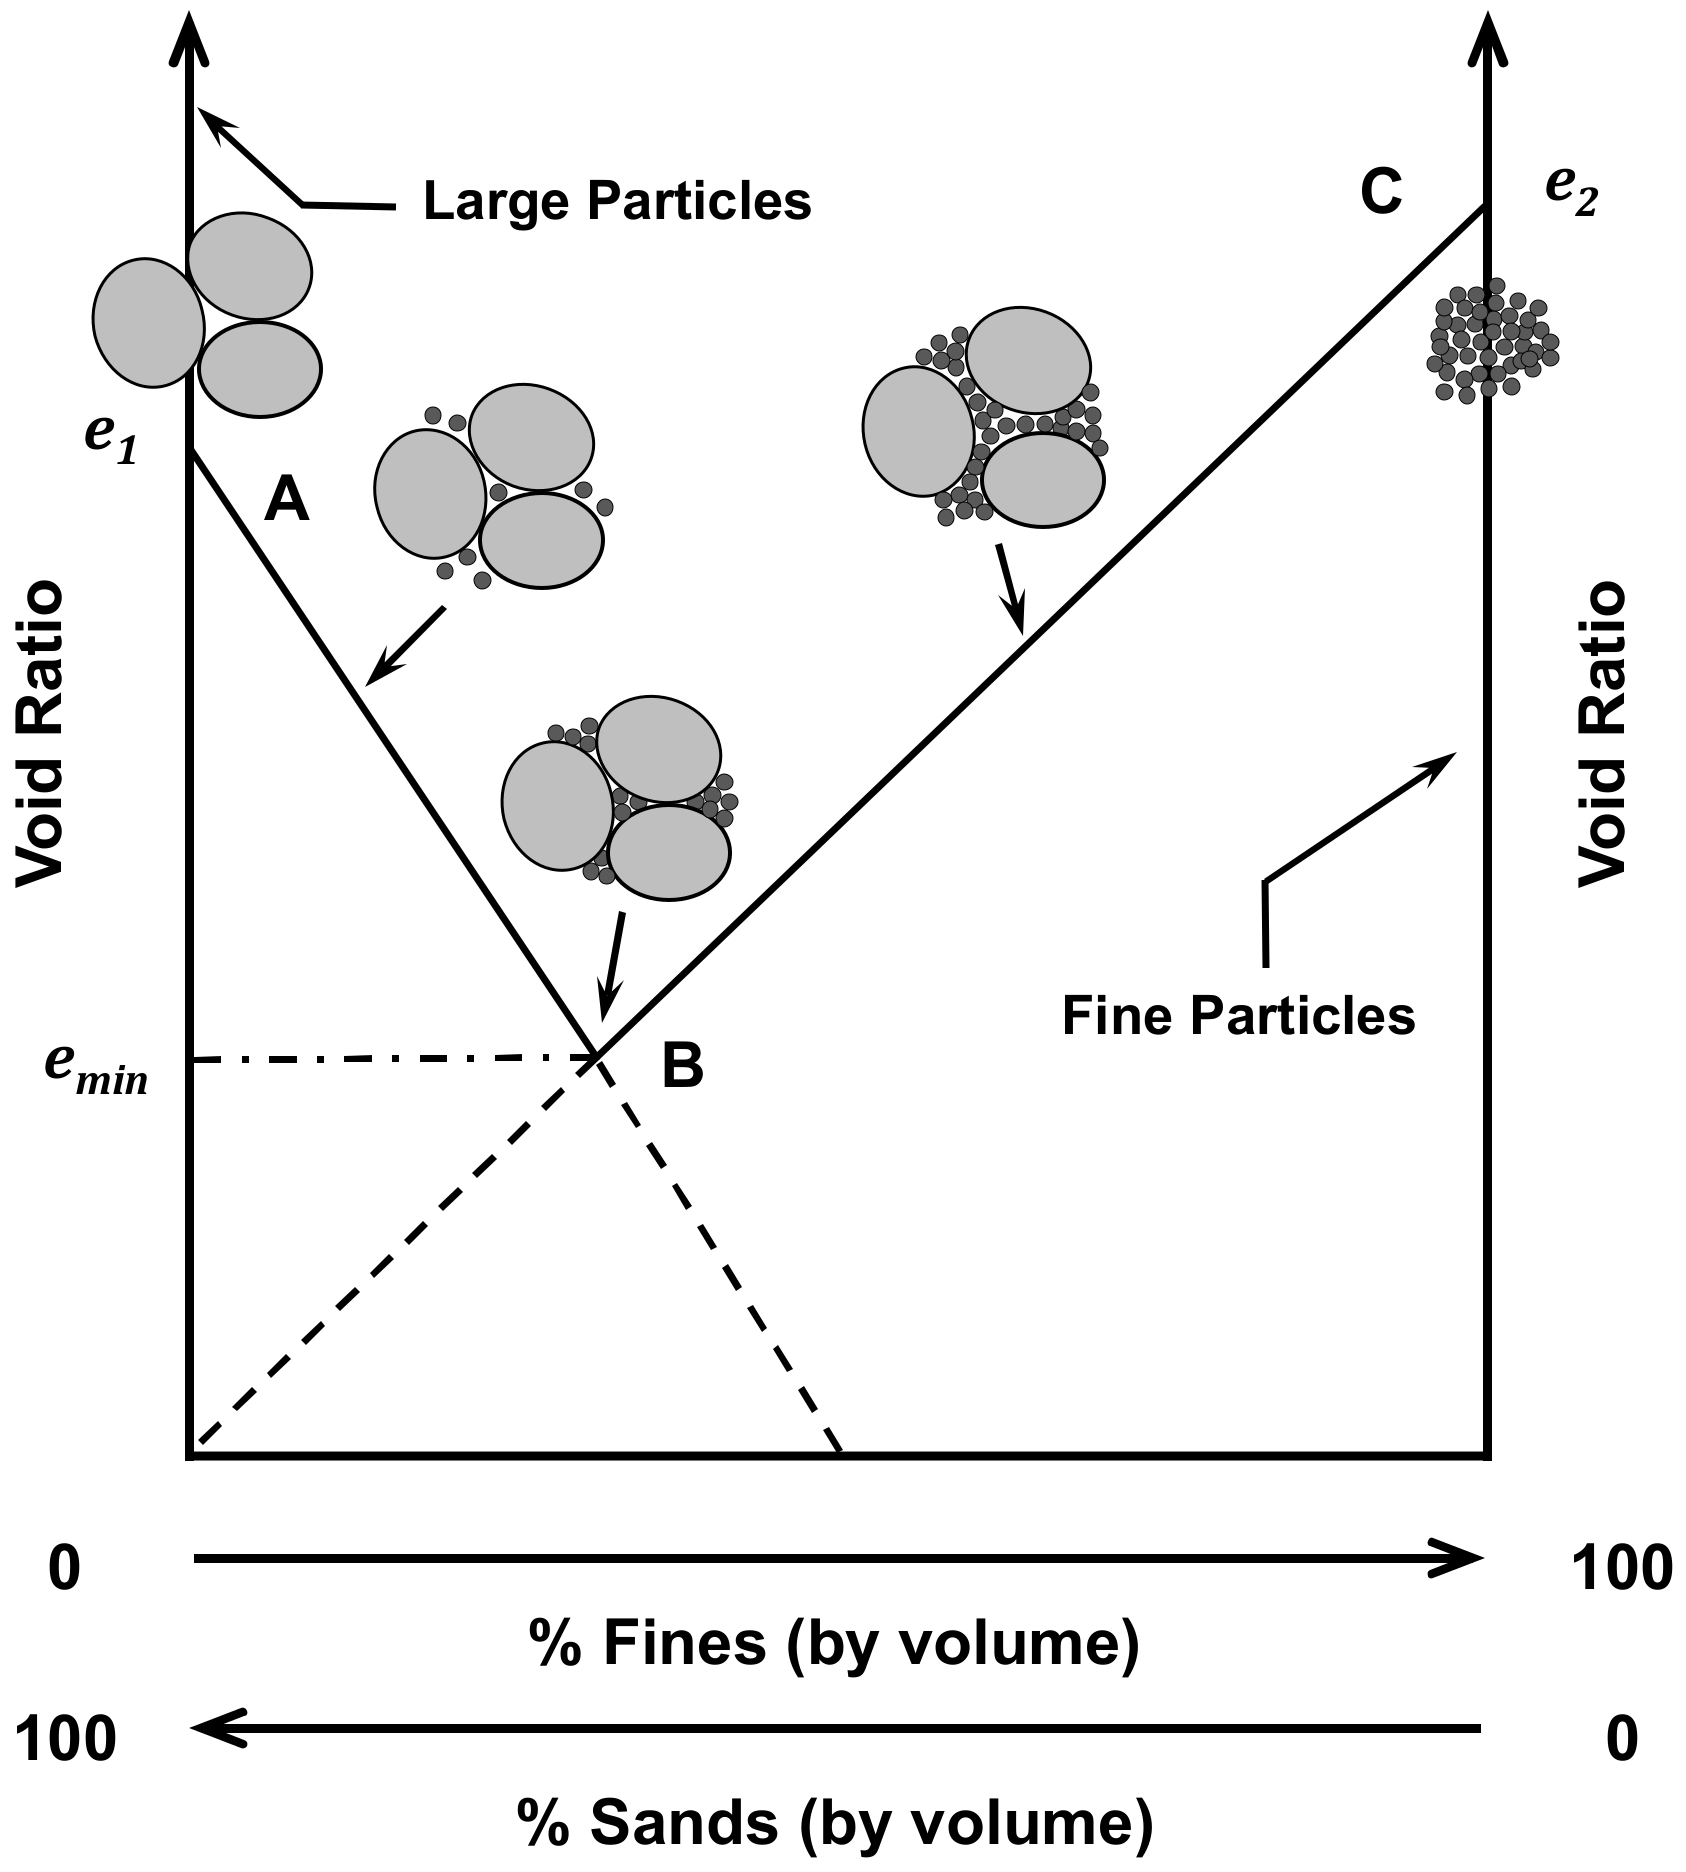
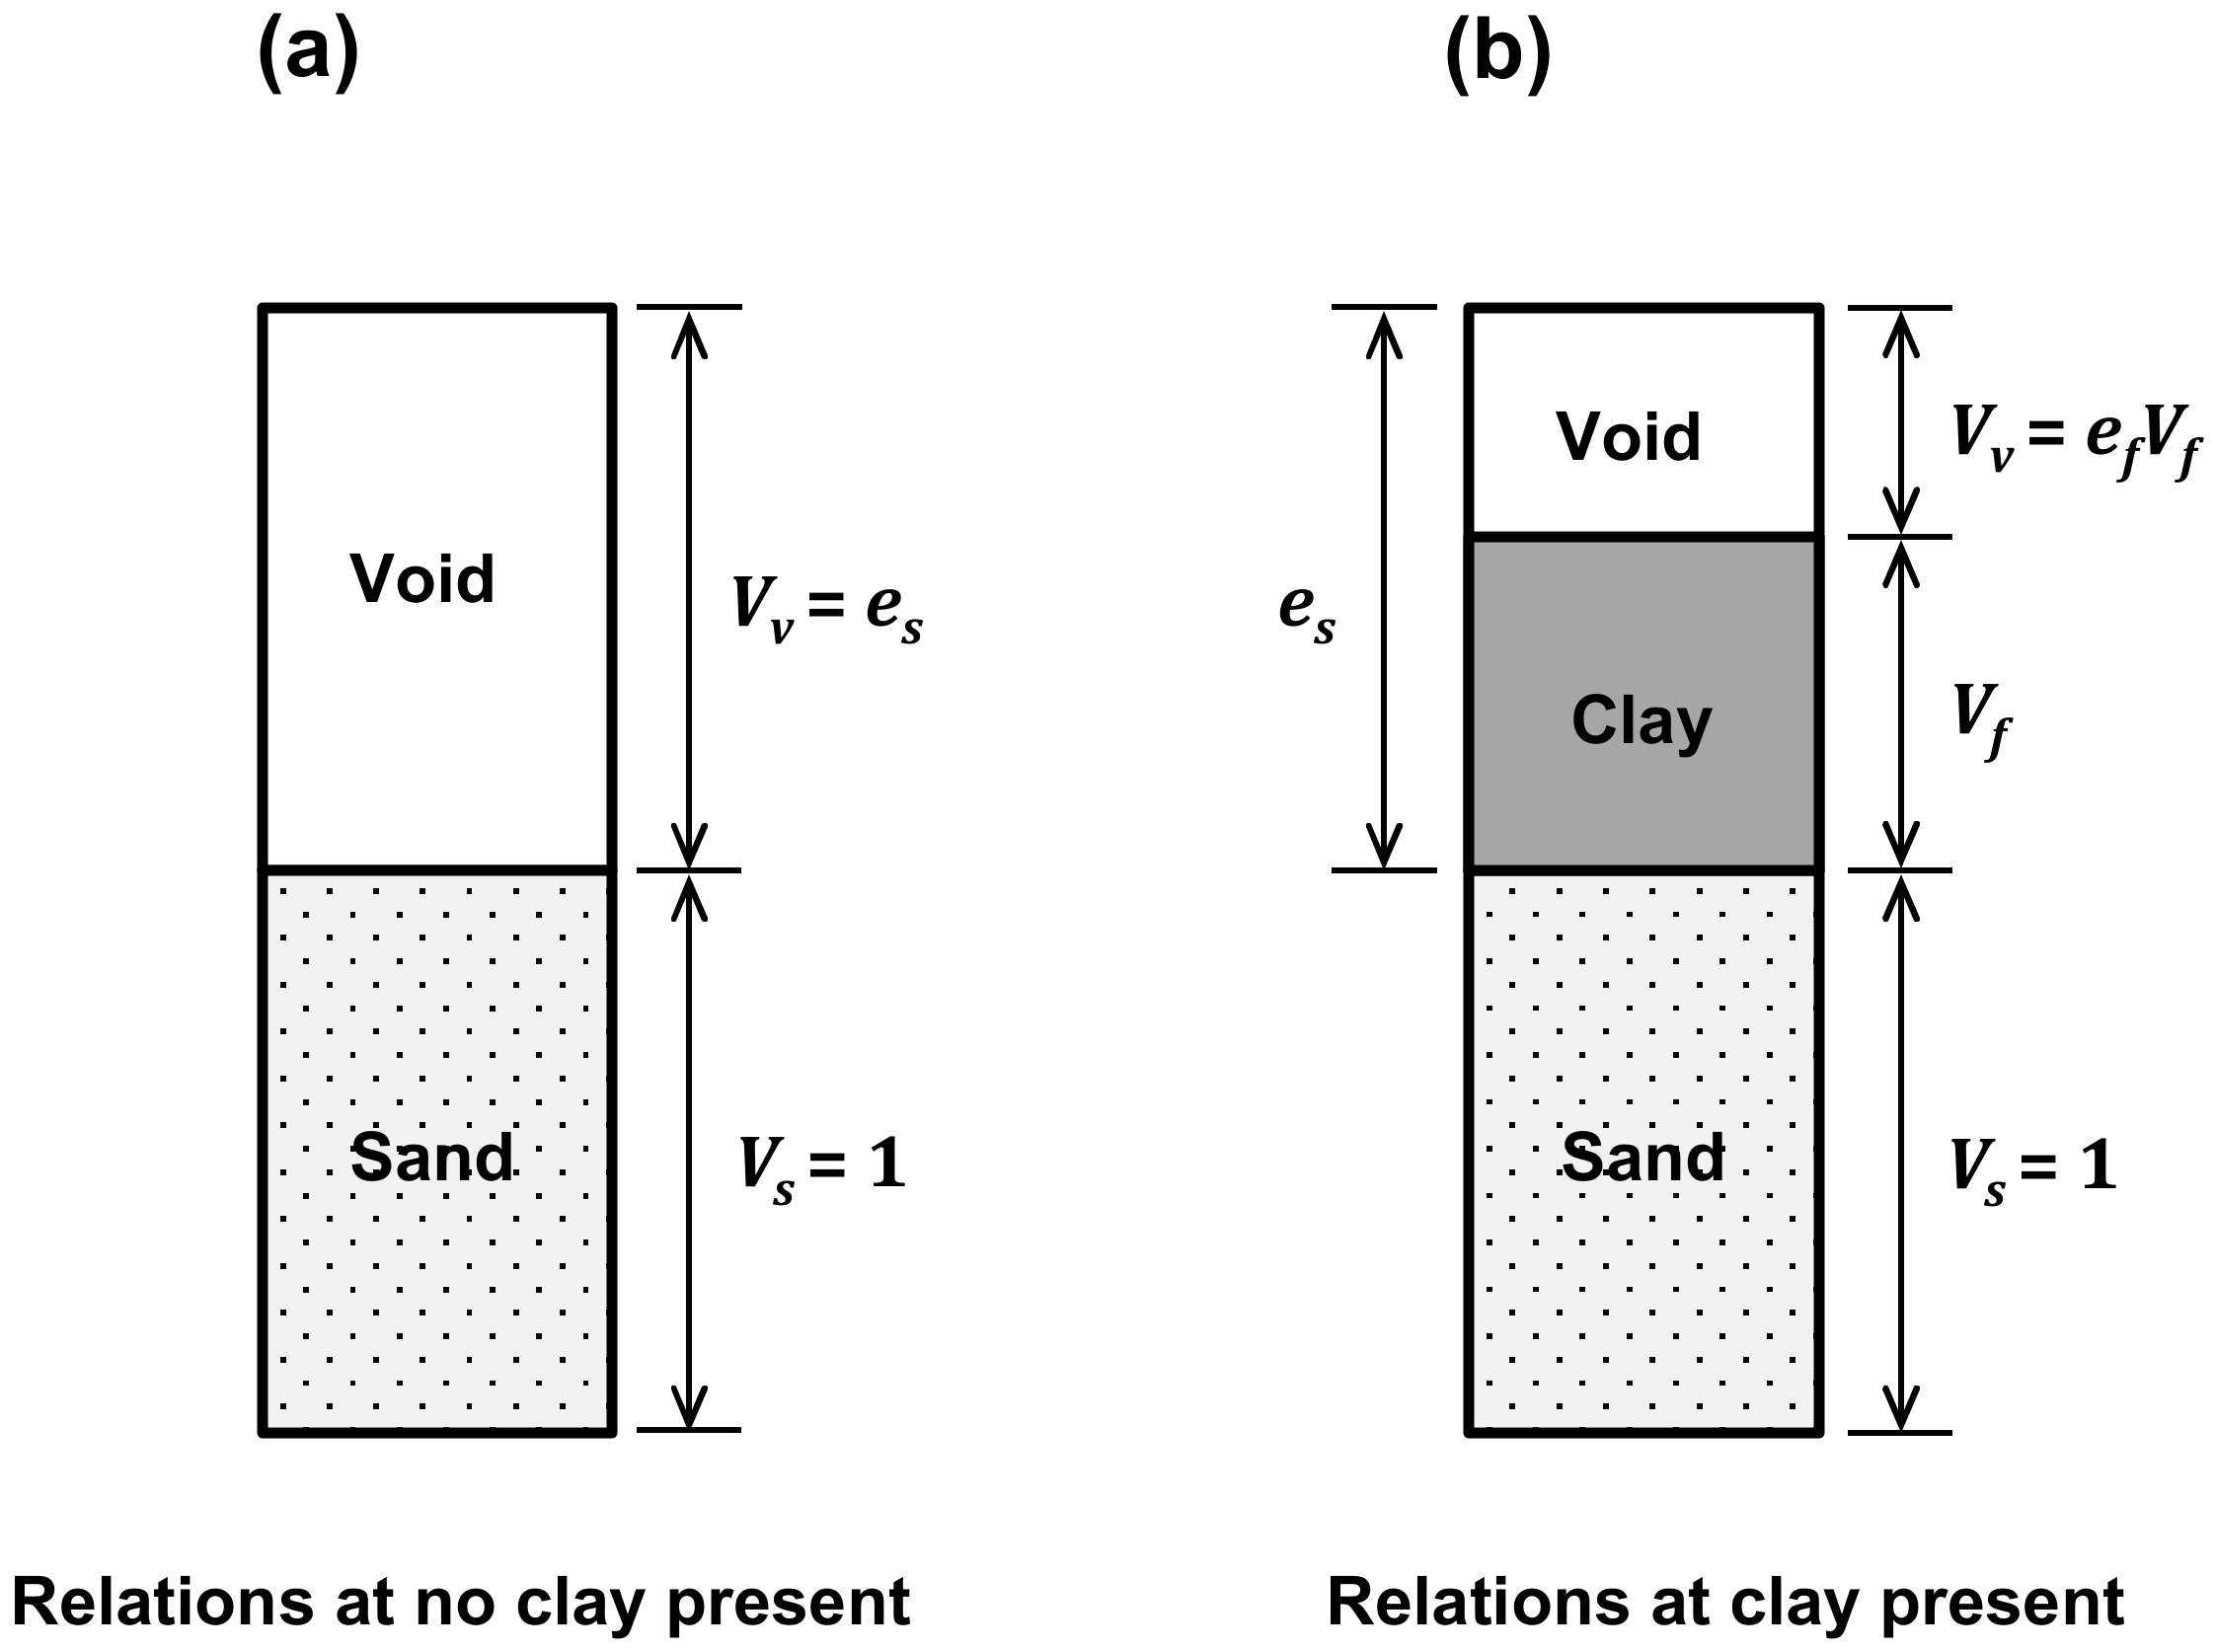
2.2.2. Intergranular and Interfine Void Ratios

The intergranular void ratio [32,50,75,82,83] in the sand–fines mixture is the same concept as granular void ratio [33,45] or skeleton void ratio [84,85,86], according to Monkul and Ozden [50]. This notion was commonly mentioned and adopted in previous research concerning the mechanical response of granular soils containing fines [40,50,71,83,87]. The intergranular void ratio eg is a measure of void plus fines’ volume (intergranular void) w.r.t. the volume of the granular phase (sand) [30,32,50,71]:
e g = V v + V f V s
Vv is the volume of voids; Vf is the volume of fines; and Vs is the volume of the sand. Hence, the Vv + Vf is the volume of the intergranular void space. The intergranular void ratio provides an indicator of the influence of the granular phase [30,33,45,56]. It plays a role in the compressional stress–strain characteristics of soils consisting of fine and coarse grains of different percentages [50,75,83].
Indeed, at high fines content, the sand grains only provide a secondary contribution to the soil’s behavior, so that in this case the sand can be ignored in the force chain and the state of the mixture should depend on the stress and the interfine void ratio ef [32,71,88]. It can be defined as the ratio of the volume of the void to the volume of fines (see Equation (2)):
e f = V v V f
The use of eg and ef can be explained as follows: At low fines content, the sand grains are in contact with each other and form the major skeleton of the mixture [32,89]. Thus, at the stage of low fines content, the fines can be ignored in the force chain and the soil mechanical behavior should depend on the stress and the intergranular void ratio eg, whereas at high clay content, the ef should be employed to evaluate the mechanical response of sand–clay mixture. Furthermore, the notion of eg can be used for determining the transitional fines content.
Yang et al. [86] suggested that the intergranular void ratio cannot provide a universal meaning to characterize the stress–strain behavior of sand–fines mixture soils because there is a lack of mechanisms to account for the complicated intergranular contacts. They pointed out that the global void ratio is still helpful to explain the response of sand–fines mixture in the critical state [86].
The minimum porosity (nmin) of mixtures that should occur at the minimum global void ratio (emin) of the mixtures was utilized to classify the theoretical boundary between a sand-controlled and a fines-controlled binary granular mixture [42,74]. However, it is not always applicable and accurate to just use the minimum porosity (nmin) or the global void ratio (e) to analyze the mechanical behavior of sand–clay mixture, since the clay located at the void space between sand grains still contributes to the force transfer. Moreover, an experimental emin may appear even at the state of eg > emax-sand. However, at this state, the clay already controls the behavior of sand–clay mixture because nearly all the sandy grains are already separated by clay and force transfer burdened by sand grains has become relatively weak [50,75]. To avoid the limitations of the global void ratio (or porosity) and intergranular void ratio, it is better to use both the two parameters to analyze the mechanical response of sand–clay mixtures.
Intergranular void ratio values can be calculated based on Equation (1). Performing one-dimensional consolidation tests, researchers suggested different equations to evaluate intergranular and interfine void ratios. For example, in Zuo and Baudet [88], Equation (1) can be rewritten in terms of the specific gravities of the soils, the fines content, and the overall void ratio of sand–fines mixture in Equation (3):
e g = e G f G f f c + G s f c + G s f c G f 1 f c
in which e is the global void ratio of the mixture soil, fc is the fines content (using a decimal), and Gs and Gf are the specific gravities of the sand and the fines, respectively. For the same purpose, they proposed that Equation (2) can be rewritten as Equation (4) to obtain the interfine void ratio:
e f = e G f G f f c + G s f c G s f c
Monkul and Ozden [50] and Cabalar and Hasan [65] proposed a method to calculate the intergranular void ratio using specific gravities and clay fraction by using the following formula:
e g = e + G F C G f 100 G G s 1 F C 100
where FC is fines contents and G is the specific gravity of the mixture soil, which can be obtained by calculating the weighted average value of the specific gravities of sand and fines.
According to Thevanayagam et al. [32] and Kim et al. [27], for the intergranular void ratio, fines are treated as a special kind of void without considering their types and characteristics; hence, as a result, the strength is underestimated. For this reason, they introduced the concept of equivalent intergranular void ratio (eg,eq) for higher fines content, defined as [32]:
e g , e q = e + 1 b F C 100 1 1 b F C 100
and as [27]:
e g , e q = V w + 1 b V s f V s s + b V s f = V w + 1 b V s f V s 1 b V s f
where b denotes the portion of the fine grains that contributes to the active intergrain contacts. The contribution factor b has a value between 0 and 1 typically. However, theories about how to decide its value in practice are not unified so far.
The eg,eq in Equation (7) can be explained through a phase diagram (Figure 9). When the soil is fully saturated, it is sorted into three parts: solid particles (sand), fines, and void (water).
Thevanayagam [71] and Thevanayagam et al. [32] considered that using intergranular void ratio is limited to the soils with fines content below the FCt. At higher fines content, the fines begin to participate in the force chain structure; therefore, they proposed an equivalent granular state parameter that can be used for evaluating the equivalent granular relative density of the sand–fines mixtures. The equivalent granular relative density Drge is defined by using the equivalent granular void ratio (eg,eq) to replace the global void ratio (e):
D r g e = e max H e g , e q e max H e min H × 100 %
where emaxH and eminH are the maximum and minimum void ratios of the host sand.

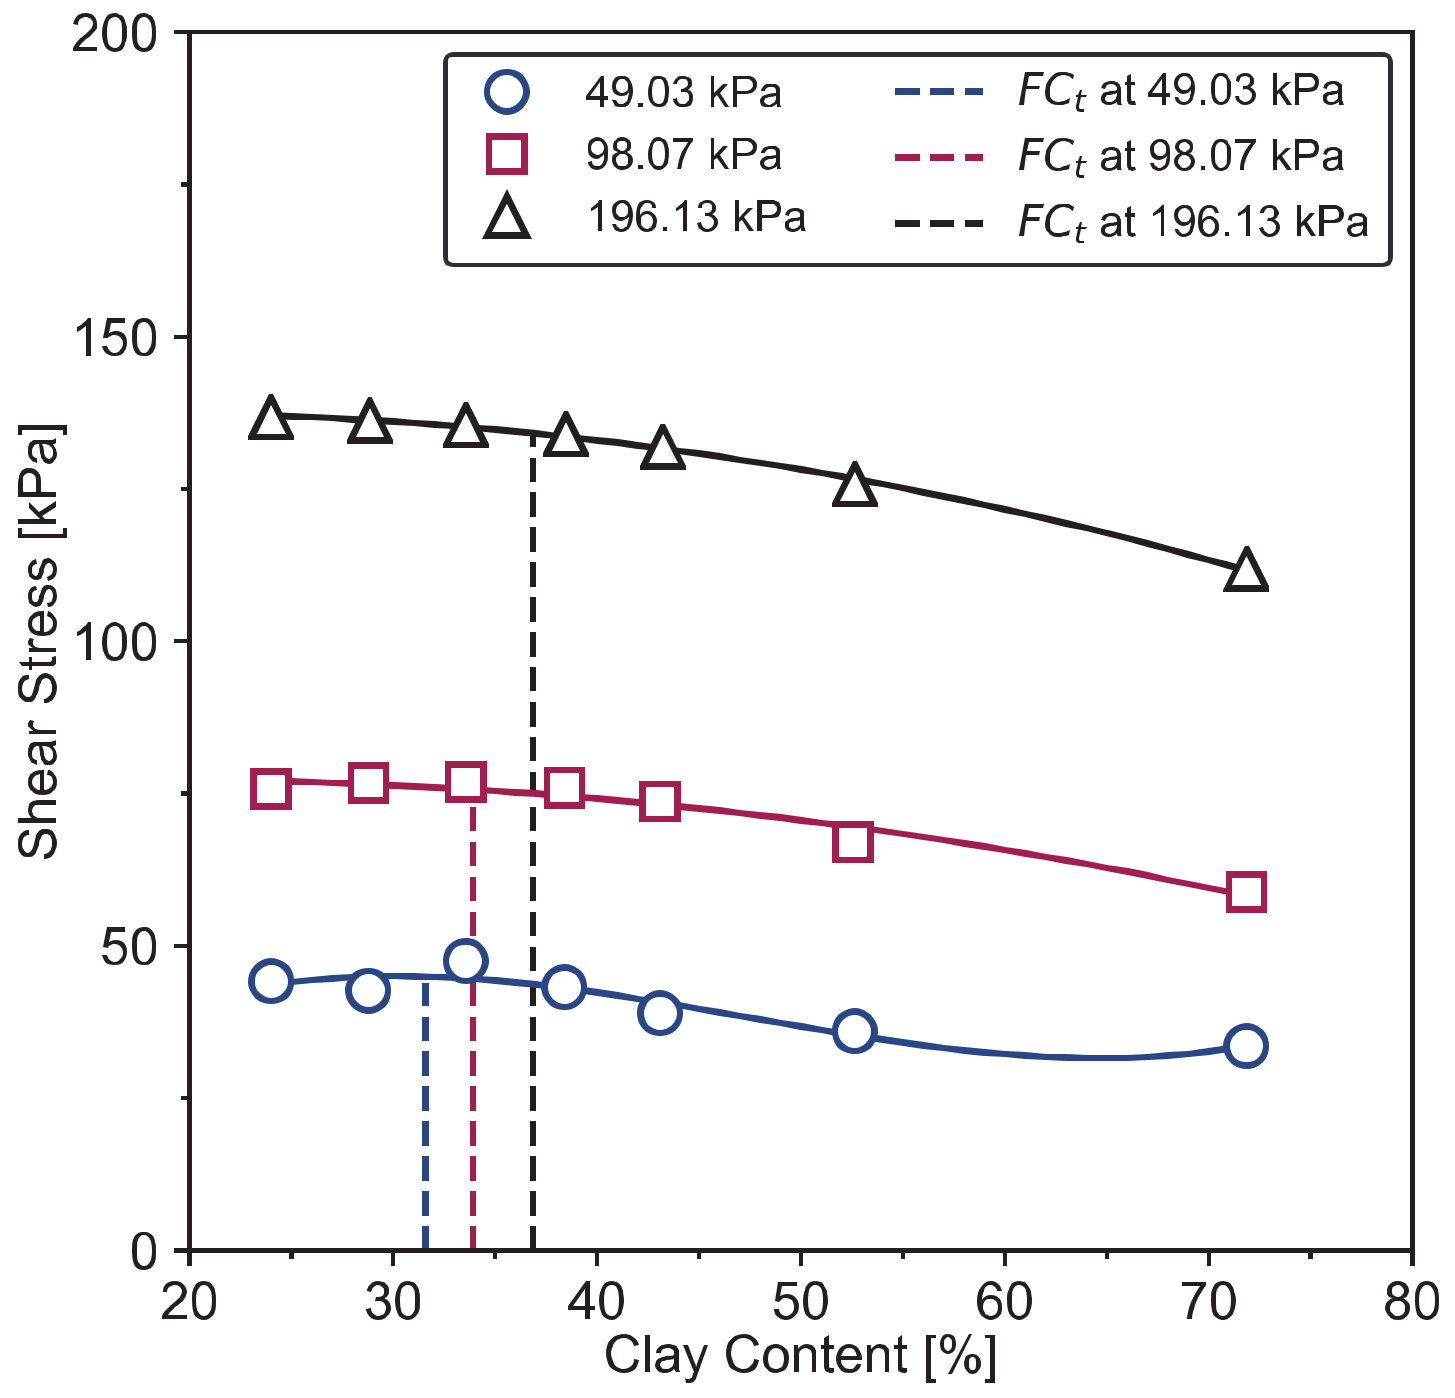
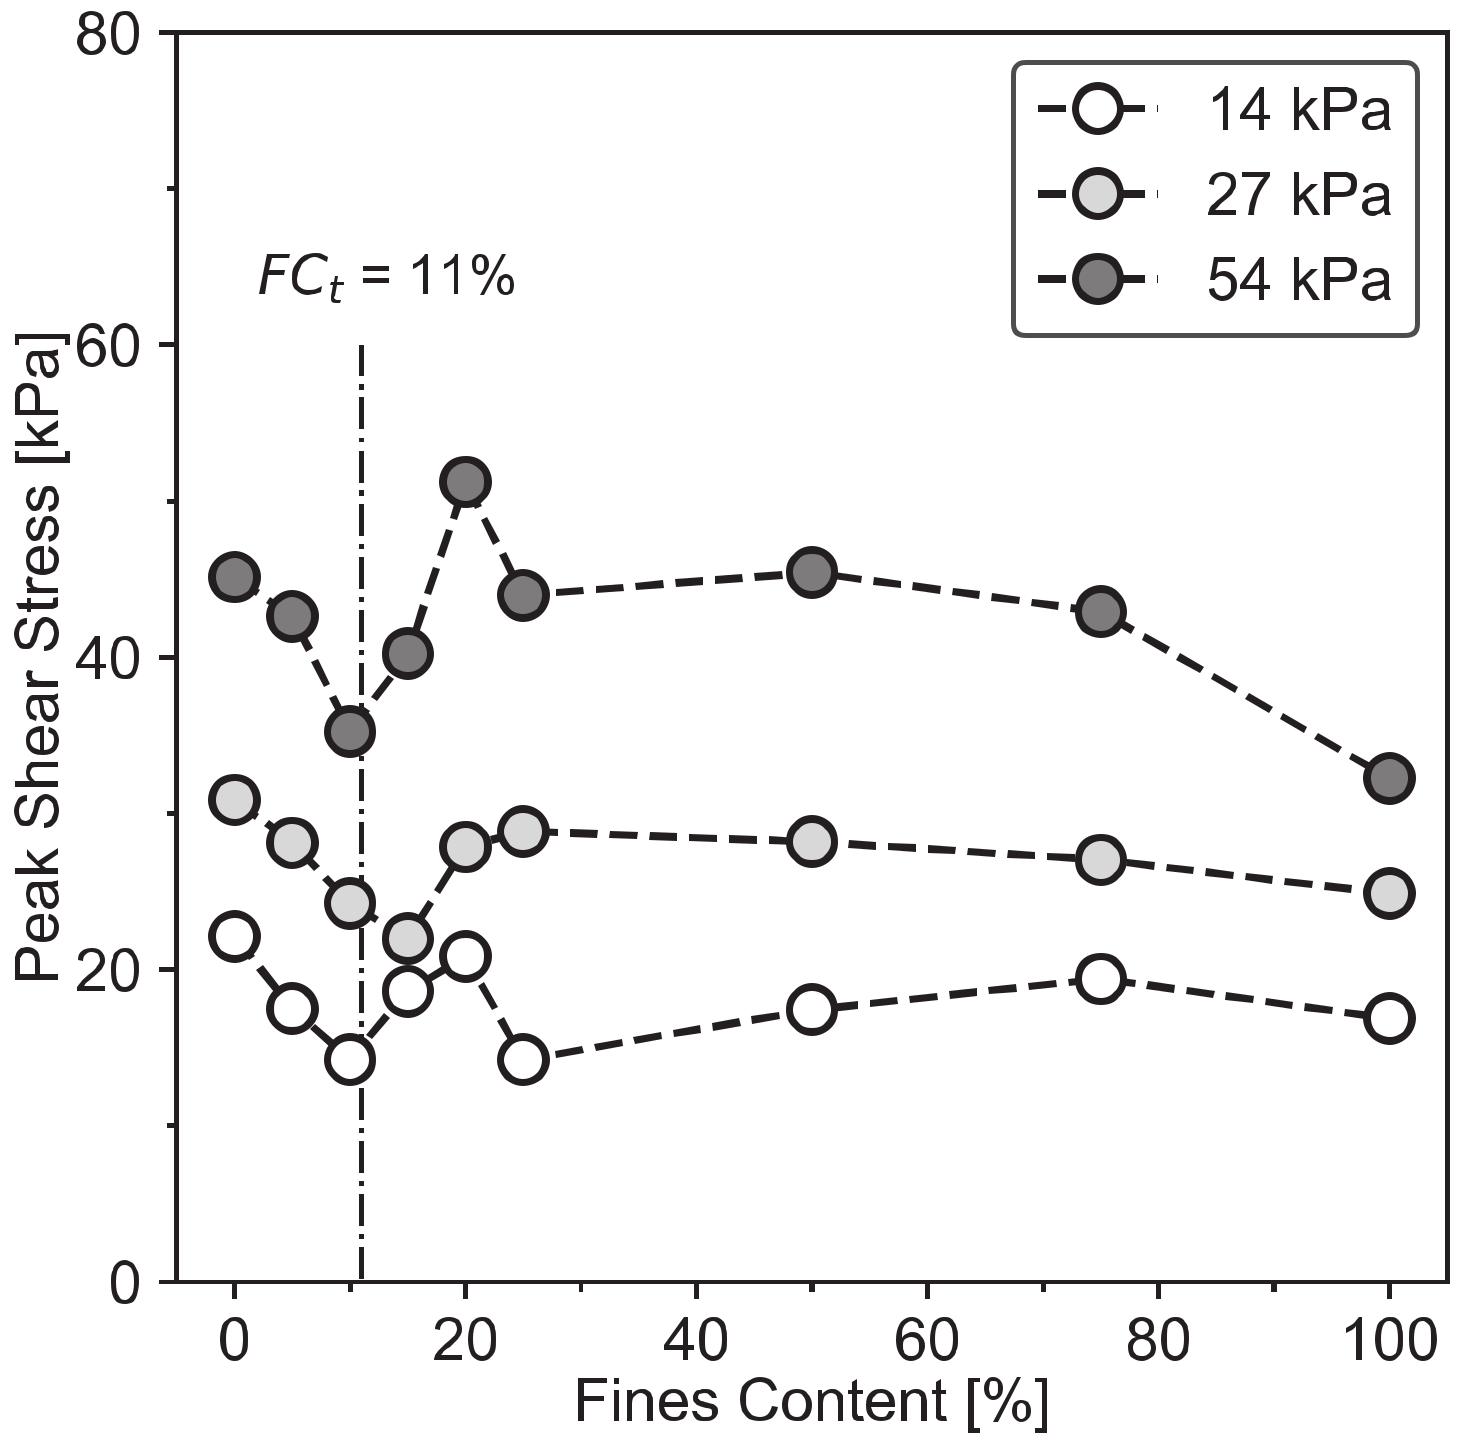
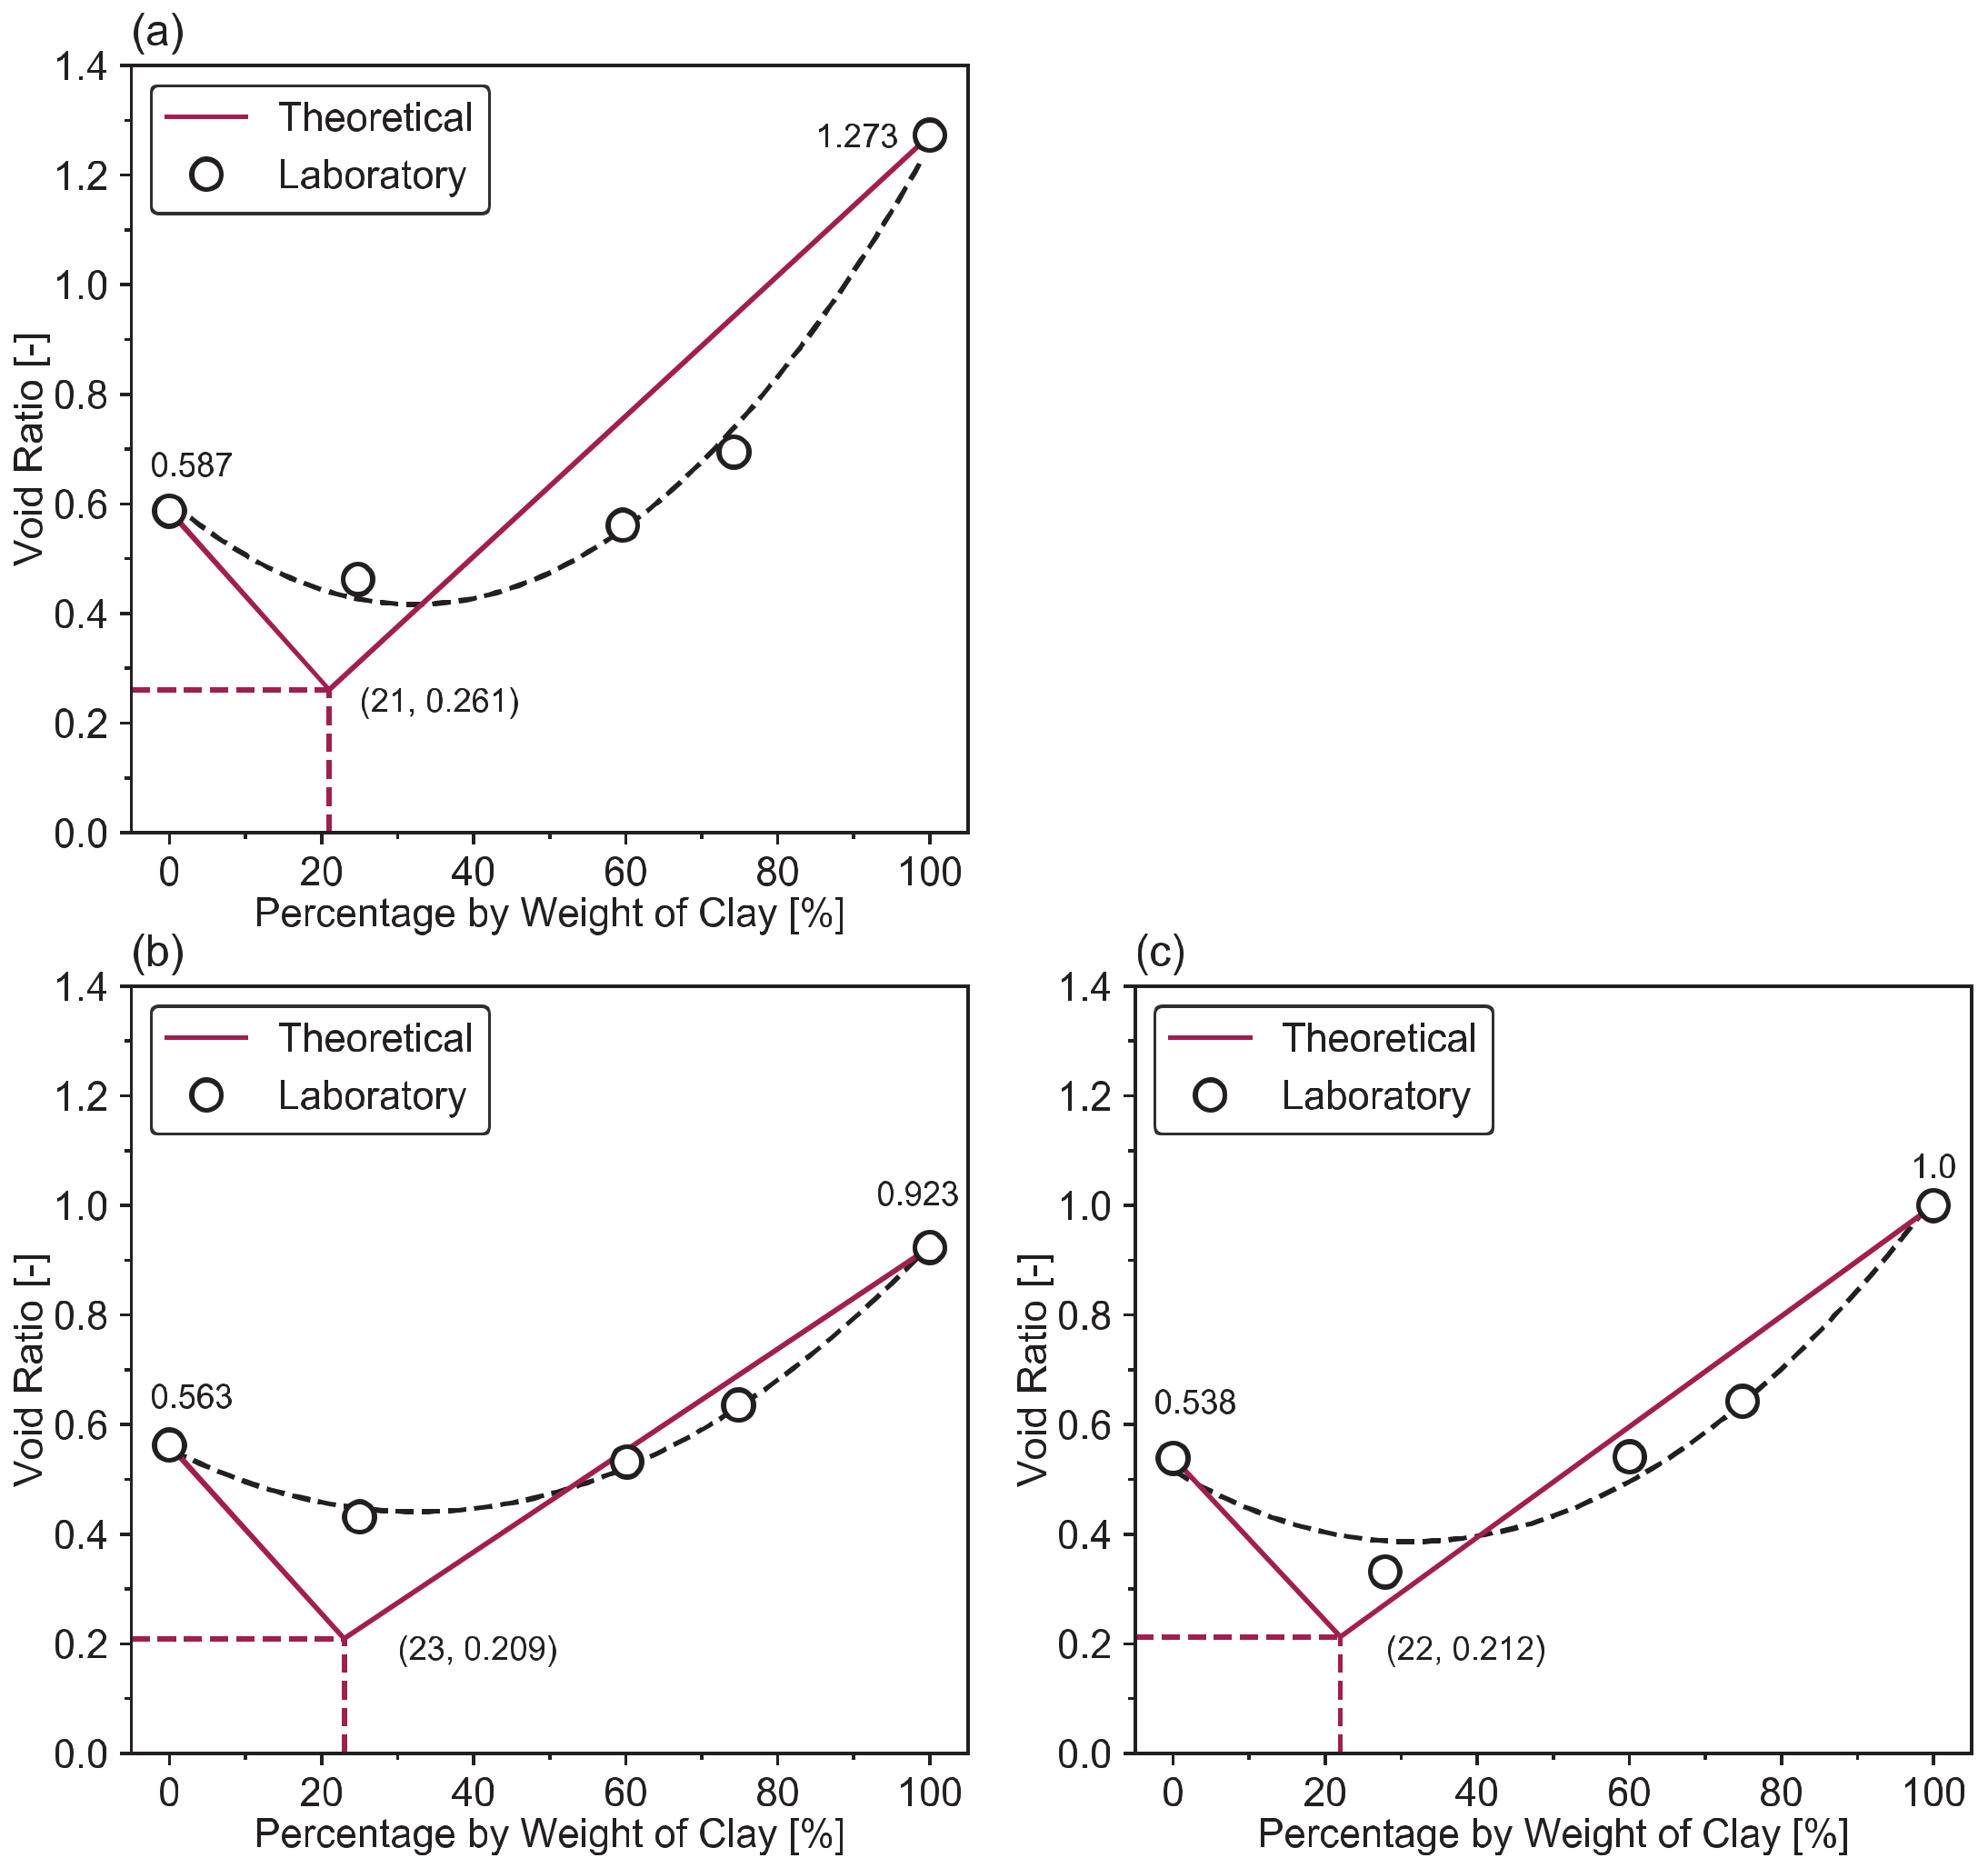
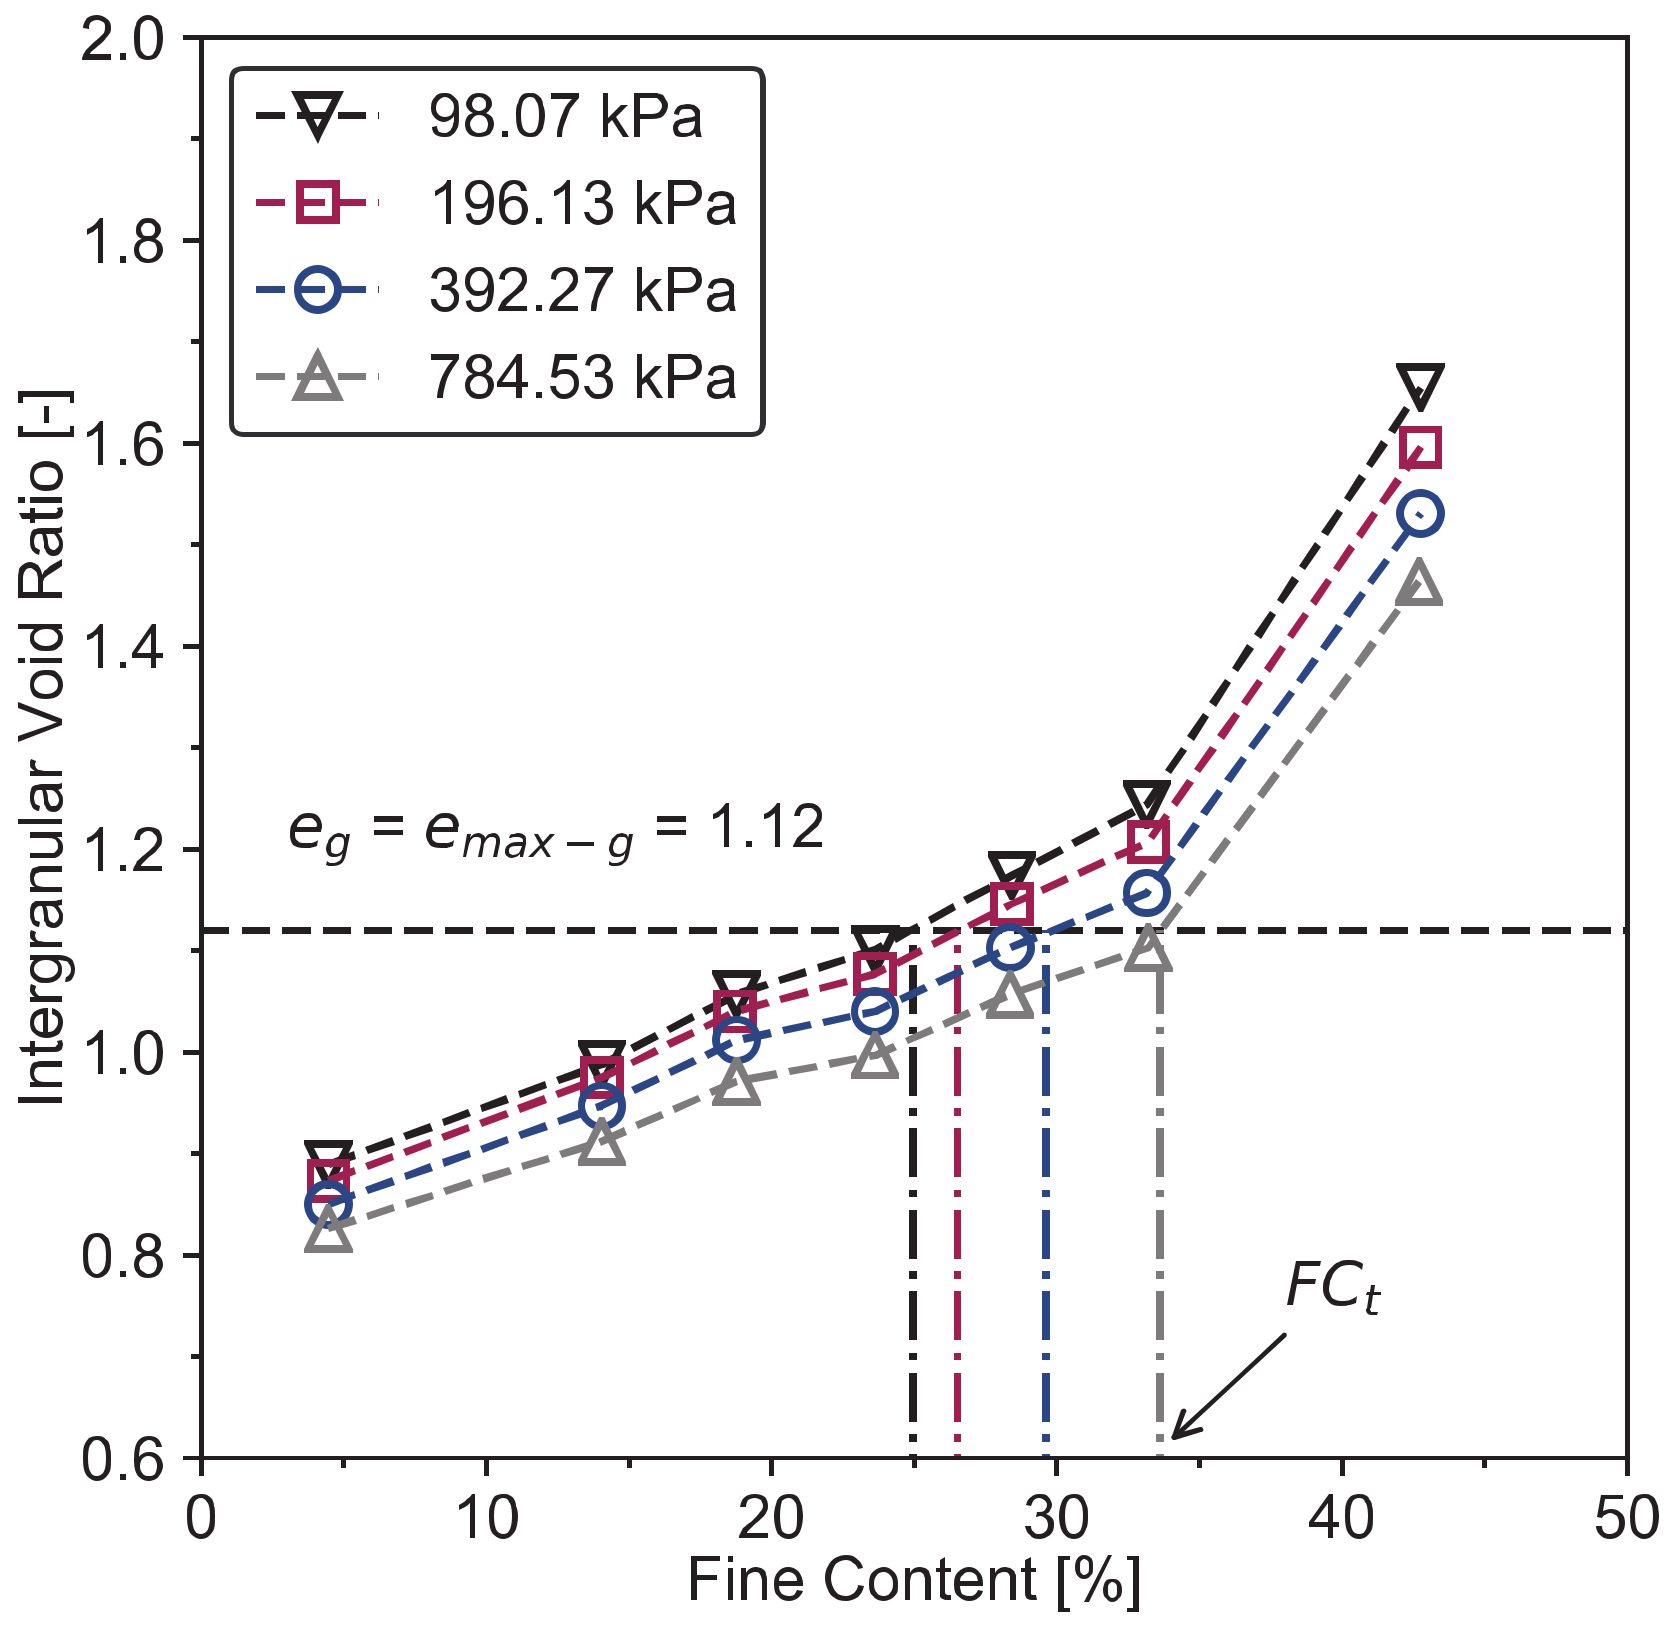
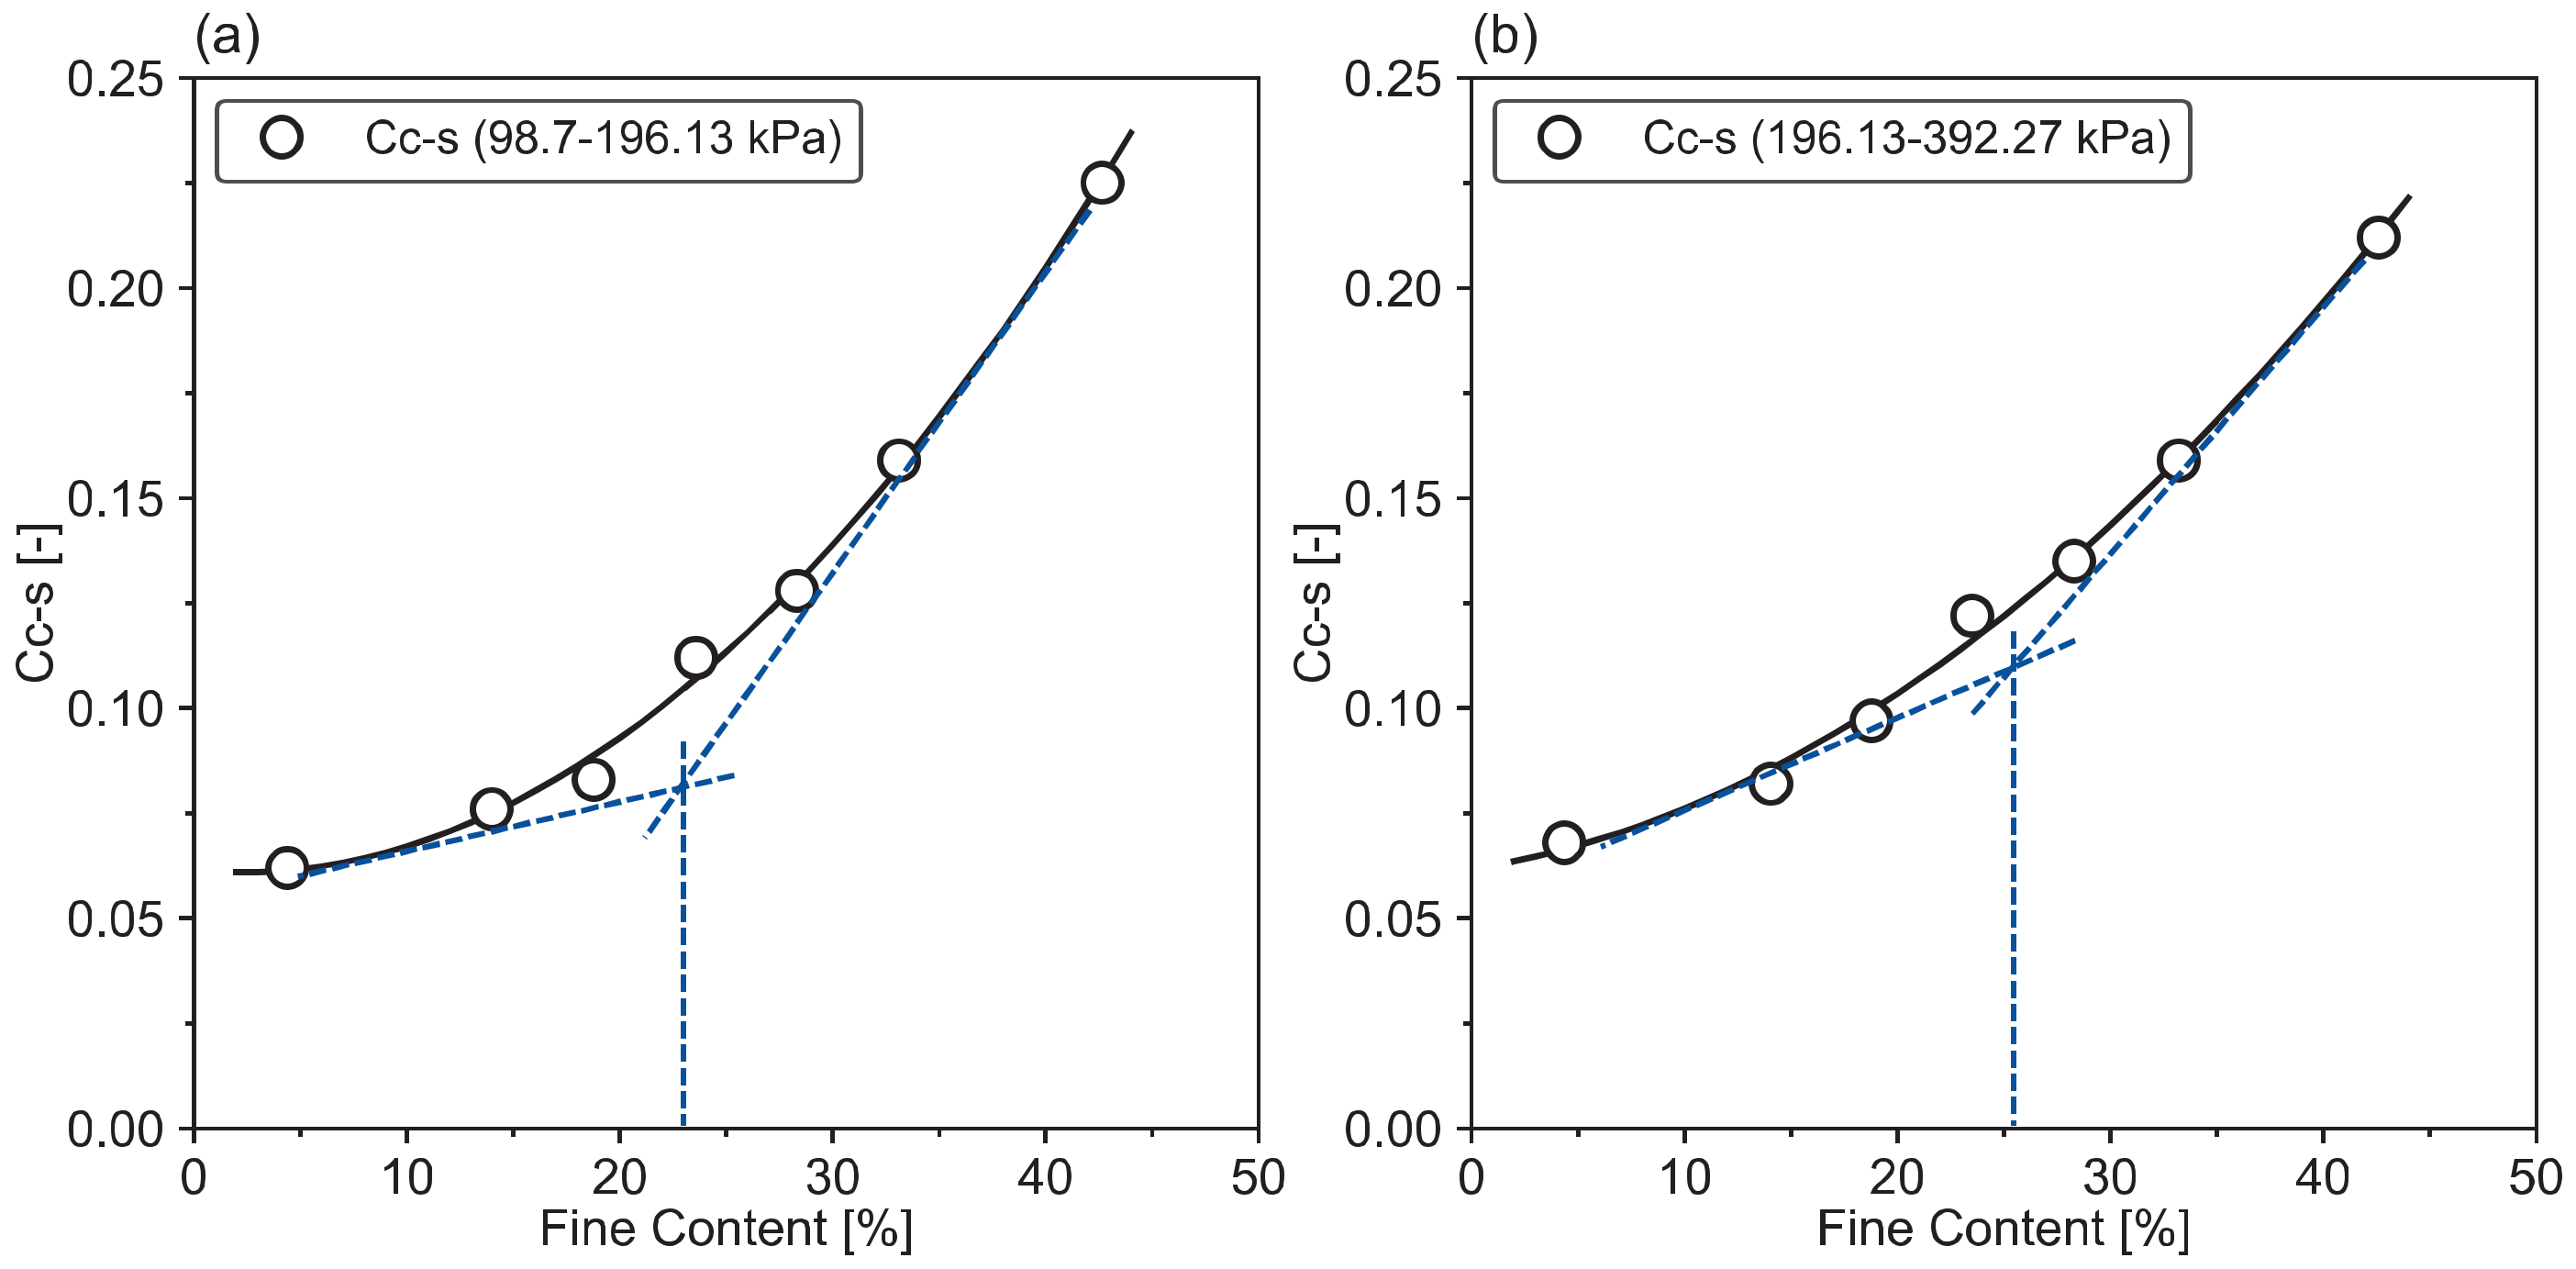
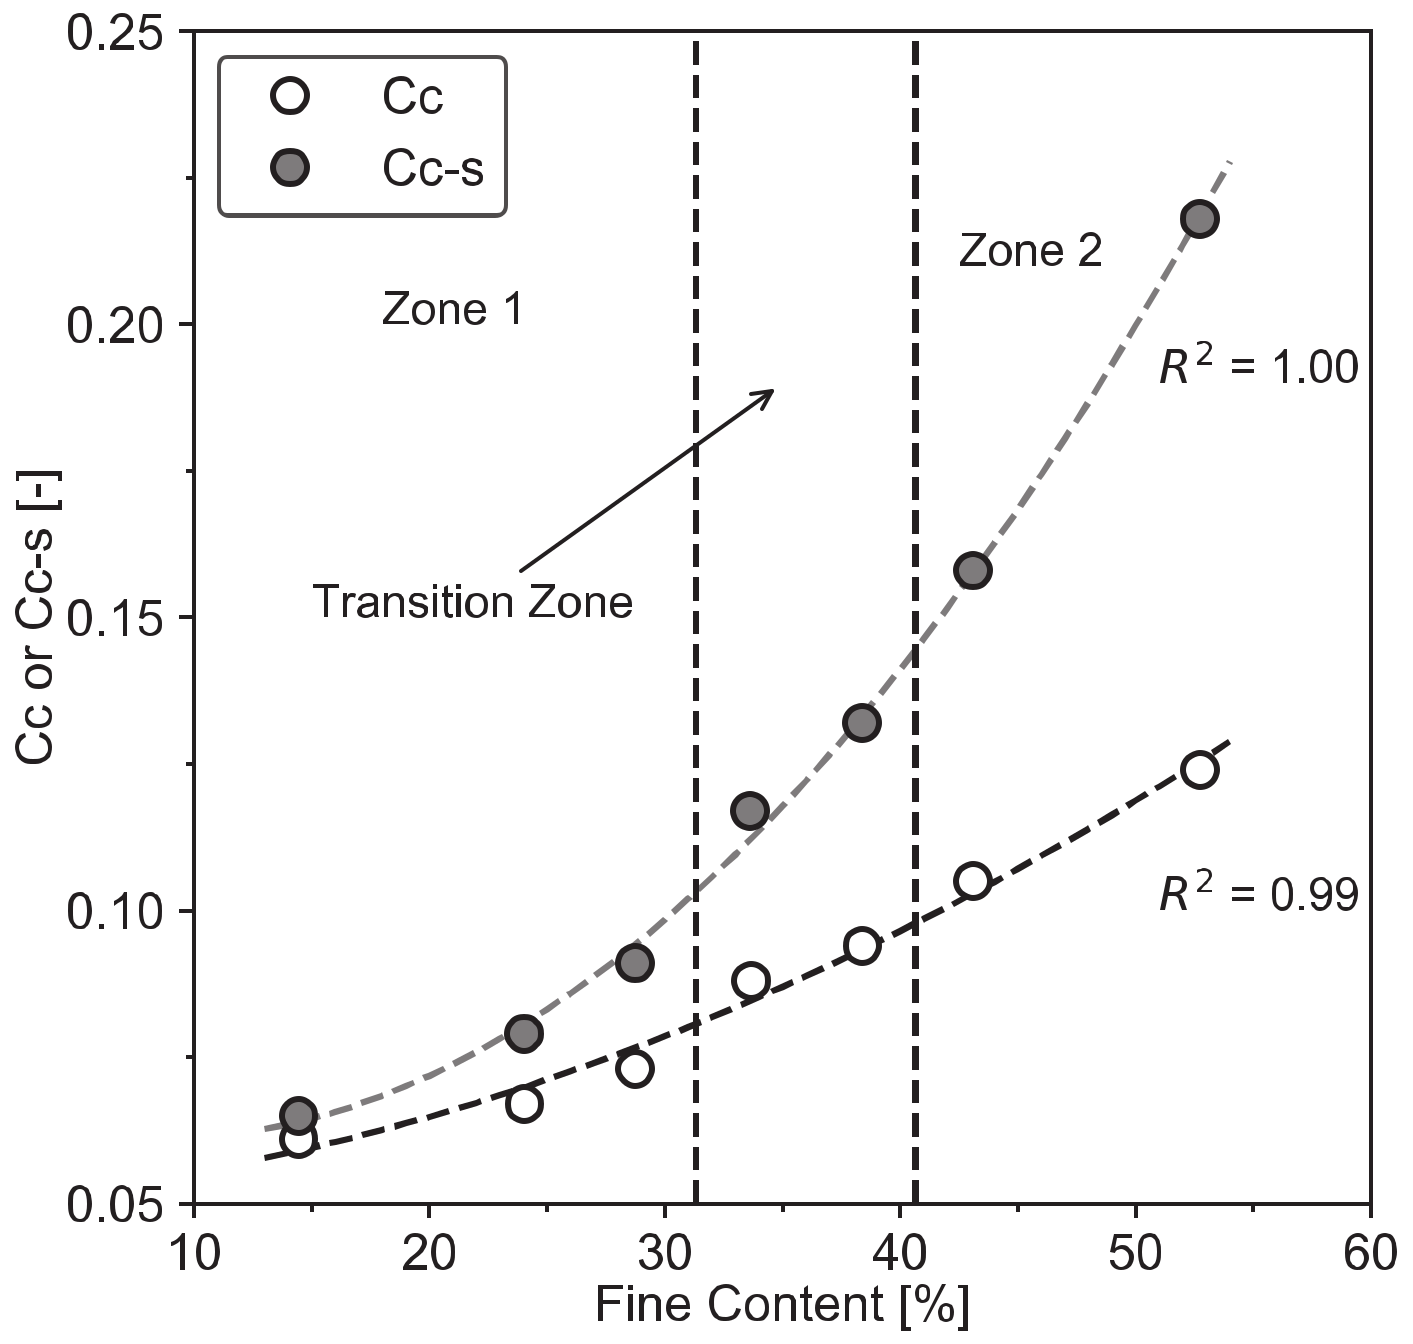
2.2.3. Transitional Fines Content (FCt)

The transitional fines content, also named threshold fines content [32,50,71,83], is the threshold between fines-dominated and sand-dominated in a sand–clay mixture. FCt can be defined as the fines content at which the maximum and the minimum global void ratios of the sand–clay mixture, emax and emin, show a trough, as illustrated in Figure 10. The emax and emin refer to the densest and loosest state of the sand–fines mixture, which can be measured in a laboratory [90,91].
Lade et al. [40] proposed that, in general, the transitional fines content determined from the emax curve is not the same as the one determined from the emin curve (Figure 10). Thus, an indication of the possible range in which the true value for FCt may exist and can be obtained from the curves of emax and emin [88]. Moreover, according to Bahadori et al. [92], there are three zones between the two extremes for sand–clay mixtures. In Figure 11, the evolution of the void ratio is shown for different fines contents: when the fines content is about 10% to 20% the mixture behavior is sand dominant. The second zone applies for approximately 25% to 40% of fines, in which the fine skeleton is replacing the sand skeleton. In this case, the fines particles fill the sand voids, leading to a considerable decrease of the void ratio, and neither the sand nor the fines can dominate the mixture. The third zone applies for a higher percentage of fines content for which the fines behavior dominates. Laboratory studies pointed out that a mixture’s void ratio (porosity) depends upon the fractional concentration of clay particles and is also affected by confining stress. It decreases as the compaction level increases and tends to a minimum value that is the theoretical threshold (i.e., FCt) between a sand-controlled and a clay-controlled mixture (Figure 12). After reaching the minimum void ratio (porosity), the mixture experiences a very gradual increase in void ratio (porosity) up to the point at which the clay completely controls the behavior of the mix [42].
To determine the transitional fines content, it is necessary to use the concepts of intergranular and interfine void ratios. The methods to get the FCt are introduced and explained hereafter.
Oedometer tests on reconstituted sand–clay mixtures indicated that initial sample conditions, percentage of fines, and stress conditions influence the compression characteristics. Test results showed that, up to a threshold fraction of fines (FCt), compression behavior of the mixtures is mainly controlled by sand grains, and when the concentration of fines exceeds the FCt, clay controls the compression. Therefore, several studies focused on determining the range of FCt values by both experimental data and calculation methods.
Researchers [50,83,93] performed oedometer tests on sand–clay mixtures with different proportions of clay. They stated that direct contact between the coarser grain matrix could be assumed to be initiated when the intergranular void ratio of the mixture became equal to the maximum void ratio of the host granular material (eg = emax-g). The eg = emax-g border represented by a horizontal, dashed line in Figure 13 shows the upper limit under which the coarser granular grains form a continuous framework with grain-to-grain contact. The corresponding value of the fines content gives exactly the transitional fines content, FCt. For the case presented in Figure 13, FCt varied between 24% and 34%, depending on the applied normal stress. Their following work in [50] noticed that, for samples with initial void ratios scattered between 0.68 and 0.86, the transitional fines content was in a range of 20%~29%, while for samples with initial void ratios between 0.78 and 0.88, FCt was between 19% and 34%. The results indicated that FCt always depends on the applied stress.
Finally, Lupogo [93] concluded that the transition behavior of sand–clay mixtures is somewhere between 25% and 45%, and it is expected that at this range of fines content the mixture will have a low void ratio and low compressibility. It is interesting to find that the transitional fines content becomes higher as the confining stress increases. To better observe the arrangement stages of the coarser grain matrix, similar to the compression index Cc, Monkul and Ozden [83] proposed a parameter called granular compression index (Cc-s). This concept is defined based on the decrease of intergranular void ratio with effective stress increment as in Equation (9):
C c s = Δ e g Δ log σ
Based on the Equation (9), another experimental method to obtain the FCt was proposed by Monkul and Ozden [83]. The variation of the Cc-s with fines content under different stress ranges is shown in Figure 14. There is a nonlinear relationship between Cc-s and fines content, and the nonlinearity degree decreases at a higher stress range (Figure 14b). The intersection of tangent lines, corresponding to the threshold fines content (FCt), below which the coarser grain matrix governs soil’s behavior. The FCt values can be read as 22.9% for Figure 14a and 25.3% for Figure 14b.
As illustrated in Figure 15, three zones can be classified to describe the compression behavior of sand–clay mixtures: Zone 1, Transition Zone, and Zone 2. At Zone 1, the mixture is mainly controlled by the sand and shows less compressive behavior. This is due to the sand grains forming a continuous framework with grain-to-grain contacts and fines primarily located in the intergranular void. With increasing fines content, sand grain contacts start to diminish from the beginning of the Transition Zone, and the slope of Cc-s curve increases sharply. At the stage of Zone 2, almost no grain contacts exist between sand grains so that the fine particles mainly control the soil. Hence, the Cc-s increases as fines content increases until a maximum value [50].
Several researchers have proposed analytical estimates in parallel to characterize the FCt from experimental data. For instance, [89] and [32] put forward that when the interfine void ratio (ef) of a sand–fines mixture is below the maximum global void ratio of the fines, the behavior of the mixture is fines-dominated. Hence, the FCt can be defined as:
e F C t = e max , f i n e s
Similarly, other researchers stated that when the intergranular void ratio eg of the sand–fines mixture is greater than the maximum global void ratio (emax,sand) of the sand, sand grains are separated by the fines, and the behavior of the mix changes from sand-controlled to fines-controlled [50,85,88]. In this case, FCt can be calculated through Equation (11):
e + F C t 1 F C t = e max , s a n d
Different from the point of view that the mixture is sand-controlled or clay-controlled, according to Zuo and Baudet [88], the area between eg = emax,sand and ef = emax,fines is neither sand-dominated nor fines-dominated, i.e., the transition zone in Figure 15. The fines content then satisfies both Equation (10) and Equation (11), so that the FCt can be calculated as follows:
F C t = e max , s a n d 1 + e max , s a n d + e max , f i n e s
Taking the differences of specific gravities between sand and fines into consideration, Equation (12) can be rewritten as Equation (13):
F C t = G f e max , s a n d G f e max , s a n d + G s 1 + e max , f i n e s
If we consider a phase diagram in Figure 16, es is the void ratio of the sand, Vv is the volume of voids, Vs is the volume of sand, Vf is the clay volume, the weight of the fines is Wf, and the weight of the sand is Ws. Based on this, Hazirbaba [94] proposed that the FCt can be defined by the ratio of the weight of the fines (Wf) to the total weight of the sand and fines (Ws + Wf) as:
F C t = W f W s + W f = G f e s G f e s + G s 1 + e f
A different FCt was defined by Polito [95] as the ratio of the weight of the fines Wf to the weight of the sand particles Ws as follows:
F C t = W f W s = G f e s G s 1 + e f

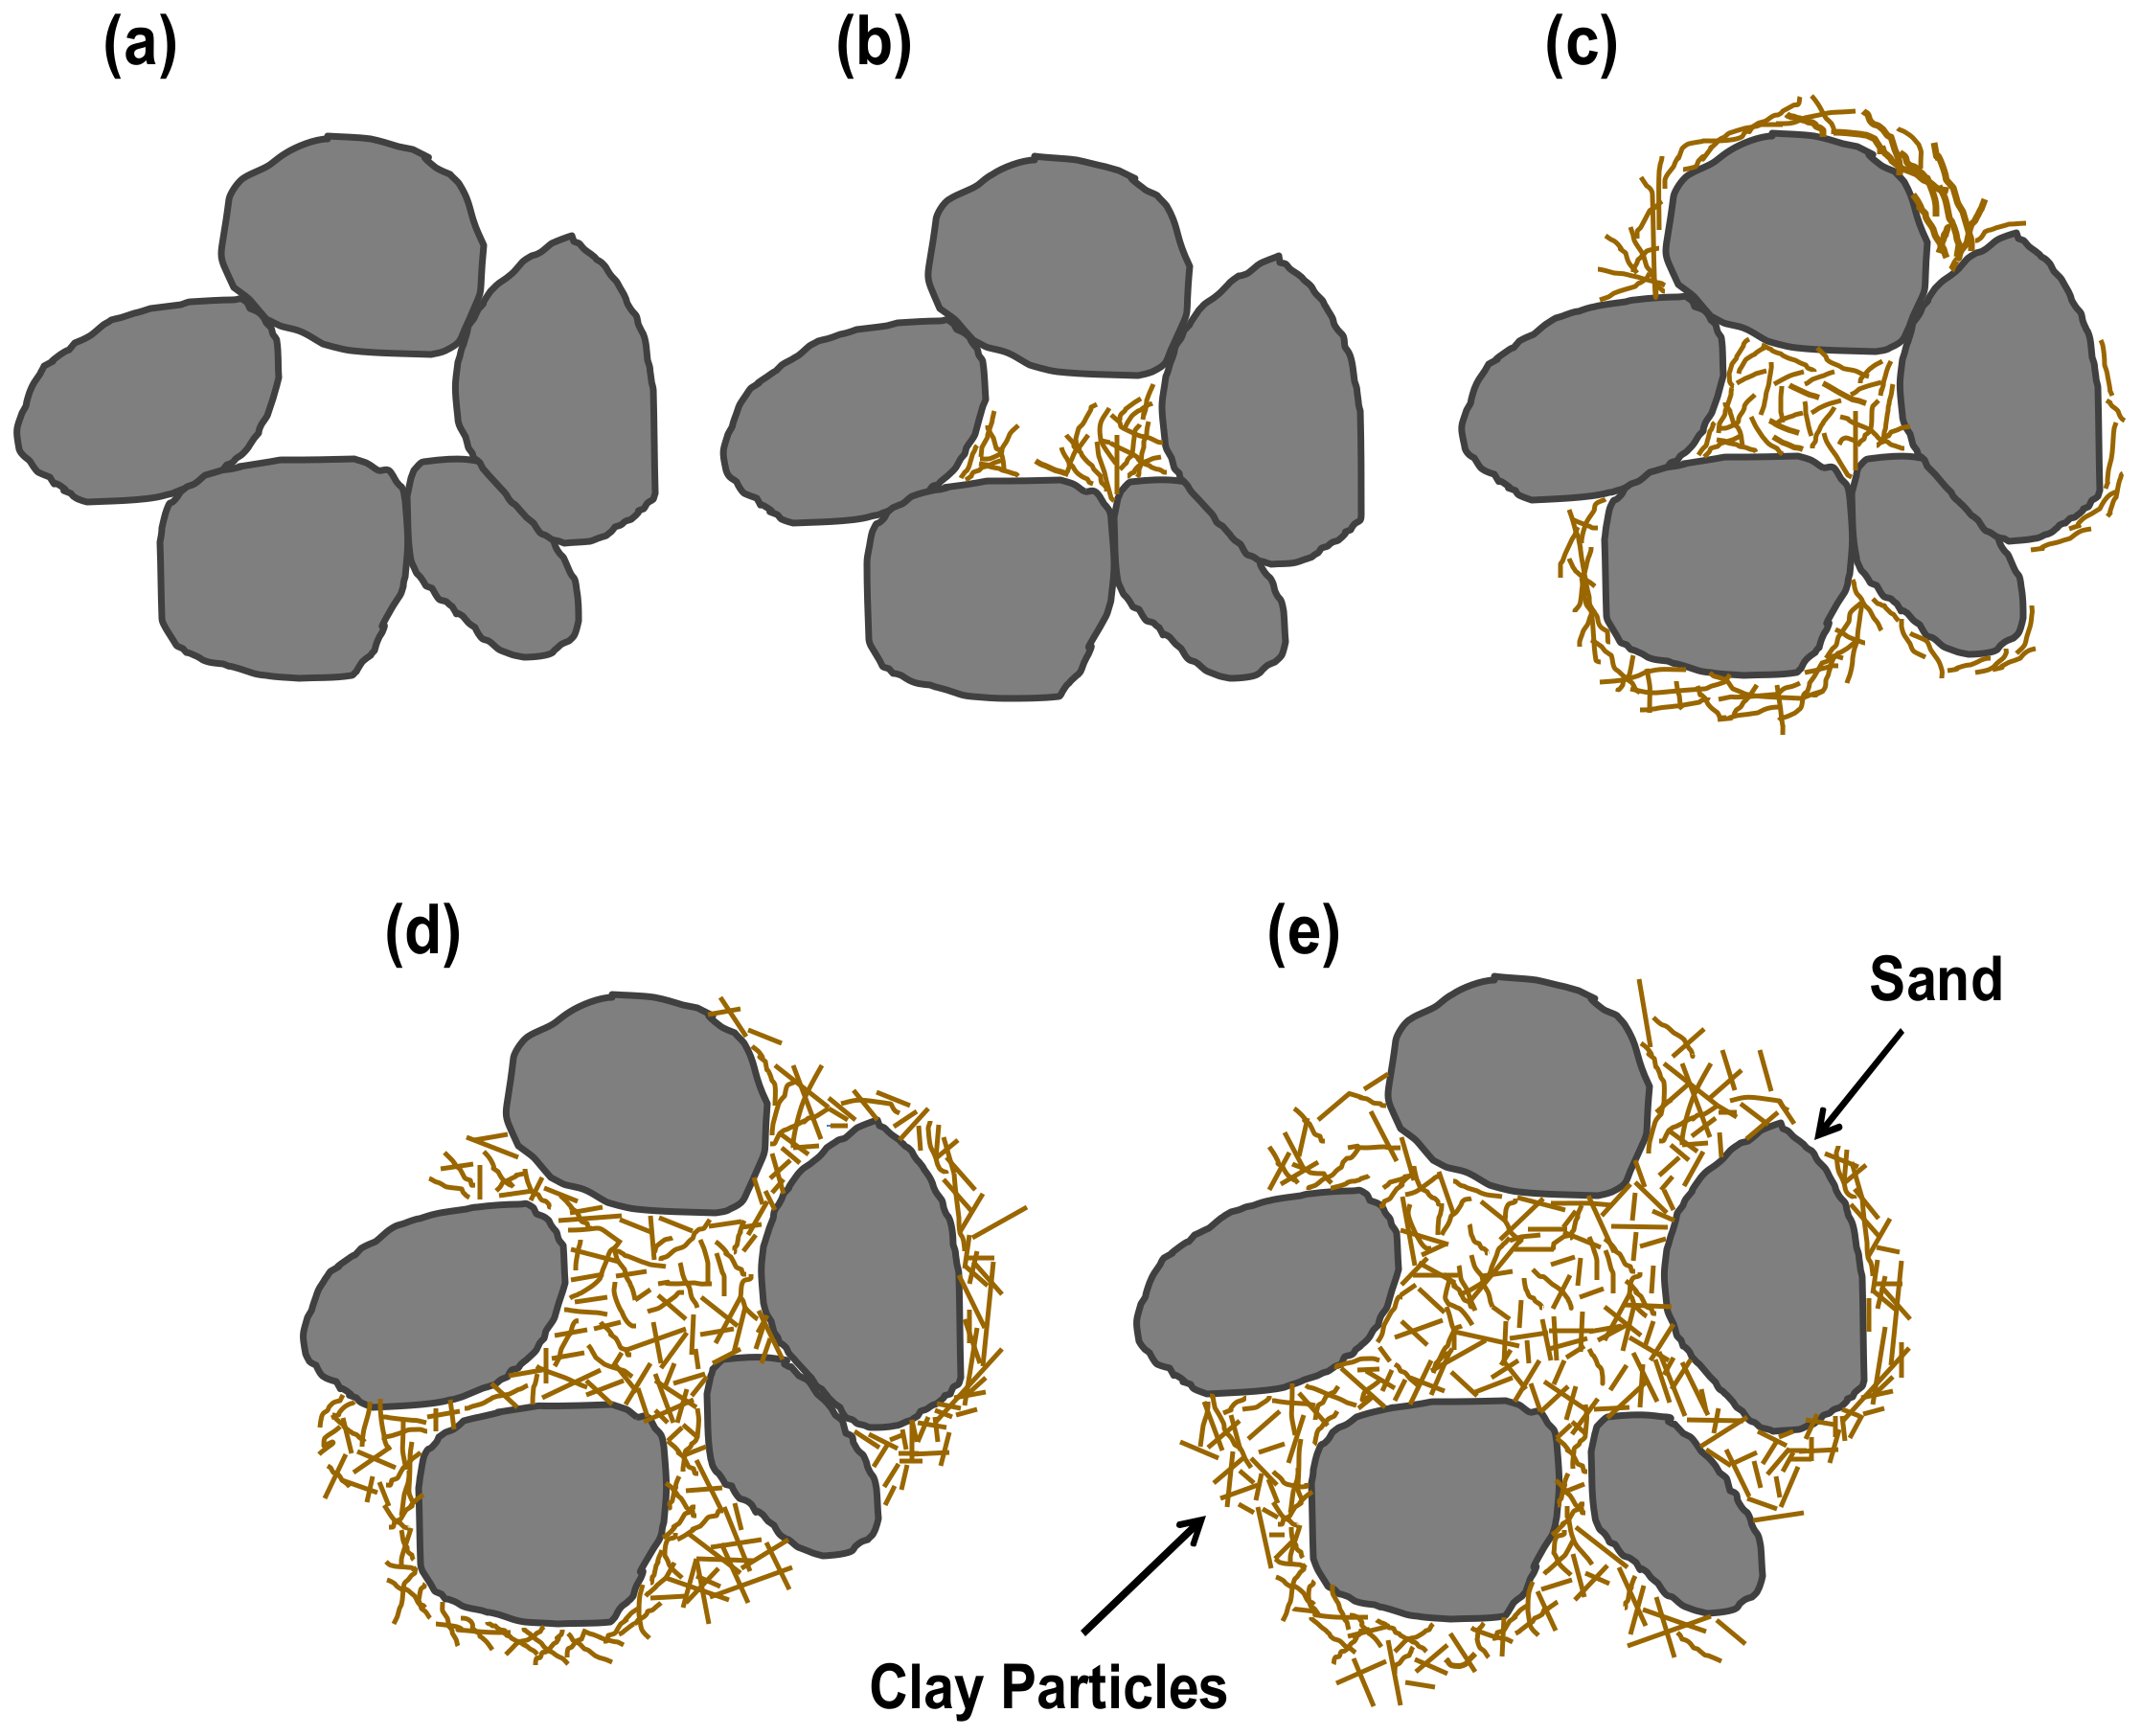
2.2.4. Microstructure of Sand–Clay Mixture

Clayey soils are multi-scale materials, and their macroscopic behavior is impacted by microstructure [28,30,96,97,98,99]. The micromechanical behavior at the particle-scale level, such as particle rearrangements and force chain collapses, can affect the global macroscopic response. The microstructure (or micro fabric) refers to the arrangement of particles, particle groups, and pore spaces that exist within the soils. Knowing the microscopic structure is a good way for better understanding the macro-mechanical behavior of the soils. Soils’ microstructure can be obtained by several imaging techniques, e.g., scanning electron microscope (SEM), environmental scanning electron microscope (ESEM), and X-ray tomography.
Undrained triaxial compression tests were performed on samples of sand with 20% non-plastic silt by [100]. Results showed that soil’s fabric is responsible for the various test results. With the help of SEM, the microstructure of the sand–silt mixture was examined and quantified. The microscopic results indicate that internal particle structures and their relative quantities correlate with the observed macroscopic undrained behavior. The particle arrangement in the sand–clay mixture was investigated by Shaker and Elkady [101]. SEM images identified that the different particle arrangements and pore size characteristics depend on clay content. Even at a low clay content of 20%, the clay particles stay within the pores between sand grains and form a thin-layer coating around sand grains. At a clay content of 30%, clay particles show assemblage connectors and create bridge-like structures between sand grains. This kind of clay matrix leads to partial separation of the sand grains [101]. Furthermore, test results identified that the macroscopic mechanical behavior depends on the microstructure as well.
Carraro et al. [102] characterized the mechanical behavior of silica sand containing different amounts of plastic or non-plastic fines by using triaxial tests combined with ESEM to evaluate the microstructure. Their study highlights the importance of soil fabric on the overall mixture response; the mechanical behavior is affected by both the amount and plasticity of the fines in the sand. The photomicrograph technique can be utilized to qualitatively verify the contact between sand and clay in the mixture [39]. The micrographs reveal that at clay contents from 0% to 15%, the clay fills into the voids and sand grains are in contact. Then, sand grains are covered by clays (for the clay contents of 25% and 30%). At higher clay contents, sand grains are surrounded by clay particles rather than clays staying at the void [39]. The microscopic results verified the former analytical conclusions about the arrangement of sand and clay particles at different clay content.
In conclusion, the microstructure of the sand–clay mixture varies with the clay content, resulting in a different macromechanical behavior. Research on sand–clay mixture should, therefore, not neglect their microstructure.

2.3. Concluding Remarks

This section reviewed a series of indexes describing clay′s control on the sand–clay mixture, e.g., fines content, intergranular void ratio, interfine void ratio, and transitional fines content. The experimental methods and analytical estimates for calculating the intergranular void ratio and transitional fines content were introduced. Investigations to characterize the mechanical behavior of sand–clay mixture were reviewed as well. The main findings of this section are summarized as follows:
  • The mechanical behavior of the sand–clay mixture depends on the clay fraction. At low clay content it is mainly sand-controlled; at high clay content, it is primarily clay-controlled, while in the middle range of clay content, i.e., the transitional zone, the sand–clay mixture’s responses are not clear.
  • Various factors control the mechanical behavior of sand–clay mixture, e.g., intergranular void ratio, water content, global void ratio, and density, which are always related to the clay fraction.

3. Interface Direct Shear Test

3.1. Introduction

The behavior between soil and construction materials is of significant concern in soil–structure interaction issues. The loading transfers from the structural component to the soil through a contact zone, are called interface, where significant strain localization occurs [11,13,16,103,104,105]. Due to the different mechanical properties of the materials, shear stress and strains occur at the interface between the soil and the structure. The modified direct shear test has been widely used to investigate the soil–structure interface behavior [8,17,18,19,20,21,106], and several factors (normal stress, soil density, temperature, and roughness) have been investigated to understand their effects on the interface characteristics [2,7,11,13,24,107,108,109]. In this section, basic theory and the state of the art of classical and interface direct shear tests are first reviewed. The influence factors are then presented, i.e., normal stress, soil density, water content, structure surface roughness, shearing velocity, and temperature.

3.2. Interface Direct Shear Test

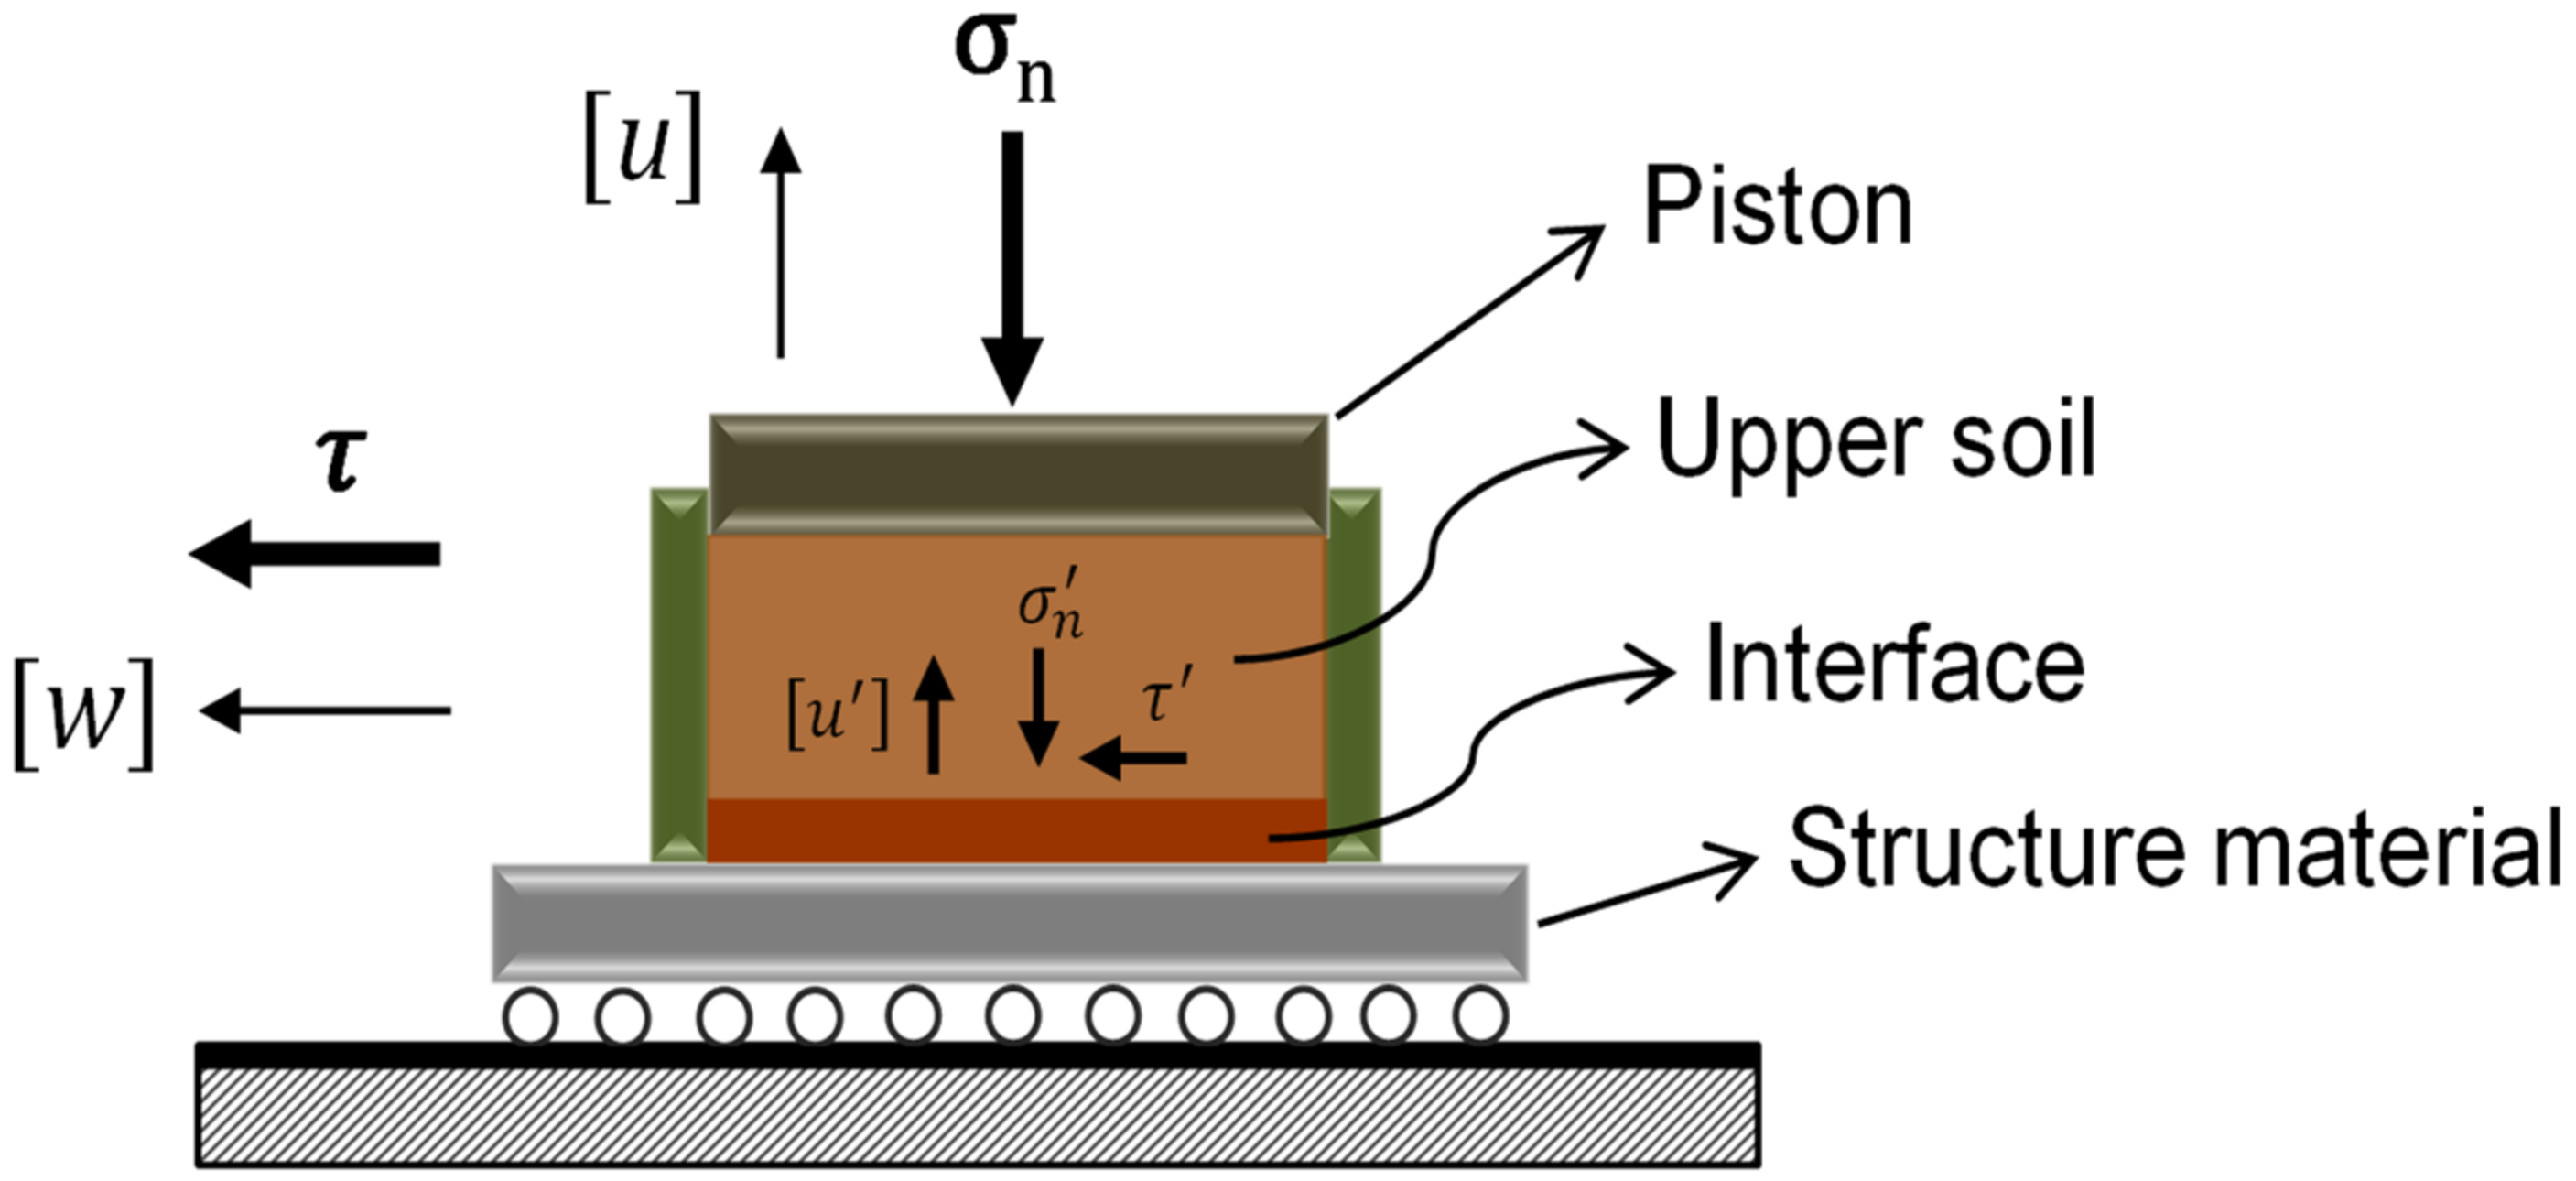
3.2.1. Basic Knowledge

The interface direct shear box originates from a conventional direct shear box. The lower part of the classical direct shear box is modified to contain the structure plate inside. This modification is illustrated in Figure 17: One half of the interface direct shear box involves a soil material and the other half includes a structural material. When the shear stress was applied to the sample, a relative displacement between the upper and lower sections developed along the horizontal direction (see Figure 17). As the classical direct shear test, the interface direct shear test can also be performed in saturated conditions. For the interface-tested sample in Figure 17 and Figure 18, there was an “active” lower part being in contact with the structural material; it was the so-called interface, with a “passive” upper part acting as an oedometric sample [12,13,110].
Before interface shearing, at the consolidation phase, once the normal stress is added on the sample (Figure 18), [u]s is the vertical displacement measured at the top of the sample; it differs from the [u]i vertical displacement measured at the top of the interface [12,13]. Pra-ai and Boulon [13] showed that when shearing under constant normal load (CNL) and constant normal stiffness (CNS) conditions and assuming no friction between the shear box and the sample, it is reasonable to use the measured change at the top of the sample (Δ[u]s) to estimate the change of the interface (Δ[u]i).
It is worth underlining that due to the difference between the stiffness of the passive upper part and the active lower part of the sample in the cases of both CNL and CNS, the vertical displacement measured at the top of the sample is a representative of the volume change of the soil. To perform an accurate CNS direct shear test, the thickness of the passive part of the sample (h-t) and, accordingly, the thickness of the whole sample (h) should be as small as possible [13].
The interface direct shear test results were similar to those of the classical direct shear test; however, it should be noted that the interface response related to the behavior of both soil and structure. Earlier soil–structure interface research was performed by [111]. He studied the friction between different structure materials and soils, postulating that the most critical factors affecting the friction are the normal stress, the moisture content, the roughness, and the soil composition. Interface direct shear tests with modified shear boxes were used extensively by other researchers [8,110,112,113,114,115,116,117,118].
Although there are some inherent disadvantages in the interface direct shear test, such as the prescribed failure plane, the non-uniform stress being close to the interface, as well as an overestimation of the shear strength, these limitations did not affect the wide use of this apparatus to characterize the mechanical characteristics of the interface between soils and structures [11,18,19,20,22,24,105,106] to provide a better understanding on the soil–structure interface at the engineering scale

3.2.2. Boundary Conditions

The field far from the structure acts like a spring on the soil–structure interface reacting to the dilative or contractive response of the interface; it is generally assumed to comply with Hook’s law [103,115,119,120] (see Figure 19a). Consequently, the interface dilation induces an increment of normal stress acting on the interface and, thus, an increase in shear strength, while a contraction causes a decrease of the normal stress and the shear strength [103,115]. The increment of normal stress is typically a linear function of the volumetric deformation of the interface soil. In this sense, the shearing boundary condition of the soil–structure interface can be interpreted by the CNS condition in the interface direct shear test (Figure 19), which takes both dilation and deformability of soils into account [12,105,115,121].
Based on the concept of Constant Normal Stiffness, as illustrated in Figure 20, there are three different typical boundary conditions that are distinguished by the values of the elastic stiffness, K:
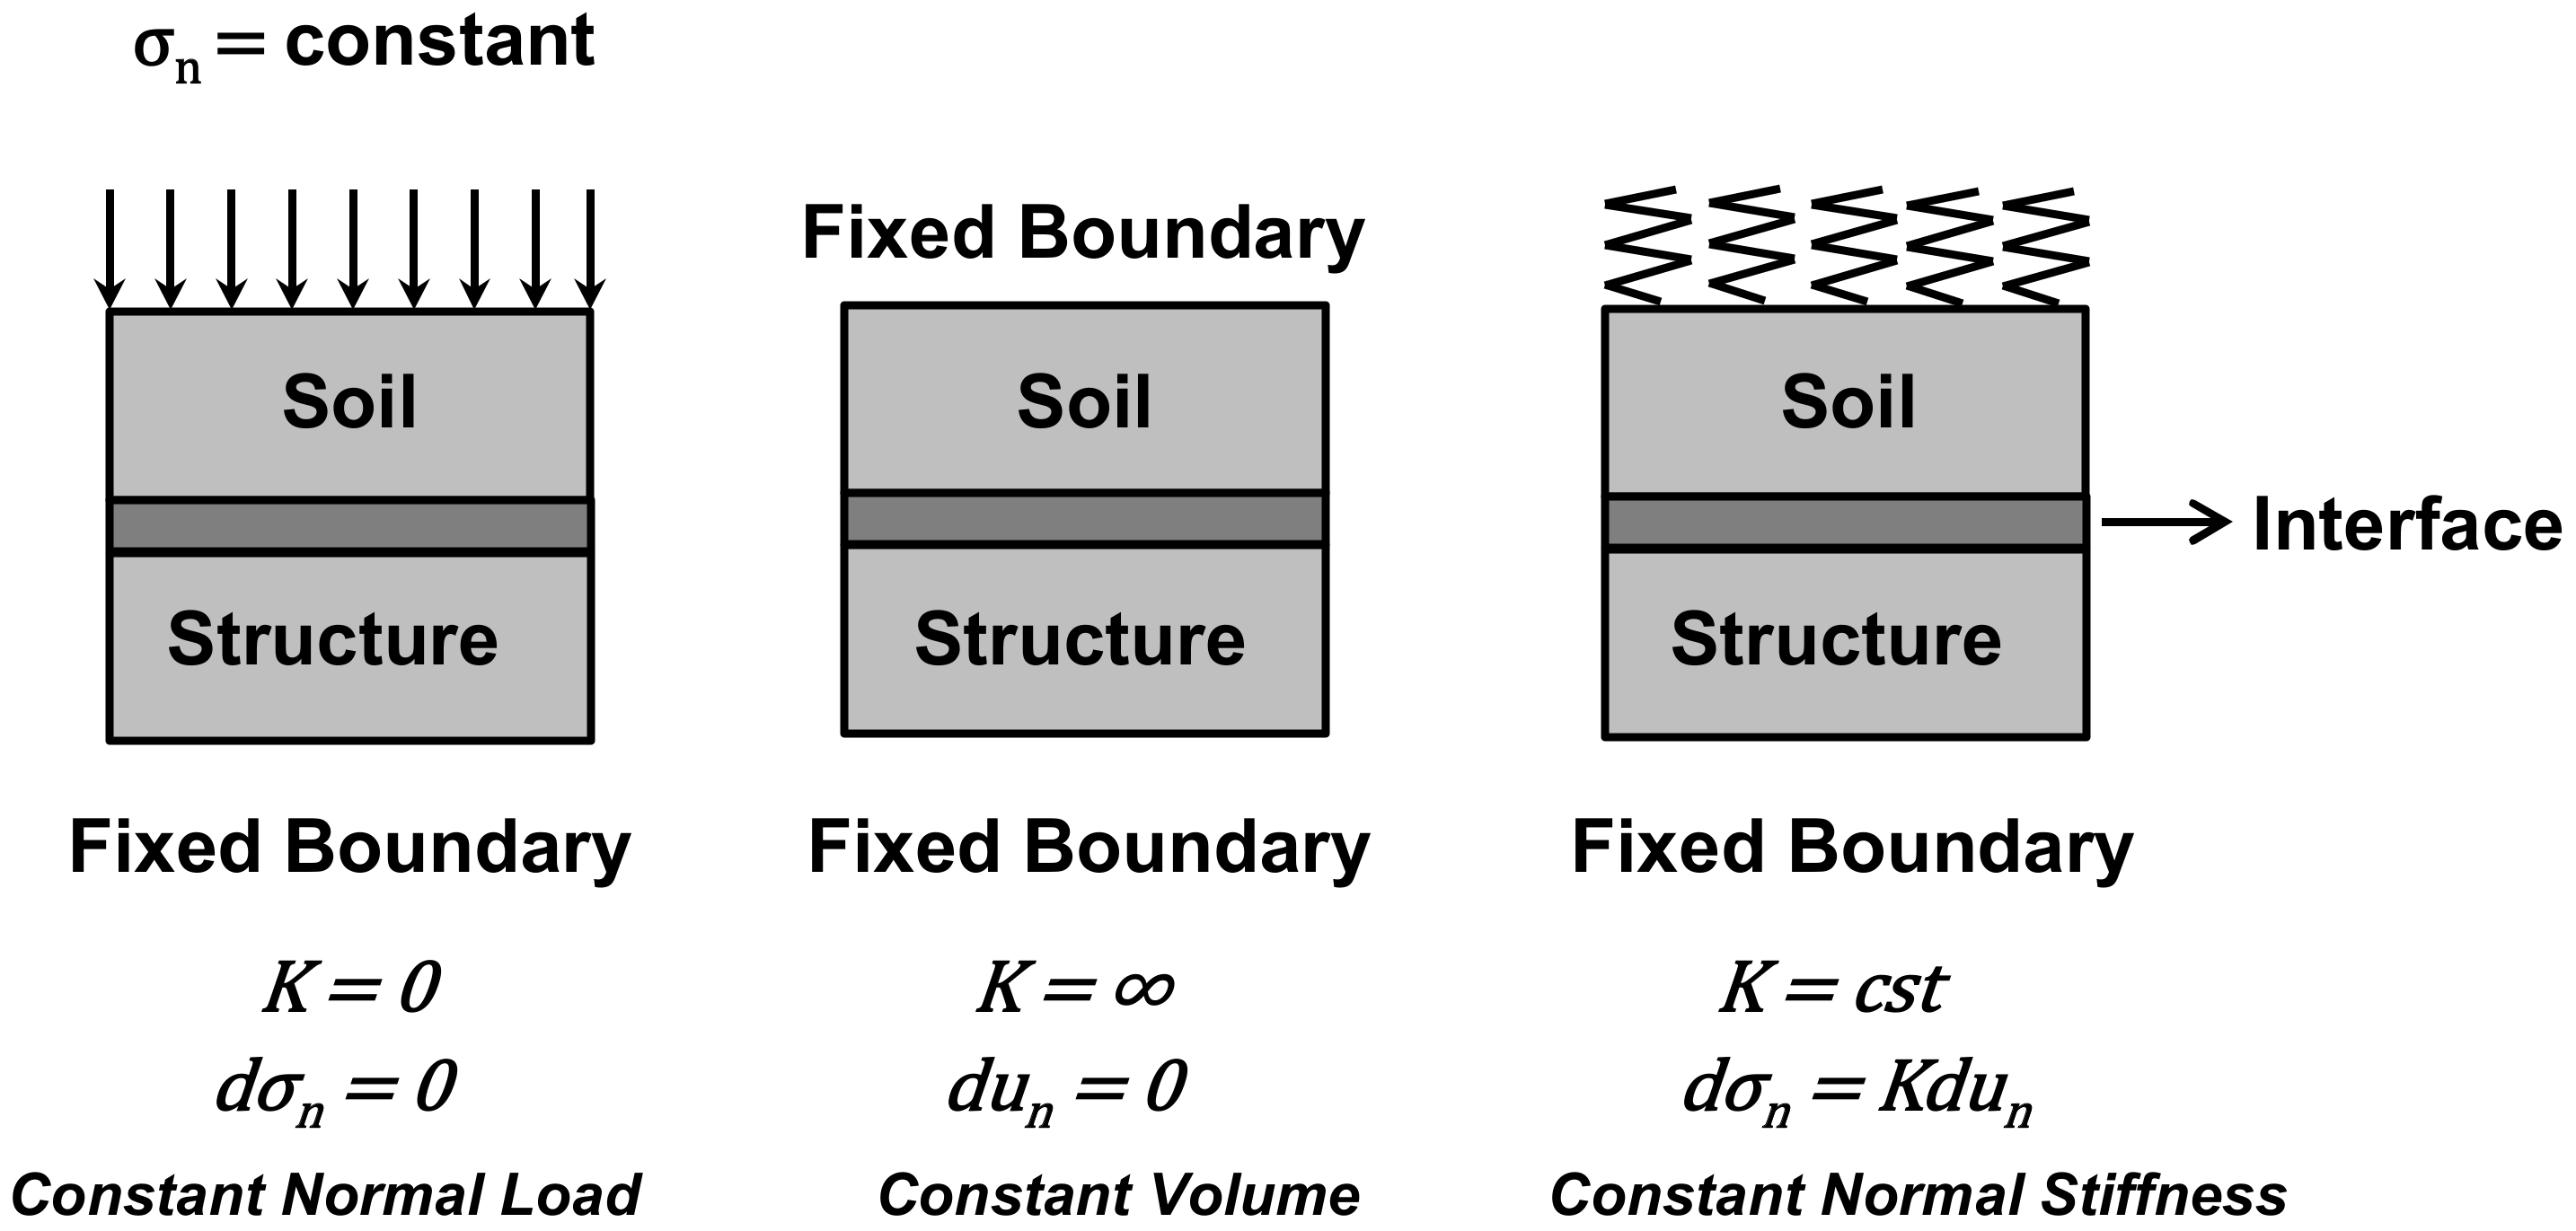
  • Constant Normal Load (CNL): The normal stress remains constant during the shearing stage of the interface direct shear test. In this case: K = 0 , Δ σ = 0 , Δ [ u ] 0 .
  • Constant Volume (CV) or Constant Normal Height (CNH): The normal stress changes during the interface shearing, and no normal displacement is allowed in the upper part of the interface element. In this case: K = , Δ σ 0 , Δ [ u ] = 0 .
  • Constant Normal Stiffness (CNS): The normal stress changes proportionally to the elastic stiffness of the surrounding soil during the interface shear test. In this case: K = constant, Δ σ 0 , Δ [ u ] 0 .
The Constant Normal Load (CNL) is one of the two extreme conditions of the Constant Normal Stiffness (CNS), while the Constant Volume (CV) is the other one (Figure 20). The interface tests are usually run under CNL conditions [7,11,18,19,24,106,114], even if the CNS is also widely used [10,12,13,15,103,115,117]. In this case the normal stress acting on the interface varies during shearing. Although the shear resistance of each CNS test depends on the volumetric response, the interface friction angle is unique for a given soil–structure interface [103].

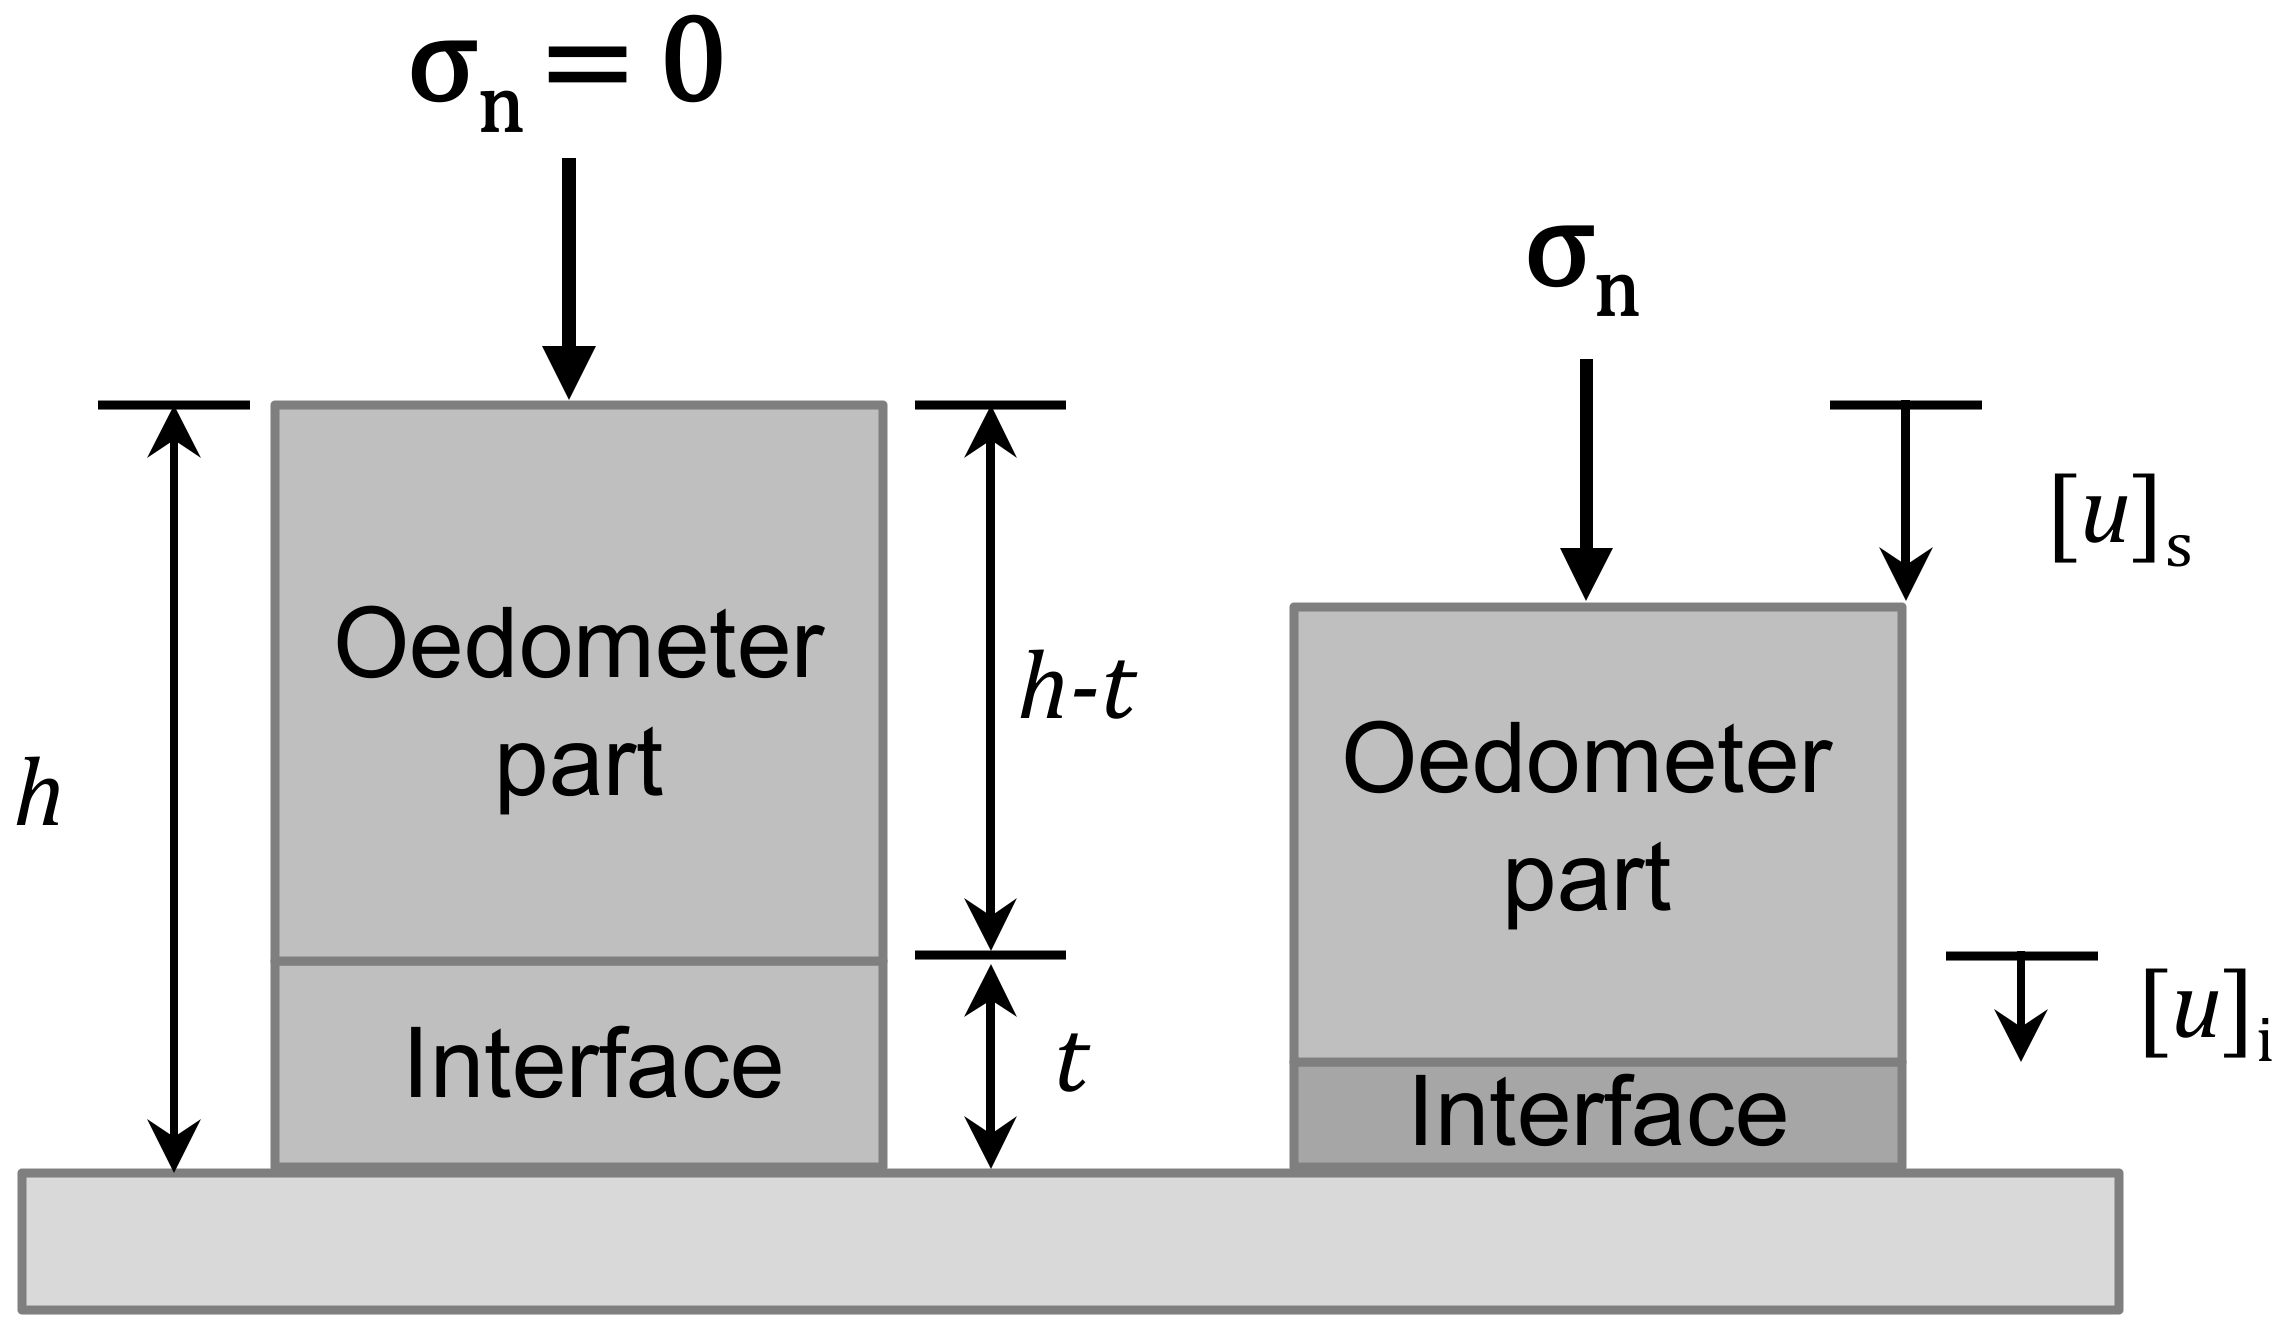
3.2.3. Interface Thickness

The soil–structure interface can be defined as a very thin zone of soil around the structure [7,12,13,103,110], which has quite different mechanical properties from the rest of the soil and develops strain localization during shearing [7,11,12]. High-precision measurements of the interface’s thickness are unfortunately quite poorly documented, even if studies improved its characterization from the last two decades. Studies of identification, measurement, and evaluation of the soil–structure interface thickness have been developed thanks to new visualization techniques. For instance, Particle Image Velocimetry (PIV) [10,122,123,124], Digital Image Correlation (DIC) technique [14,125,126], and high-resolution photography method [11,108,127,128,129] can be used to visualize the interface zone deformation and to measure the interface thickness. The interface thicknesses of sand– and clay–structure are summarized hereafter.
• The thickness of the sand–structure interface
The soil grain size, the initial density, and the surface roughness affect the interface thickness between sand and structure. The tests performed by Hammad [130] on the sand with different specimen densities showed that the thickness of the interface tends to decrease with the increase of the initial density (Figure 21). It is because the loose sand presents larger rotations and relative movements at the interface than the dense sand.
According to previous research [10,11,13,108,127,128,129,131,132], the interface thickness is estimated to be few times the average particle diameter of the soil. Hoteit [131] found that the range of 7~14 times the average grain diameter (D50) can be considered for evaluating the interface thickness for sand. Experimental results showed that the thickness of the interface is an increasing function of the average grain diameter [12]. For a rough surface, the interface thickness of Fontainebleau sand–steel can be defined as 10 D50 for dense specimens and 12 D50 for loose specimens [12,13]. This finding is not consistent with previous observations in Figure 21, which may be due to the different sands used in the two studies (Hostun sand and Fontainebleau sand). Some values of sand–structure interface thickness from the literature are summarized in Table 2.
• Interface thickness of clay–structure
Though many researchers studied the clay–structure interface [2,19,20,21,22,24,104,116,133,134], only a few papers pointed out how to estimate the clay–structure interface thickness compared to the D50 of clay (Table 3). Some investigations just indicate that the clay–structure interface thickness is much larger than 5~14 D50 of clay (typical values of the sand–structure case).
Martinez and Stutz [24] carried out interface direct shear tests on kaolin clay (with 52% particle diameter <2 μm, the D50 is unknown) and steel, finding that a shear zone with a thickness of 0.55 mm developed on the clay sample tested against the rough surface. A thinner shear zone with thickness about 0.25 mm formed on the medium rough surface. It is quite interesting to see that these results agree with the results of the sand–steel interface in Martinez et al. [127]. This indicates that the interface thickness of clay–steel is much thicker than 5~10 D50 of dispersed clay particles. Yavari et al. [19] found that in a kaolin clay–concrete interface direct shear test usually a very thin layer (<1 mm) of kaolin is subjected to shearing and the thickness of the shear zone varies from test to test.
This is because clay particles generally have a platy shape, rather than angular or spherical shapes in sandy grains. This difference influences the particle rotation or motion and results in different mechanical behavior and thickness of the interface. Moreover, interface shearing on the clay–structure interface involves more particle reorientation within the shear zone, which is different from the shearing mechanism of sand–structure interface, which is more associated with rolling or rearrangement of granular grains in the interface [20]. Consequently, using multiples of D50 to account for the interface thickness of clay–structure is not precise or practical.

3.3. Influence Factors on the Mechanical Behavior of the Soil–Structure Interface

As mentioned, laboratory research with interface direct shear tests has shown that different factors influence the mechanical characteristics of the soil–structure interface, such as normal stress, sample density, surface roughness, water content of soil, angularity of soil particles, shearing velocity, soil particle size distribution, and temperature [6,7,8,12,16,18,108,116,118,129,133,135,136,137,138]. The most critical factors are reviewed as follows.

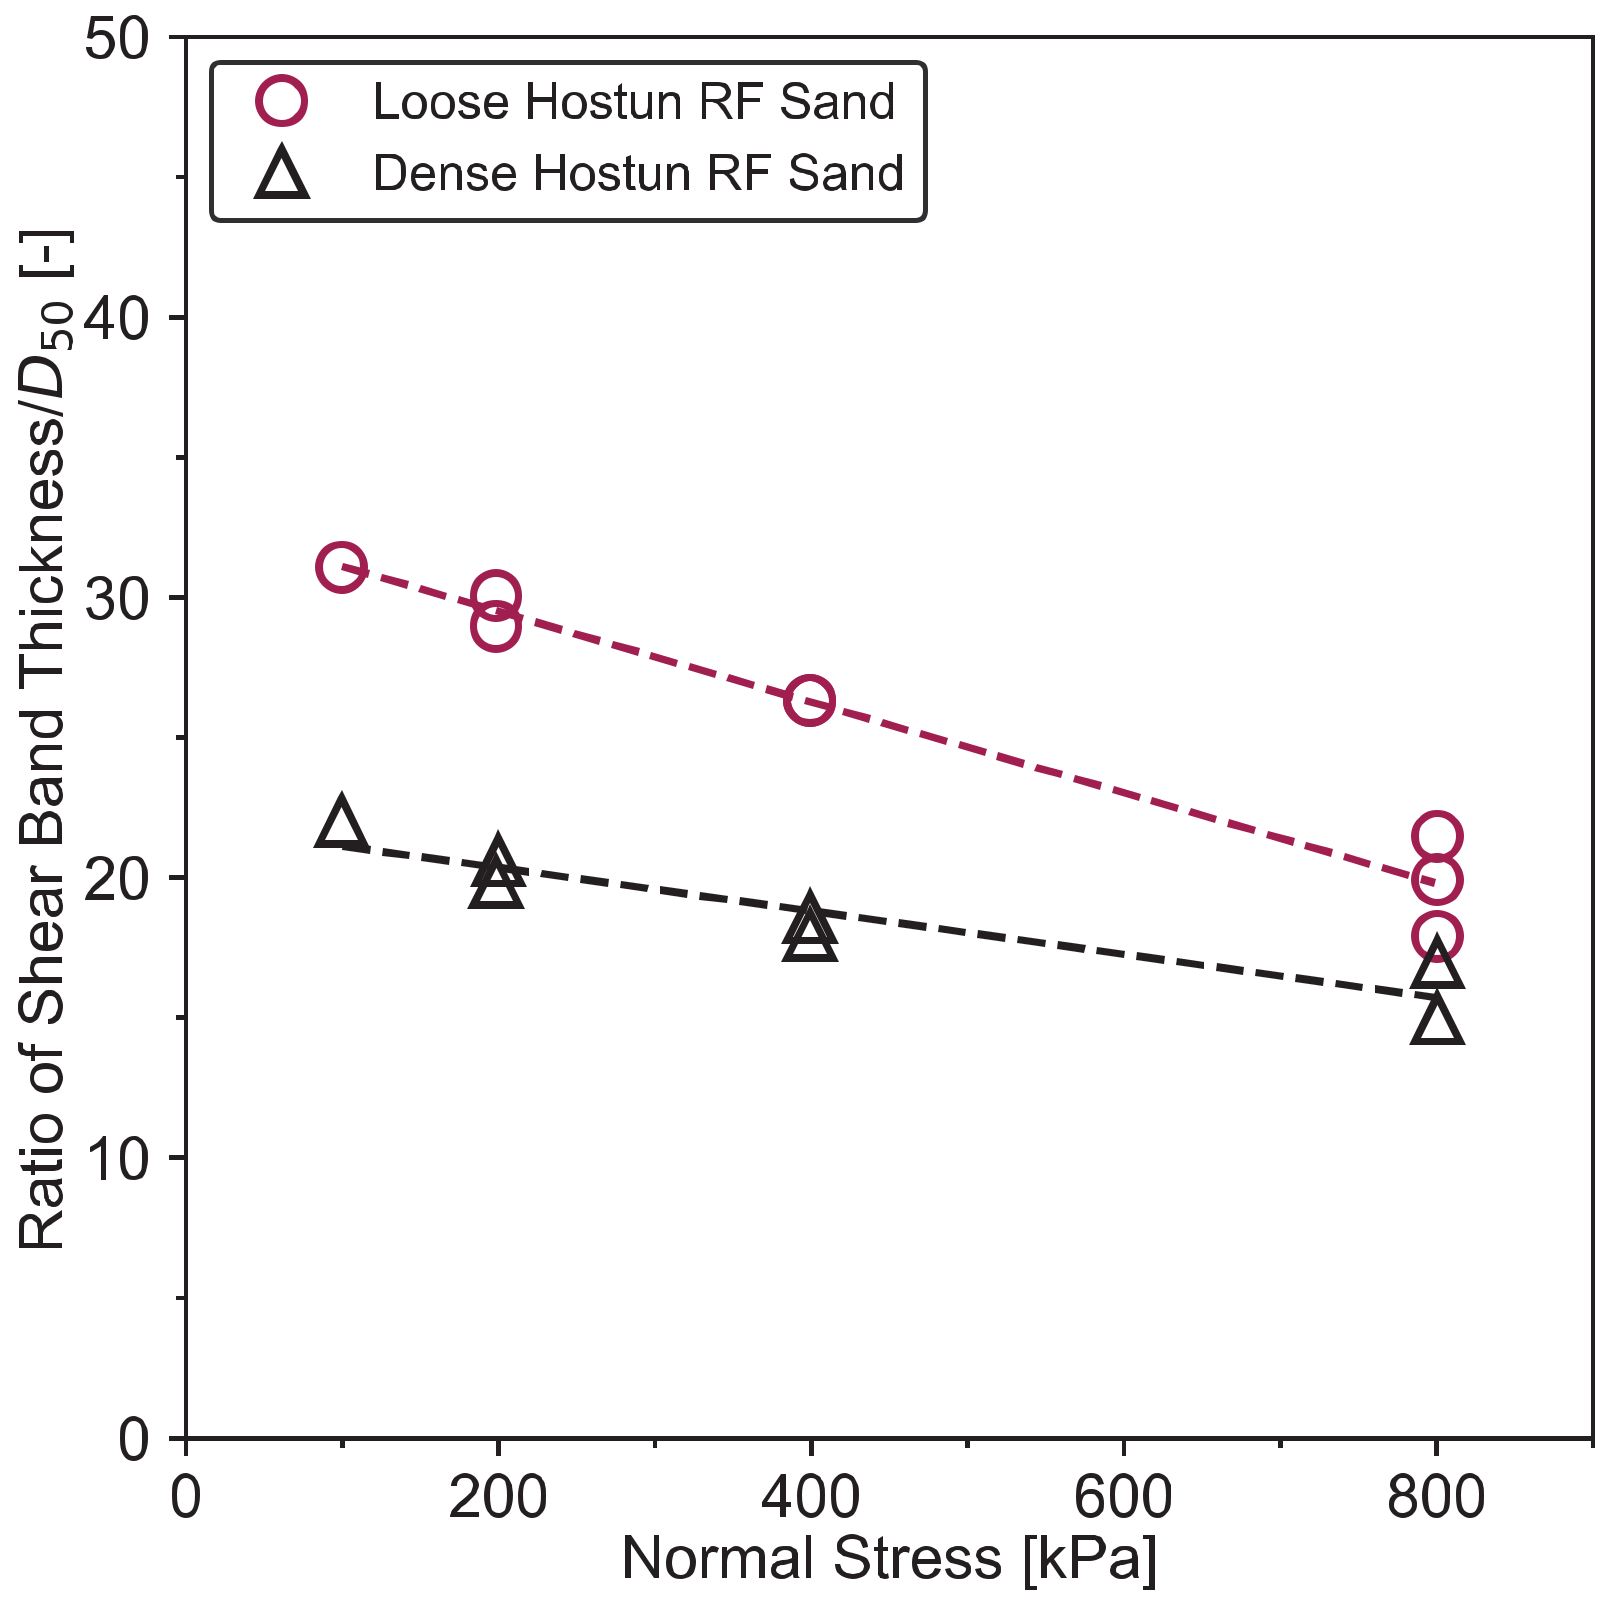
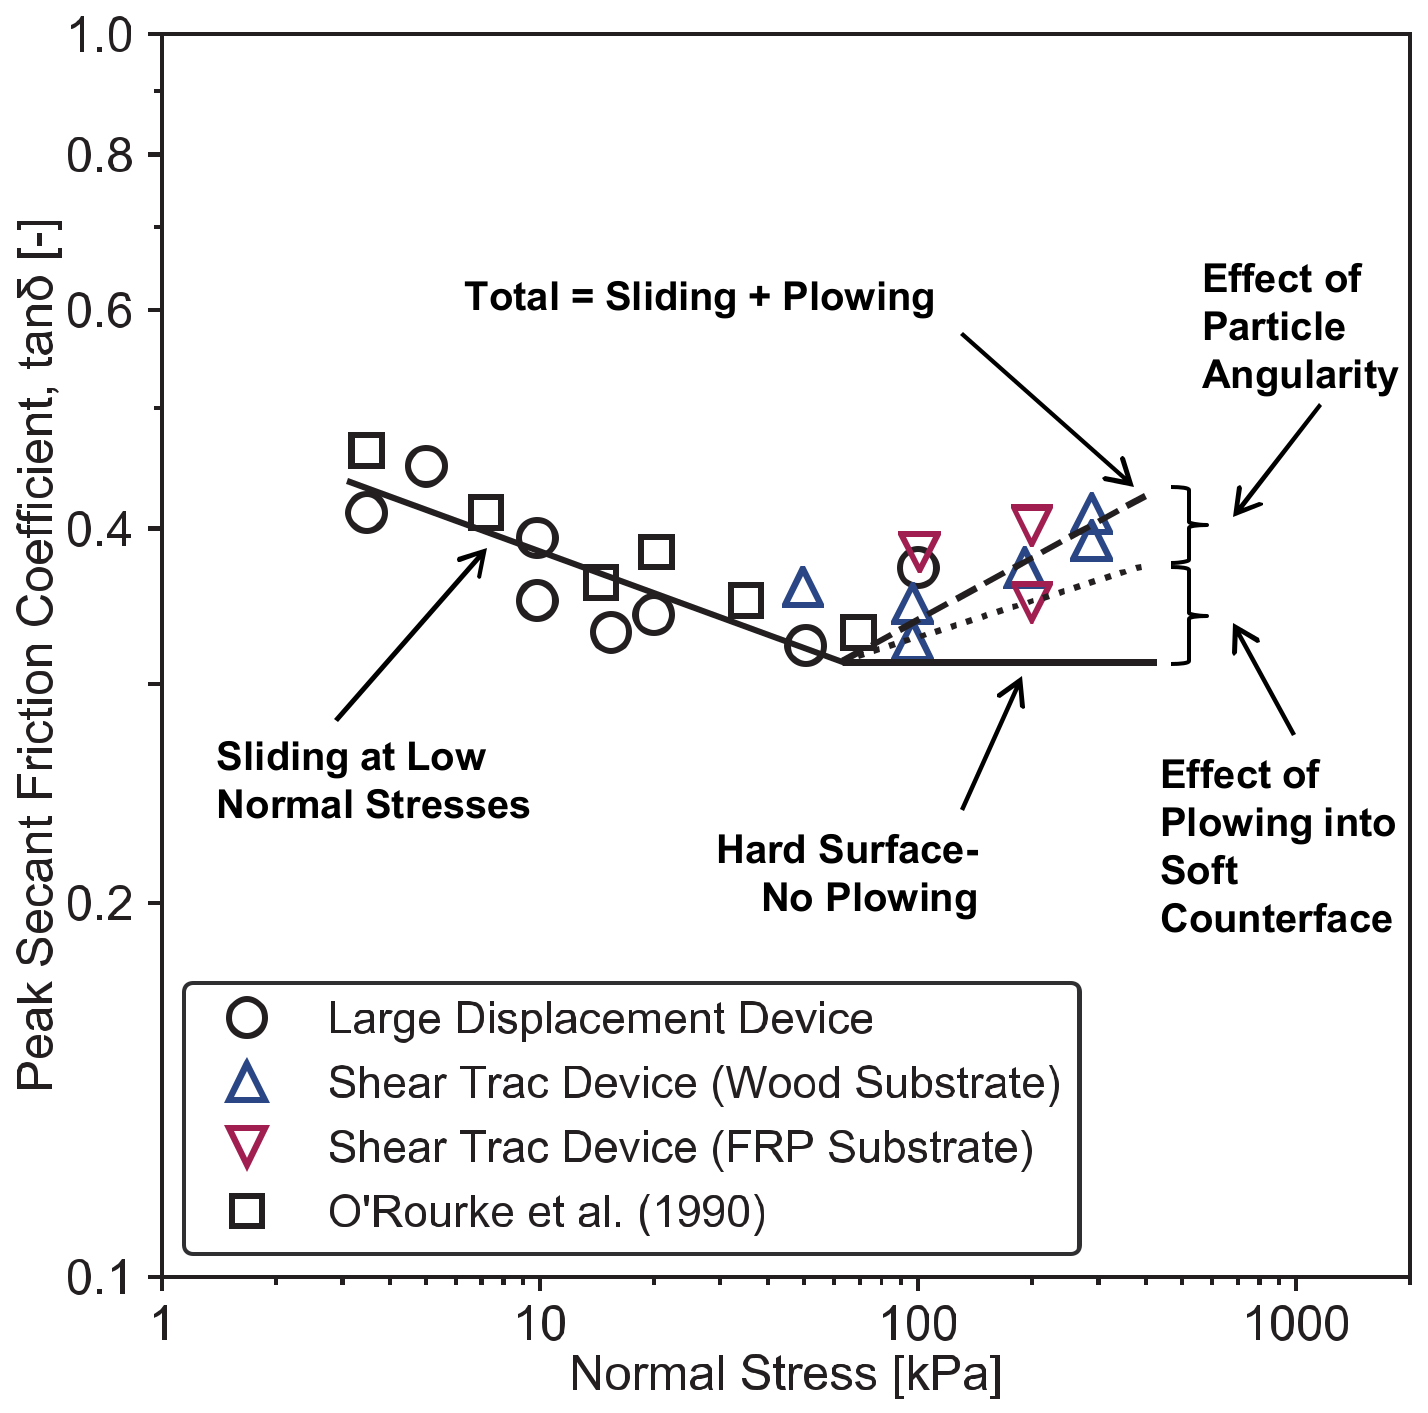
3.3.1. Effect of Normal Stress

From the Mohr–Coulomb criterion, we know that the higher the confining stress, the higher the shear strength of the soil–structure interface. Previous research has several times demonstrated that the normal stress affects the soil–structure interface strength [7,114,116,135,136,139,140]. As shown in Figure 22, for a given structure material and under a low confining stress, the interface shear strength decreases with increasing normal force in the beginning phase [136]. At first, the number of soil particles in contact with the structure and, consequently, the contact surface increases with increasing normal stress; this leads to a decrease of the contact stress of every particle and, therefore, to a decrease of the shear resistance [136]. In this case, sliding without surface damage occurs. When the critical point of vertical stress is attained (Figure 22), any additional increase in normal stress is transmitted to each particle–surface contact because the number of contacts per unit area has reached a threshold [136,139].
When the normal stress exceeds the critical value, sliding and plowing are involved in the particle movement along the interface, the interface friction increases (see Figure 22), and, consequently, the shear strength, too (see Shakir and Zhu [116]) (Figure 23). At a specific initial water content of clay samples, the shear stress increases with increasing normal stress, especially for the interface with higher roughness (Figure 23a).

3.3.2. Effect of Soil Density

The sample density has a significant effect on the interface behavior, especially for sand, because density is related to the distinction between the dilative and contractive response. Generally, dense sand or OC clay shows contraction first then dilatancy during interface shearing, while loose sand or NC clay shows contractive behavior [91,141,142]. In the soil–structure interface test, the soil specimen is usually prepared to a requested density on the structure surface; the higher the soil density is, the higher the total contact number between soil particles and the surface, resulting in a larger interface shear strength during shearing [134,143]. The density of the soil sample can be evaluated by relative density or density index (Dr), according to Nova [91]:
D r = e max e e max e min
where emax and emin are the maximum and minimum void ratios, to define the loosest and densest state of soil.
The Dr of the soil influences the shear strength envelopes (Figure 24). Under a normal stress, as Dr increases, the soil becomes denser, leading to a higher shear resistance of the interface and an increase of the interface friction angle [113].
O′rourke et al. [144] found that sand′s peak interfacial friction angle increases with increasing density (Figure 25). Interface direct shear experiments performed with undisturbed natural clay samples and concrete also showed that the peak shear stress increases with dry density [134]. This increase of the interface shear strength can also be attributed to clay’s densification, which causes higher clay concrete interlocking forces. In this circumstance, the contact between clay particles and concrete surface increased [134].

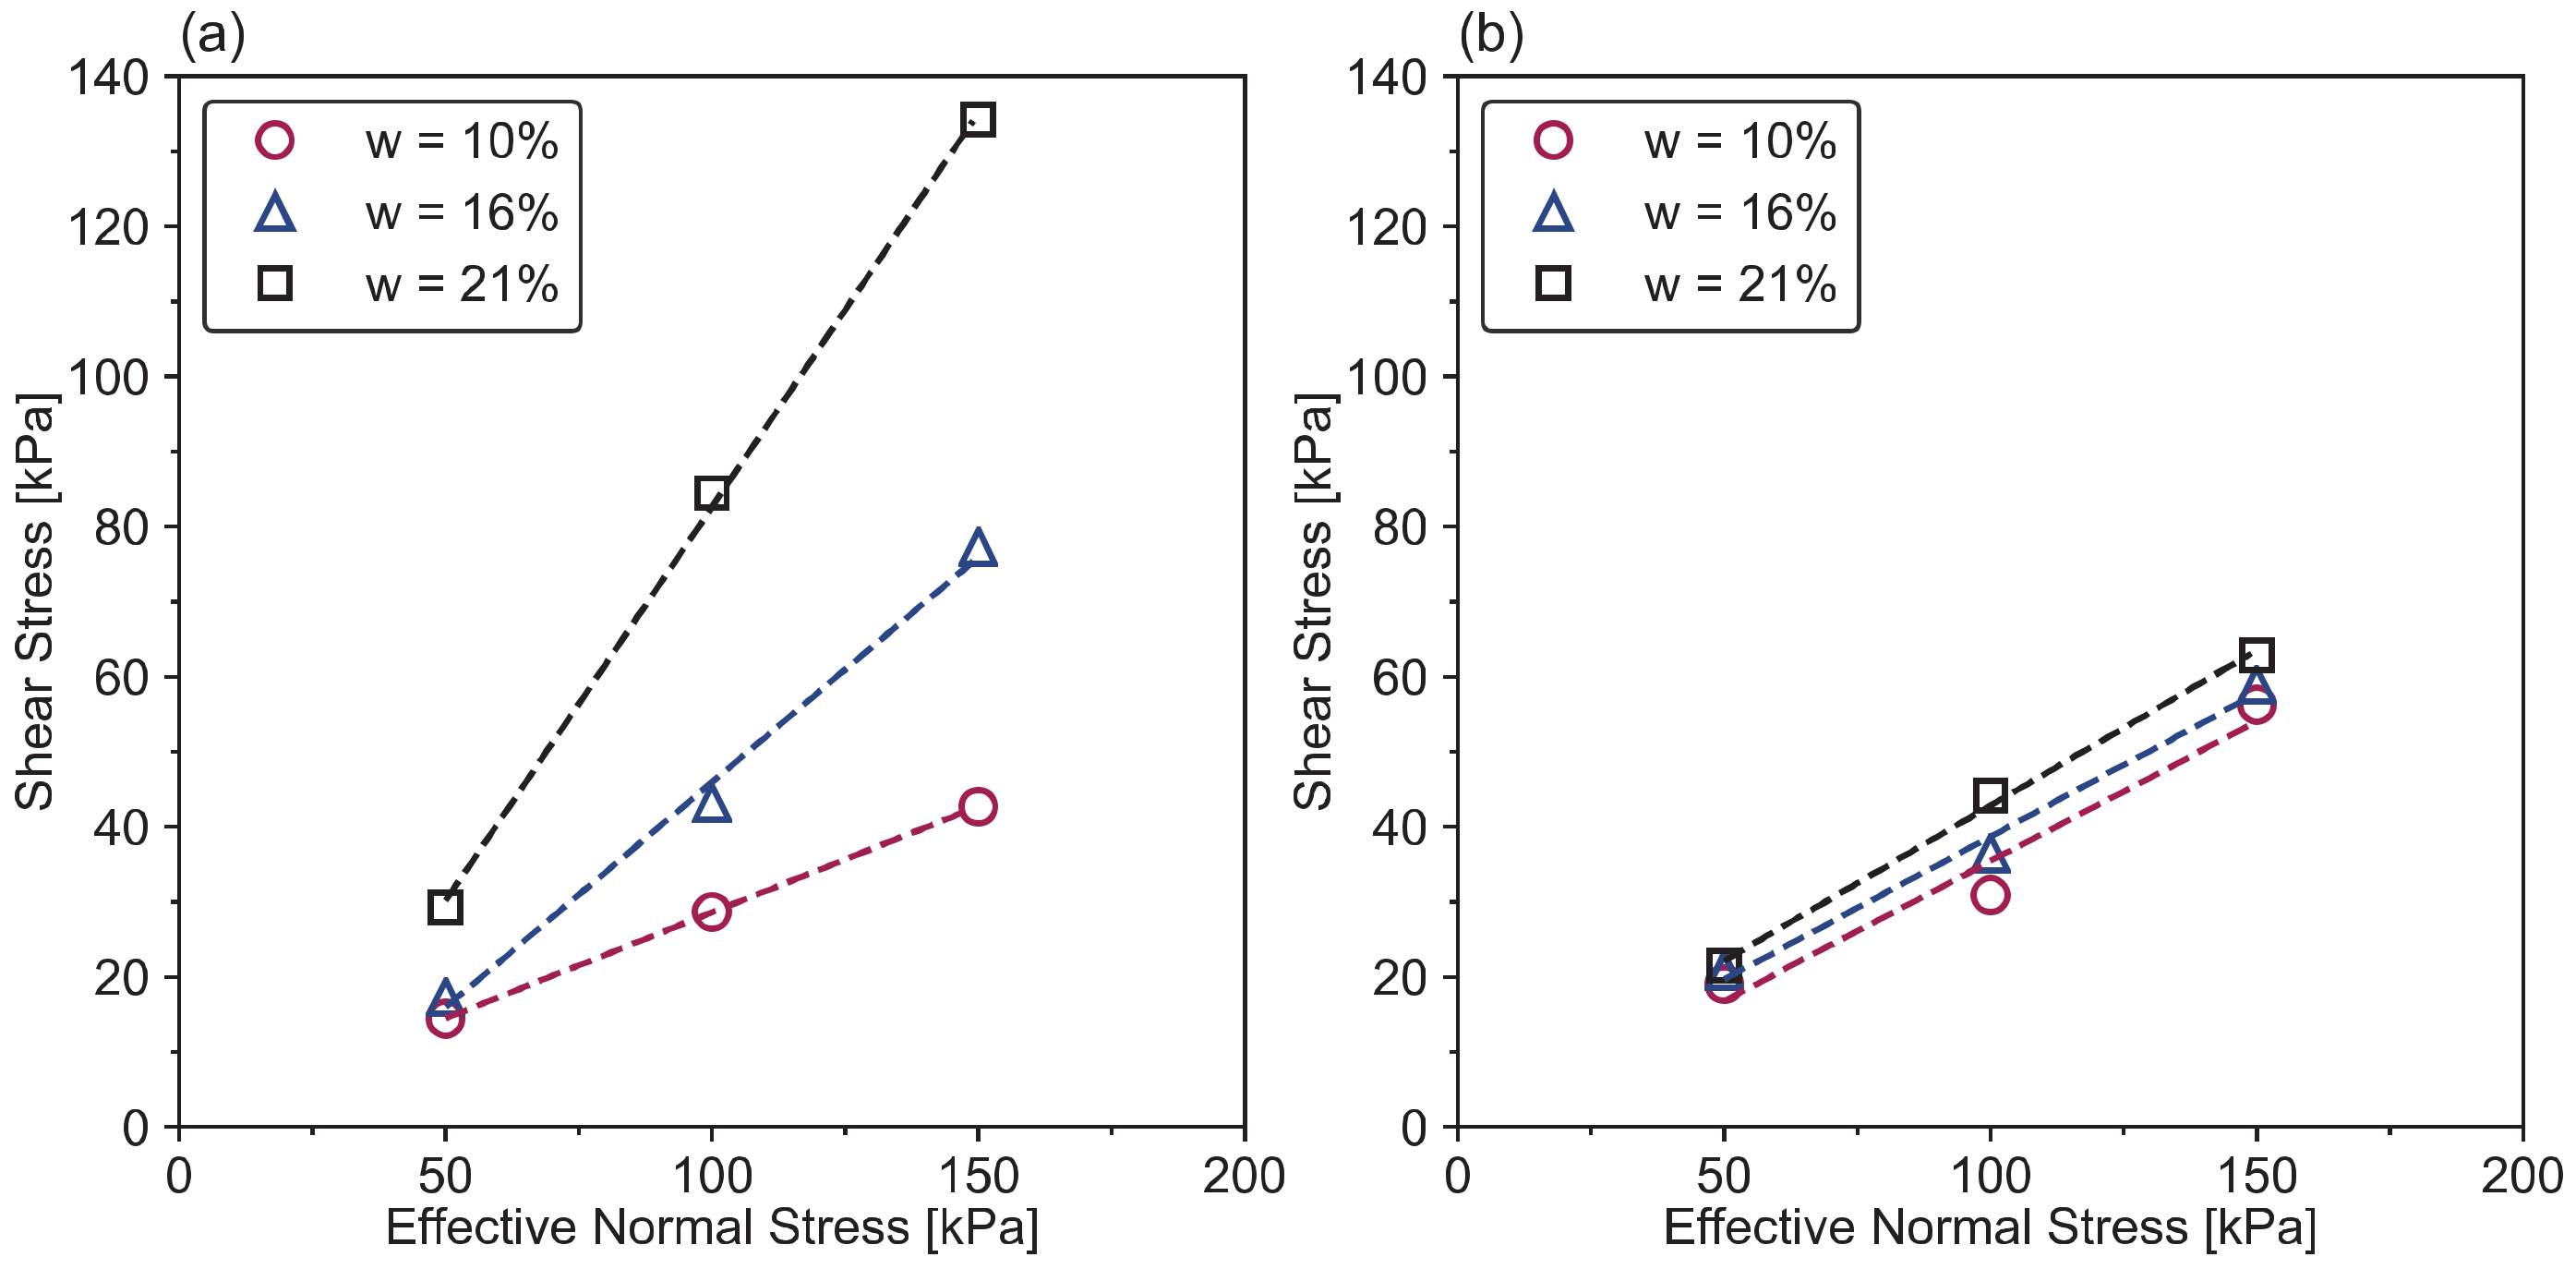
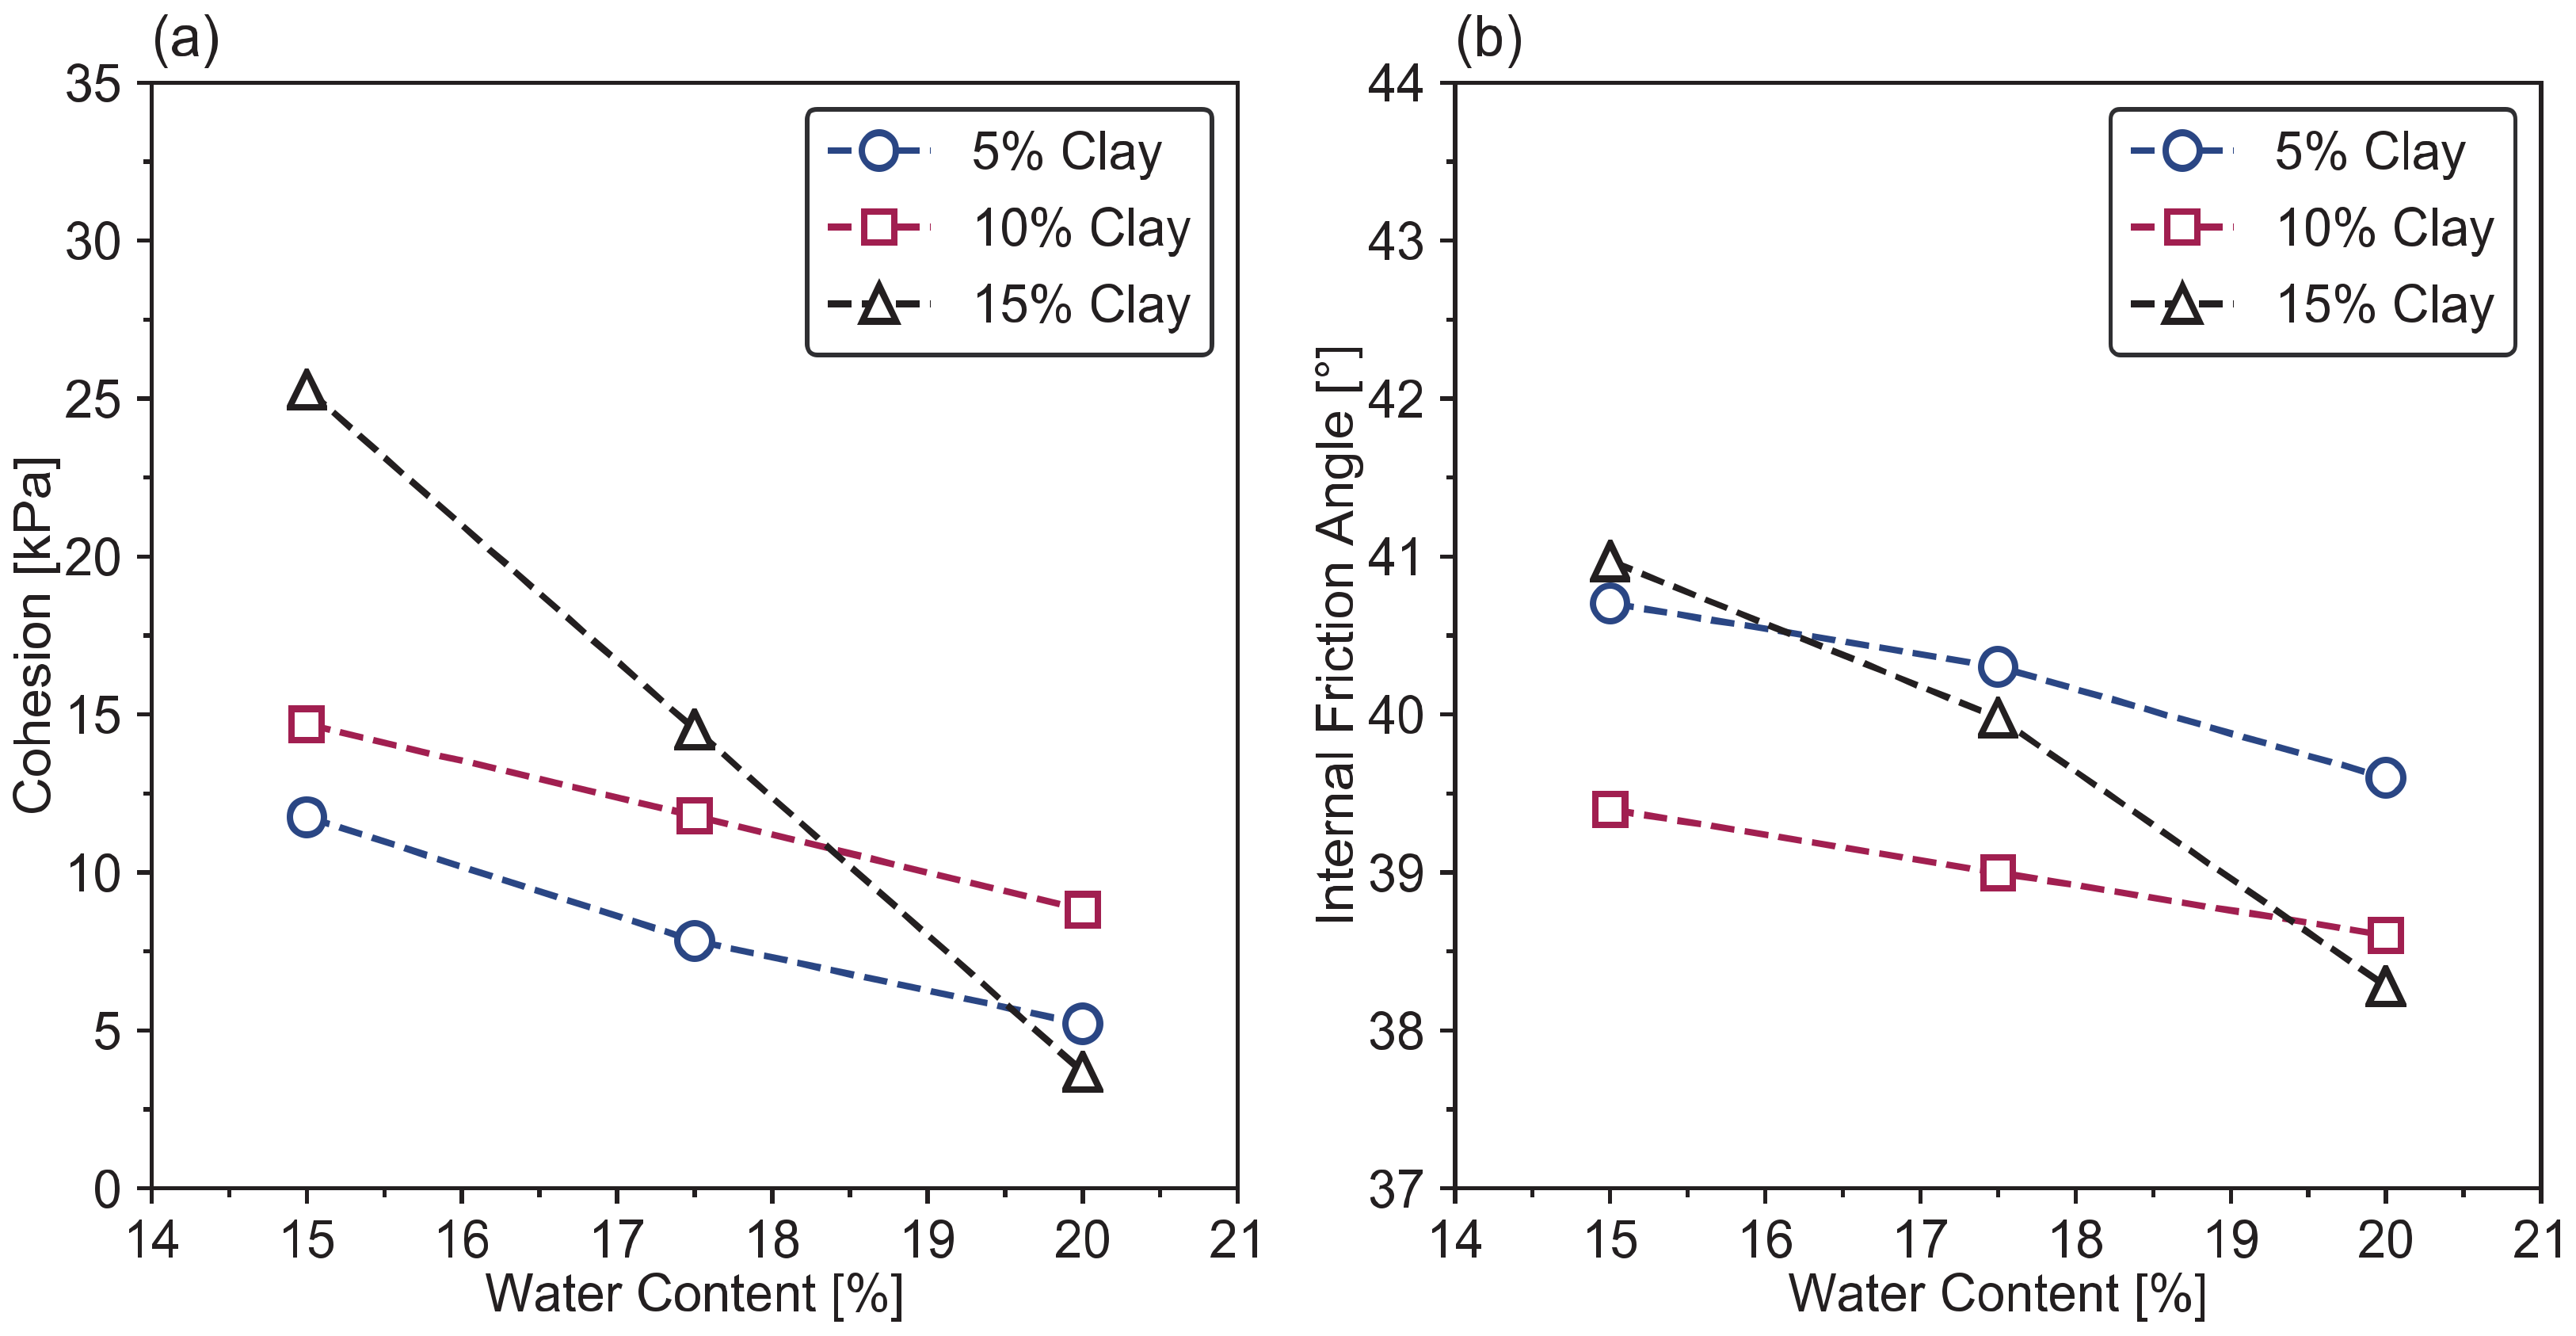
3.3.3. Effect of Water Content

In fully saturated or fully dry conditions, the shear strength of granular soils is similar [103]. However, shear resistance for the wet sand–concrete interface is lower than that of dry sand–concrete [103]. In general, the shear response of clayey soil and clayey soil–structure interface depends on the water content in the samples. When the soil is not fully saturated and at a low water content, water tends to concentrate around the contact areas of soil particles, and its surface tension enhances adhesion among soil particles [91]. Furthermore, the cohesion vanishes if the soil is submerged in water [91]. This is confirmed by results of clay–concrete interface direct shear tests under rough and smooth concrete roughness conditions from Shakir and Zhu [116]. Figure 26 demonstrates that the shear strength of the interface increases when the water content rises for the rough concrete surface. In contrast, for the smooth interface, the rise in the shear strength is not significant. It is owing to the water content of samples related to the area of contact between the clay particles and the concrete asperities that affect the interface shear strength. This result is not in agreement with most of the conclusions from literature, which state that the shear strength decreases when the materials are wetter. For example, Zhang et al. [145] investigated the water content effect on a silty clay–concrete interface, finding that strain softening appears in the shear stress-shear displacement curves when samples with high water content, while elastic–plastic deformation happens in low water content. The shear strength of the interface decreases with increasing water content, while the cohesion increases with increasing water content until a maximum value at a water content of 25%, then it decreases.
In most clay–structure interfaces, an increase of water content in partially saturated conditions implies decrease of strength. A similar trend can be also seen in a direct shear test of a sand–clay mixture. However, exception also exists: strength of clay–structure interface increases with increasing water content (e.g., Shakir and Zhu [116]).

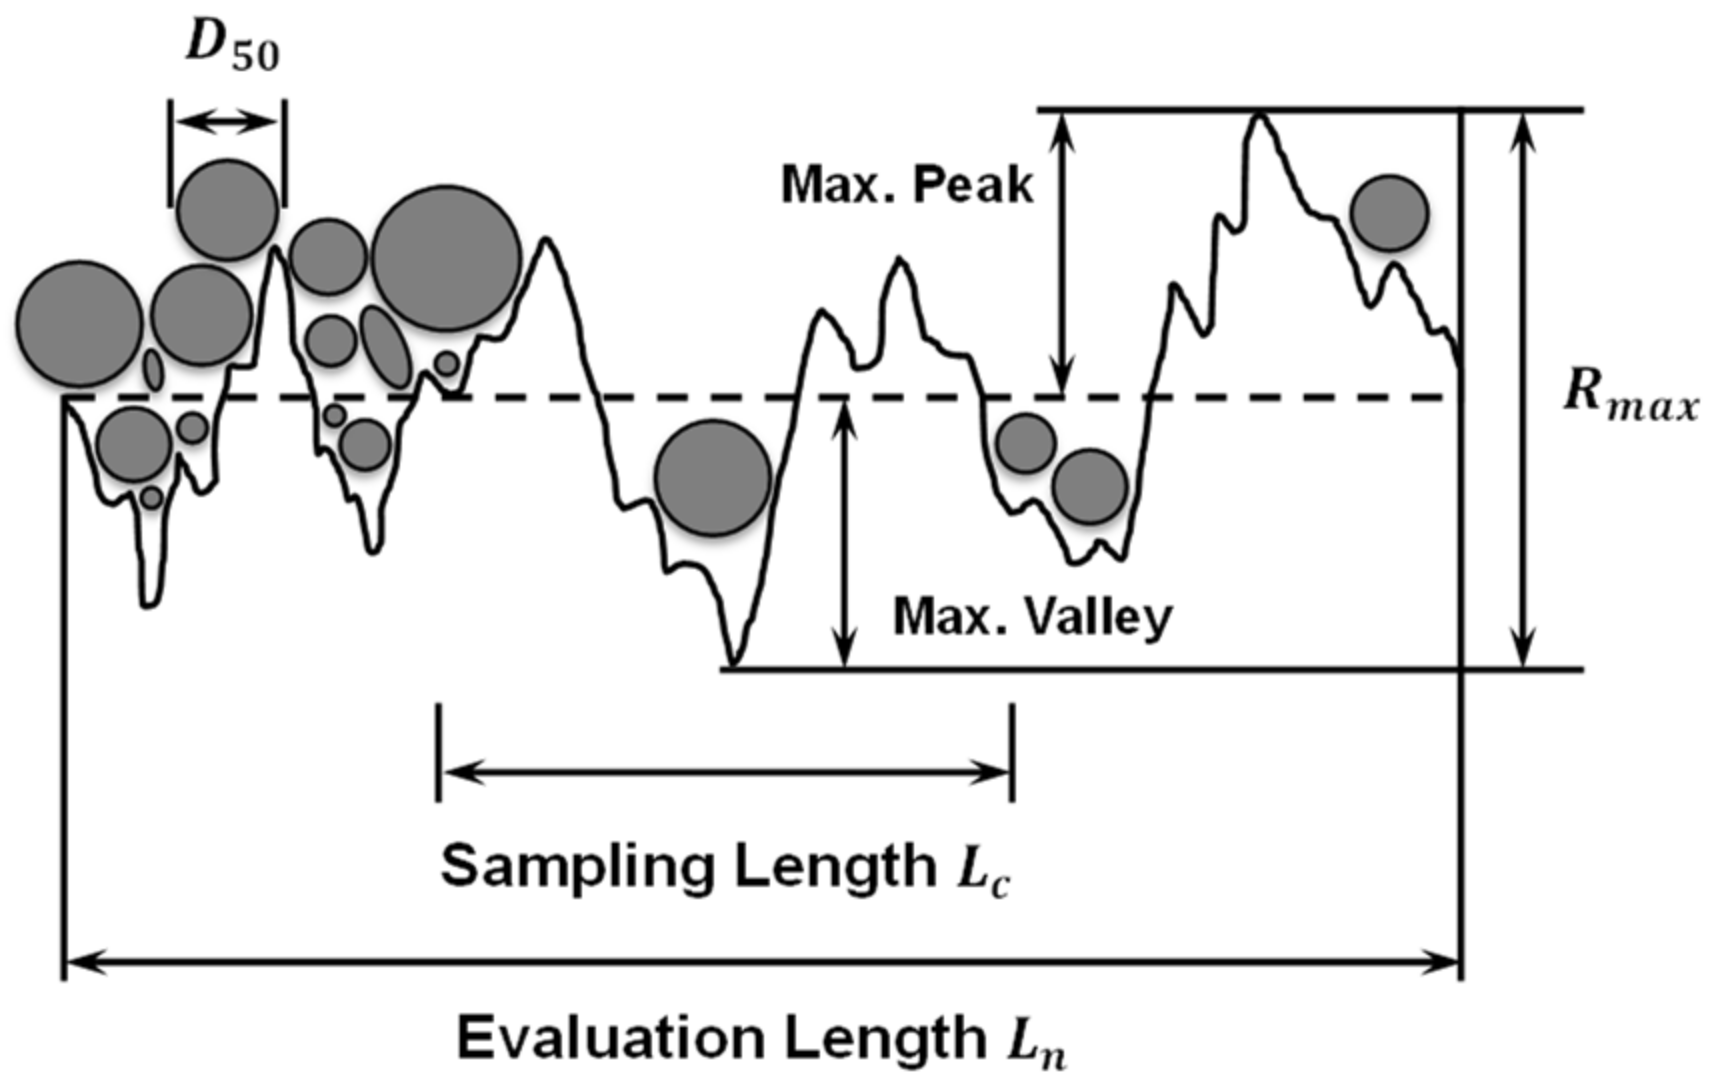
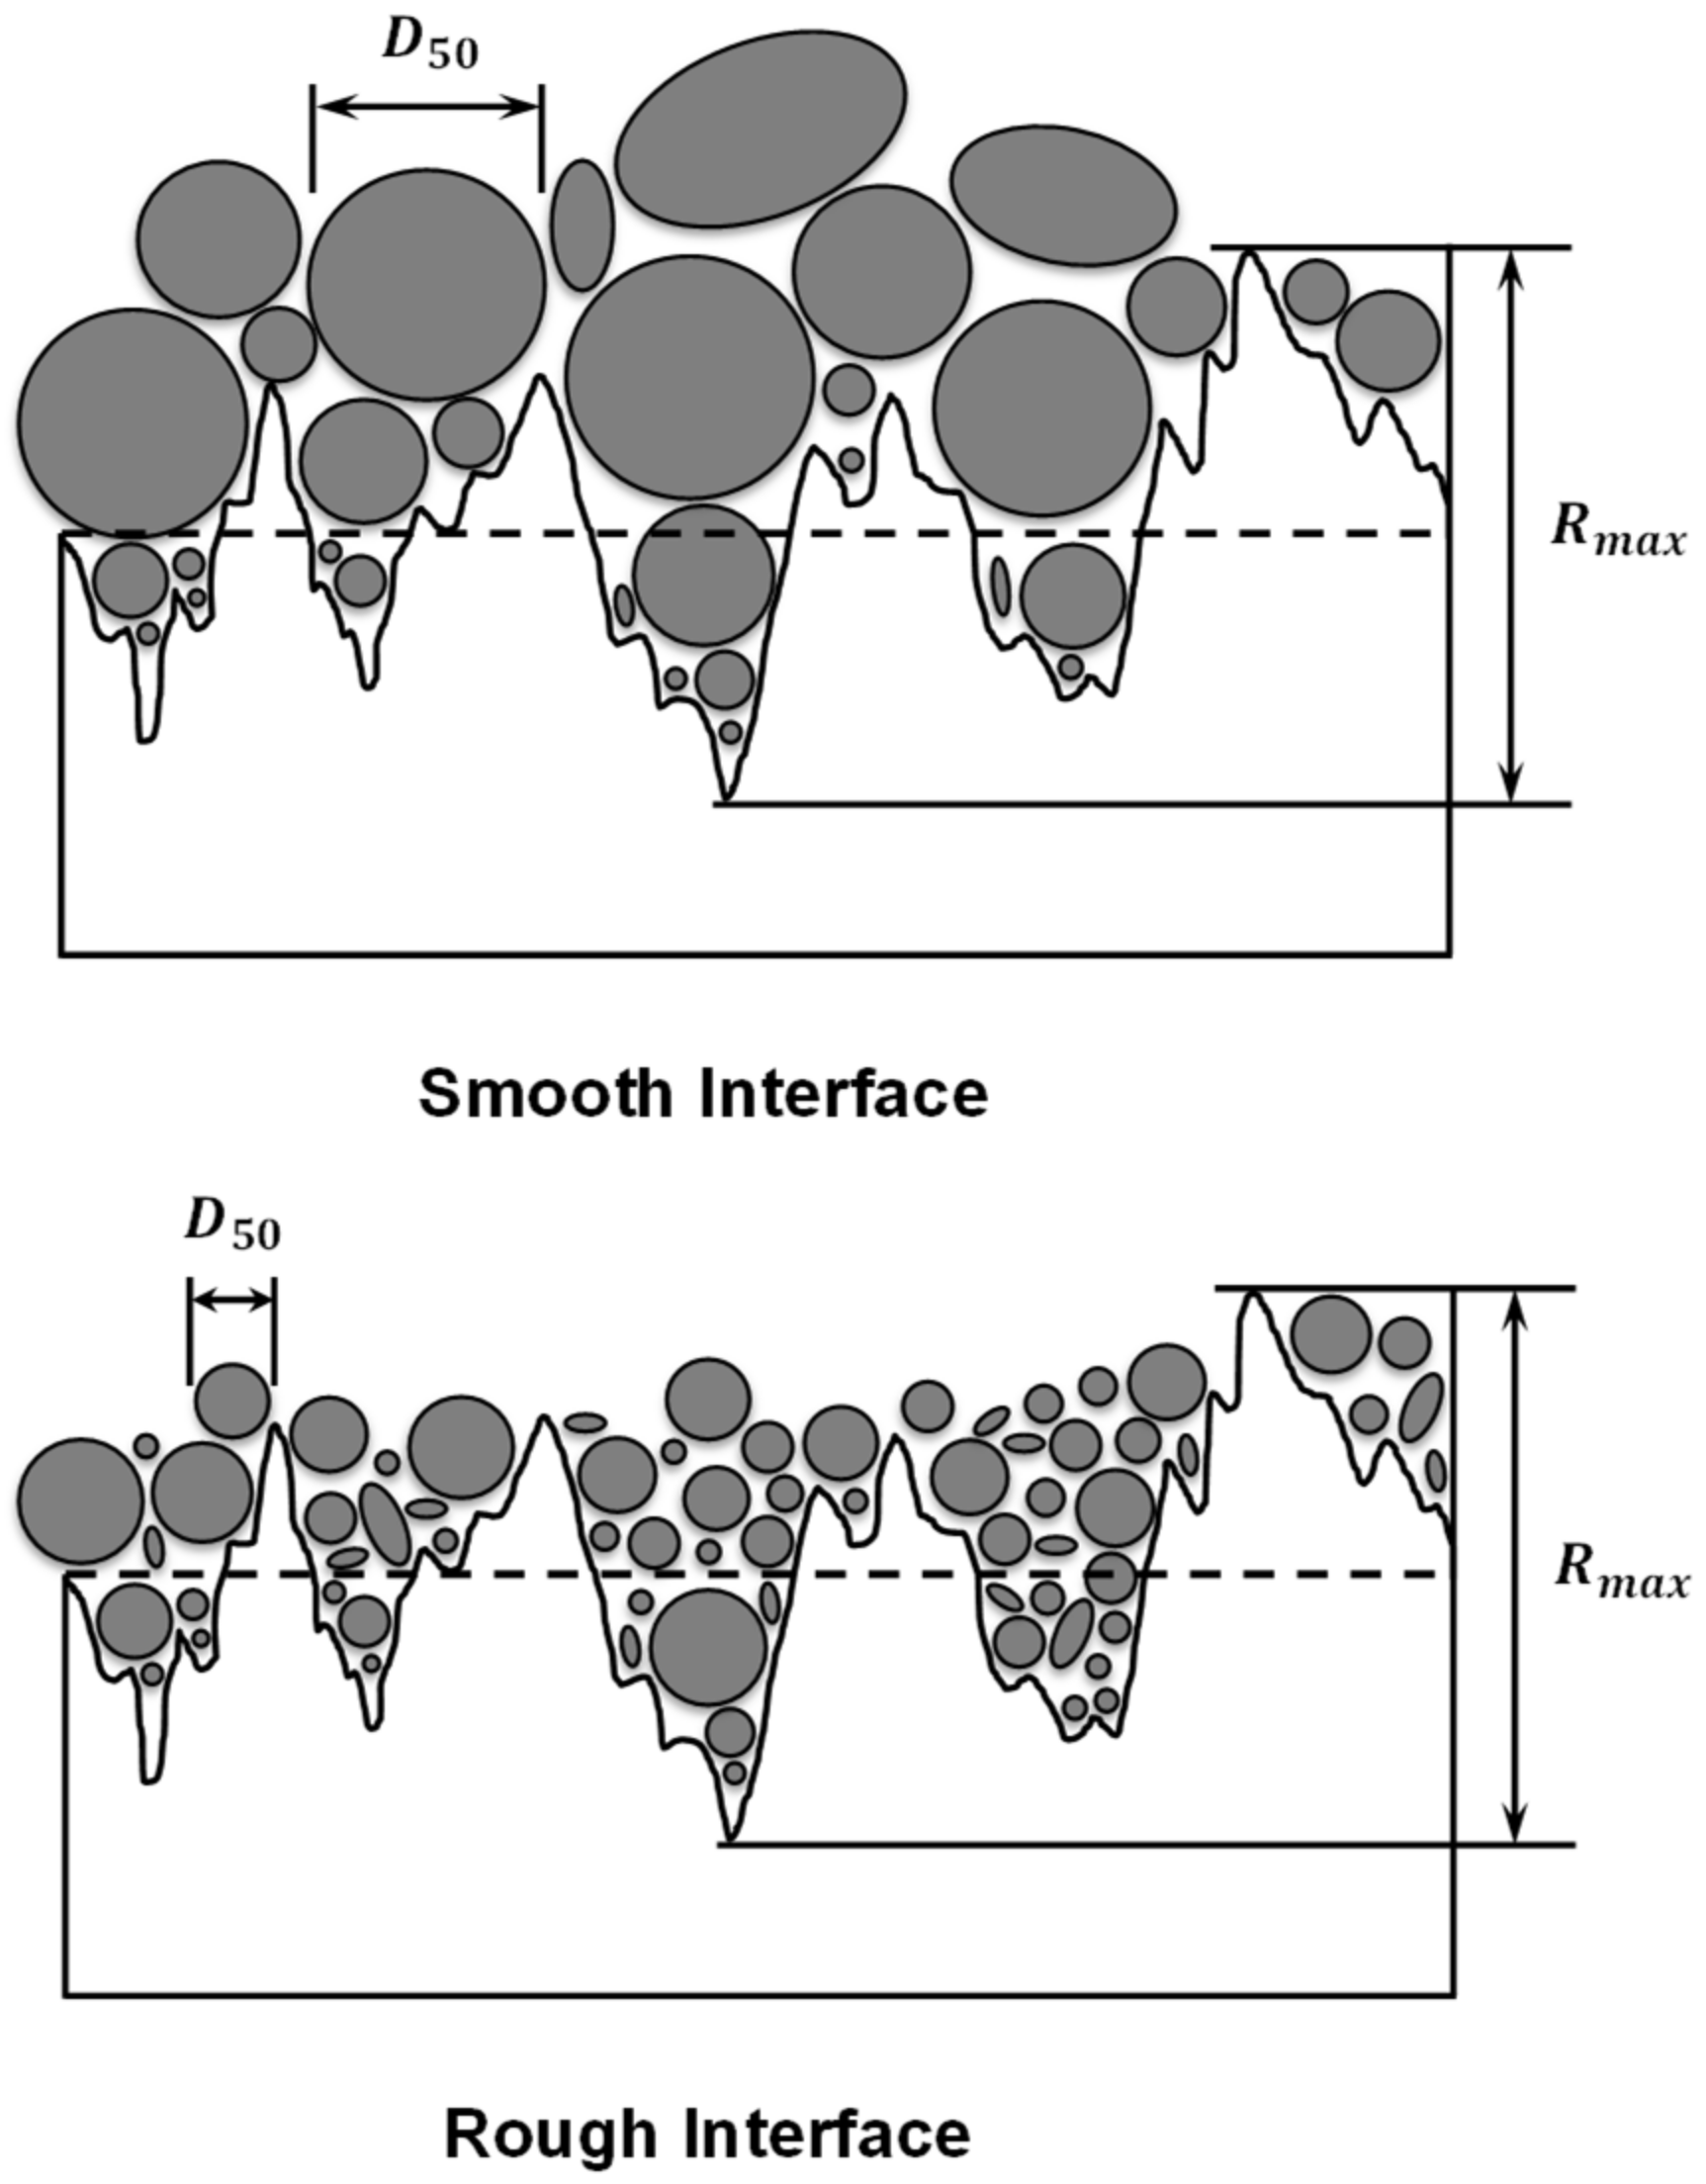
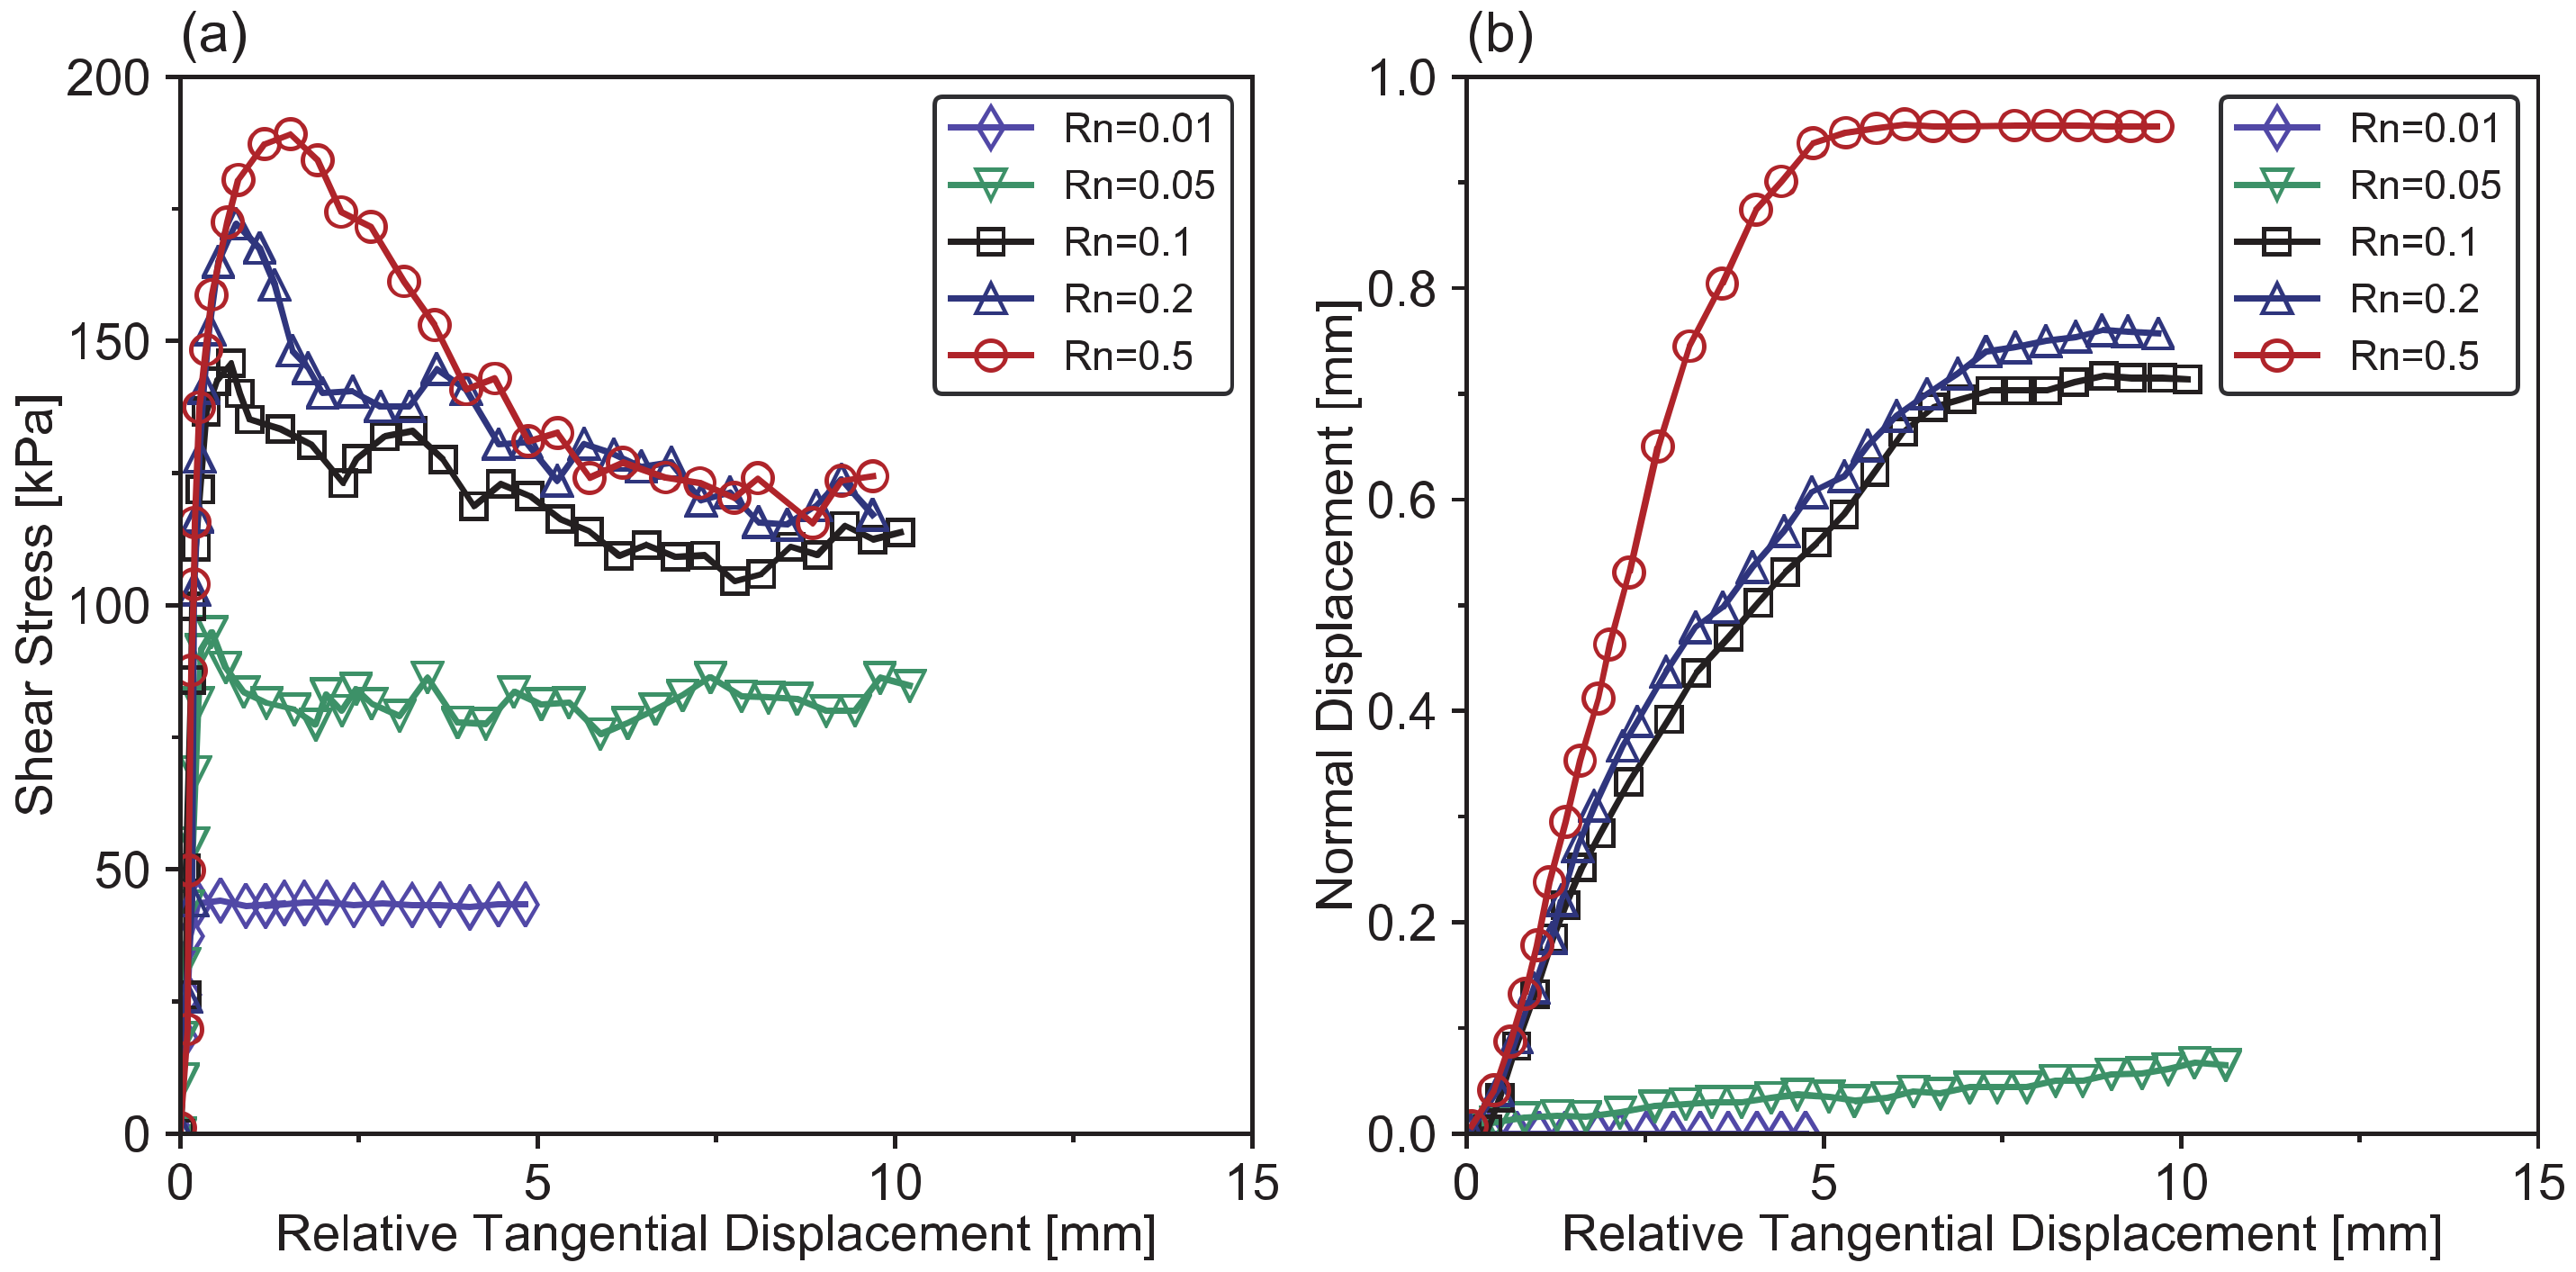
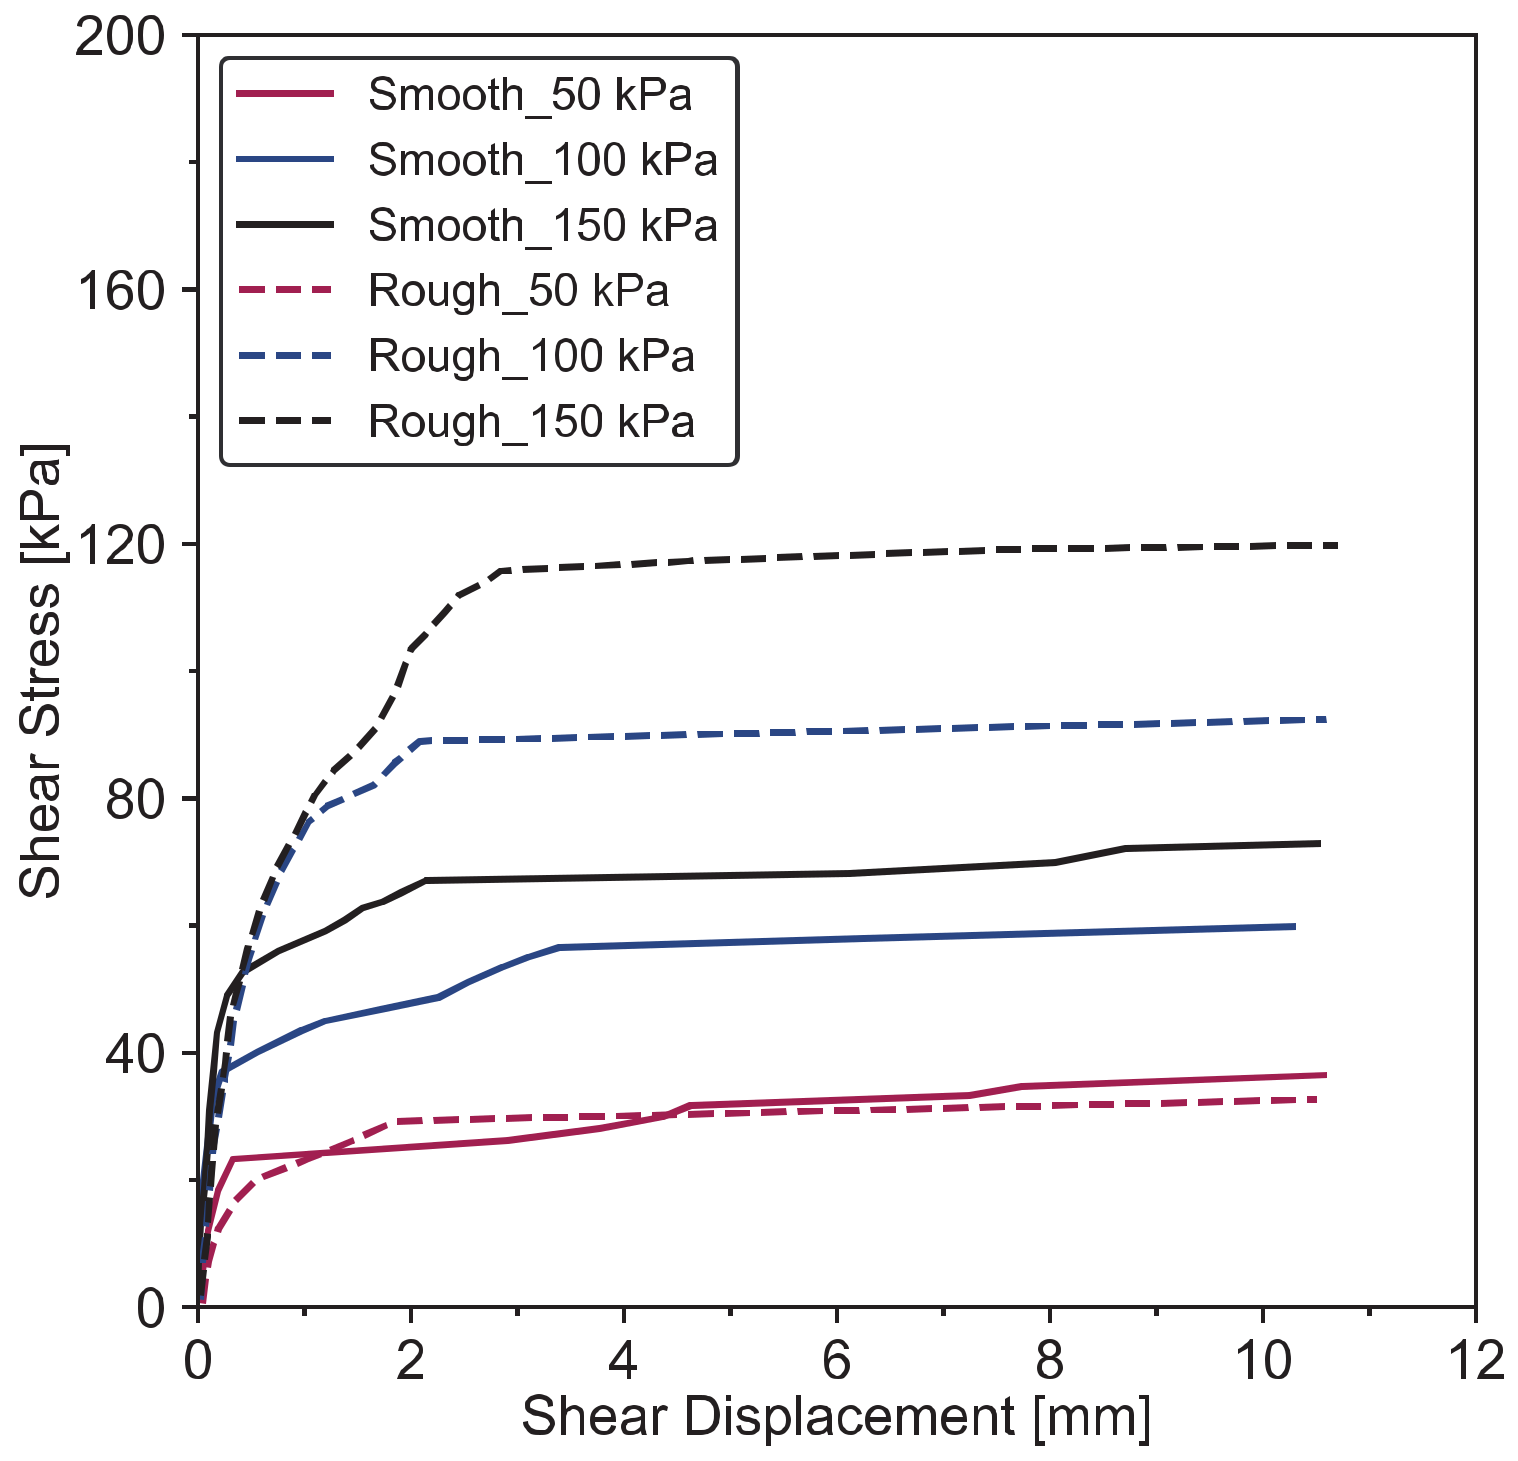
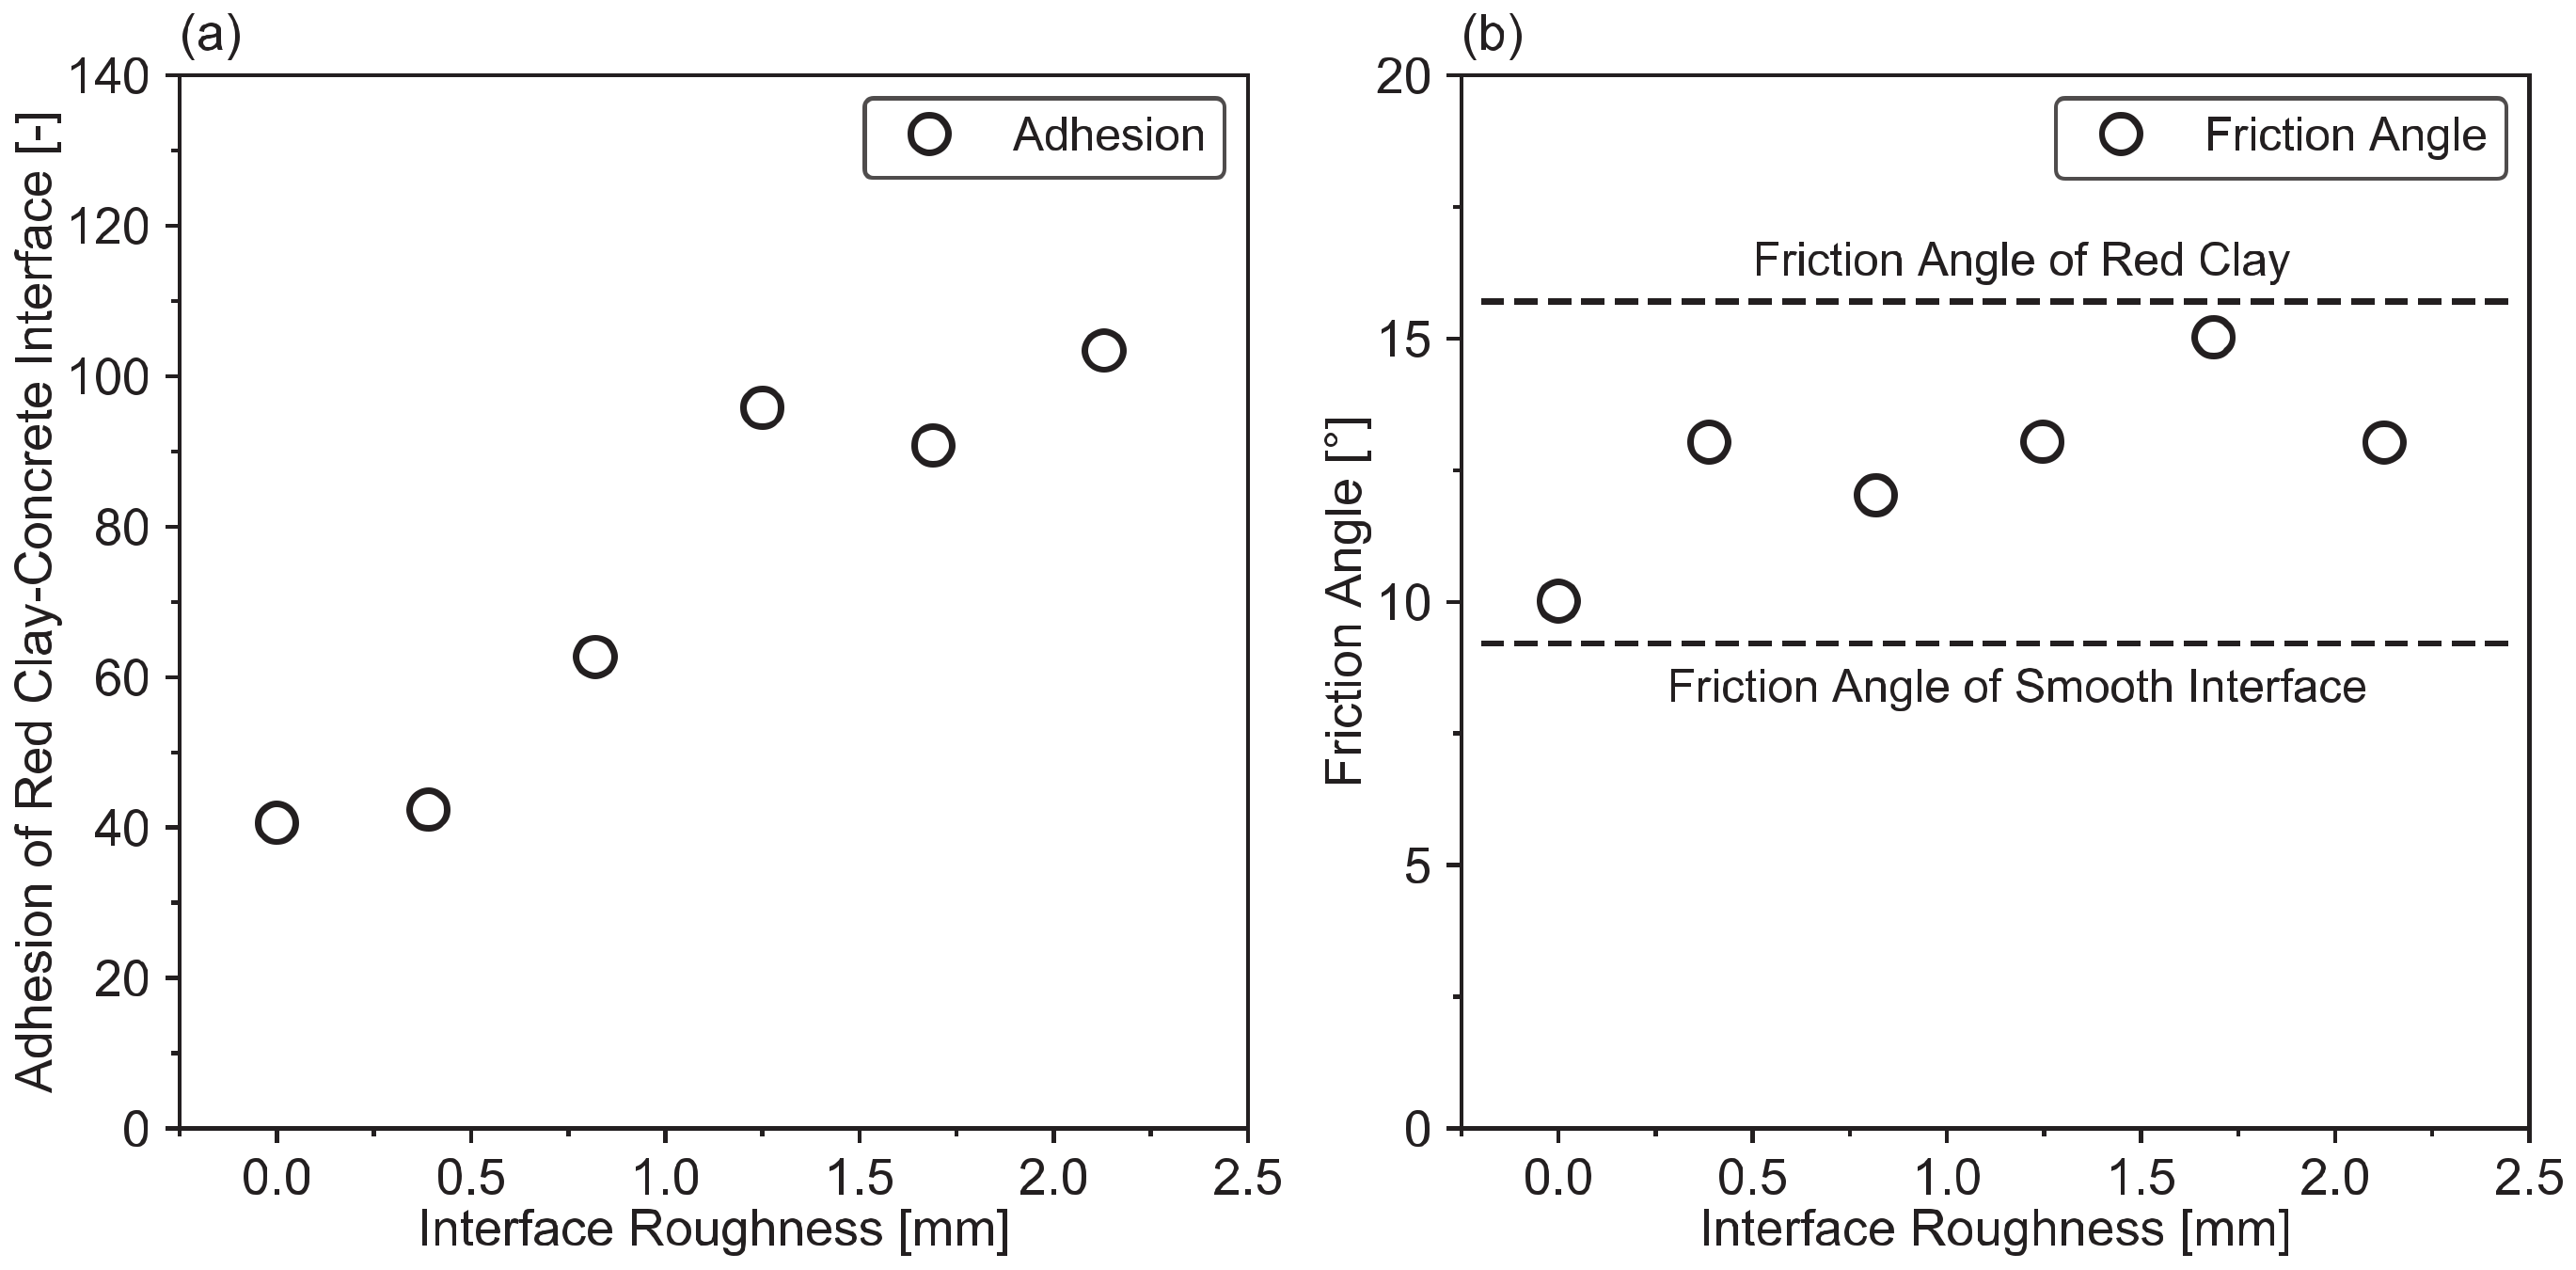
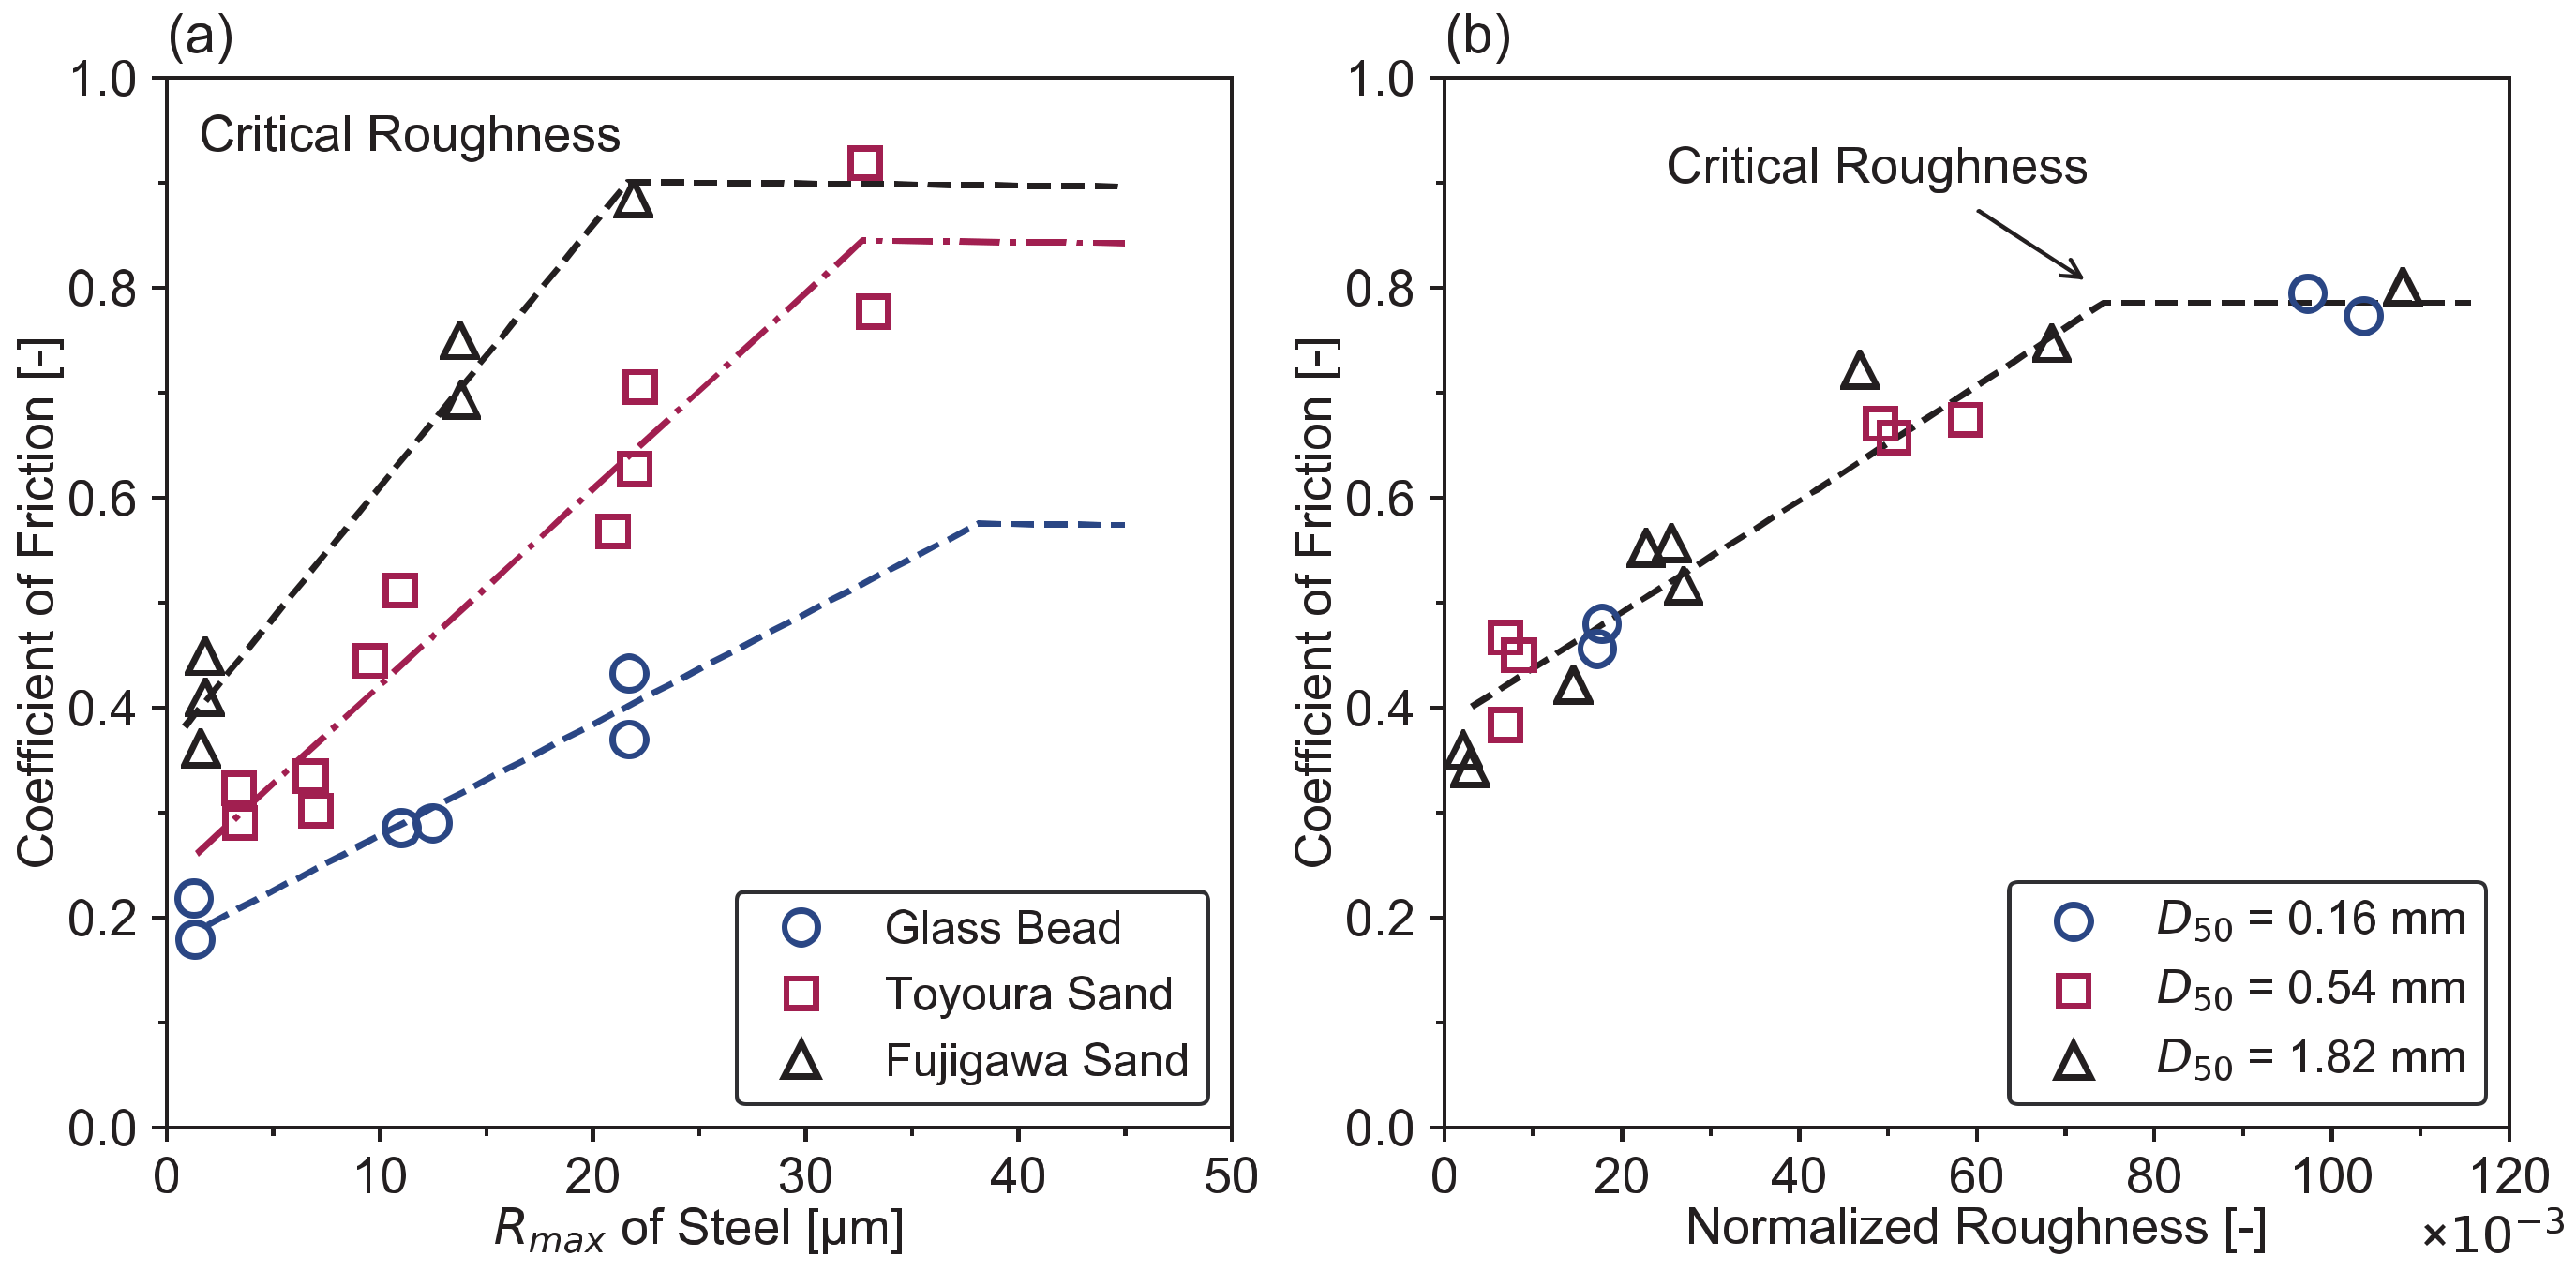
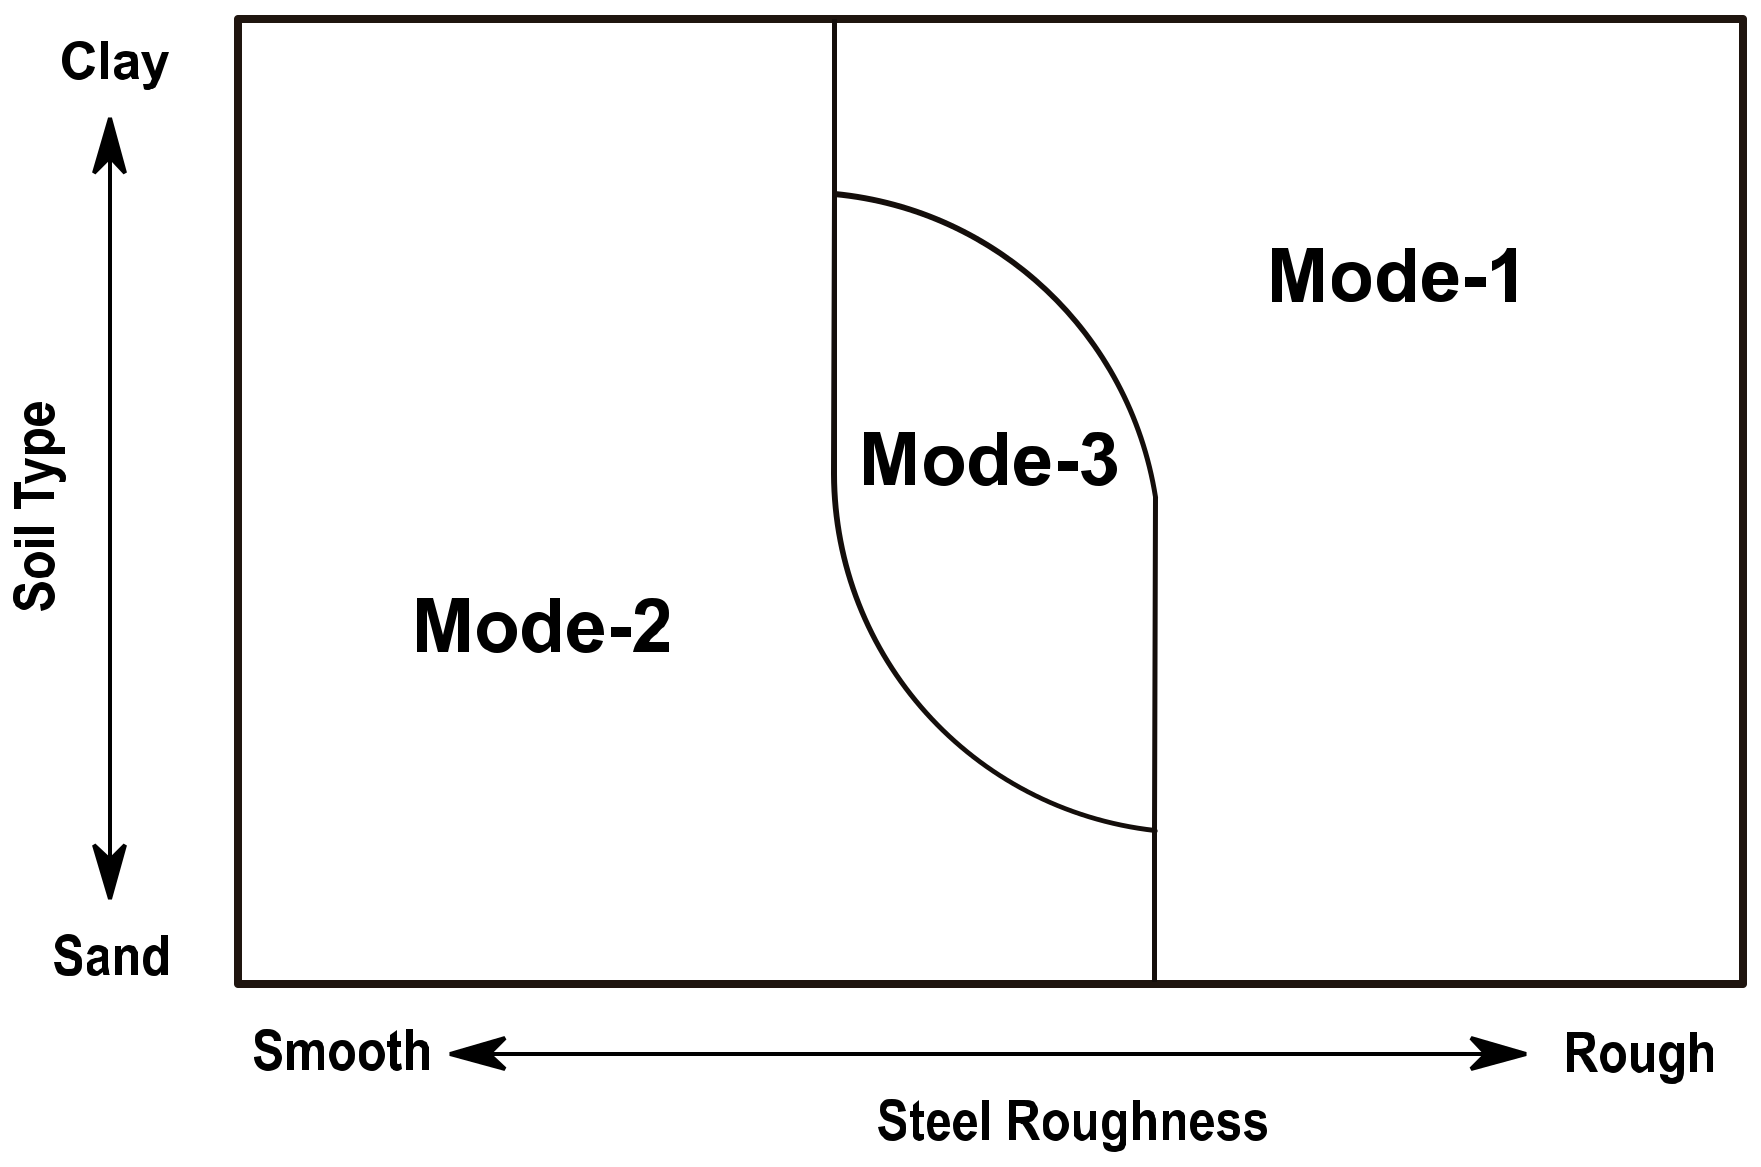
3.3.4. Influence of Interface Roughness

• Effect of roughness
One of the most significant factors that affect the mechanical behavior of the interface is the surface roughness of the structural material [11,21,24,116,118,136,146,147]. Surface roughness is often called roughness, for short, which is a component of surface texture. Amplitude parameters, employed to estimate the vertical surface deviations [148], are the most critical indicators to characterize surface roughness.
As previously mentioned, Potyondy [111] first performed a series of tests on soil–structure interfaces to determine the magnitude of interface friction angle. He concluded that surface roughness highly affects the friction angle and the adhesion of the interface and published a database of interface friction angles for different granular cohesive soils and structural materials with a smooth or rough surface. Following this work, Uesugi and Kishida [147] conducted a systematic study on how the roughness affects the interface shearing resistance between dry sand and mild steel and proposed the normalized roughness Rn:
R n = R max D 50
as an indicator of surface roughness. In Equation (17), Rmax is the peak-to-valley height (see Figure 27), which can be gained by measuring the maximum vertical distance between the highest and lowest peak of the structure asperities along an evaluation profile length Ln [147,148,149]; D50 is the mean grain diameter of the soil. The normalized roughness Rn takes both the structural surface and the soil grain diameter into consideration for evaluating the interface roughness and can better reflect whether the surface is smooth or rough, as illustrated in Figure 28. As can be seen in Figure 28, several soil particles become stuck in the valleys when the D50 is less than the Rmax, which will reduce the roughness (Rmax) of the interface, since the particles stuck in the bottom of the valleys are not mobilized during interface shearing.
Following this approach, researchers performed interface direct shear tests with different types of soils and structural materials, considering the normalized roughness [11,108,136,146,150,151] or other roughness parameter such as Rmax [19,127,152] or Ra [16,22,24,153]. Ra is the arithmetic average of the absolute values of the profile heights over the evaluation length along the center line (also called center line average roughness). More details about the different roughness parameters can be seen in ISO [149] and Gadelmawla et al. [148].
The shear strength and the vertical deformation of the sand–structure interface vary with the interface roughness. The results obtained by Porcino et al. [105] on a dry, dense sand–aluminum interface with an interface direct shear apparatus are reported in Figure 29; three aluminum plates with varying Rn values were tested with CNL condition. The results indicated that the shear stress of the rough interface was higher than that of smooth interface, and both of them were lower than the shear strength of pure sand (Figure 29a). Additionally, the dilative response of the interface increased with increasing normalized interface roughness, and normal displacements of the interface were much smaller than the one of pure sand (Figure 29b).
Hu and Pu [11] performed direct shear tests on dense sand–steel interfaces under CNL of 50 kPa, 100 kPa, 200 kPa, and 400 kPa, respectively, showing that higher peak shear stresses correspond to higher Rn (Figure 30). This finding was confirmed by D’Aguiar et al. [150]: the higher Rn, the higher the mobilized peak friction angle and the dilatancy. However, there are no data of Rn larger than 1.0 (in Figure 29 and Figure 30) to show what happens when D50 is much smaller than the Rmax.
Similar results can be found in clay–structure interface tests. Shakir and Zhu [116] performed interface simple shear experiments between compacted clay and two types of concrete plates with different surface roughness. Results showed that higher shear strength occurred for the rough surface (Figure 31). Rouaiguia [16] carried out interface direct shear tests on different clay sheared against glass and sandstone rock. He pointed out that the smooth interface of clay–glass showed lower strength values, which can be explained by the different particle orientations along the interface zone caused by different roughness of the interfaces.
In general, the shear strength of a soil–structure interface is lower than or at most equal to the shear resistance of the soil [103]. Shear resistance of soil–structure interface is relatively constant at lower values of interface roughness [21,153]. It can be attributed to the shear failure plane that slips along the smooth structure surface during shearing. Numerous research results concluded that the interface shear strength increases with increasing surface roughness and becomes closer to that of the soil [21,24,116,118]. This can be explained by the fact that shear failure initiates in the soil–structure interface zone rather than on the structure surface. However, the rougher interfaces still exhibit smaller shearing strength than the soil (see Figure 32), but stronger shearing strength than the smooth interface. According to a previous publication [150], in the case of rough interfaces, more soil grains stay in the surface valleys, like in Figure 28; thus, soil in the interface zone and the structure can be considered as a whole and the shear response gets closer to the results of soil in the direct shear test. For instance, experimental results of the interface between cohesive sand–clay mixture (100% and 60% clay) and steel from [152] showed that the friction coefficient of the interface increases with the steel surface roughness (Rmax) and finally becomes nearly equivalent to that of the soil (Figure 32).
A series of large-scale direct shear tests were carried out using different red clay against concrete by Chen et al. [21], as presented in Figure 33. Results indicated that the adhesion and the interface friction angle increased with increased concrete surface roughness. Comparing the results of interface friction angle from Tsubakihara et al. [152] and Chen et al. [21], the results in Figure 33b present, however, a different trend from Figure 32, i.e., an overall increasing trend but with fluctuations. This is caused by different soils (sand–clay mixture and red clay) and structural materials (steel and concrete). Moreover, according to the research on the kaolin clay–steel interface, the surface roughness can change the failure mechanism at the clay–steel interface and alter the thickness of the shear zone [24].
In addition, the roughness and the normal stress can change the position of the shear failure plane. The failure plane may exist in the soil (i.e., soil-to-soil shearing) when it is subjected to a rougher interface, whereas in the case of a smoother interface, the shear failure plane always sits on the structure′s surface. However, increasing the normal stress weakens the effect of roughness on the interface shear resistance because of the confining effect [21].
• Critical roughness and shearing modes
A critical roughness value exists that considers both structure materials and soil parameters, and it can be used to distinguish a smooth interface from a rough one. A relationship between surface roughness and interface friction was identified through tests performed on a series of sand–steel interfaces by Uesugi and Kishida [147] and Uesugi and Kishida [146]. Using the Rmax or the normalized roughness Rn, they showed that below a certain “critical” roughness (Figure 34), the interface shear resistance showed a linear increase proportional to the surface roughness with the primary mode of failure being that of particles sliding along the surface; in other words, the interface response was elastic-perfect plastic at this stage. At the critical surface roughness, where the interface shear resistance becomes closer to the internal soil shear strength, shearing localization transfers into the adjacent soil body. Above the critical surface roughness, the coefficient of friction is essentially constant and there is no additional effect of an increase in surface roughness, see Figure 34 (similar results can also be found in the literature [2,10,11,147,152,154]).
Following this work, Tsubakihara and Kishida [118] identified a critical roughness for the soil–structure interface in terms of Rmax, and they pointed out that the critical Rmax for a clay–steel interface is 10 μm [152]. Considering the roughness and the soil type, [152] proposed that the failure modes of the interface can be categorized into three modes, as illustrated in Figure 35, depending on the value of Rmax:
  • Mode-1: The interface is rough; hence, shear failure occurs in the soil body.
  • Mode-2: The interface is smooth, and full sliding occurs along with the interface.
  • Mode-3: The shear failure and sliding occur simultaneously at the interface part.
This classification was confirmed through observations and measurements obtained by Particle Image Velocimetry (PIV) [10,122]. In the sand–steel interface direct shear tests of Hu and Pu [11], the results also indicated a critical normalized roughness Rcr = 0.1 of the sand–steel interfaces. As for threshold values of the Rcr for sand–structure interfaces, some researchers indicated that it varies in the range of 0.06~0.3 [11,20,104,118,128,146,147,155].
Though the normalized roughness Rn was proposed to evaluate the granular materials against structure interfaces, it was often used in clay–structure interface shear tests as well [2,15,103,156]. However, few results are available in the literature concerning the identification of similar critical roughness for clay–structure interfaces. Apparently, for clay–structure interfaces, even a very smooth structural surface will exceed the limit of critical roughness, if this last is defined similarly to granular materials, since clay has a tiny particle size [103]. Additionally, shearing at the clay–structure interface involves clay particle reorientation within the interface shear zone, which is different from the shearing mechanism of the sand–structure interface associated more with grains rotation or rearranging in the interface zone [20]. In this sense, the critical roughness values for the sand–structure interface are questionable for the case of clay. For example, in the research of clay–concrete interface implemented by Yazdani et al. [20], though the Rn adopted for assessing the concrete surface varied between 0.88 and 5.38, it should be classified as “rough” according to the range of critical roughness reported for sand–structure interface in the literature. Maghsoodi [15] used the Rn in the kaolin clay–steel interface direct shear tests and chose the critical roughness (Rcr) in a range of 0.1~0.13 for the kaolin clay–steel interface test. A comparison between sand–concrete and clay–concrete interfaces was carried out in Di Donna [103] and Di Donna et al. [2]. Different critical normalized roughness was identified in sand and clay cases to judge whether the interface is rough or not (see Table 4). In addition, a Rn of 0.25 was adopted by Wang [156] to study red clay soil (about 0.015 mm of D50) and concrete interface direct shear behavior, considering the concrete plate as a rough surface.
To conclude, the author thought that the critical Rn (0.06~0.3) for sand–structure interfaces was not accurate enough for the clay–structure interfaces. Nearly no attempt has been made to put forward a suitable criterion to present critical roughness values for clay–structure interfaces. In fact, sand–structure interface shearing is known as turbulent shearing, which is associated with particles rolling within the shear zone. Clay–structure interface shearing is known as sliding shearing, which involves particle orientation within the shear zone. The two different shearing mechanisms are attributed to the shape of clay particles being normally platy, while the sand particles are angular or spherical. Therefore, further research on a suitable roughness criterion of the clay–structure interface is needed.
As for the case of granular material, the Ra parameter is also frequently used. Littleton [157] used smooth mild steel with a Ra of 0.18 μm on a cutoff length of 0.84 mm to characterize the adhesion of the clay–steel interface. However, an additional parameter, namely, the time, should be considered when using mild steel, since it is related to the development of corrosion that induces cementation. In Martinez and Stutz [24], the authors considered the Ra = 0.29 μm, 0.94 μm, 99.47 μm of stainless-steel plate as smooth, medium, and rough, respectively. Ra was also adopted to evaluate the surface roughness of the glass, concrete, steel, and sandstone rock in clay–structure interface tests [16]. Li et al. [22] carried out direct shear tests on red clay (D50 ≈ 80 μm) against a porous stone disc with a Ra = 33.92 μm; the porous stone was considered as medium to high roughness. The Rmax of the structure surface was also used in the clay–concrete interface study of Yavari et al. [19]. Chen et al. [21] proposed a modified, poured sand method to evaluate a concrete surface with regular roughness.
• Effect of shearing velocity
In sand–structure interface tests, failure conditions were quickly attained due to the drained conditions; so, the shearing velocity did not have an apparent influence on the shear results. For interfaces with clays, however, the shearing rate can significantly impact the strength behavior. Experimental results revealed that shearing velocity affects the shear behavior of soil [33,158,159,160], since the shearing speed relates to drainage conditions and viscosity effects. The shearing rate effect is similar for soils and soil–structure interfaces [24,133,152,157]. As shown in Figure 36, as the shear rate increases, the response changes from drained to partially drained, then finally to undrained conditions. Complete consolidation occurs at drained conditions, and no excess pore pressure accumulates. At partially drained conditions, partial consolidation happens. At undrained conditions, no consolidation occurs and excess pore pressure accumulates [24,107].
The shear resistance is also influenced by viscosity effects, more apparent at high shearing rates (undrained conditions). In Figure 36, the viscosity effects can be categorized as positive, neutral, and negative, causing the increase, no change, or decrease in the undrained shear resistance, respectively [24]. The shear velocity effects on the soil–structure interfaces have been studied a lot recently [24,133,158,161]. Lemos and Vaughan [133] performed an investigation on the shear behavior of clay–structure interfaces. Results indicated that in undrained conditions, due to the positive viscosity effects, shear rate increase mobilized a higher peak and residual strength. The experimental study of interface direct shear tests with kaolin clay led by Martinez and Stutz [24] shed light on the effects of shearing velocity on the interface shear response (Figure 37) for different interface roughness. Figure 37 demonstrates that, with increasing shear rate, the shear resistance decreases and at the same time and the sample changes from drained to undrained. The shearing velocity has a coupled effect with the surface roughness on the interface shear behavior.
• Influence of temperature
Another factor that affects the behavior of soil–structure interface is temperature. Numerous experiments in the past focused on the shear behavior of sand–structure and clay–structure interfaces under various thermal loadings [2,7,8,15,18,19,20,162,163]. A brief description of the experiments and main results follows.
Xiao et al. [162] performed a series of direct shear tests with controlled temperatures to characterize the influence of temperature on the shearing behavior of silty soil and silty soil–pile interface. The shearing was conducted at a rate of 0.20 mm/min; during the shear stage, the temperature of the soil–structure interface was maintained at 6 °C or 21 °C. At the same normal stresses and water contents, the peak shear strength values of the soil were 30~90% larger than the shear strength of soil–concrete interface. The soil–concrete interface strength increased with increasing temperature. Furthermore, the soil–concrete interface friction angle was slightly smaller than the soil′s, as presented in Table 5.
Di Donna et al. [2] conducted quartz sand–concrete and illite clay–concrete interface tests at different temperatures ranging between 20 °C and 60 °C to investigate the effects of the temperature changes at different imposed stress–temperature paths. According to the results of the experiments, the sand–concrete interface behavior was not affected by temperature changes. This was expected since sand is a thermo-elastic soil and no thermally induced effect is generated during the shear process. On the contrary, for the clay–concrete interface, a temperature increase led to a rise of the interface shear strength, due to the rise of the cohesion of clay and the adhesion between clay and concrete plate. Moreover, during heating, a volumetric contraction was observed for the NC clay, while the friction angle decreased. Thus, the response of the clay–concrete interface varied with temperature, showing an increase of strength at a higher temperature.
A direct shear test to investigate the shear behavior of a kaolinite clay–concrete interface was performed at a temperature range of 5 °C~40 °C by Yavari et al. [19] in drained conditions (shearing velocity of 14 μm/min). Contrary to Di Donna et al. [2], the results of this work highlighted that the effect of the temperature on the interface shear strength is negligible. As indicated by Figure 38a, the impact of temperature on the friction angle was small and the trend was unclear. The cohesion and adhesion measured on clay and the clay–concrete interface were small, presenting no significant variation between 5 °C and 40 °C (Figure 38b).
Wang [156] conducted sand–concrete CNL interface tests under dry condition and clay–concrete interface tests under fully saturated condition, using a direct shear apparatus with thermal control. The samples were sheared in drained conditions under three temperature loadings (10 °C, 24 °C, and 60 °C). The sand–concrete interface response either at high- or low-temperature conditions did not have a noticeable change compared to normal temperature conditions. On the other hand, results of the clay–concrete interface tests showed that the interface shear stress decreased slightly with the drop of temperature. As for the interface friction angle and adhesion, they increased at high temperature while reducing at low temperature.
Carbonate sand and Fontainebleau sand were tested against a concrete plate under constant temperature (8 °C, 13 °C, and 18 °C) and 10 cycles of cyclic temperature (8 °C to 18 °C) loadings in interface direct shear experiments [7,8]. Concerning the carbonate sand, the resulting interface friction angle after each monotonic thermal loading test series was found equal to 35.0°, 34.6°, and 32.4° for 8 °C, 13 °C, and 18 °C (Figure 39a). After a cyclic thermal loading of 10 cycles, the interface friction angle was found to be 34.9° (Figure 39a). The interface friction angle of the Fontainebleau sand–concrete interface after monotonic thermal loading was 25.9°, 26.8°, and 25.4° for 8 °C, 13 °C, and 18 °C, respectively (Figure 39b), and after cyclic thermal loading was 27.9° ± 0.9° (Figure 39c). These values are lower than the internal friction angle of Fontainebleau sand (36.2°). The results illustrated that the influence of monotonic and cyclic thermal loadings is small and rather negligible on the carbonate sand–concrete as well as silica sand–concrete interface properties.
Hence, in general, the temperature does not significantly affect the properties of the sand–structure interface, while for a clay–structure interface, the thermal effect cannot be ignored. The following conclusions were drawn:
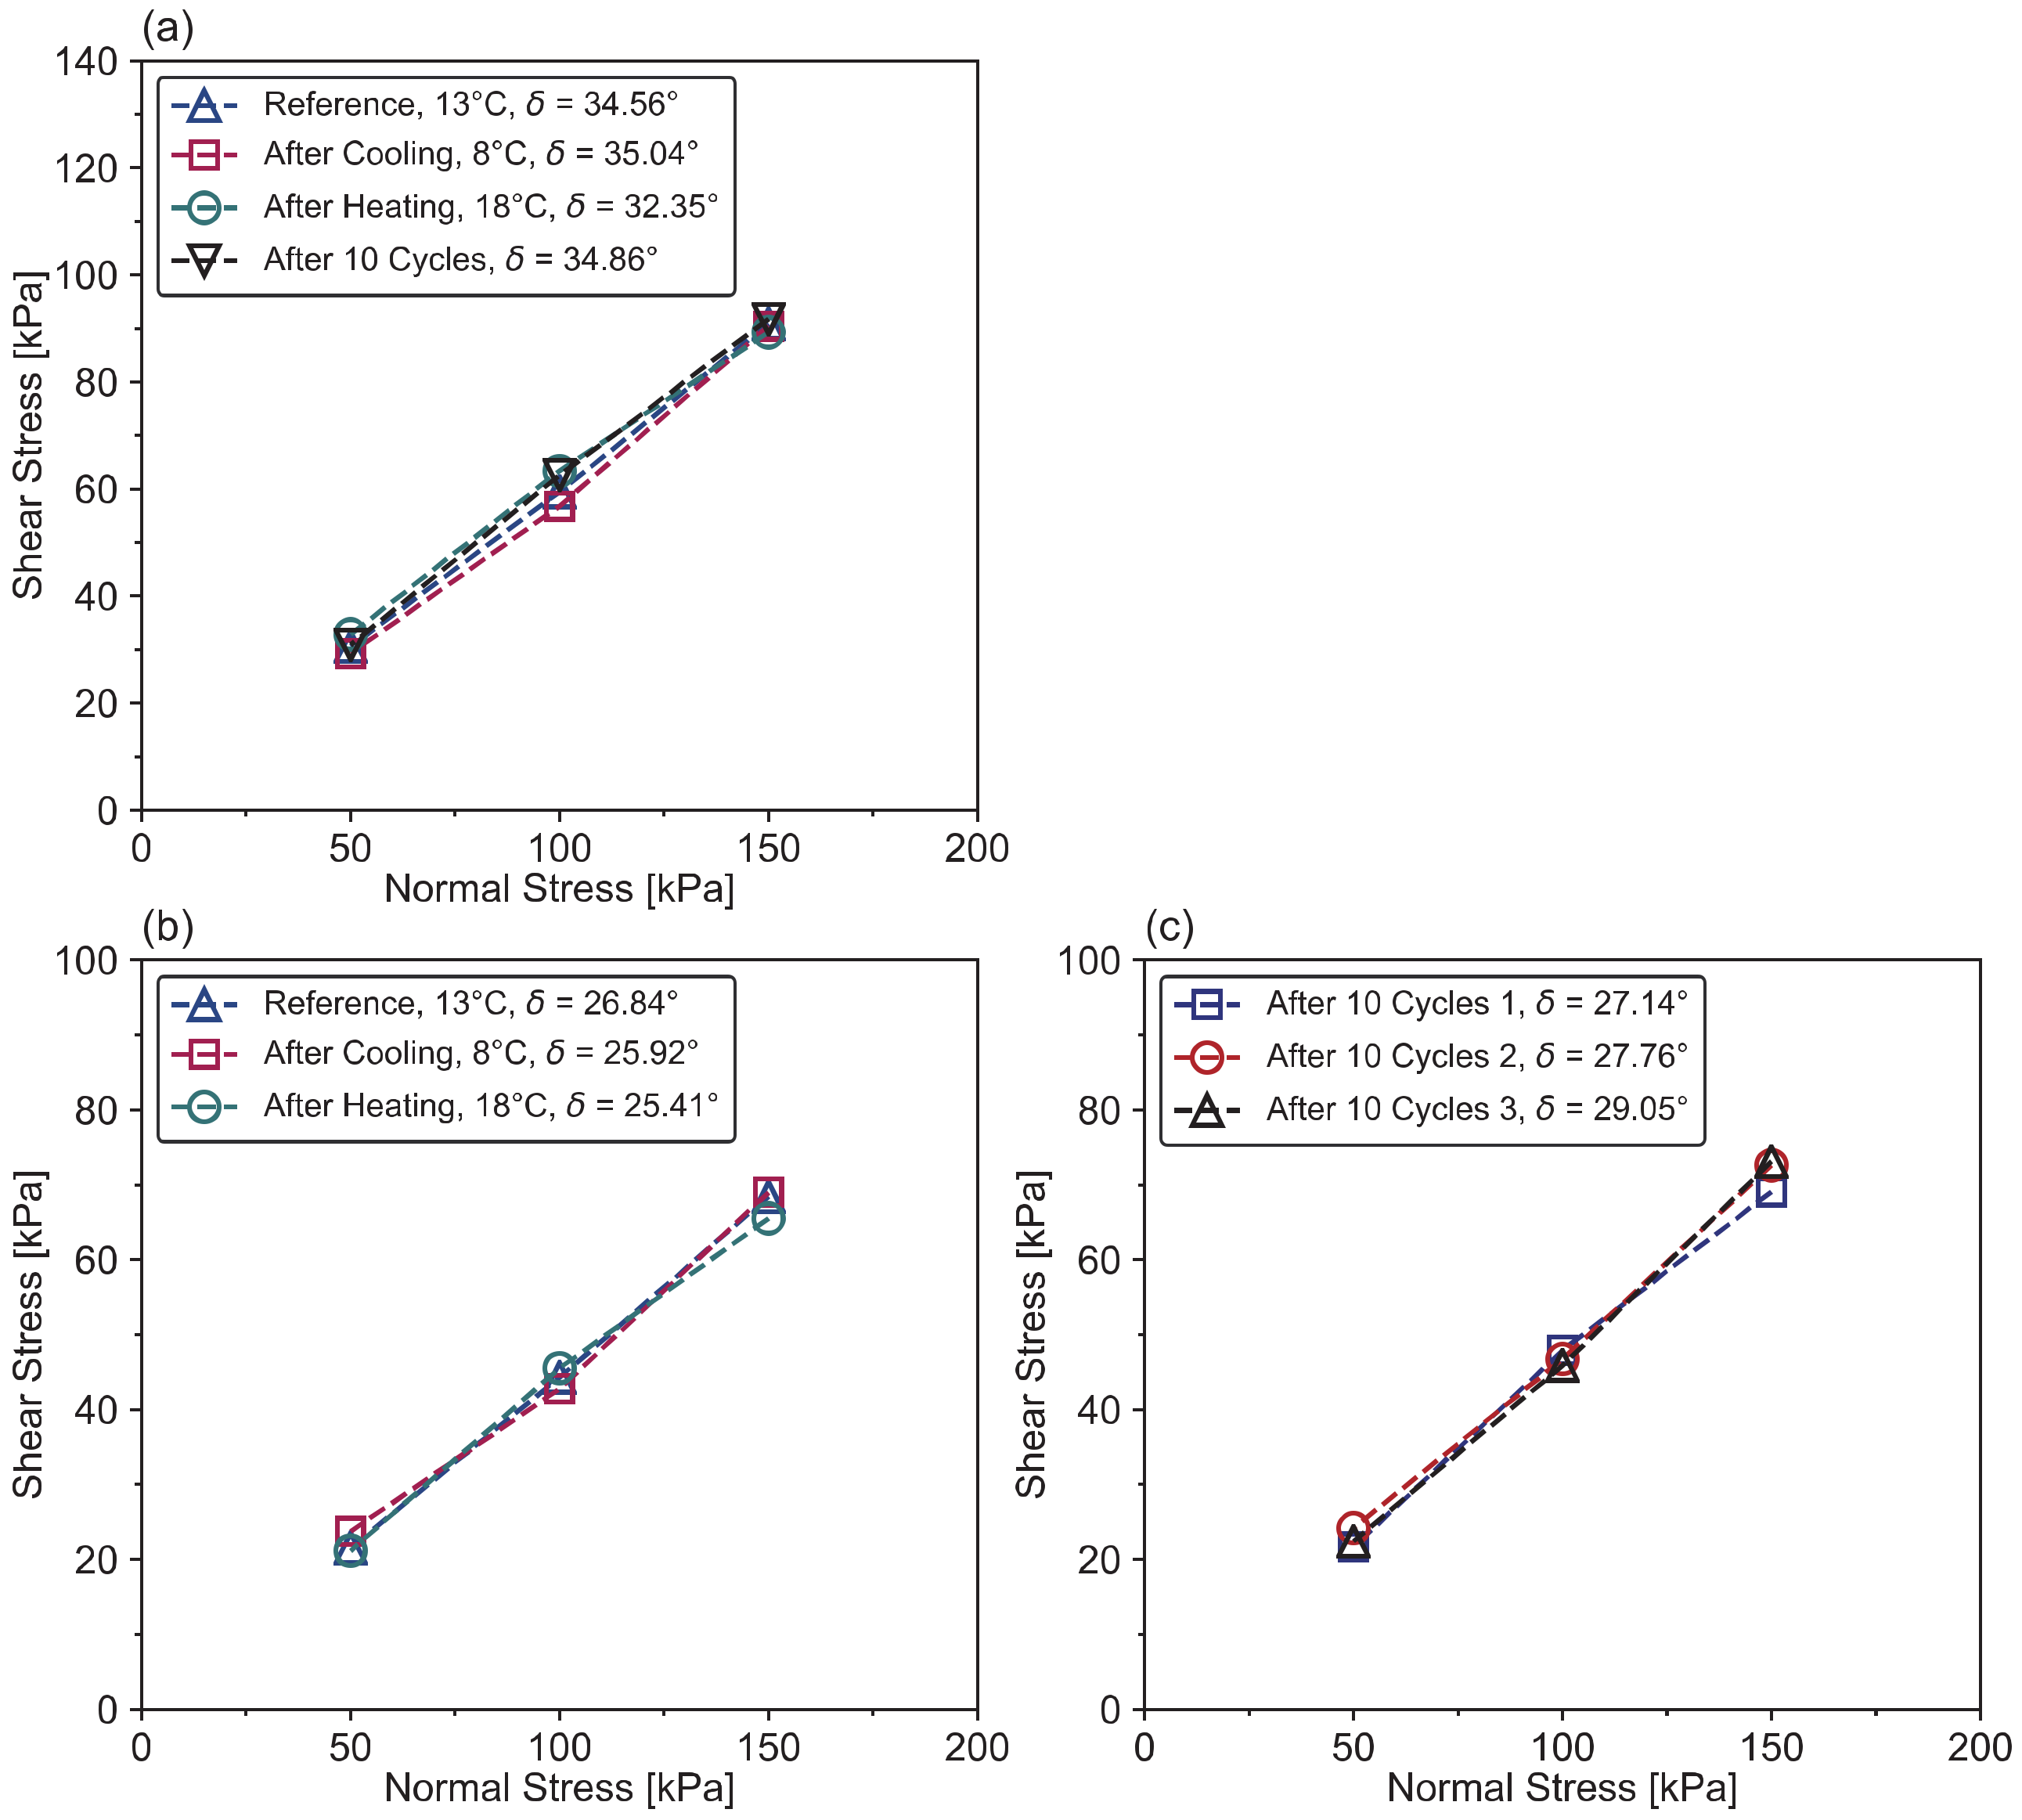
  • For silica sand–structure or carbonate sand–structure interfaces, the shear behavior of the interface is not sensitive to thermal changes (for example, 8 °C~18 °C in Vasilescu [7]), which is confirmed by the fact that the friction angle of the sand–structure remains almost constant.
  • For clay–structure interfaces, heating increases the shear strength of the interface and the cohesion between the two materials; this may be attributed to the thermal consolidation caused by heating [2,163]. Additionally, when the clay–structure interfaces are tested under drained conditions, a volumetric contraction is usually observed, agreeing with the typical behavior of NC clays. This can be explained by the fact that contraction is accompanied by loss of moisture of the soil. Attention should be paid, however, to the fact that the temperature range studied (typical of geothermal engineering) is not too high (e.g., 5 °C, 20 °C, and 40 °C in Yavari et al. [19]; −18 °C~20 °C in Xiao et al. [163]; 20 °C and 60 °C in Di Donna et al. [2]).

3.4. Particle Movement during Shearing

The particle movement during interface shear has been investigated with imaging techniques, in particular, Particle Image Velocimetry (PIV) or high-resolution photographs [10,11,108,123,127,164,165,166]. A digital Charged Coupled Device (CCD) camera captured high-resolution photos of sand particles during sand–steel interface shear. Normal and tangential displacements of the particles versus the distance from the interface were tracked, indicating that when the surface roughness is higher than the critical roughness, bulk dilatancy occurs in a narrow zone of about five grains thick [11]. Utilizing a correlation-based image analyzing algorithm, soil mass movement analysis and soil particle tracking were proposed by Zhang et al. [165] to study the sand particle movement during shearing. The measurements revealed that soil particle movements decrease with increasing distance from the structure, and the interface thickness is approximately 5 D50. Photographs of carbonate sand–pile and silica sand–pile interface showed that the closest displacement vector is located 4 mm from the pile, and high particle breakage can be observed in the interface zone of Figure 40 [161].
Moreover, from high-resolution photographs of colored sand in the interface zone of cone penetration testing (CPT), deformations of sand particles can be seen clearly in Figure 41 [108]. The sand grains in the interface have a larger horizontal displacement than those far away from the interface zone.
Unlike sand, there are fewer results on spatial particle movements, deformation distribution, and shear band characteristics of clay during shearing [167], especially in interface direct shear tests on clay structures. Most of the studies in the literature focused on the clay particle orientation after the shearing stage [28,47,168,169,170,171,172]. In general, the consolidation process transforms the clay particles from edge-to-edge orientation to face-to-face orientation. A reorientation of clay particles occurs along the shear plane during the shearing process [30,173]. This is because shear stress leads to large deformations on the connecting links between clay particles as well as clay aggregates, which result in parallel reorientation on the clay particles [28,174]. Nevertheless, most of the previous experimental results observed the shear band only at the final stage of the experiments. They did not continuously monitor the shear band characteristics and spatial distribution of deformation [167].
The imaging methods track the deformation of soil particles as well as the interface thickness during shearing, providing a clear visualization of the interface and the soil particle motion trail.

3.5. Interface Direct Shear Tests on Sand–Clay Mixture

Very few results are available in the literature on direct shear tests performed on reconstituted sand–clay mixtures in the laboratory [39,42,50,60,73,175,176]. Furthermore, the results do not provide a comprehensive understanding on the mechanical behavior of the sand–clay mixtures even though they clearly indicate that the clay content affects the shear behavior of the mixtures.
Aksoy et al. [177] mixed sandy soil and low plasticity clay at various ratios, then carried out direct shear and interface direct shear tests to obtain the sand–clay mixtures′ internal and interface friction angles, respectively. Results are presented in Figure 42. In general, the internal friction angles decreased with the increase of clay content. However, when the clay content was about 30%, there was a slight increase in the internal friction angle. Both soil–steel and soil–wood interface friction angles were lower than the internal friction angles of sand–clay mixtures, whereas the soil–wood’s was quite close to the soil’s.
The water content effect was also explored through a typical direct shear test on sand–clay mixture with different water content and clay fraction (Figure 43) by Dafalla [60]. An increase in moisture content induced a drop in both internal friction angle and cohesion (Figure 43).
Another experimental investigation was carried out by [178] to study the influence of freeze–thaw cycles on the shear behavior at the interface between a sand–bentonite mixture and smooth geomembrane. Samples of the mixture were fabricated by mixing Ottawa sand and sodium bentonite at a ratio of 10:1 by weight. The test results showed that the shear strength of the interface was lower than that of the mixture itself and decreased with increasing freeze–thaw cycles.

4. Conclusions

At the engineering scale, natural soils are usually encountered. They are often heterogeneous and characterized by a complicated microstructure with variable mineral components. Sand–clay mixtures are classically used as simplified soils in the laboratory to investigate their geotechnical properties under various component fractions. Performing laboratory tests on sand–clay mixture with definite fines (clay) and coarse fraction can provide information to understand the simplified soils’ mechanical response and better predict natural soils’ behavior at the engineering scale.
This paper firstly reviewed several indexes describing clay′s control on the sand–clay mixture (e.g., fines content, intergranular void ratio, interfine void ratio, transitional fines content), and introduced the investigations to characterize the mechanical behavior of sand–clay mixture. The main findings were:
  • The mechanical behavior of the sand–clay mixture depends on the clay fraction, i.e., the changes of texture of sand–clay mixture functions of the clay content.
  • Various factors that have relation to the clay fraction control the mechanical behavior of the sand–clay mixture (e.g., intergranular void ratio, water content, global void ratio, density).
The second section of this paper reviewed the fundamental theories of the interface direct shear test. The interface direct shear test and three different shearing boundary conditions were presented and discussed. This section also contains information on the interface thickness for both sand and clay structures and discusses the main factors (i.e., normal stress, soil density, water content, interface roughness, shear velocity, and temperature) that influence the mechanical response of the interface. Finally, previous experimental research on soil particles’ movement during shearing and interface between sand–clay mixture and structure material was reviewed. It was concluded that, although there are many studies on sand–clay mixtures and the interface with typical soils (i.e., pure sand or pure clay), there is a lack of data on the interface mechanical behavior between sand–clay mixture and structure. For example, information is missing on how the clay content influences the interface direct shear behavior, i.e., shear strength, volumetric deformation, interface friction angle, adhesion, etc., and how the arrangement of the particles changes with the clay content. Since these questions are significant for geotechnical engineering design, implementing an interface direct shear test on sand–clay mixture with different clay contents is reasonably necessary.
Further investigation should be implemented to go through these topics and focus on the interface direct shear test on reconstituted sand–clay mixtures. A homogeneous sample preparation should be proposed to provide repeatable sand–clay mixture samples as well (e.g., [176,179]). Finally, the effects of clay fraction and other loading conditions on the interface behavior should be clarified.

Author Contributions

Conceptualization, data curation, writing—original draft preparation, K.Y., A.-L.F., and E.D.F.; writing—review and editing, K.Y., A.-L.F., E.D.F., P.K., and G.S. All authors have read and agreed to the published version of the manuscript.

Funding

This research received no external funding.

Institutional Review Board Statement

Not applicable.

Informed Consent Statement

Not applicable.

Data Availability Statement

All data generated or used during the study appear in the submitted article.

Acknowledgments

The authors would like to express their acknowledgment to Qi Tang for her assistance. Special thanks to the reviewers and editors for their comments and work.

Conflicts of Interest

The authors declare that they have no conflict of interest.

References

  1. Abed, Y.; Bouzid, D.A.; Bhattacharya, S.; Aissa, M.H. Static impedance functions for monopiles supporting offshore wind turbines in nonhomogeneous soils-emphasis on soil/monopile interface characteristics. Earthq. Struct. 2016, 10, 1143–1179. [Google Scholar] [CrossRef]
  2. Di Donna, A.; Ferrari, A.; Laloui, L. Experimental investigations of the soil-concrete interface: Physical mechanisms, cyclic mobilization, and behaviour at different temperatures. Can. Geotech. J. 2016, 53, 659–672. [Google Scholar] [CrossRef]
  3. Dixon, D.; Gray, M.; Baumgartner, P.; Rigby, G. Pressures Acting on Waste Containers in Bentonite-Based Materials. In Proceedings of the International Conference on Radioactive Waste Management, Winnipeg, MB, Canada, 7–11 September 1986. [Google Scholar]
  4. Dupray, F.; François, B.; Laloui, L. Analysis of the FEBEX multi-barrier system including thermoplasticity of unsaturated bentonite. Int. J. Numer. Anal. Methods Geomech. 2013, 37, 399–422. [Google Scholar] [CrossRef]
  5. Gens, A.; Guimaraes, L.d.N.; Garcia-Molina, A.; Alonso, E. Factors controlling rock-clay buffer interaction in a radioactive waste repository. Eng. Geol. 2002, 64, 297–308. [Google Scholar] [CrossRef] [Green Version]
  6. Laloui, L.; Sutman, M. Experimental investigation of energy piles: From laboratory to field testing. Geomech. Energy Environ. 2020, 27, 100214. [Google Scholar] [CrossRef]
  7. Vasilescu, A.-R. Design and Execution of Energy Piles: Validation by In-Situ and Laboratory Experiments. Ph.D. Thesis, École Centrale de Nantes, Nantes, France, 7 August 2019. [Google Scholar]
  8. Vasilescu, R.; Yin, K.; Fauchille, A.-L.; Kotronis, P.; Dano, C.; Manirakiza, R.; Gotteland, P. Influence of Thermal Cycles on the Deformation of Soil-Pile Interface in Energy Piles. In Proceedings of the E3S Web of Conferences, Glasgow, UK, 25 June 2019; p. 13004. [Google Scholar]
  9. Yu, Q.; Yin, K.; Ma, J.; Shimada, H. Vertical Shaft Support Improvement Studies by Strata Grouting at Aquifer Zone. Adv. Civ. Eng. 2018, 2018, 1–10. [Google Scholar] [CrossRef]
  10. DeJong, J.T.; Randolph, M.F.; White, D.J. Interface load transfer degradation during cyclic loading: A microscale investigation. Soils Found. 2003, 43, 81–93. [Google Scholar] [CrossRef] [Green Version]
  11. Hu, L.; Pu, J. Testing and modeling of soil-structure interface. J. Geotech. Geoenviron. Eng. 2004, 130, 851–860. [Google Scholar] [CrossRef]
  12. Pra-ai, S. Behaviour of Soil-Structure Interfaces Subjected to a Large Number of Cycles. Application to Piles. Ph.D. Thesis, Université de Grenoble, Grenoble, France, 2013. [Google Scholar]
  13. Pra-ai, S.; Boulon, M. Soil-structure cyclic direct shear tests: A new interpretation of the direct shear experiment and its application to a series of cyclic tests. Acta Geotech. 2017, 12, 107–127. [Google Scholar] [CrossRef]
  14. Tovar-Valencia, R.D.; Galvis-Castro, A.; Salgado, R.; Prezzi, M. Effect of surface roughness on the shaft resistance of displacement model piles in sand. J. Geotech. Geoenviron. Eng. 2018, 144, 04017120. [Google Scholar] [CrossRef]
  15. Maghsoodi, S. Thermo-Mechanical Behavior of Soil-Structure Interface under Monotonic and Cyclic Loads in the Context of Energy Geostructures. Ph.D. Thesis, Université de Lorraine, Nancy, France, 2020. [Google Scholar]
  16. Rouaiguia, A. Residual shear strength of clay-structure interfaces. Int. J. Civ. Environ. Eng. 2010, 10, 6–18. [Google Scholar]
  17. Maghsoodi, S.; Cuisinier, O.; Masrouri, F. Thermal effects on mechanical behaviour of soil-structure interface. Can. Geotech. J. 2020, 57, 32–47. [Google Scholar] [CrossRef] [Green Version]
  18. Vasilescu, A.R.; Fauchille, A.-L.; Dano, C.; Kotronis, P.; Manirakiza, R.; Gotteland, P. Impact of Temperature Cycles at Soil-Concrete Interface for Energy Piles. In Proceedings of the International Symposium on Energy Geotechnics, Lausanne, Switzerland, 25–28 September 2018; pp. 35–42. [Google Scholar]
  19. Yavari, N.; Tang, A.M.; Pereira, J.-M.; Hassen, G. Effect of temperature on the shear strength of soils and the soil-structure interface. Can. Geotech. J. 2016, 53, 1186–1194. [Google Scholar] [CrossRef]
  20. Yazdani, S.; Helwany, S.; Olgun, G. Influence of temperature on soil-pile interface shear strength. Geomech. Energy Environ. 2019, 18, 69–78. [Google Scholar] [CrossRef]
  21. Chen, X.; Zhang, J.; Xiao, Y.; Li, J. Effect of roughness on shear behavior of red clay-concrete interface in large-scale direct shear tests. Can. Geotech. J. 2015, 52, 1122–1135. [Google Scholar] [CrossRef]
  22. Li, C.; Kong, G.; Liu, H.; Abuel-Naga, H. Effect of temperature on behaviour of red clay-structure interface. Can. Geotech. J. 2019, 56, 126–134. [Google Scholar] [CrossRef]
  23. Liu, F.-Y.; Wang, P.; Geng, X.-y.; Wang, J.; Lin, X. Cyclic and post-cyclic behaviour from sand-geogrid interface large-scale direct shear tests. Geosynth. Int. 2016, 23, 129–139. [Google Scholar] [CrossRef]
  24. Martinez, A.; Stutz, H.H. Rate effects on the interface shear behaviour of normally and overconsolidated clay. Géotechnique 2019, 69, 801–815. [Google Scholar] [CrossRef]
  25. Sayeed, M.; Ramaiah, B.J.; Rawal, A. Interface shear characteristics of jute/polypropylene hybrid nonwoven geotextiles and sand using large size direct shear test. Geotext. Geomembr. 2014, 42, 63–68. [Google Scholar] [CrossRef]
  26. ASTM-D2487. Classification of Soils for Engineering Purposes (Unified Soil Classification System); ASTM International: West Conshohocken, PA, USA, 1992. [Google Scholar]
  27. Kim, U.-G.; Zhuang, L.; Kim, D.; Lee, J. Evaluation of cyclic shear strength of mixtures with sand and different types of fines. Mar. Georesources Geotechnol. 2017, 35, 447–455. [Google Scholar] [CrossRef]
  28. Bennett, R.; Hulbert, M. Clay Microstructure; Springer Science & Business Media: Berlin/Heidelberg, Germany, 2012. [Google Scholar]
  29. Kenney, T. Residual Strengths of Mineral Mixtures; Norges Geotekniske Institutt: Oslo, Norway, 1977; pp. 21–26. [Google Scholar]
  30. Mitchell, J.K.; Soga, K. Fundamentals of Soil Behavior; John Wiley & Sons: New York, NY, USA, 2005; Volume 3. [Google Scholar]
  31. Muir Wood, D.; Kumar, G. Experimental observations of behaviour of heterogeneous soils. Mech. Cohesive-Frict. Mater. 2000, 5, 373–398. [Google Scholar] [CrossRef]
  32. Thevanayagam, S.; Shenthan, T.; Mohan, S.; Liang, J. Undrained fragility of clean sands, silty sands, and sandy silts. J. Geotech. Geoenviron. Eng. 2002, 128, 849–859. [Google Scholar] [CrossRef]
  33. Lupini, J.F.; Skinner, A.E.; Vaughan, P.R. The drained residual strength of cohesive soils. Géotechnique 1981, 31, 181–213. [Google Scholar] [CrossRef]
  34. Cabalar, A.F.; Mustafa, W.S. Behaviour of sand-clay mixtures for road pavement subgrade. Int. J. Pavement Eng. 2017, 18, 714–726. [Google Scholar] [CrossRef]
  35. Graham, J.; Oswell, J.; Gray, M. The effective stress concept in saturated sand-clay buffer. Can. Geotech. J. 1992, 29, 1033–1043. [Google Scholar] [CrossRef]
  36. Graham, J.; Saadat, F.; Gray, M.; Dixon, D.; Zhang, Q.-Y. Strength and volume change behaviour of a sand-bentonite mixture. Can. Geotech. J. 1989, 26, 292–305. [Google Scholar] [CrossRef]
  37. Graham, J.; Sunn, B.; Gray, M. Strength and Volume Change Characteristics of a Sand-Bentonite Buffer. Available online: https://inis.iaea.org/collection/NCLCollectionStore/_Public/22/004/22004854.pdf?r=1 (accessed on 5 May 2021).
  38. Havens, J.H.; Goodwin, W.A. Clay Mineralogy and Soil Stabilization. 1951. Available online: https://uknowledge.uky.edu/ktc_researchreports/1346 (accessed on 5 May 2021).
  39. Kim, D.; Nam, B.H.; Youn, H. Effect of clay content on the shear strength of clay-sand mixture. Int. J. Geo-Eng. 2018, 9, 19. [Google Scholar] [CrossRef]
  40. Lade, P.V.; Liggio, C.; Yamamuro, J.A. Effects of non-plastic fines on minimum and maximum void ratios of sand. Geotech. Test. J. 1998, 21, 336–347. [Google Scholar]
  41. Miller, E.A.; Sowers, G.F. The strength characteristics of soil-aggregate mixtures & discussion. Highw. Res. Board Bull. 1958, 183, 16–32. [Google Scholar]
  42. Vallejo, L.E.; Mawby, R. Porosity influence on the shear strength of granular material-clay mixtures. Eng. Geol. 2000, 58, 125–136. [Google Scholar] [CrossRef]
  43. Cekerevac, C.; Laloui, L. Experimental study of thermal effects on the mechanical behaviour of a clay. Int. J. Numer. Anal. methods Geomech. 2004, 28, 209–228. [Google Scholar] [CrossRef]
  44. Esrig, M.I. Some temperature effects on soil compressibility and pore water pressure. Spec. Rep. 1969, 231. Available online: https://onlinepubs.trb.org/Onlinepubs/sr/sr103/103-022.pdf (accessed on 5 May 2021).
  45. Georgiannou, V.; Burland, J.; Hight, D. The undrained behaviour of clayey sands in triaxial compression and extension. Geotechnique 1990, 40, 431–449. [Google Scholar] [CrossRef]
  46. Hammad, T.; Fleureau, J.-M.; Hattab, M. Kaolin/montmorillonite mixtures behaviour on oedometric path and microstructural variations. Eur. J. Environ. Civ. Eng. 2013, 17, 826–840. [Google Scholar] [CrossRef]
  47. Hattab, M.; Hammad, T.; Fleureau, J.-M. Internal friction angle variation in a kaolin/montmorillonite clay mix and microstructural identification. Géotechnique 2015, 65, 1–11. [Google Scholar] [CrossRef]
  48. Hong, P.; Pereira, J.-M.; Tang, A.M.; Cui, Y.-J. On some advanced thermo-mechanical models for saturated clays. Int. J. Numer. Anal. Methods Geomech. 2013, 37, 2952–2971. [Google Scholar] [CrossRef]
  49. Lingnau, B.; Graham, J.; Yarechewski, D.; Tanaka, N.; Gray, M. Effects of temperature on strength and compressibility of sand-bentonite buffer. Eng. Geol. 1996, 41, 103–115. [Google Scholar] [CrossRef]
  50. Monkul, M.M.; Ozden, G. Compressional behavior of clayey sand and transition fines content. Eng. Geol. 2007, 89, 195–205. [Google Scholar] [CrossRef]
  51. Namdar, A. Kaolinite thermal evaluation in geotechnical engineering. Adv. Nat. Appl. Sci. 2011, 5, 85–92. [Google Scholar]
  52. Paaswell, R.E. Temperature effects on clay soil consolidation. J. Soil Mech. Found. Div. 1967, 93, 9–22. [Google Scholar] [CrossRef]
  53. Polidori, E. Relationship between the Atterberg limits and clay content. Soils Found. 2007, 47, 887–896. [Google Scholar] [CrossRef] [Green Version]
  54. Wei, X.; Hattab, M.; Fleureau, J.-M.; Hu, R. Micro-macro-experimental study of two clayey materials on drying paths. Bull. Eng. Geol. Environ. 2013, 72, 495–508. [Google Scholar] [CrossRef]
  55. Fattah, M.Y.; Al-Lami, A.H. Behavior and characteristics of compacted expansive unsaturated bentonite-sand mixture. J. Rock Mech. Geotech. Eng. 2016, 8, 629–639. [Google Scholar] [CrossRef] [Green Version]
  56. Kacprzak, G.; Boutin, C.; Doanh, T. Permeability of sand-clay mixtures. Arch. Civ. Eng. 2010, 56, 299–320. [Google Scholar] [CrossRef]
  57. Gray, M.; Cheung, S.; Dixon, D. Swelling pressures of compacted bentonite/sand mixtures. MRS Online Proc. Libr. Arch. 1984, 44. [Google Scholar] [CrossRef]
  58. Revil, A.; Grauls, D.; Brévart, O. Mechanical compaction of sand/clay mixtures. J. Geophys. Res. Solid Earth 2002, 107, ECV 11–1. [Google Scholar] [CrossRef]
  59. Simpson, D.; Evans, T. Behavioral thresholds in mixtures of sand and kaolinite clay. J. Geotech. Geoenviron. Eng. 2016, 142, 04015073. [Google Scholar] [CrossRef]
  60. Dafalla, M.A. Effects of clay and moisture content on direct shear tests for clay-sand mixtures. Adv. Mater. Sci. Eng. 2013, 2013, 1–8. [Google Scholar] [CrossRef] [Green Version]
  61. Krim, A.; Arab, A.; Chemam, M.; Brahim, A.; Sadek, M.; Shahrour, I. Experimental study on the liquefaction resistance of sand-clay mixtures: Effect of clay content and grading characteristics. Mar. Georesources Geotechnol. 2019, 37, 129–141. [Google Scholar] [CrossRef]
  62. Mollins, L.; Stewart, D.; Cousens, T. Drained strength of bentonite-enhanced sand. Geotechnique 1999, 49, 523–528. [Google Scholar] [CrossRef] [Green Version]
  63. Nagaraj, H. Influence of gradation and proportion of sand on stress-strain behavior of clay-sand mixtures. Int. J. Geo-Eng. 2016, 7, 19. [Google Scholar] [CrossRef] [Green Version]
  64. Dash, H.; Sitharam, T. Undrained monotonic response of sand-silt mixtures: Effect of nonplastic fines. Geomech. Geoeng. Int. J. 2011, 6, 47–58. [Google Scholar] [CrossRef]
  65. Cabalar, A.; Hasan, R. Compressional behaviour of various size/shape sand-clay mixtures with different pore fluids. Eng. Geol. 2013, 164, 36–49. [Google Scholar] [CrossRef]
  66. Cabalar, A.F.; Mustafa, W.S. Fall cone tests on clay-sand mixtures. Eng. Geol. 2015, 192, 154–165. [Google Scholar] [CrossRef]
  67. Peters, J.F.; Berney IV, E.S. Percolation threshold of sand-clay binary mixtures. J. Geotech. Geoenviron. Eng. 2010, 136, 310–318. [Google Scholar] [CrossRef]
  68. Khan, F.S.; Azam, S.; Raghunandan, M.E.; Clark, R. Compressive strength of compacted clay-sand mixes. Adv. Mater. Sci. Eng. 2014, 2014, 1–6. [Google Scholar] [CrossRef] [Green Version]
  69. Azam, S. Study on the swelling behaviour of blended clay–sand soils. Geotech. Geol. Eng. 2007, 25, 369–381. [Google Scholar] [CrossRef]
  70. Saada, A.; Townsend, F. State of the art: Laboratory strength testing of soils. In Laboratory Shear Strength of Soil; ASTM International: West Conshohocken, PA, USA, 1981. [Google Scholar]
  71. Thevanayagam, S. Effect of fines and confining stress on undrained shear strength of silty sands. J. Geotech. Geoenviron. Eng. 1998, 124, 479–491. [Google Scholar] [CrossRef]
  72. Benahmed, N.; Nguyen, T.K.; Hicher, P.Y.; Nicolas, M. An experimental investigation into the effects of low plastic fines content on the behaviour of sand/silt mixtures. Eur. J. Environ. Civ. Eng. 2015, 19, 109–128. [Google Scholar] [CrossRef]
  73. Balaban, E.; Smejda, A.; Onur, M. An Experimental Study on Shear Strength Behavior of Soils Under Low Confining Pressure. In Proceedings of the 4th World Congress on Civil, Structural, and Environmental Engineering, Rome, Italy, 7–9 April 2019; pp. 1–8. [Google Scholar]
  74. Vallejo, L.E. Interpretation of the limits in shear strength in binary granular mixtures. Can. Geotech. J. 2001, 38, 1097–1104. [Google Scholar] [CrossRef]
  75. Cabalar, A.F. The effects of fines on the behaviour of a sand mixture. Geotech. Geol. Eng. 2011, 29, 91–100. [Google Scholar] [CrossRef]
  76. Kumar, G.; Wood, D.M. Mechanical Behaviour of Mixtures of Kaolin and Coarse Sand. In Proceedings of the IUTAM Symposium on Mechanics of Granular and Porous Materials, Cambridge, UK, 15–17 July 1996; pp. 57–68. [Google Scholar]
  77. Holtz, W. Triaxial Shear Characteristics of Clayey Gravel Soils; US Bureau of Reclamation: Washington, DC, USA, 1961.
  78. Kurata, S.; Fujishita, T. Research on the engineering properties of sand-clay mixtures. Rep. Port Harb. Res. Inst. 1961, 11, 389–424. [Google Scholar]
  79. Marsal, R.; Fuentes de la Rosa, A. Mechanical properties of rockfill soil mixtures. In Proceedings of the Transactions of the 12th International Congress on Large Dams, Mexico City, Mexico, 29 March–2 April 1976; pp. 179–209. [Google Scholar]
  80. Paduana, J.A. The Effect of Type and Amount of Clay on the Strength and Creep Characteristics of Clay-Sand Mixtures. Ph.D. Thesis, University of California, Berkeley, CA, USA, 1966. [Google Scholar]
  81. Schlosser, F.; Long, N.-T. Recent results in French research on reinforced earth. J. Constr. Div. 1974, 100, 223–237. [Google Scholar] [CrossRef]
  82. Chu, J.; Leong, W. Effect of fines on instability behaviour of loose sand. Geotechnique 2002, 52, 751–755. [Google Scholar] [CrossRef]
  83. Monkul, M.M.; Ozden, G. Effect of Intergranular Void Ratio on One-Dimensional Compression Behavior. In Proceedings of the International Conference on Problematic Soils, Famagusta, Cyprus, 25–27 May 2005; p. 27. [Google Scholar]
  84. Kuerbis, R.; Negussey, D.; Vaid, Y.P. Effect of Gradation and Fines Content on the Undrained Response of Sand. Geotech. Spec. Publ. 1988, 330–345. [Google Scholar]
  85. Salgado, R.; Bandini, P.; Karim, A. Shear strength and stiffness of silty sand. J. Geotech. Geoenviron. Eng. 2000, 126, 451–462. [Google Scholar] [CrossRef]
  86. Yang, J.; Wei, L.; Dai, B. State variables for silty sands: Global void ratio or skeleton void ratio? Soils Found. 2015, 55, 99–111. [Google Scholar] [CrossRef] [Green Version]
  87. Cabalar, A.F.; Demir, S. Fall-cone testing of unsaturated sand-clay mixtures. Proc. Inst. Civ. Eng. Geotech. Eng. 2019, 172, 432–441. [Google Scholar] [CrossRef]
  88. Zuo, L.; Baudet, B.A. Determination of the transitional fines content of sand-non plastic fines mixtures. Soils Found. 2015, 55, 213–219. [Google Scholar] [CrossRef]
  89. Thevanayagam, S.; Mohan, S. Intergranular state variables and stress-strain behaviour of silty sands. Geotechnique 2000, 50, 1–23. [Google Scholar] [CrossRef]
  90. ASTM-D4254-16. Standard Test Methods for Minimum Index Density and Unit Weight of Soils and Calculation of Relative Density; ASTM International: West Conshohocken, PA, USA, 2016. [Google Scholar]
  91. Nova, R. Soil Mechanics; Wiley Online Library: Hoboken, NJ, USA, 2010. [Google Scholar]
  92. Bahadori, H.; Ghalandarzadeh, A.; Towhata, I. Effect of non plastic silt on the anisotropic behavior of sand. Soils Found. 2008, 48, 531–545. [Google Scholar] [CrossRef] [Green Version]
  93. Lupogo, K. Effect of fines mineralogy on the oedometric compressional behavior of sandy soils. J. Civ. Eng. Constr. Technol. 2013, 4, 232–238. [Google Scholar]
  94. Hazirbaba, K. Pore Pressure Generation Characteristics of Sands and Silty Sands: A Strain Approach. Ph.D. Thesis, The University of Texas at Austin, Austin, TX, USA, 2005. [Google Scholar]
  95. Polito, C.P. The Effects of Non-Plastic and Plastic Fines on the Liquefaction of Sandy Soils; Virginia Polytechnic Institute and State University: Blacksburg, VA, USA, 1999. [Google Scholar]
  96. Delage, P. A microstructure approach to the sensitivity and compressibility of some Eastern Canada sensitive clays. Géotechnique 2010, 60, 353. [Google Scholar] [CrossRef]
  97. Morgenstern, N.; Tchalenko, J. Microscopic structures in kaolin subjected to direct shear. Geotechnique 1967, 17, 309–328. [Google Scholar] [CrossRef]
  98. Ural, N. The Importance of Clay in Geotechnical Engineering. In Current Topics in the Utilization of Clay in Industrial and Medical Applications; InTech Open: Rijeka, Croatia, 2018; p. 83. [Google Scholar]
  99. Yin, K.; Fauchille, A.-L.; Othmani, K.; Sciarra, G.; Kotronis, P.; Benoit, Y.; Bertrand, F.; Branchu, S. Influence of sample preparation on the multi scale structure of sand-clay mixtures. In Proceedings of the E3S Web of Conferences, Glasgow, UK, 25 June 2019; p. 01007. [Google Scholar]
  100. Yamamuro, J.A.; Wood, F.M. Effect of depositional method on the undrained behavior and microstructure of sand with silt. Soil Dyn. Earthq. Eng. 2004, 24, 751–760. [Google Scholar] [CrossRef]
  101. Shaker, A.; Elkady, T. Hydraulic performance of sand-clay mixtures: Soil fabric perspective. Géotechnique Lett. 2015, 5, 198–204. [Google Scholar] [CrossRef]
  102. Carraro, J.A.H.; Prezzi, M.; Salgado, R. Shear strength and stiffness of sands containing plastic or nonplastic fines. J. Geotech. Geoenviron. Eng. 2009, 135, 1167–1178. [Google Scholar] [CrossRef]
  103. Di Donna, A. Thermo-Mechanical Aspects of Energy Piles. Ph.D. Thesis, École Polytechnique Fédérale de Lausanne (EPFL), Lausanne, Switzerland, 2014. [Google Scholar]
  104. Maghsoodi, S.; Cuisinier, O.; Masrouri, F. Effect of Temperature on the Cyclic Behavior of Clay-Structure Interface. J. Geotech. Geoenviron. Eng. 2020, 146, 04020103. [Google Scholar] [CrossRef]
  105. Porcino, D.; Fioravante, V.; Ghionna, V.N.; Pedroni, S. Interface behavior of sands from constant normal stiffness direct shear tests. Geotech. Test. J. 2003, 26, 289–301. [Google Scholar]
  106. Xiao, S.; Suleiman, M.T.; Al-Khawaja, M. Investigation of effects of temperature cycles on soil-concrete interface behavior using direct shear tests. Soils Found. 2019, 59, 1213–1227. [Google Scholar] [CrossRef]
  107. Boukpeti, N.; White, D.J. Interface shear box tests for assessing axial pipe-soil resistance. Géotechnique 2017, 67, 18–30. [Google Scholar] [CrossRef] [Green Version]
  108. Martinez, A.; Frost, J. The influence of surface roughness form on the strength of sand-structure interfaces. Géotechnique Lett. 2017, 7, 104–111. [Google Scholar] [CrossRef]
  109. Xiao, S.; Suleiman, M.T.; Elzeiny, R.; Xie, H.; Al-Khawaja, M. Soil-concrete interface properties subjected to temperature changes and cycles using direct shear tests. Geotech. Front. 2017, 175–183. [Google Scholar] [CrossRef]
  110. Boulon, M. Basic features of soil structure interface behaviour. Comput. Geotech. 1989, 7, 115–131. [Google Scholar] [CrossRef]
  111. Potyondy, J.G. Skin friction between various soils and construction materials. Geotechnique 1961, 11, 339–353. [Google Scholar] [CrossRef]
  112. Airey, D.W.; Al-Douri, R.H.; Poulos, H.G. Estimation of pile friction degradation from shearbox tests. Geotech. Test. J. 1992, 15, 388–392. [Google Scholar]
  113. Desai, C.; Drumm, E.; Zaman, M. Cyclic testing and modeling of interfaces. J. Geotech. Eng. 1985, 111, 793–815. [Google Scholar] [CrossRef]
  114. David Frost, J.; Martinez, A. Interface Shear Response of JSC-1A, GRC-3, and JSC-Mars1 Regolith Simulants. J. Aerosp. Eng. 2018, 31, 04018003. [Google Scholar] [CrossRef]
  115. Mortara, G.; Mangiola, A.; Ghionna, V.N. Cyclic shear stress degradation and post-cyclic behaviour from sand–steel interface direct shear tests. Can. Geotech. J. 2007, 44, 739–752. [Google Scholar] [CrossRef]
  116. Shakir, R.; Zhu, J. Behavior of compacted clay-concrete interface. Front. Arch. Civ. Eng. China 2009, 3, 85–92. [Google Scholar] [CrossRef]
  117. Tabucanon, J.T.; Airey, D.W.; Poulos, H.G. Pile skin friction in sands from constant normal stiffness tests. Geotech. Test. J. 1995, 18, 350–364. [Google Scholar]
  118. Tsubakihara, Y.; Kishida, H. Frictional behaviour between normally consolidated clay and steel by two direct shear type apparatuses. Soils Found. 1993, 33, 1–13. [Google Scholar] [CrossRef] [Green Version]
  119. Lehane, B.M.; Jardine, R.; Bond, A.J.; Frank, R. Mechanisms of shaft friction in sand from instrumented pile tests. J. Geotech. Eng. 1993, 119, 19–35. [Google Scholar] [CrossRef]
  120. Wernick, E. Skin Friction of Cylindrical Anchors in Noncohesive Soils. In Proceedings of the Symposium on Soil Reinforcing and Stabilising Techniques, Sydney, Australia, 16–19 October 1978; pp. 201–219. [Google Scholar]
  121. Boulon, M.; Foray, P. Physical and Numerical Simulation of Lateral Shaft Friction along Offshore Piles in Sand. In Proceedings of the 3rd International Conference on Numerical Methods in Offshore Piling, Nantes, France, 21–22 May 1986; pp. 127–147. [Google Scholar]
  122. DeJong, J.T.; White, D.J.; Randolph, M.F. Microscale observation and modeling of soil-structure interface behavior using particle image velocimetry. Soils Found. 2006, 46, 15–28. [Google Scholar] [CrossRef] [Green Version]
  123. White, D.J. An Investigation into the Behaviour of Pressed-In Piles. Ph.D. Thesis, University of Cambridge, Cambridge, UK, 2002. [Google Scholar]
  124. Yuan, B.; Xu, K.; Wang, Y.; Chen, R.; Luo, Q. Investigation of deflection of a laterally loaded pile and soil deformation using the PIV technique. Int. J. Geomech. 2017, 17, 04016138. [Google Scholar] [CrossRef]
  125. Take, W.A. Thirty-Sixth Canadian Geotechnical Colloquium: Advances in visualization of geotechnical processes through digital image correlation. Can. Geotech. J. 2015, 52, 1199–1220. [Google Scholar] [CrossRef]
  126. Tehrani, F.; Han, F.; Salgado, R.; Prezzi, M.; Tovar, R.; Castro, A. Effect of surface roughness on the shaft resistance of non-displacement piles embedded in sand. Géotechnique 2016, 66, 386–400. [Google Scholar] [CrossRef]
  127. Martinez, A.; Frost, J.D.; Hebeler, G.L. Experimental study of shear zones formed at sand/steel interfaces in axial and torsional axisymmetric tests. Geotech. Test. J. 2015, 38, 409–426. [Google Scholar] [CrossRef]
  128. Uesugi, M.; Kishida, H.; Tsubakihara, Y. Behavior of sand particles in sand-steel friction. Soils Found. 1988, 28, 107–118. [Google Scholar] [CrossRef] [Green Version]
  129. Zhang, G.; Zhang, J.-M. Monotonic and cyclic tests of interface between structure and gravelly soil. Soils Found. 2006, 46, 505–518. [Google Scholar] [CrossRef] [Green Version]
  130. Hammad, W.I. Modélisation Non Linéaire et Étude Expérimentale des Bandes de Cisaillement dans les Sables. Ph.D. Thesis, Univeristy of Grenoble, Grenoble, France, 1991. [Google Scholar]
  131. Hoteit, N. Contribution à L’étude du Comportement D’interface Sable-Inclusion et Application au Frottement Apparent. Ph.D. Thesis, Grenoble INPG, Grenoble, France, 1990. [Google Scholar]
  132. Hu, L.; Pu, J.L. Application of damage model for soil-structure interface. Comput. Geotech. 2003, 30, 165–183. [Google Scholar] [CrossRef]
  133. Lemos, L.J.L.; Vaughan, P.R. Clay-interface shear resistance. Géotechnique 2000, 50, 55–64. [Google Scholar] [CrossRef]
  134. Taha, A.; Fall, M. Shear behavior of sensitive marine clay-concrete interfaces. J. Geotech. Geoenviron. Eng. 2013, 139, 644–650. [Google Scholar] [CrossRef]
  135. Fleming, I.; Sharma, J.; Jogi, M. Shear strength of geomembrane-soil interface under unsaturated conditions. Geotext. Geomembr. 2006, 24, 274–284. [Google Scholar] [CrossRef]
  136. Frost, J.; DeJong, J.; Recalde, M. Shear failure behavior of granular–continuum interfaces. Eng. Fract. Mech. 2002, 69, 2029–2048. [Google Scholar] [CrossRef]
  137. Martinez, A.; Frost, J. Particle-scale effects on global axial and torsional interface shear behavior. Int. J. Numer. Anal. Methods Geomech. 2017, 41, 400–421. [Google Scholar] [CrossRef]
  138. Tomlinson, M. Some effects of pile driving on skin friction. In Behaviour of Piles; Thomas Telford Publishing: London, UK, 1971; pp. 107–114. [Google Scholar]
  139. Dove, J.E.; Frost, J.D. Peak friction behavior of smooth geomembrane-particle interfaces. J. Geotech. Geoenviron. Eng. 1999, 125, 544–555. [Google Scholar] [CrossRef]
  140. Martinez, A.; Palumbo, S. Anisotropic shear behavior of soil-structure interfaces: Bio-inspiration from snake skin. IFCEE 2018 2018, 94–104. [Google Scholar] [CrossRef]
  141. DeJong, J.T.; Westgate, Z.J. Role of initial state, material properties, and confinement condition on local and global soil-structure interface behavior. J. Geotech. Geoenviron. Eng. 2009, 135, 1646–1660. [Google Scholar] [CrossRef]
  142. Fioravante, V.; Ghionna, V.N.; Pedroni, S.; Porcino, D. A constant normal stiffness direct shear box for soil-solid interface tests. Riv. Ital. Geotec. 1999, 33, 7–22. [Google Scholar]
  143. Su, J. Advancing Multi-Scale Modeling of Penetrometer Insertion in Granular Materials. Ph.D. Thesis, Georgia Institute of Technology, Atlanta, GA, USA, 2019. [Google Scholar]
  144. O’rourke, T.; Druschel, S.; Netravali, A. Shear strength characteristics of sand-polymer interfaces. J. Geotech. Eng. 1990, 116, 451–469. [Google Scholar] [CrossRef]
  145. Zhang, M.; Sang, S.; Wang, Y.; Bai, X. Factors Influencing the Mechanical Characteristics of a Pile-Soil Interface in Clay Soil. Front. Earth Sci. 2019, 7, 364. [Google Scholar] [CrossRef]
  146. Uesugi, M.; Kishida, H. Influential factors of friction between steel and dry sands. Soils Found. 1986, 26, 33–46. [Google Scholar] [CrossRef] [Green Version]
  147. Uesugi, M.; Kishida, H. Frictional resistance at yield between dry sand and mild steel. Soils Found. 1986, 26, 139–149. [Google Scholar] [CrossRef] [Green Version]
  148. Gadelmawla, E.; Koura, M.; Maksoud, T.; Elewa, I.; Soliman, H. Roughness parameters. J. Mater. Process. Technol. 2002, 123, 133–145. [Google Scholar] [CrossRef]
  149. International Organization for Standardization. 4287-Geometrical Product Specifications (GPS)-Surface Texture: Profile Method-Terms, Definitions and Surface Texture Parameters; International Organization for Standardization: Geneva, Switzerland, 1997. [Google Scholar]
  150. D’Aguiar, S.C.; Modaressi-Farahmand-Razavi, A.; Dos Santos, J.A.; Lopez-Caballero, F. Elastoplastic constitutive modelling of soil-structure interfaces under monotonic and cyclic loading. Comput. Geotech. 2011, 38, 430–447. [Google Scholar] [CrossRef]
  151. Yin, K.; Liu, J.; Lin, J.; Vasilescu, A.-R.; Othmani, K.; Di Filippo, E. Interface Direct Shear Tests on JEZ-1 Mars Regolith Simulant. Appl. Sci. 2021, 11, 7052. [Google Scholar] [CrossRef]
  152. Tsubakihara, Y.; Kishida, H.; Nishiyama, T. Friction between cohesive soils and steel. Soils Found. 1993, 33, 145–156. [Google Scholar] [CrossRef] [Green Version]
  153. Subba Rao, K.; Rao, K.; Allam, M.; Robinson, R. Interfacial friction between sands and solid surfaces. Proc. Inst. Civ. Eng. Geotech. Eng. 1998, 131, 75–82. [Google Scholar] [CrossRef]
  154. Maghsoodi, S.; Cuisinier, O.; Masrouri, F. Thermo-Mechanical Behaviour of Clay-Structure Interface. In Proceedings of the E3S Web of Conferences, Glasgow, UK, 25 June 2019; p. 10002. [Google Scholar]
  155. Uesugi, M.; Kishida, H.; Tsubakihara, Y. Friction between sand and steel under repeated loading. Soils Found. 1989, 29, 127–137. [Google Scholar] [CrossRef] [Green Version]
  156. Wang, D. Investigating the Thermal and Thermo-Mechanical Performances of Geothermal Heat Exchanger with Spiral-Tubes. Ph.D. Thesis, The Hong Kong Polytechnic University, Hong Kong, 2016. [Google Scholar]
  157. Littleton, I. An experimental study of the adhesion between clay and steel. J. Terramechanics 1976, 13, 141–152. [Google Scholar] [CrossRef]
  158. Nanda, S.; Sivakumar, V.; Hoyer, P.; Bradshaw, A.; Gavin, K.; Gerkus, H.; Jalilvand, S.; Gilbert, R.; Doherty, P.; Fanning, J. Effects of strain rates on the undrained shear strength of kaolin. Geotech. Test. J. 2017, 40, 951–962. [Google Scholar] [CrossRef]
  159. Scaringi, G.; Di Maio, C. Influence of displacement rate on residual shear strength of clays. Procedia Earth Planet. Sci. 2016, 16, 137–145. [Google Scholar] [CrossRef] [Green Version]
  160. Sorensen, K.K.; Baudet, B.; Simpson, B. Influence of structure on the time-dependent behaviour of a stiff sedimentary clay. Géotechnique 2007, 57, 113–124. [Google Scholar] [CrossRef] [Green Version]
  161. White, D.; O’Loughlin, C.; Stark, N.; Chow, S.H. Free Fall Penetrometer Tests in Sand: Determining the Equivalent Static Resistance. In Cone Penetration Testing 2018, Proceedings of the 4th International Symposium on Cone Penetration Testing, Delft, The Netherlands, 21–22 June 2018; CRC Press: London, UK; pp. 695–701.
  162. Xiao, S.; Suleiman, M.T.; McCartney, J.S. Shear Behavior of Silty Soil and Soil-Structure Interface under Temperature Effects. In Proceedings of the Geo-Congress 2014: Geo-Characterization and Modeling for Sustainability, Atlanta, GA, USA, 23–26 February 2014; pp. 4105–4114. [Google Scholar]
  163. Xiao, S.; Suleiman, M.T.; Naito, C.; Al-Khawaja, M. Modified-thermal borehole shear test device and testing procedure to investigate the soil-structure interaction of energy piles. Geotech. Test. J. 2017, 40, 1043–1056. [Google Scholar] [CrossRef]
  164. Guler, M.; Edil, T.B.; Bosscher, P.J. Measurement of particle movement in granular soils using image analysis. J. Comput. Civ. Eng. 1999, 13, 116–122. [Google Scholar] [CrossRef]
  165. Zhang, G.; Liang, D.; Zhang, J.-M. Image analysis measurement of soil particle movement during a soil-structure interface test. Comput. Geotech. 2006, 33, 248–259. [Google Scholar] [CrossRef]
  166. Song, Z.; Konietzky, H.; Cai, X. Modulus degradation of concrete exposed to compressive fatigue loading: Insights from lab testing. Struct. Eng. Mech. 2021, 78, 3. [Google Scholar]
  167. Kwak, T.-Y.; Park, K.-H.; Kim, J.; Chung, C.-K.; Baek, S.-H. Shear Band Characterization of Clayey Soils with Particle Image Velocimetry. Appl. Sci. 2020, 10, 1139. [Google Scholar] [CrossRef] [Green Version]
  168. Dudoignon, P.; Pantet, A.; Carrara, L.; Velde, B. Macro-micro measurement of particle arrangement in sheared kaolinitic matrices. Géotechnique 2001, 51, 493–499. [Google Scholar] [CrossRef]
  169. Hattab, M.; Fleureau, J.-M. Experimental study of kaolin particle orientation mechanism. Géotechnique 2010, 60, 323. [Google Scholar] [CrossRef]
  170. Hicher, P.; Wahyudi, H.; Tessier, D. Microstructural analysis of strain localisation in clay. Comput. Geotech. 1994, 16, 205–222. [Google Scholar] [CrossRef]
  171. Hicher, P.Y.; Wahyudi, H.; Tessier, D. Microstructural analysis of inherent and induced anisotropy in clay. Mech. Cohesive-Frict. Mater. 2000, 5, 341–371. [Google Scholar] [CrossRef]
  172. Sachan, A. Variation in geometric arrangement of particles in kaolinite clay due to shear deformation using SEM technique. Curr. Sci. 2007, 93, 515–522. [Google Scholar]
  173. Sivakumar, V.; Doran, I.; Graham, J. Particle orientation and its influence on the mechanical behaviour of isotropically consolidated reconstituted clay. Eng. Geol. 2002, 66, 197–209. [Google Scholar] [CrossRef]
  174. Meunier, A. Clays; Springer Science & Business Media: Berlin/Heidelberg, Germany, 2005. [Google Scholar]
  175. Shahin, M.; Khan, M.M.H.; Bari, M.N. A Disaster Resilient Road: Effects of Fines on Density and Shear Strength of Sands. Int. J. Transp. Eng. Technol. 2020, 6, 38. [Google Scholar] [CrossRef]
  176. Yin, K.; Liu, J.; Vasilescu, A.-R.; Di Filippo, E.; Othmani, K. A Procedure to Prepare Sand–Clay Mixture Samples for Soil–Structure Interface Direct Shear Tests. Appl. Sci. 2021, 11, 5337. [Google Scholar] [CrossRef]
  177. Aksoy, H.; Inal, E.; Gor, M. Skin Friction between Soil and Pile Materials. In Proceedings of the 12th International Congress on Advances in Civil Engineering, Istanbul, Turkey, 21–23 September 2016. [Google Scholar]
  178. Li, L.; Fall, M.; Fang, K. Shear behavior at interface between compacted clay liner–geomembrane under freeze-thaw cycles. Cold Reg. Sci. Technol. 2020, 172, 103006. [Google Scholar] [CrossRef]
  179. Yin, K.; Fauchille, A.-L.; Di Filippo, E.; Othmani, K.; Branchu, S.; Sciarra, G.; Kotronis, P. The influence of mixing orders on the microstructure of artificially prepared sand-clay mixtures. Adv. Mater. Sci. Eng. 2021, 2021, 1–15. [Google Scholar]
Figure 1. Effect of fines content on the drained shear behavior of a sand–fines mixture: (a) deviator stress and (b) volumetric strain versus axial strain (after Benahmed et al. [72]).
Geotechnics 01 00014 g001
Figure 2. Peak shear strength of the mixture as a function of fines content and normal stress in direct shear test: (a) sand–clay mixture (from Vallejo and Mawby [42]) and (b) large glass bead–small glass bead mixture (from Vallejo [74]).
Geotechnics 01 00014 g002
Figure 3. Shear strength of sand–clay mixture versus clay content and normal stress (from Monkul and Ozden [50]).
Geotechnics 01 00014 g003
Figure 4. Variation of peak shear strength with the fines content under different normal stresses (from Cabalar [75]).
Geotechnics 01 00014 g004
Figure 5. Failure envelopes of the sand–clay mixtures (from Vallejo and Mawby [42]).
Geotechnics 01 00014 g005
Figure 6. Influence of clay content on (a) cohesion and (b) internal friction angle of sand–clay mixture samples under water contents of 15%, 17.5%, and 20% (from Dafalla [60]).
Geotechnics 01 00014 g006
Figure 7. (a) and (b): internal friction angles of the sand–fines mixture as a function of fines content from the literature.
Geotechnics 01 00014 g007
Figure 8. Changes of structure in the sand–clay mixtures (modified from Vallejo and Mawby, [42]).
Geotechnics 01 00014 g008
Figure 9. Phase diagram of a sand–fines mixture (Kim et al. [27]).
Geotechnics 01 00014 g009
Figure 10. Microstructure and void ratio changes in the sand–clay mixtures as a function of fine and sand contents (from Zuo and Baudet [88]).
Geotechnics 01 00014 g010
Figure 11. Schematic explanation of the arrangement of sand and clay in sand–fines mixture, based on void ratio values, and fines and sand contents (adapted from Lade et al. [40]).
Geotechnics 01 00014 g011
Figure 12. Void ratio of sand–clay mixture as a function of clay content (by weight) under different vertical stress (a) 54.2 kPa, (b) 102.1 kPa, and (c) 150 kPa (adapted from Vallejo and Mawby [42]).
Geotechnics 01 00014 g012
Figure 13. Intergranular void ratio as a function of fines content under different oedometric stress (after Monkul and Ozden [83]).
Geotechnics 01 00014 g013
Figure 14. Granular compression index as a function of fines content under normal stress range of: (a) 98.7~196.13 kPa and (b) 196.13~392.27 kPa (after Monkul and Ozden [83]).
Geotechnics 01 00014 g014
Figure 15. Granular compression index as a function of fines content (after Monkul and Ozden [50]).
Geotechnics 01 00014 g015
Figure 16. Phase diagram for the transitional fines content calculation: (a) relations at no clay present and (b) relations at clay present (after Hazirbaba [94]).
Geotechnics 01 00014 g016
Figure 17. Interface direct shear test box (after Boulon [110]).
Geotechnics 01 00014 g017
Figure 18. Schematic diagram of the consolidation of interface direct shear during the application of the normal loading (after Pra-ai and Boulon [13]).
Geotechnics 01 00014 g018
Figure 19. Soil–structure interface with an imposed normal stiffness: (a) in situ scale and (b) laboratory scale.
Geotechnics 01 00014 g019
Figure 20. Boundary conditions of interface shearing (after Pra-ai [12]).
Geotechnics 01 00014 g020
Figure 21. Interface thickness ratio as a function of normal stress in Hostun Sand (from Hammad [130]).
Geotechnics 01 00014 g021
Figure 22. Friction coefficient as a function of normal stress for interfaces of soil–continuum material (from [136]).
Geotechnics 01 00014 g022
Figure 23. Effect of normal stress on clay–concrete interface shear strength at different specimen water contents (w) under (a) rough and (b) smooth interface (after Shakir and Zhu [116]).
Geotechnics 01 00014 g023
Figure 24. Static Mohr–Coulomb strength envelopes for soil samples with different relative densities (after Desai et al. [113]).
Geotechnics 01 00014 g024
Figure 25. Influence of soil density on the interface test results: (a) coefficient of friction as a function of sand density and (b) friction angle versus relative density of sand (from O’rourke et al. [144]).
Geotechnics 01 00014 g025
Figure 26. Influence of water content on clay–concrete interface shear strength under (a) rough and (b) smooth concrete surface (after Shakir and Zhu [116]).
Geotechnics 01 00014 g026
Figure 27. Evaluation of the roughness of soil–structure interface.
Geotechnics 01 00014 g027
Figure 28. Interpretation of roughness: smooth and rough interface.
Geotechnics 01 00014 g028
Figure 29. Influence of normalized interface roughness on the shear behavior of sand–aluminum interface: (a) shear resistance and (b) vertical deformation (positive values mean contraction) as a function of horizontal displacement (from Porcino et al. [105]).
Geotechnics 01 00014 g029
Figure 30. Influence of normalized roughness on sand–steel interface response under CNL conditions: (a) shear strength and (b) vertical deformation (positive values mean dilatancy), as a function of relative tangential displacement (from Hu and Pu [11]).
Geotechnics 01 00014 g030
Figure 31. Relationship between shear stress and shear displacement of clay–concrete interface with different roughness (after Shakir and Zhu [116]).
Geotechnics 01 00014 g031
Figure 32. The friction coefficient of a cohesive soil–steel interface as a function of the interface roughness for soil with (a) 100% clay and (b) 60% clay (after Tsubakihara et al. [152]).
Geotechnics 01 00014 g032
Figure 33. (a) Adhesion and (b) friction angle of the red clay–concrete interface, as a function of the interface roughness (after Chen et al. [21]).
Geotechnics 01 00014 g033
Figure 34. The friction coefficient for sand–steel interfaces as a function of interface roughness in terms of (a) maximum roughness Rmax and (b) normalized roughness Rn (from Uesugi and Kishida [147], Uesugi and Kishida [146]).
Geotechnics 01 00014 g034
Figure 35. Three failure modes for soil–structure interface (after Tsubakihara et al. [152]).
Geotechnics 01 00014 g035
Figure 36. Schematic diagram of influence of shearing velocity on shear behavior of normally consolidated clay (from Martinez and Stutz [24]).
Geotechnics 01 00014 g036
Figure 37. The (a) peak and (b) residual stress ratio as functions of shearing velocity for NC kaolin-steel interfaces under different surface roughness: smooth, medium rough, and rough (after Martinez and Stutz [24]).
Geotechnics 01 00014 g037
Figure 38. Effect of temperature on the shear behavior of soil and soil–concrete interface: (a) friction angle and (b) cohesion and adhesion as functions of temperature (from Yavari et al. [19]).
Geotechnics 01 00014 g038
Figure 39. Interface friction angle of sand–concrete for different monotonic and cyclic thermal loadings: (a) carbonate sand–concrete interface after monotonic heating and cooling and after 10 cyclic thermal cycles, (b) Fontainebleau sand–concrete interface after monotonic heating and cooling, and (c) Fontainebleau sand–concrete interface after 10 cyclic thermal cycles (after Vasilescu [7]).
Geotechnics 01 00014 g039
Figure 40. Photography of sand particles in the sand–structure interface zone (from White et al. [161]).
Geotechnics 01 00014 g040
Figure 41. Photographs of sand particles’ movement in interface zones during shearing with surfaces of (a) smooth, (b) random, (c) ribbed, and (d) structured roughness forms (from Martinez and Frost [108]).
Geotechnics 01 00014 g041
Figure 42. Sand–clay mixture′s internal and interface friction angles as functions of clay content (replot from Aksoy et al. [177]).
Geotechnics 01 00014 g042
Figure 43. Influence of water content on (a) cohesion and (b) internal friction angle of sand–clay mixture at clay contents of 5%, 10%, and 15% (from Dafalla [60]).
Geotechnics 01 00014 g043
Table 1. Percentage (by weight) of clay involved in the control of the mechanical behavior of sand–clay mixtures.
Percentage of Clay in the Mixture (%)
MixtureTest TypeSand-ControlledControlled by BothClay-ControlledReference
Gravel–clayTriaxial test<1515~30>30Marsal (1976)
Gravel–clayTriaxial test<3535~50>50Holtz (1961)
Sand–clayTriaxial test<3030~50>50Paduana (1966)
Sand–clayTriaxial test<2020~30>30Georgianou et al., (1990)
Sand–clayRing shear<1313~47>47Lupini et al., (1981)
Sand–clayDirect shear<2020~38>38Kurata and Fujishita (1961)
Sand–clayDirect shear<2020~50>50Schloser and Long (1974)
Glass beads–clayDirect shear<4040~60>60Schloser and Long (1974)
Sand–clayDirect shear<2525~60>60Vallejo (2000)
Sand–clayTriaxial test<3030~40>40Kumar 1997
Sand–clayTriaxial test<3535~40>40Wood 2000
Sand–clayDirect shear<19~34->19~34Monkul 2007
Sand–fine sandDirect shear<11->11Cabalar 2011
Average values-<24.624.6~40.9>40.9-
Table 2. Interface thickness of sand–structure interface from the literature.
ReferenceSoilStructureTest TypeInterface Thickness
Uesugi 1988sandsteeldirect shear test5 D50
DeJong et al., 2003sandaluminum platedirect shear test5~8 D50
Hu 2002, 2004quartz sandsteel platedirect shear test5 D50
Frost et al., 2002sandgeomembranedirect shear test2~6 D50
Zhang 2006gravelsteeldirect shear test5~6 D50
Pra-ai 2017Fontainebleau sandsteel platedirect shear test10~12 D50
Tehrani 2016sandbrass model pileaxial load test3.2~4.2 D50 (D50 = 0.65 mm)
Martinez 2017sandsteel sleevescone penetration test5~7 D50
Valencia 2018sandbrass model piletensile load test1.7 to 2.4 mm (D50 = 0.62 mm)
Table 3. The interface thickness of clay–structure in the literature.
ReferenceSoilStructureTest TypeInterface Thickness
Martinez 2018kaolin claysteeldirect shear testabout 0.25 mm (D50 is unknown)
Yavari 2016kaolin clayconcrete platedirect shear testless than 1 mm (D50 is 0.8 μm)
Di Donna 2016illite clayconcretedirect shear testunknown
Maghsoodi 2019kaolin claysteeldirect shear testunknown
Chen 2015red clayconcretedirect shear testunknown
Tiwari 2010sand/silty
sand/elastic silt/lean clay
concrete/steel
/wood
direct shear testunknown
Tiwari 2013sand/silty sand/elastic silt/lean clayconcrete/steel
/wood
direct shear testunknown
Aksoy 2016sand–clay mixturesteel/wooddirect shear testunknown
Yazdani 2019kaolin clayconcretedirect shear testunknown
Table 4. Normalized roughness for soil–concrete interfaces (from Di Donna et al. [2]).
Rmax (mm)Sand:
D50 = 0.5 mm
Clay:
D50 = 0.002 mm
RnSurfaceRnSurface
0.0010.002Smooth0.5Medium
0.060.12Medium30High
0.10.2High--
Table 5. The shear strength parameters of soil and soil–concrete interface (from Xiao et al. [162]).
Test DescriptionEffective Friction Angle (°)Cohesion or Adhesion (kPa)
6 °C, soil2937.9
21 °C, soil2535.5
6 °C, soil–concrete interface323.1
21 °C, soil–concrete interface327.5
Publisher’s Note: MDPI stays neutral with regard to jurisdictional claims in published maps and institutional affiliations.

