Review

The Relationship between Financial Development and Energy Consumption in South Africa

by
Palesa Milliscent Lefatsa
*,
Kin Sibanda
and
Rufaro Garidzirai
Department of Economics, Walter Sisulu University, Private Bag X 1, Nelson Mandela Drive, Mthatha 5117, South Africa
*
Author to whom correspondence should be addressed.
Economies 2021, 9(4), 158; https://doi.org/10.3390/economies9040158
Submission received: 1 July 2021 / Revised: 16 September 2021 / Accepted: 22 September 2021 / Published: 21 October 2021
(This article belongs to the Special Issue Energy Economy in the New Century)

Abstract

:
This paper examines the nexus between financial development and energy consumption in South Africa. To determine the long run and short run relationship between financial development and energy consumption in South Africa, the paper uses an Auto Regressive Distributed Lag bounds test (ARDL) and Granger causality test to establish the type of correlation between 1980 and 2018. ARDL bounds testing method offers concrete long-run estimates and t-statistics as it is flexible whether the adopted variables are I(0) or I(1). The study used per capita (kilogram, kg of oil equivalent) to measure total energy consumption, domestic credit to the private sector (percentage of gross domestic product, GDP) to measure financial development, real GDP growth (to capture economic growth), industrial value added (percentage of GDP) to measure industrialization, and urban population (percentage of total population) to capture urbanization. Results from ARDL showed that the relationship between financial development and energy consumption is positive in nature both in short-run and long-run. Granger causality test results revealed unidirectional causality from financial development to energy consumption. Policymakers need to formulate policy reforms that channels more credit to private sector development in order to bolster more energy use in South Africa. There ought to be proper balance between financial development and energy consumption to avoid electricity crisis.

Graphical Abstract

1. Introduction

The country of South Africa has experienced numerous power cuts, and since 2020 Eskom has not been able to keep up with the 25% more demand for 39,000 megavolt (MV) (Renke and Steennot 2020). The need for what is called load shedding led to a flurry of concern about the current and future reliability of energy supply in South Africa, reducing economic growth by 1.1% (Vermeulen 2020). This also raised questions about the lack of progress to recover about R9.9 billion capital cost in resolving Eskom’s financial and operational crises since the newly appointed cabinet of 2018 (Alexandra 2020). Power utility Eskom estimates that, without additional capacity, there will be an electricity supply shortfall of between 4000 and 6000 megawatts over the next five years, as old coal-fired power stations reach their end life (Wirth 2020). One of the drivers for energy consumption in the literature is financial development (Bulfone 2020). A well-developed financial sector enables individuals, households and firms to consume more energy (Ma and Fu 2020). It is therefore imperative to have a study that examines the relationship between financial development and energy consumption in South Africa for the period 1980 to 2018. Moreover, the relationship between financial development and energy consumption has received enormous attention from researchers and policymakers globally (Ahmed 2017). Though most studies generally suggest that there exists a relationship between financial development and energy consumption, empirical evidence has continued to generate mixed outcomes (Odhiambo 2019). One strand of studies asserts that energy consumption induces an increase in the demand for financial services which positively influences financial development (Odhiambo 2010; Ahmed 2017; Ma and Fu 2020). Financial development can positively affect energy use by enhancing economic growth, while providing funds to the economic units at reasonable rates and maturity for purchases durable products such as refrigerators, cars, houses, etc. (Mahalik et al. 2017). Empirical results of Stern and Cleveland (2004) support the notion that energy consumption causes financial development. In contrast, studies such as Kakar (2016), Mahalik et al. (2017) and Nkalu et al. (2020) highlight that financial development leads to energy consumption. The view is that a well-developed financial sector attracts more finances for investment which enlivens urbanization, industrialization, economic growth and buttresses energy consumption (Bayer et al. 2021). Other studies posit that at early stages of development financial advancement responds to energy consumption and as economic growth increases it improves the financial development of the country (Sadorsky 2011; Xu 2012; Mahalik and Mallick 2014; Sbia et al. 2017; Rehman and Rashid 2017; Haider and Adil 2019; Ma and Fu 2020). Gungor and Simon (2017) and Roubaud and Shahbaz (2018) and Sadraoui et al. (2019) supports this view which indicates bi-directional linkage between financial development and energy consumption. In some instances, financial development has no role in energy consumption (Tamazian et al. 2009). Sare (2019) and Yue et al. (2019) discovered no evidence of the existence of the finance-energy nexus.
It is evident from the foregoing that empirical evidence of the relationship between financial development and energy consumption is mixed (Bayer et al. 2021). In South Africa, policymakers, researchers and academics have put very little attention to this relationship as evidenced by the fact that few studies examined the relationship between financial development and energy consumption (Ahmed 2017). The existing few studies follow a similar trend of grouping South Africa with other countries in the analyses (Chitiyo 2017). Studies such as Tamazian et al. (2009), Ahmed (2017), Gungor and Simon (2017) examined the finance-energy relationship amongst a group of countries which includes South Africa (Sekantsi et al. 2016; Muyambiri and Odhiambo 2018). No consensus was reached in findings of these studies. This, therefore, creates difficulty in making a generalization about the role of financial development on energy consumption in South Africa (Odhiambo 2019). Furthermore, this means South Africa’s policy direction is deficient in the contribution of financial development to energy consumption (Karakurt and Aykutalp 2020).
Unlike the common trend of grouping countries, this study aims to generate empirical evidence of the linkage between financial development and energy consumption specific to South Africa (Ahmed 2017). Developing empirical knowledge of this relationship is imperative to influence policy reforms focusing on advancing financial development and fostering energy consumption in the country (Simon 2016). The study also sets out to examine how the financial sector influences energy consumption (Karakurt and Aykutalp 2020). Studies revealed that the causality direction and relationship between financial development indicators and primary energy use varied among countries (Bayer et al. 2021). In a nutshell, the study additionally seeks to determine the nature and direction of the relationship between financial development and energy consumption in South Africa (Bernanke 2008). Using time series data and the ARDL technique, the study provides long-run and short-run dynamics of this relationship (Gujarati and Porter 2010). The study concludes by prescribing evidence-based policy recommendations necessary to enliven financial development and bolster energy consumption in South Africa.
The rest of the study is structured as follows: Section 2 provides a literature review and Section 3 outlines the methodology. Section 4 presents empirical results whilst the final section is devoted to the conclusion and policy recommendations.

2. Review of the Literature

It is very important under this brief survey to provide both the theoretical background and empirical studies to show a holistic insight on the subject matter. This section is classified into two sub-sections, the theoretical literature and empirical literature related to financial development and energy consumption relationship.

2.1. Theoretical Literature

The theoretical front revealed three main effects (direct, business and wealth effects) where financial development correlates with energy consumption and Kuznets curve (EKC) hypothesis.
Direct effect—An effective financial system allows consumers to buy more goods, supporting more lending to households and firms, leading to higher energy consumption (Furuoka 2015). Conversely, an increase in credits leads to a reduction in energy consumption, thus through expansion of energy-saving devices, machines, and new products introduced (Masanet-Llodra 2012). Consumers’ energy demand may also be an increasing function of the country’s financial development (Bayer et al. 2021). A healthy financial system (like South Africa) provides consumers with an opportunity to buy goods and services using their accumulated money in banks or from a loan granted to them (Sadorsky 2011). Consumers, after receiving a loan from the bank, consume expensive goods which demand more energy such as cars, homes, refrigerators, air conditioners and washing machines (Mahalik et al. 2017).
Business effect—The concept of business effect was propounded by Minsky (1982). Kregel (2004) extended theories by Minsky and further presented the uncertainty for exchange rate, derivatives, and global dimension (Kregel 2010). Financial development is said to benefit from the financial system by impacting on real variables, at which real interest rate can possibly result in investment (Sadorsky 2014). This is due to the fact that financial development can drive economic growth and the obvious impact of growth of income on energy demand (Odhiambo 2018). Thus, the allocation of banking credits to the private sector helps companies expand their assets, physical capital, and production factors, making up energy-saving devices and machines (Sadorsky 2019).
Wealth effect—Wealth effect is a behavioral economic theory suggesting that people spend more as the value of their assets rise (Yang et al. 2020). The idea is that consumers feel more financially secure and confident about their wealth when their homes or investment portfolios increase in value (Takahashi et al. 2019). An increase in stock market activity like the JSE is a key indicator for economic growth and wealth of a country (Haider and Adil 2019). Equally, the stock effect increase positively builds trust between consumers and businesses, creating a wealth effect (Sadorsky 2011).
Kuznets curve hypothesis—According to Piketty (2013), the Kuznets curve (EKC) hypothesis exists as an inverted U-shaped relationship (Nkalu et al. 2020), between the environment and financial development (used interchangeably with income) (Lukasiewicz 2018). Grossman and Krueger (1991) argued that an increase in environmental degradation reaches a turning point where income starts to increase (Shafik 1994). Cornia et al. (2003) postulated that, immediately after a turning point, environment degradation decreases with an increase in income level (Piketty 2013).
In conclusion, this section examined the theoretical literature reviewed for this study. The theoretical background of the underlying argument in this study is based on three possible channels: direct, business and wealth. In addition, the Kuznets curve (EKC) hypothesis and confirmed that financial development directly relates with energy consumption.

2.2. Empirical Literature

The empirical front discusses the link between financial development and energy consumption as follows: positive, negative, feedback, bidirectional, unidirectional, inverted U-shape, no significant relationship between the variables under the study.
Studies apply various methodologies when examining the relationship between financial development and energy consumption. Ma and Fu (2020) used panel data from 120 countries between 1991 and 2014 and a generalized method of moments to evaluate the overall financial development impact along with its mechanisms on energy consumption. Upon analyzing the national differences, findings confirmed that globally, financial development and its components increase energy consumption, and this has been significant in emerging economies. Ahmed (2017) used panel data from 1991 to 2013 from the economies of Brazil, Russia, India, China, and South Africa (BRICS) to investigate the links among financial development and energy consumption. This study confirmed that financial development increases energy consumption in BRICS countries regardless of effective measures used. From these studies, it seems evident that financial development cannot be used to restrain increases in energy consumption from the global perspective; however, in developing economies policymakers must balance the relationship between the development of the financial sector and energy consumption.
Gómez and Rodríguez (2019) used a panel data analysis between 1971 and 2015 in the North American Free Trade Agreement (NAFTA) to study correlation between financial development and energy consumption. Results from this panel analysis revealed a significant negative link between financial development and energy consumption in NAFTA countries. Destek (2018) investigated the nexus amongst financial development, economic growth and energy consumption between 1991 and 2015 in seven developing countries with the commonly correlated effect estimator. Empirical results confirmed that energy consumption is significantly reduced by financial development when banking and bond markets are used as the “financial development” control variable. Despite that, when stock market indexes are being used to measure financial development, energy consumption marginally declines along with development of financial markets in developed economies.
Sadraoui et al. (2019) studied the interrelationship among financial development, economic growth and energy consumption between 2000 and 2018 in the Middle East and North Africa region with Granger causality and cointegration approach. Results confirmed that financial development significantly increases economic growth and has a feedback effect with energy consumption. In Pakistan, Roubaud and Shahbaz (2018) examined the financial development and energy consumption nexus between 1972 and 2014 using the cointegration and Vector Error Correction Model (VECM) Granger causality approach. Empirical findings confirmed a feedback effect among financial development and energy consumption in Pakistan. When electricity is used as a proxy for energy consumption, a feedback relationship exists between financial development and energy consumption as well as within electricity prices and consumption thereof, whereas no causality exists between economic growth and energy consumption.
Nkalu et al. (2020) studied correlation between financial development and energy consumption in sub-Saharan African countries between 1975 and 2017 using the VECM, Granger causality and cointegration approach. Results confirmed a statistically positive long-run association among the main variables but insignificant in the short-run. The empirical findings showed a unidirectional causality from financial development to energy consumption and economic growth. In South Africa, Odhiambo (2010) examined financial development, economic growth and energy consumption correlation with ARDL and cointegration approaches between 1980 and 2013. A unidirectional causality from financial development to energy consumption was confirmed from the results and further to economic growth in South Africa. Financial development somehow failed to influence energy consumption in the long-run. Higher energy prices induce the cost of doing business to upsurge, leading to positive economic growth.
Topcu and Payne (2017) studied the effect of financial development on energy consumption in 32 high income economies between 1990 and 2014. The study employed two heterogeneous estimations, namely mean group and common related effect mean group. Empirical findings confirmed that financial development slightly increases energy consumption, but it is not significant. In Turkey, Keskingoz and Inancli (2016) studied a correlation between financial development and energy consumption between 1960 and 2011 using the Johansen cointegration and Granger causality approaches. Results confirmed a short-run positive association among core variables. However, no significant long-run link exists between financial development and energy consumption. Studies used the overall index and one index per banking sector, stock market, and bond market for financial development and revealed the stock market index to be responsible for a slight decline in energy consumption, although the overall index employed failed to explain the statistical relationship with energy consumption.
Baloch et al. (2019) studied the financial development and energy consumption nexus in the Organisation for Economic Cooperation and Development (OECD) countries between 1980 and 2016 using the Driscoll-Kraay standard errors. The findings concluded that the correlation between financial development and energy consumption in OECD countries is an inverted U-shape. In India, Haider and Adil (2019) studied the effect of financial development and trade openness on the energy consumption nexus between 1971 and 2016 using the ARDL bounds, Johansen and Juselius, cointegration and VECM tests. Empirical findings confirmed a non-linear long-run association between financial development and energy consumption in India. From these findings, it can be concluded that when Gross Domestic Product (GDP) ratios of foreign trade increases, the level of per-capita carbon emission also increases while financial development has no linear significant effect on per capita carbon emission in the long run. This finding also confirmed an environmental Kuznet curve.
The findings highlight that the energy consumption following causality dominates in most developed and developing countries and these countries were encouraged to pursue policies that channel more resources towards stimulating energy consumption whilst recommending policies focusing on growing financial sectors for countries for which financial development leads to energy consumption.
In a nutshell, the related literature has reached mixed findings about the relationship between financial development and energy consumption analysed in countries, methods and the period examined. Rather, they focused more on the granger causality and less on the long run and short relationship between the variables under the study. Therefore, this very study seeks to close this gap in the literature.

3. Methodology

3.1. Data Description

The study utilized time series data from 1980 to 2018 obtained from World Bank Indicators World Bank (2020). The study period was motivated by the need to develop empirical knowledge of the relationship between financial development and energy consumption across time and explore the impetus of financial and energy policies in South Africa.

3.2. Empirical Model

Empirical works by Ma and Fu (2020), laid the foundation for model specification. The general model was specified as:
E C i t   = α + β 0 F D i t + γ C o n t r o l i t + μ i + ε i t
From Equation (1) above; E C i t   represents energy consumption; F D i t denotes financial development (Odhiambo 2018; C o n t r o l i t ) shows the control variables that influence energy consumption (Karakurt and Aykutalp 2020); β 0 , and γ represent the coefficient (percentage) of the conforming independent (Chitiyo 2017); μ i is the unobserved country-specific effect (Bernanke 2008); ε i t denotes the residual term (Gujarati and Porter 2010); and lastly, i and t represent South Africa and the time period (Ahmed 2017), respectively (Ma and Fu 2020).
Equation (1) was adopted and modified into Equation (2) below for the objective of this study:
E C t   = α + β 0 F D t + β 1 G D P C t + β 2 I N D t + β 3 U R B t + D T + μ t
E C t   denotes the natural log of energy consumption; F D t represents financial development;   G D P C t denotes economic growth;   I N D t indicates industrialization;   U R B t represents urbanization; β s   denotes long-run parameters under estimation; DT indicates the dummy variable; μ t denotes error term; t denotes time (Simon 2016).

3.3. Definition of Terms and a Priori Expectations

Energy consumption, denoted as EC, is the total energy consumption measured as per capita (kg of oil equivalent) (Odhiambo 2018). Energy consumption is used to capture total energy consumption per capita and it was used as the dependent variable (Ma and Fu 2020). Energy consumption includes indicators such as electricity, gas, oil and coal consumption (Karakurt and Aykutalp 2020).
Financial development (control variable), denoted as FD, is measured as the domestic credit to private sector by banks as a percentage of GDP (Ahmed 2017). There are different measures for financial development and these include: pension fund assets, mutual fund assets and insurance premiums, and life and non-life to gross domestic products (Chitiyo 2017). The study used domestic credit in the private sector as a measure of financial development (Bernanke 2008). This measure is preferred because it captures the full degree of intermediation in developing countries, governments borrow from financial markets to provide infrastructure for economic development (Regan 2017). Following Mukhtarov et al.’s (2020a) findings, the study expected this variable to increase energy consumption because easy access to credit enables consumers to purchase more energy (Iheonu et al. 2020).
Economic growth (control variable), denoted as GDPC, is measured as the real GDP growth (Al-Mulali and Lee 2013). This shows the rate at which a nation’s GDP grows from one year to another (Peterson 2017). This further captures distribution of income, enabling cross-country comparisons (Bulfone 2020). Following Raza et al.’s (2015) findings, the study expected this variable to increase energy consumption because increasing size of the economy results in high energy use (Bayer et al. 2021).
Industrialisation (control variable), denoted as IND, is measured as the industrial value added (% of GDP) (Odhiambo 2018). In global energy, industrialisation is seen among the drivers of global pollution (Ma and Fu 2020). More industrialised areas demand more energy supply (Sadorsky 2014). This variable was expected to increase energy consumption, according to Nasreen and Anwar (2014).
Urbanisation (a control variable), denoted as URB, is measured as the urban population (% of total population) (Sare 2019). According to Chowdhury et al. (2019), there is high consumption of energy in cities compared to the countryside. This variable was expected to increase energy consumption (Odhiambo 2018).
The dummy variable (D) captures the impact of the global financial crisis (Odhiambo 2018). It uses values of 1 to indicate the financial crisis period (2007–2009). The error term (ε) captures measurement errors in the model. the error term is assumed to be serially unrelated to all the variables (Gujarati and Porter 2010). It is a critical term in dealing with the problem of endogeneity, a situation where explanatory variables are serially related to the error term (Bayer et al. 2021).

3.4. Estimation Techniques

The study carried out correlation tests to establish whether a relationship exists between the independent variables in the series. This addressed the problem of high correlation between independent variables common in time series analysis (Bulfone 2020). Formal unit root tests using Augmented Dickey–Fuller (ADF) and Phillips–Perron (PP) tests were performed to determine stationarity (Dutt 2017). Whilst the PP test is a generalisation of the ADF test, it is more comprehensive and allows for autocorrelated residuals through non-parametrical statistical methods (Gujarati and Porter 2010).
General ADF Model:
Δ Y t   = β 1   + β 2   t + δ Y t 1   + i = 1 n α i   Δ Y t 1   + e t  
With, α i   = i = 0 + 1 n δ k   and ( δ = i = 1 n δ t   ) 1
e t   denotes Gaussian white noise disturbance (Paganini 1994). While Δ Y t 1   = Y t 1   Y t 2   (Dutt 2017). t denotes period (Raza et al. 2020). β denotes the coefficient of an intercept (Gujarati and Porter 2010).
The general PP model:
ω x = 1 T s = x + 1 n t t s k = 0 , …, p = kth auto covariance of residuals
ω o = [ ( T K ) / T ] s 2 , s 2 = t = 1 T l n t T K
γ = ω o + 2 i = 0 + 1 n δ k   ( 1 k n + 1 ) ω x
where n denotes restrictive lag structure to evaluate the PP measurement (Cheng and Lai 1997), ω x denotes the correlation coefficient of the adjustment in residuals (Gujarati and Porter 2010). To determine whether a random or pure walk exists between variables (Hui 2012), the study used both tests for unit root. The conclusion is the same as the above (Ma and Fu 2020).
The study also conducted cointegration test to establish the possibility of a relationship between the variables using Pesaran and Shin (1999) and Pesaran et al. (2001) Auto Regressive Distributed Lag (ARDL) bounds test for cointegration (Yang et al. 2020). ARDL bounds test has important econometric advantages and statistical features over other techniques (Nkalu et al. 2020). The primary advantage is that ARDL cointegration approach provides explicit tests for the presence of a single cointegration vector, instead of assuming uniqueness (Bayer et al. 2021). Pesaran and Shin (1999) revealed that asymptotically valid inference on short run and long run parameters could be made by employing ordinary least squares estimations of ARDL model (Ahmed 2017). Therefore, the ARDL model order is properly augmented to grant for contemporary correlation among the stochastic elements of the data generating process involved in estimation (Pesaran et al. 2001). It was specified as:
Δ InEC t = β 0 + i = 1 k β 1 i Δ InFD t 1 + i = 1 k β 2 i Δ InGDPC t 1 + i = 1 k β 3 i Δ InIND t 1 + i = 1 k β 4 i Δ InURB t 1 + α 1 InFD t 1 + α 2 InGDPC t 1 + α 3 InIND t 1 + α 4 InURB t 1 + D t 1 + ε t
where Δ is the difference operator (representing short-run dynamic process), k is the lag length (depicting long-run variables) whilst all other variables are as defined in Equation (1).
The null hypothesis of no cointegration relationship existing between the variables specified as H0 = α1 = α2 = α3 = α4 = 0 was tested against the alternative hypothesis of a cointegration relationship specified as H1 = α1α2α3α4 ≠ 0 (Ahmed 2017). Two sets of critical values for a cointegration test were used based on the F-statistic test (Bulfone 2020). If the computed F-statistic is greater than the upper-critical bound-value (F-value > Upper-critical bound-value), the null hypothesis of no cointegration will be rejected suggesting existence of a cointegration relationship (Nowbutsing 2014). If the computed F-statistic is less than the lower-critical bound-value (F-value < Lower-critical bound-value), the alternative hypothesis implying no cointegration relationship will be rejected (Gujarati and Porter 2010). Performing the unit root test first addressed prior to the problem of the possibility of inconclusive results (F-value falling within the upper and lower-critical bound-values). Consistent with Narayan and Siyabi (2005), a maximum of two lags in the bounds test was sufficient in the estimation (Takahashi et al. 2019). The number of lags was selected based on the or Akaike Information Criterion (AIC) (Dutt 2017).
The Granger causality test was done to determine the type of causality (Narayan and Siyabi 2005). The null hypothesis of no Granger causality was tested against the alternative hypothesis of existence of a Granger causality relationship between EC and all other variables (Simon 2016). Diagnostic tests, carried out for serial correlation, heteroscedasticity and parameter stability, were performed to check the model’s stochastic properties and to validate its parameter estimation results (Bayer et al. 2021). The null hypothesis should be rejected if the p-value of observed R-squared is less than 0.05 significance level (Dutt 2017). This decision rule applies to the Granger causality, serial correlation, and heteroscedasticity tests (Bernanke 2008). Cumulative sum of recursive residuals (CUSUM) and CUSUM of square (CUSUMSQ) tests were conducted to determine parameter stability on the long-run ARDL model (Paganini 1994).
In a nutshell, data sources, model specifications, an explanation of variables and their expected priories were presented in this section. Steps to be followed in order to arrive at conclusive results were highlighted, being the unit root, cointegration and causality tests. Lastly, a number of diagnostic checks (such as serial correlation, heteroscedasticity, normality, and parameter stability) to check the robustness for ARDL model were presented.

4. Results

4.1. Results of Descriptive Statistics

The descriptive statistics test results, as illustrated in Table 1, show that the variables did not deviate from normal distribution, and the probability of their Jarque-Bera statistics was insignificant, which confirms that variables are normally distributed supported by values of skewness for all the variables hovered around zero.

4.2. Results of Formal Unit Root Test

The data series was found to be non-stationary at levels. This necessitated differencing so as to attain stationarity. Stationarity was attained at first differencing and outcomes of the formal unit root test as illustrated in Table 2 and Table 3 showed that Energy Consumption (EC), Financial Development (FD) and Urbanisation (URB) were not stationary at levels whilst Industrialisation (IND) and Economic Growth (GDPC) were stationary at levels.
Unlike other methods, ARDL’s superior feature is that it does not require variables to be of the same order prior to testing for cointegration therefore the study continued to perform ARDL bounds test for cointegration.

4.3. Results of Cointegration Test

Table 4 shows results for the ARDL bounds test for cointegration. The ARDL bounds test confirms a long-run relationship among the variables under the study. This is illustrated by the F-statistic value (17.63728) which is above I(1) bound critical values of 3.38 at the 5% significant level, meaning there is a cointegration between the tested variables. Based on the decision rule highlighted in the previous section, the null hypothesis of no cointegration is not accepted (Mukhtarov et al. 2020b).
Since variables are cointegrated, the subsequent section discusses the long-run and short-run elasticities.

4.4. Results of Long-Run Elasticities

Table 5 shows findings of the long run elasticities and the dummy variable.
In the long run, a unit increase in credit to the private sector leads to 0.113414 increases in energy consumption. The results are in line with the expected a priori and findings of (Kotnik et al. 2020) who obtained a positive and significant relationship between credit to the private sector and financial development. Moreover, these findings are relevant and in line with direct and business effect, a healthy financial system provides credit access to consumers and businesses (Furuoka 2015). Whilst the productive use of credit to the private sector catalyses increases in consumption, it is important to ensure proper balance between credit for private sector development and energy consumption because too much credit may trigger energy demand pressure over time, negating the positive influence on consumption. Unlike Mahalik and Mallick (2014) who found contrary results that were negative, Sadorsky (2011), propounds this notion, highlighting that a significant and positive connection exists between credit to the private sector and energy consumption but disappears during periods of load shedding.
In the long run, a unit increase in real GDP growth leads to 0.045325 increases in energy consumption. This outcome is consistent with the priori expectation, though it is insignificant. According to Wu (2015), these results could be biased due to an exclusion of important variables. Eden and Jin (1992) and Singh and Vashishtha (2020) support this finding and argues that economic growth is not related to energy consumption in the long-run relationship. These results are also in line with Phiri and Nyoni (2015) who in South Africa viewed the absence of cointegration relations as an indication of inefficient usage of renewable energy in supporting sustainable growth. However, the findings contradict those of Islam et al. (2013) and Mukhtarov et al. (2018), who established a positive and negative statistically significant long-run nexus, respectively. Theoretically, neo-classical and endogenous theories both suggest that energy use and efficiency are drivers of economic growth and not the other way round (Bulfone 2020).
A unit increase in industrial value added (% of GDP) leads to 0.023131 increases in energy consumption, indicating that industrial value added (% of GDP) positively affects energy consumption in the long run. This outcome is consistent with the priori expectation following energy-use efficiency gains into a Cobb-Douglas production function. Sadorsky’s (2012) and Liu (2009) supports this finding and argues that industrialisation is a major factor contributing to a higher level of energy consumption due to the need of energy to fuel machinery and the increasing automation of productive techniques. These results are relevant to the case of South Africa which is experiencing a huge growth in the industrial sector, resulting in high volumes of energy demand. According to Liu (2009), industrial activity increase leads to high and advanced machinery use compared to traditional agriculture and basic manufacturing. Moreover, these are always linked with increases in energy. Therefore, countries like South Africa demand more energy because they have a highly industrialised economy.
A unit increase in the urban population (% of total population) leads to 0.383 increases in energy consumption in the long run. Against the theoretical ambiguity on a priori expectation, the results indicate that urban population (% of total population) positively influences energy consumption. The outcome corroborates Liu (2009); Shahbaz and Lean (2012); and Fedderke (2014) assertion that an economy will experience an overall increase in energy consumption because there has been a shift in production methods from those that are less to those that are very high, thus absolute advantage theory. This finding contradicts that of Sadorsky (2014), who found that energy consumption is not significantly reduced by urbanisation in a small sample of 18 developing economies, including South Africa. Furthermore, Sekantsi and Motlokoa (2015) confirmed no significant correlation between these variables. More growing demands threaten energy supply, leading to a peak power deficit being met through exports (Ahmed 2017).
The dummy variable (D) is negative and significant implying that economic growth was suppressed during the financial crisis era in South Africa. Thus, this was generally the trend worldwide.

4.5. Results of Short-Run Elasticities

Table 6 shows findings of the short run elasticities and the model’s error correction properties (ECM).
A unit increase in domestic credit to private sector by banks as a percentage of GDP leads to 0.026933 units in-crease in energy consumption in the short run. This corroborates the long-run elasticities and findings of Xu (2012) and Ma and Fu (2020) which highlights that credit for private sector development has substantial and positive influence on energy consumption.
A unit increase in real GDP growth increases energy consumption at 0.208532 units. These findings concur with the long run results, economic growth failed to explain energy consumption, similar to Adebola’s (2011) findings.
A unit increase in industrial value added (% of GDP) leads to 0.435756 increases in energy consumption in the short run. This finding is in line with the long run findings and concurs with empirical results of Gungor and Simon (2017) highlighting that increases in industrial value added (% of GDP) positively affects energy consumption.
A unit increase in urban population (% of total population) increases energy consumption at 0.016921 units in the short run. The findings are consistent with the long-run results and consistent with Avtar et al. (2019) who found a positive nexus between urbanization and energy consumption. According to Liu and Peng (2018), growth in urbanisation is always high, given the condition of a society or landscape. Urbanisation progress can be shown as follows: expansion in cities, huge infrastructure development, advancements in technology and industries (Gungor and Simon 2017). Error correction term −0.332685 with a probability of 0.0031, entails that the model displays 33% speed of adjustment to equilibrium indicating moderately strong adjustment. These results confirm reliability for the estimated long-run relationship, and also warrant an achievement of a long-run equilibrium after a system shock (Rüttenauer and Ludwig 2020).

4.6. Results of Granger Causality Test

Granger causality test results are displayed below in Table 7.
The hypothesis that FD does not Granger cause EC can be rejected because the p-value 0.0348 is less than 0.05 significance level. However, the hypothesis that EC does not Granger cause FD should not be rejected due to the fact that the p-value 0.8690 is more than 0.05 significance level. The outcome revealed unidirectional causality running from FD to EC, implying that financial development has a casual impact on per capita (kg of oil equivalent) supporting the demand following causality hypothesis. This finding matches the direct effect theory, which states that a healthy financial system helps the consumers to be able to consume more goods and services, providing an advantage to households and firms to be able to borrow money, resulting in high volumes of energy consumption (Furuoka 2015). Moreover, in line with the theoretical expectation, the findings concur with evidence of Sadorsky (2011) and Kotnik et al. (2020) corroborating that financial development induces increases in the demand for per capita (kg of oil equivalent).
The hypothesis that GDPC does not Granger cause EC cannot be rejected because the p-value 0.7757 is greater than the 0.05 significance level. However, the hypothesis that EC does not Granger cause GDPC should not be rejected because the p-value 0.3437 is more than 0.05 significance level. The results showed no statistical causality moving from GDPC to EC and from EC to GDPC. This is in line with neutrality hypothesis of Ma and Fu (2020), who got the same results and confirmed findings for Eden and Jin (1992) and Singh and Vashishtha (2020) who discovered that economic growth is not related to energy consumption in the long-run relationship. In turn, this suggests that the energy conservation policy can be used since it may not harm economic growth (Nkalu et al. 2020) and vice versa.
The hypothesis that IND does not Granger cause EC should be rejected because the p-value 0.0453 is less than 0.05 significance level. However, we fail to reject the hypothesis that EC does not Granger cause IND since the p-value of 0.4028 is more than 0.05 significance level. This shows unidirectional causality running from IND to EC. The outcome is in line with results of Gungor and Simon (2017) highlighting one-way causality between IND and EC. Moreover, development in different sectors has positively influenced a direct relationship between industrial activity and energy demand in the economy (Gungor and Simon 2017). This increase in industrial activity demanded more energy compared to basic manufacturing and traditional agriculture (Sekantsi and Timuno 2017). Again, in line with the environmental Kuznets Curve (EKC) theory, as industries grow, energy demand also increases, creating higher environmental degradation while positively increasing the economic growth of a country (Ahmed 2017).
The hypothesis that URB does not Granger cause EC should not be rejected. This is because the p-value 0.1100 is more than 0.05 significance level. Moreover, the hypothesis that EC does not Granger cause URB cannot be rejected since the p-value of 0.0821 is greater than 0.05 significance level. The results revealed absence of causality from URB to EC, but a unidirectional causality from EC to URB at 10% significant level. Though the theoretical linkage is generally ambiguous, empirical evidence of Sekantsi and Timuno (2017) and Nkalu et al. (2020) also concur with this result suggesting as people move to urban areas the energy demand increases. However, a relationship showing these variables were positive was found by Nasreen and Anwar (2014).
Based on the Granger causality test results, the findings support the hypothesis that financial development leads to energy consumption validating the short-run and long-run relationship following causality hypothesis in South Africa.

4.7. Diagnostic Test

This paper performs a number of further robustness tests to check the fitness of the model.

4.7.1. Results of Serial Correlation

Table 8 shows the Breusch (1978) and Godfrey (1978) Lagrange Multiplier serial correlation LM test results.
The results revealed that the p-value of the Probability of Chi-Squared 0.8733 is greater than 0.05 significance level. Therefore, the null hypothesis cannot be rejected highlighting that there is no correlation in the residuals.

4.7.2. Results of Heteroscedasticity

Table 9 displays results of the ARCH test of Engle (1982) for heteroscedasticity.
The results showed that the probability of Chi-Squared 0.1951 is greater than 0.05 significance level. Therefore, the study fails to reject the null hypothesis. This suggests that there is no heteroscedasticity in the residuals.

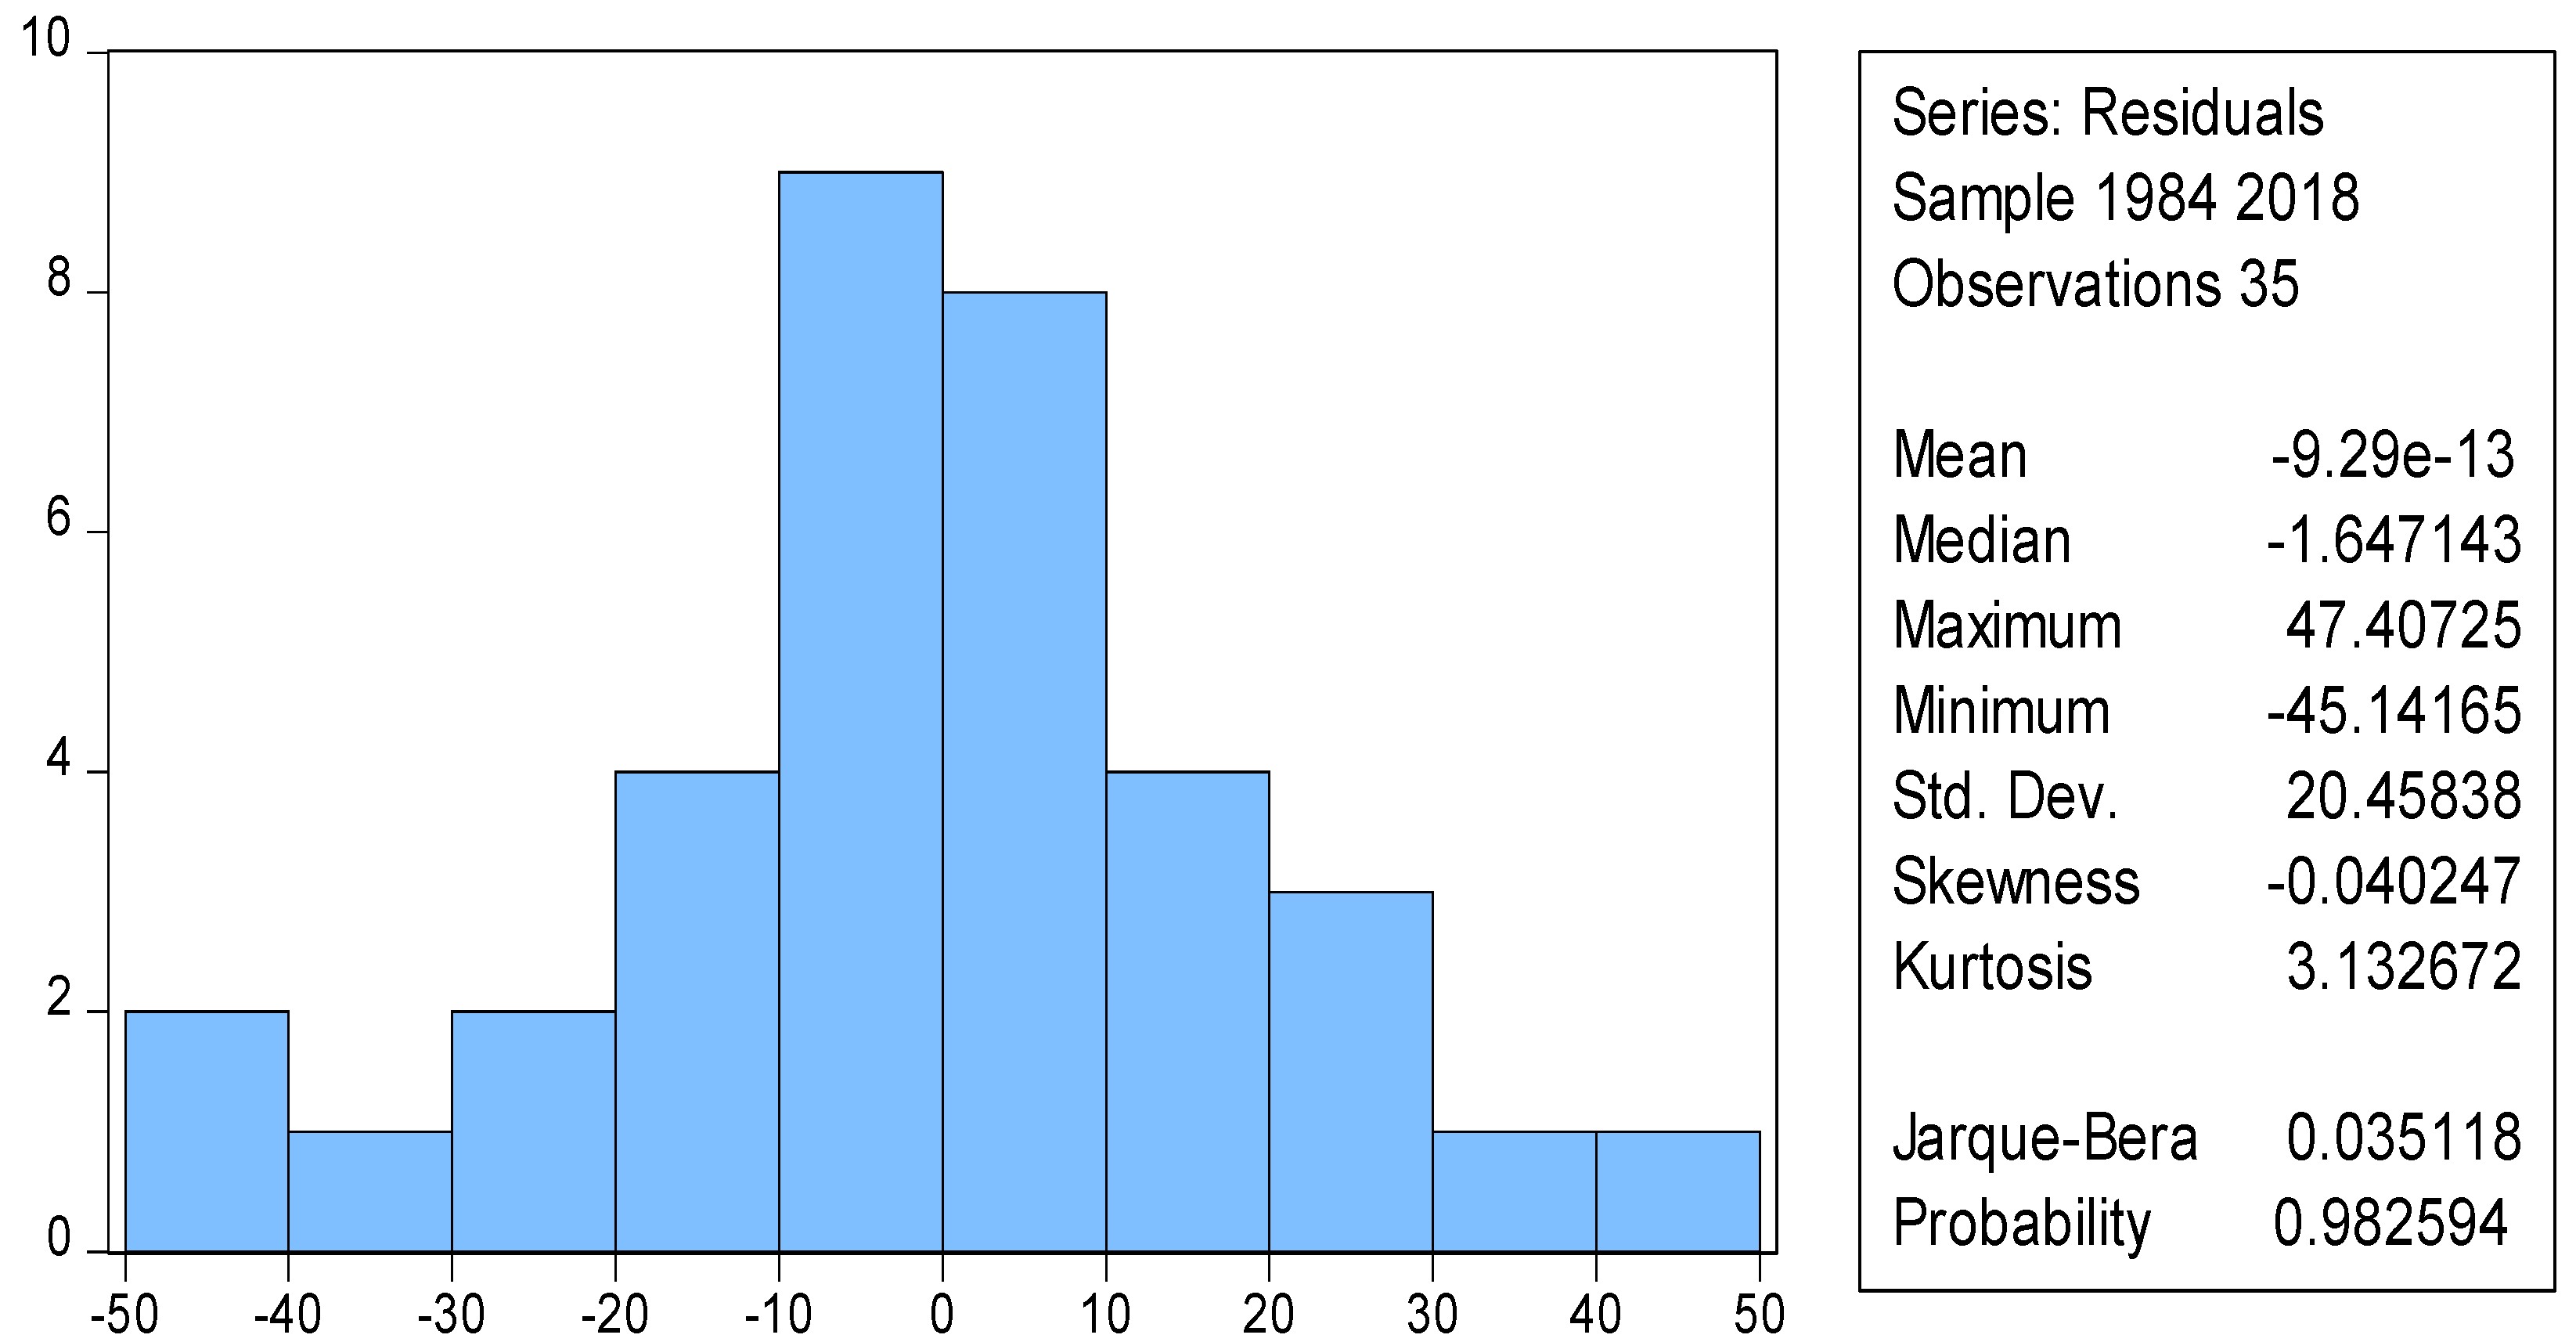
4.7.3. Results of Normality

Figure 1 shows the Jarque and Bera (1980); and Jarque and Bera (1987) test to check residuals for normality.
The results showed that the probability of Jarque-Bera statistic 0.9825 is beyond the 5% significant level. The study thus failed to reject the null hypothesis. This suggests that all series are normally distributed.

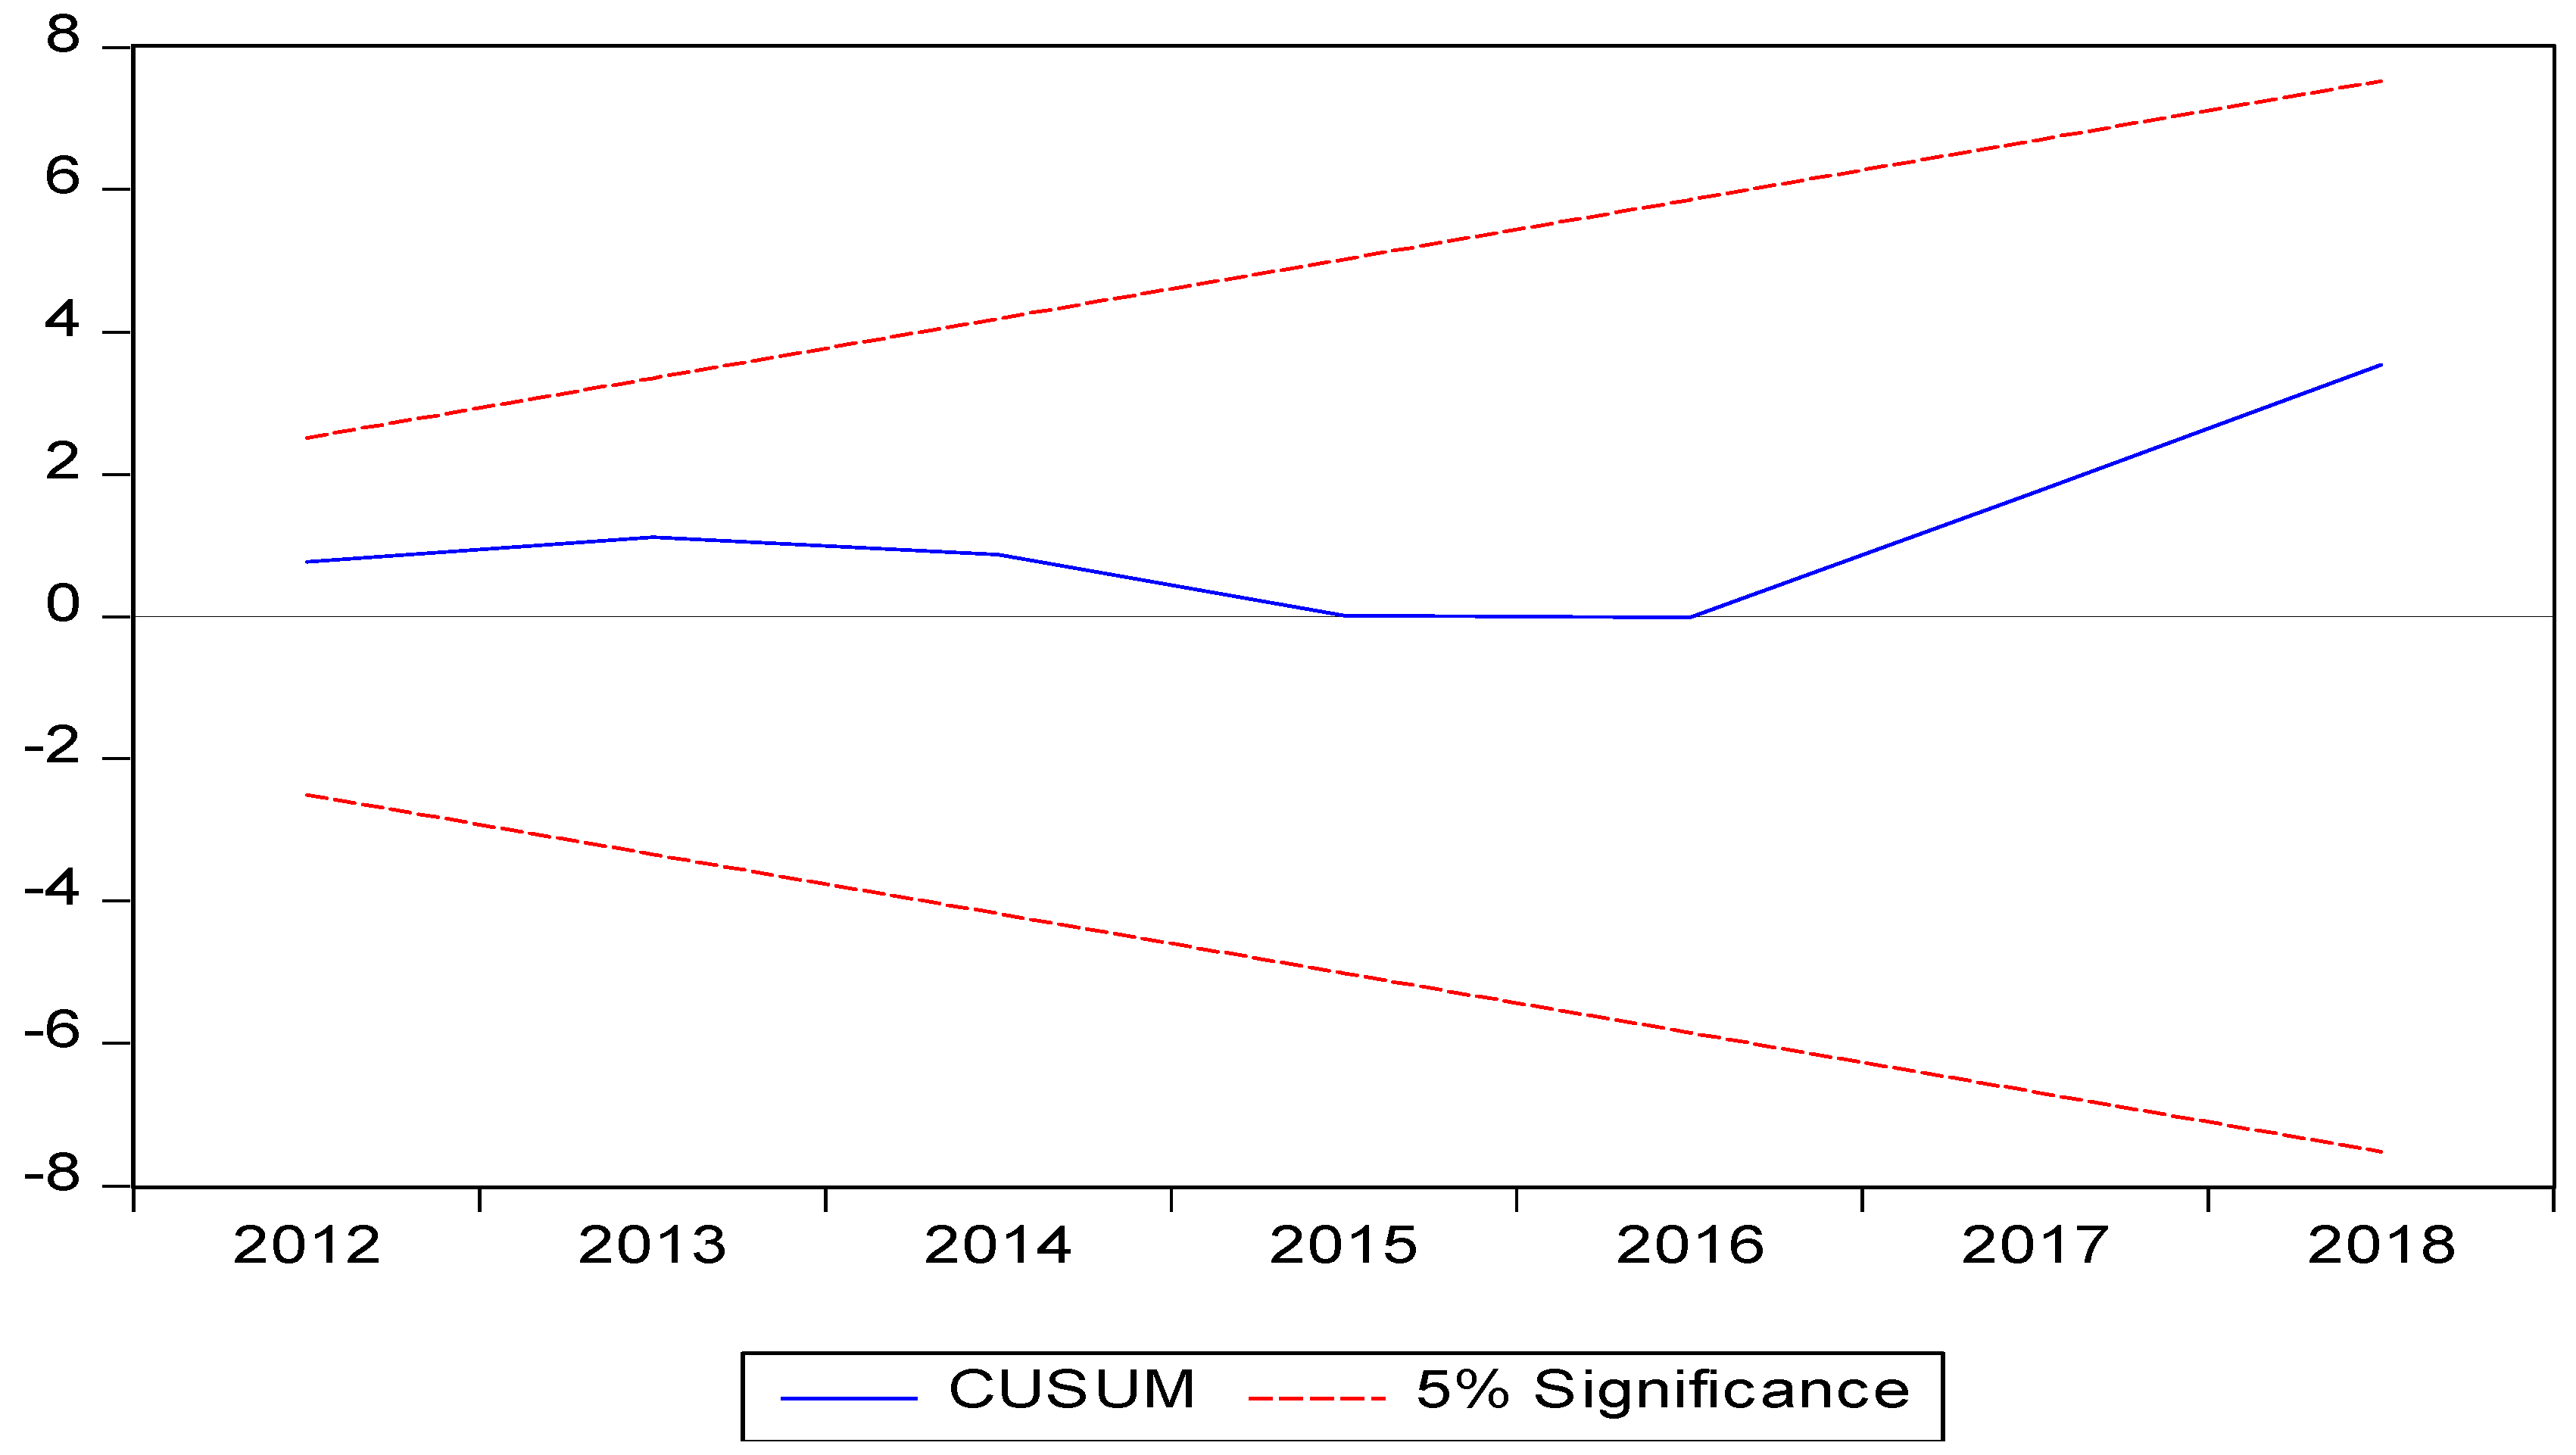
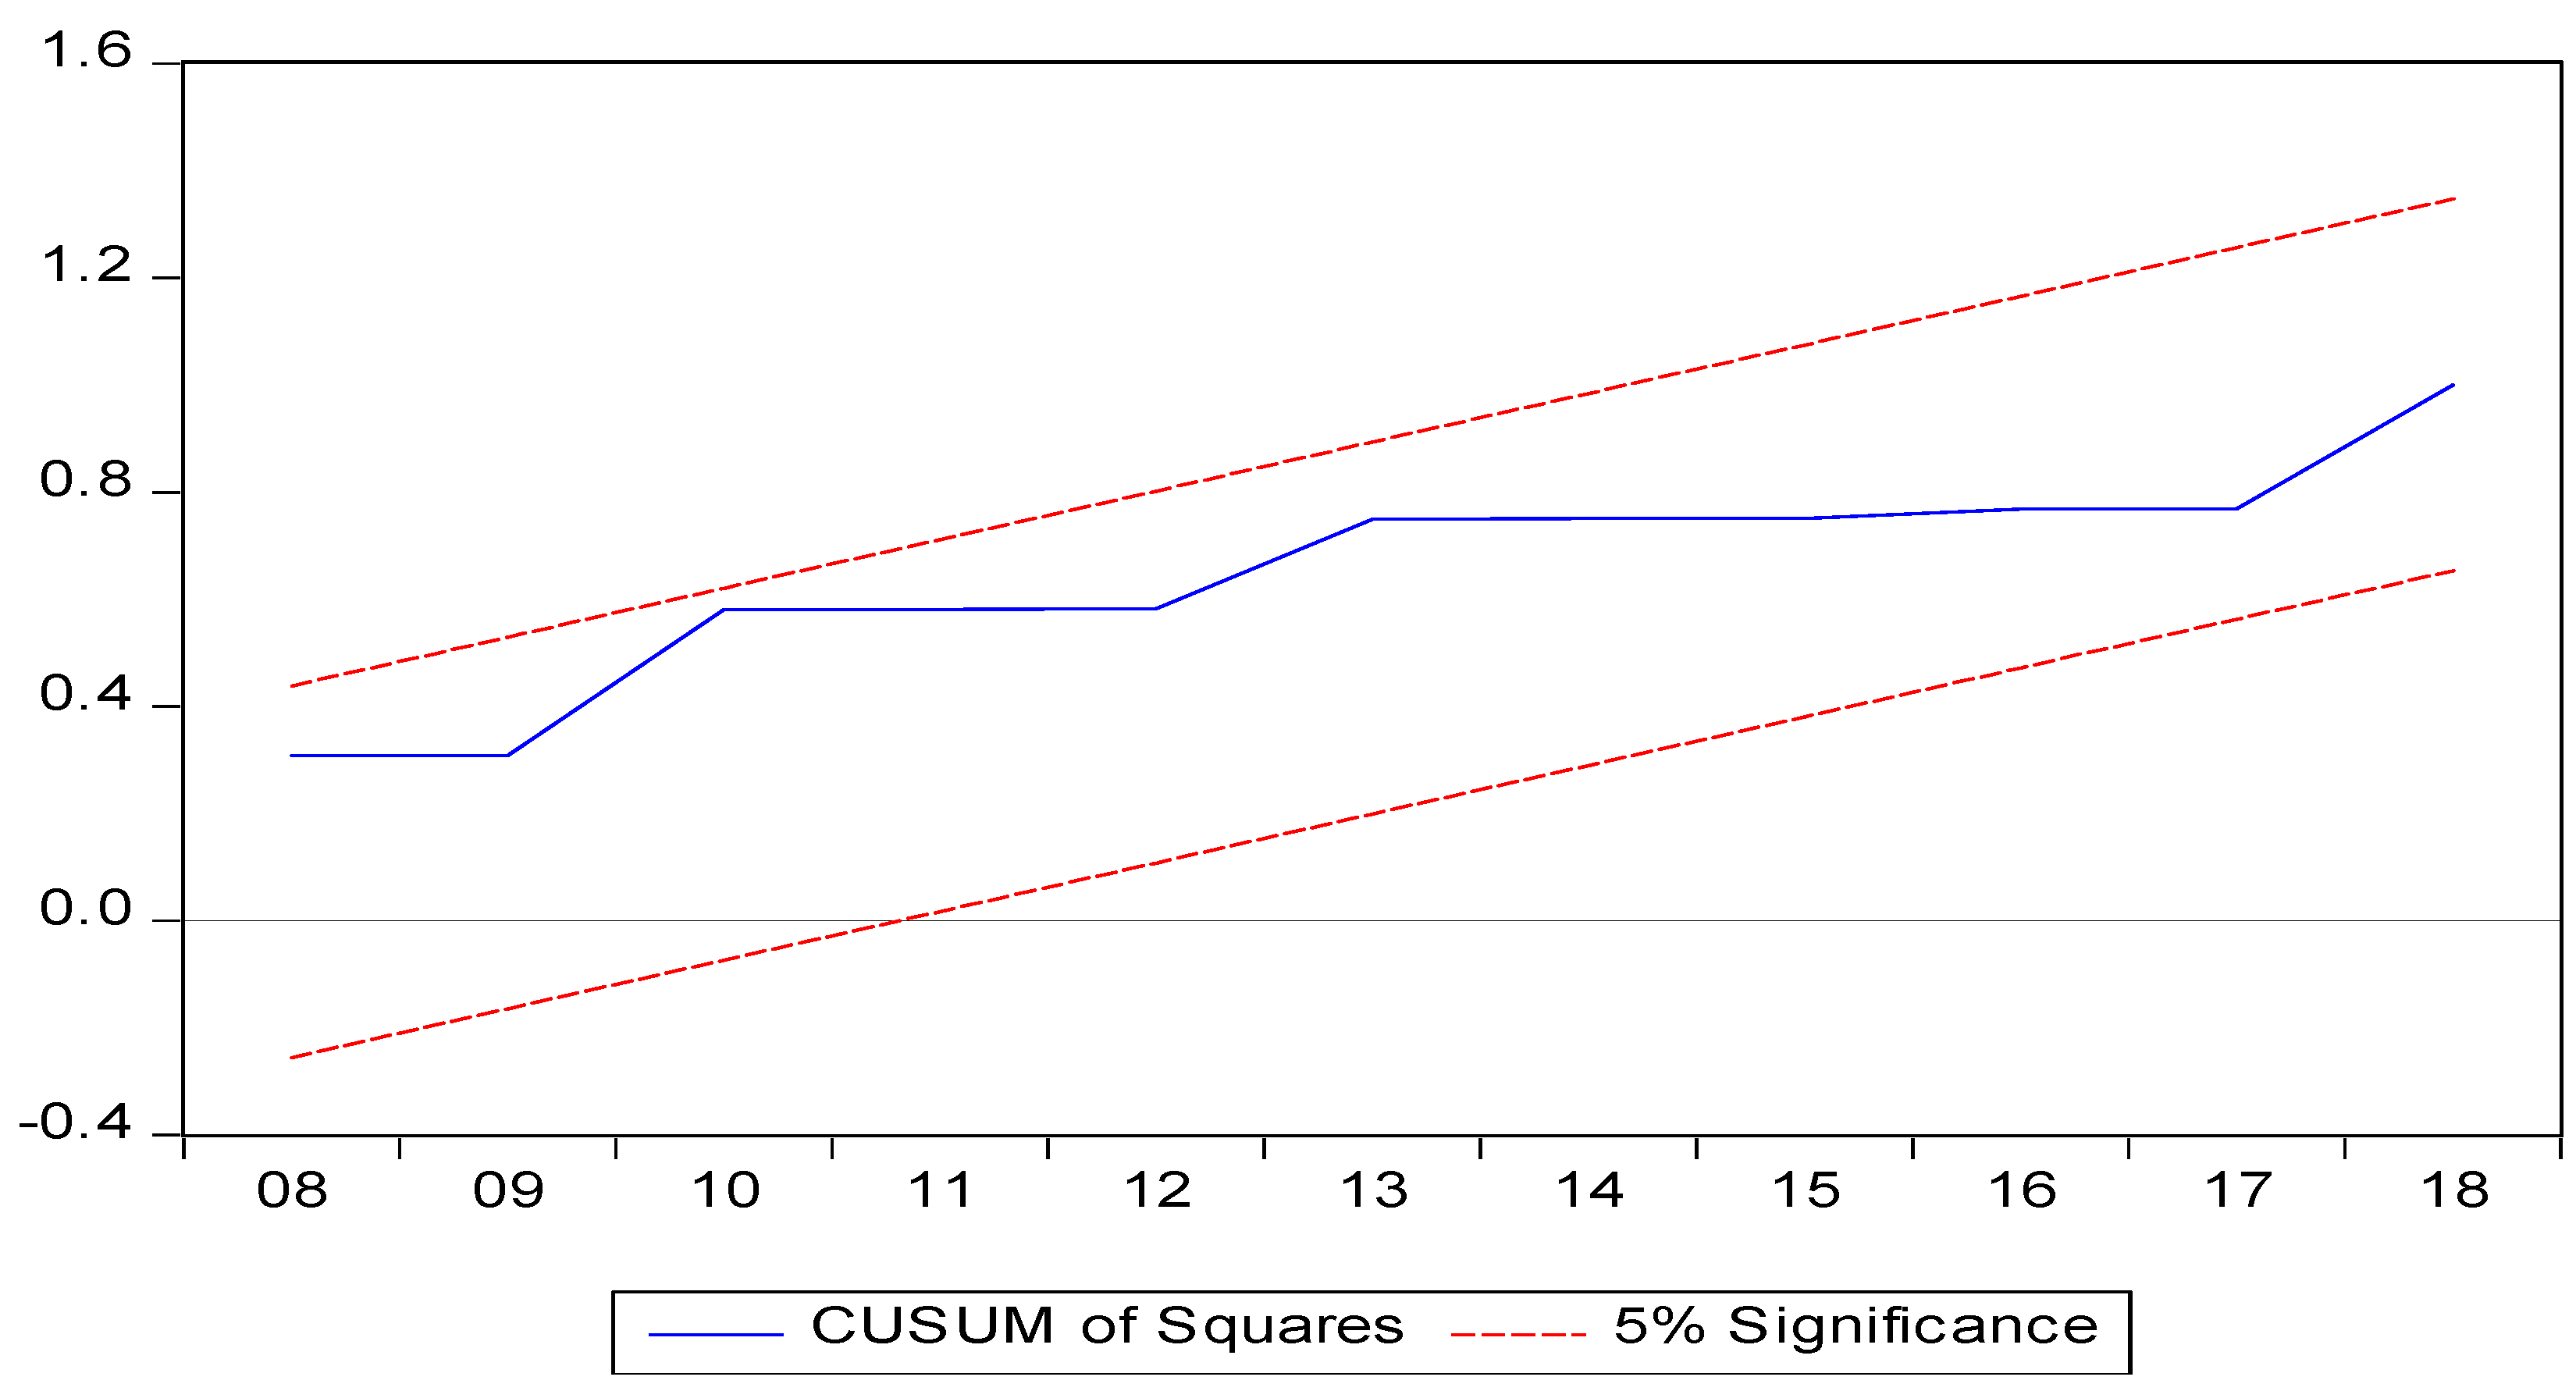
4.7.4. Results of Parameter Stability

Figure 2 and Figure 3 plot the result of the cumulative sum of recursive residuals (CUSUM) and CUSUM of square (CUSUMSQ) tests for parameter stability.
Figure 2 and Figure 3 display that the plot of the CUSUM and CUSUMSQ statistic falls inside the critical bands of 5% confidence interval of parameter stability. This shows absence of any instability of the coefficients thus confirming stability of all coefficients in the model. Accordingly, this led to the conclusion that the relationship between financial development and energy consumption is of a long-running nature in South Africa.
In a nutshell, this study used eviews 10 to construct an ARDL model and findings were provided. Unit root test results showed that most variables were stationary at first difference and were free from unit root besides two variables were stationary at level suggesting a need to conduct an ARDL bound cointegration test. The bound test results indicated a long-term and short run association amongst the variables under investigation. The error correction model was significant and high which established a stable long-term association among the variables. These findings were not far from the preceding expectation. A Granger causality test was also performed and confirmed that the hypothesis that financial development does not Granger cause energy consumption was rejected. However, the hypothesis that energy consumption does not Granger cause financial development was not rejected. Findings highlight a unidirectional causality association from financial development and energy consumption. The model used in this study conceded all the diagnostic tests—serial correlation, normality, heteroscedasticity and parameter stability tests.

5. Conclusions

The study examined the empirical relationship between financial development and energy consumption in South Africa between 1980 and 2018. The theoretical framework and the empirical literature confirmed existence of a relationship between financial development and energy consumption in most countries. The study specified an empirical model that estimates a linear production function between financial development and energy consumption. Using ARDL bounds test, the study established short-run and long-run cointegration relationship between financial development and energy consumption. The Granger causality test results verified the theoretical linkage that financial development leads to a positive and significant effect on energy consumption in South Africa validating the alternative hypothesis, financial development has a significant relationship with energy consumption in South Africa. Moreover, this study differs from others, since it looked from all directions between the variables under the study and discovered a unidirectional nexus between financial development and energy consumption.
Considering these findings, policymakers formulate policies that embolden the financial sector to boost the energy sector in South Africa in an appropriate and sufficient manner. They must contain efficient energy projects to produce sustainable clean energy. The study suggests some policy recommendations for each variable used in the study.
Energy consumption policy: First and foremost, it is imperative for policymakers to consider increases in energy consumption caused by increases in financial development. This would help to avoid and escape an energy crisis in the economy. However, if it happens that a country fails to do so, this may result in the country underestimating the energy demand and may also suppress economic growth. The South African government must consider the importance of the financial sector in funding commercial projects and research, development to help and encourage innovation and promotion of electricity savings technologies and products. This will help to reduce high volumes of energy consumption so as to fast-track economic growth and industrialisation and urban population expansions through increases in business activities. Lastly, the government should consider employing renewable energy since it is a super-smart choice for humans and the environment, it never runs out, it never damages the planet, it is a low-maintenance energy source, and it is good news for regional areas.
Financial development policy: Results confirmed that in South Africa, financial development increases energy consumption. These findings recommend that policymakers in South Africa should focus more on domestic energy resource development to escape external shocks, given its dependency on energy technologies. The South African government must take correct measures to address competent financial development policies, a well-established organizational structure, and vigorous changes in technology that can motivate effective energy production. To produce a sound energy infrastructure and capitalization process, government needs to encourage the financial sector to formulate new financial policy.
Economic growth policy: Findings in this study revealed that economic growth failed to explain energy consumption in South Africa. From the literature review, it was noted that South Africa depends more on international trade, variation of energy supply technologies in order to meet energy consumption, and upsurges with the growth are vital.
On energy planning for the country of South Africa, a significant increase in economic growth which will contribute to energy consumption growth should be noted. Leakages in the system, which could reduce economic growth, should be controlled by fiscal discipline in the short-run and long-run dynamics.
Industrialization policy: Additionally, the results of this study suggest that electricity consumption is increased by industrialization. This entails that any industrial policy aimed at increasing industrialization spurs electricity demand in South Africa. This is essential for the economy to ensure efficient use of available energy resources, to improve the capacity of the existing electricity facilities, and to manage electricity production hikes with growing electricity demands. The government must allow private industrial investments in renewable energy to expand and provide access to cheap energy. The latter shows that industrial growth in South Africa demands more energy in production. South African energy policymakers should ensure the availability of electricity by promoting efficient energy use and exploring other sources of energy.
Urbanization policy: The results of this study suggest that electricity consumption is increased by urbanization. The historical interconnectedness of urbanization recommended that the regulatory framework of urbanization has improved energy consumption. This suggests that for a continuously sustainable population, the study recommends a very strong commitment by policymakers in South Africa to investments in energy renewable sources to protect against carbon pollutants rising along with energy consumption. The government of South Africa must warrant an adequate and efficient energy supply in balancing miscellaneous citizens and provide fair energy consumption for the entire country.
In a nutshell, this study aimed at examining the financial development and energy consumption relationship in South Africa from 1980 to 2018. The study concludes by highlighting, based on the findings, that financial development increases energy consumption in South Africa and is significant. Thus, validating energy demands following the causality hypothesis in South Africa. The findings from the previous chapter support the alternative hypothesis which simply states that the financial development significantly correlates with energy consumption in South Africa. This was verified by the granger causality test from the previous chapter. Moreover, scarcity of quarterly data for most chosen and suggested variables by the theoretical models was the main limitation. This study further used a few years of secondary data, instead of quarterly secondary data. With regards to the economic growth, not only does overvaluation or undervaluation affect the energy consumption but also the significant magnitude thereof. Growth is unpredictable after a global financial crisis. A recommended area for further research is the economic growth (GDP) impact on energy consumption in South Africa.

Author Contributions

P.M.L. is the main author of the entire study, a student studying towards a masters of commerce in economics. K.S., the second author, is the main supervisor of the entire study. R.G. is the co-supervisor of the entire study. All authors have contributed to each and every part of this study. All authors have read and agreed to the published version of the manuscript.

Funding

The authors received financial support for the research from Matatiele Local Municipality and for authorship, and/or publication of this article from Walter Sisulu University.

Institutional Review Board Statement

Informed consent was obtained from all subjects involved in the study. The study was conducted according to the guidelines of the Declaration of Dr. Y. S. Hosu and Professor S. Balkaran, and approved by Ethics Committee of Walter Sisulu University (protocol code 2021/19/FCA/EBS on the 5th March 2021).

Data Availability Statement

The authors are grateful to the world bank datasets which was used in this paper (https://data.worldbank.org/indicator/ accessed on 16 September 2020).

Acknowledgments

The authors are grateful to the Editor and Walter Sisulu University.

Conflicts of Interest

The authors declared no potential conflict of interest with respect to the research, authorship, and/or publication of this article. The funders had no role in the design of the study; in the collection, analyses, or interpretation of data; in the writing of the manuscript, or in the decision to publish the results.

References

  1. Adebola, Sakiru Solarin. 2011. Electricity consumption and economic growth: Trivariate investigation in Botswana with capital formation. International Journal of Energy Economics and Policy 1: 32–46. [Google Scholar]
  2. Ahmed, Khalid. 2017. Revisiting the role of financial development for energy-growth-trade nexus in BRICS (Brazil, Russia, India, China, and South Africa) economies. Energy 128: 487–95. [Google Scholar] [CrossRef]
  3. Al-Mulali, Usama, and Janice Ying Lee. 2013. Estimating the impact of the financial development on energy consumption: Evidence from the GCC (Gulf Cooperation Council) countries. Energy 60: 215–21. [Google Scholar] [CrossRef]
  4. Alexandra, Jason. 2020. The science and politics of climate risk assessment in Australia’s Murray Darling Basin. Environmental Science and Policy 112: 17–27. [Google Scholar] [CrossRef]
  5. Avtar, Ram, Saurabh Tripathi, Ashwani Kumar Aggarwal, and Pankaj Kumar. 2019. Population-urbanization-energy Nexus: A review. Resources 8: 136. [Google Scholar] [CrossRef] [Green Version]
  6. Baloch, Muhammad Awais, Danish, and Fanchen Meng. 2019. Modelling the non-linear relationship between financial development and energy consumption: Statistical experience from OECD (Organisation for Economic Co-operation and Development) countries. Environmental Science and Pollution Research 26: 8838–46. [Google Scholar] [CrossRef]
  7. Bayer, Yilmaz, Mehmet Hilmi Ozkaya, Laura Herta, and Marius Dan Gavriletea. 2021. Financial Development, Financial Inclusion and Primary Energy Use: Evidence from the European Union Transition Economies. Energies 14: 3638. [Google Scholar] [CrossRef]
  8. Bernanke, Ben. 2008. Outstanding issues in the analysis of inflation. In Understanding Inflation and the Implications for Monetary Policy. Edited by Jeff Fuhrer, Yolanda Kodrzycki, Jane Sneddon Little and Giovanni Olivei. Cambridge: MIT Press, pp. 447–56. [Google Scholar]
  9. Breusch, Trevor Stanley. 1978. Testing for autocorrelation in dynamic linear models. Australian Economics Papers 17: 334–55. [Google Scholar] [CrossRef]
  10. Bulfone, Fabio. 2020. New forms of industrial policy in the age of regulation: A comparison of electricity and telecommunications in Italy and Spain. Governance 33: 93–108. [Google Scholar] [CrossRef]
  11. Cheng, Benjamin Shin, and Tin Wei Lai. 1997. Government expenditures and economic growth in South Korea: A VAR approach. Journal of Economic Development 22: 11–24. [Google Scholar]
  12. Chitiyo, Fadzai Emmah. 2017. Demand for Non-Life Insurance: Evidence from Select Insurance Markets in Africa. Master’s thesis, Graduate School of Business, University of Cape Town, Cape Town, South Africa. [Google Scholar]
  13. Chowdhury, Hemal, Tamal Chowdhury, Piyal Chowdhury, Monirul Islam, Rahman Saidur, and Sadiq M. Sait. 2019. Integrating sustainability analysis with sectoral exergy analysis: A case study of rural residential sector of Bangladesh. Energy and Buildings 202: 109397. [Google Scholar] [CrossRef]
  14. Cornia, Giovanni Andrea, Tony Addison, and Sampsa Kiiski. 2003. Income Distribution Changes and Their Impact in the Post-World War II Period. UNU-WIDER Discussion Papers No.2003/28. Available online: http://hdl.handle.net/10419/52822 (accessed on 30 November 2020).
  15. Destek, Mehmet Akif. 2018. Financial development and energy consumption nexus in emerging economies. Energy Sources, Part B: Economics, Planning, and Policy 13: 76–81. [Google Scholar] [CrossRef]
  16. Dutt, Amitava Krishna. 2017. Heterodox theories of economic growth and income distribution: A partial survey. Journal of Economic Surveys 31: 1240–71. [Google Scholar] [CrossRef]
  17. Eden, Yu S. H., and Jang C. Jin. 1992. Cointegration tests of energy consumption, income, and employment. Resources and Energy 14: 259–66. [Google Scholar]
  18. Engle, Robert Fry. 1982. Autoregressive Conditional Heteroskedasticity with Estimates of the Variance of United Kingdom Inflation. Econometrica 50: 987–1007. [Google Scholar] [CrossRef]
  19. Fedderke, Johannes Wolfgang. 2014. Exploring Unbalanced Growth in South Africa Understanding the Sectoral Structure of the South African Economy. ERSA Working Paper No. 468. Johannesburg: Economic Research Southern Africa. [Google Scholar]
  20. Furuoka, Fumitaka. 2015. Financial development and energy consumption: Evidence from a heterogeneous panel of Asian countries. Renewable and Sustainable Energy Reviews 52: 430–44. [Google Scholar] [CrossRef]
  21. Godfrey, Leslie George. 1978. Testing against general autoregressive and moving average error models when the regressors include lagged dependent variables. Econometrica 46: 1293–301. [Google Scholar] [CrossRef]
  22. Gómez, Mario, and Jose Carlos Rodríguez. 2019. Energy consumption and financial development in NAFTA countries, 1971–2015. Applied Sciences 9: 302. [Google Scholar] [CrossRef] [Green Version]
  23. Grossman, Gene Michael, and Alan Bennett Krueger. 1991. Environmental Impacts of a North American Free Trade Agreement. No. w3914. Cambridge: National Bureau of Economic Research. [Google Scholar]
  24. Gujarati, Damodar N., and Dawn C. Porter. 2010. Basic Econometrics, 5th ed. New York: McGraw-Hill Education. [Google Scholar]
  25. Gungor, Hasan, and Angela Uzoamaka Simon. 2017. Energy consumption, finance and growth: The role of urbanization and industrialization in South Africa. International Journal of Energy Economics and Policy 7: 268–76. [Google Scholar]
  26. Haider, Salman, and Masudul Hasan Adil. 2019. Does financial development and trade openness enhance industrial energy consumption? A sustainable developmental perspective. Management of Environmental Quality: An International Journal 30: 1297–313. [Google Scholar] [CrossRef]
  27. Hui, Tin-Yu Jonathan. 2012. Testing for Random Walk Hypothesis with or without Measurement Error. Master’s thesis, Imperial College, London, UK. [Google Scholar]
  28. Iheonu, Okechukwu Chimere, Simplice Asongu, Kingsley Odo, and Patric K. Ojiem. 2020. Financial sector development and investment in selected ECOWAS (Benin, Burkina Faso, Cabo Verde, Cote d’Ivoire, The Gambia, Ghana, Guinea, Guinea-Bissau, Liberia, Mali, Niger, Nigeria, Senegal, Sierra Leone, and Togo) countries: Empirical evidence using heterogeneous panel data method. Financial Innovations 6: 1–15. [Google Scholar]
  29. Islam, Faridul, Muhammad Shahbaz, Ashraf Uddin Ahmed, and Md Mahumudul Alam. 2013. Financial development and energy consumption nexus in Malaysia: A multivariate time series analysis. Economic Modelling 30: 435–41. [Google Scholar] [CrossRef] [Green Version]
  30. Jarque, Carlos M., and Anil K. Bera. 1980. Efficient tests for normality, homoscedasticity and serial independence of regression residuals. Economics Letters 6: 255–59. [Google Scholar] [CrossRef]
  31. Jarque, Carlos M., and Anil K. Bera. 1987. A Test for Normality of Observations and Regression Residuals. International Statistical Review / Revue Internationale de Statistique 55: 163–72. [Google Scholar] [CrossRef]
  32. Kakar, Zaheer Khan. 2016. Financial development and energy consumption: Evidence from Pakistan and Malaysia. Energy Sources, Part B: Economics, Planning, and Policy 11: 868–73. [Google Scholar] [CrossRef]
  33. Karakurt, Metehan, and Aykut Aykutalp. 2020. Can Social Media Be Seen as a New Public Sphere in the Context of Hannah Arendt’s Public Sphere Theory? London: IJOPEC Publication Limited. [Google Scholar]
  34. Keskingoz, Hayrettin, and Selim Inancli. 2016. The causality between financial development and energy consumption in Turkey: The period of 1960–2011. Journal of Economics and Administrative Sciences 11: 101–14. [Google Scholar]
  35. Kotnik, Žaga, Lan Umek, Polonca Kovač, Dalibor Stanimirović, and Mikro Vintar. 2020. Analysis of the key factors for successful public policy implementation: A qualitative study in Slovenia. DANUBE: Law, Economics and Social Issues Review 11: 113–40. [Google Scholar] [CrossRef]
  36. Kregel, Jan A. 2004. External Financing for Development and International Financial Instability. G-24 Discussion Paper No. 32. New York and Geneva: UNCTAD. [Google Scholar]
  37. Kregel, Jan A. 2010. What would Minsky have thought of the mortgage crisis? In The Elgar Companion to Hyman Minsky. Edited by Dimitri B. Papadimitriou and L. Randall Wray. Cheltenham: Edward Elgar Publishing, chp. 2. [Google Scholar]
  38. Liu, Xiaoyu, and Duyun Peng. 2018. Study on the threshold effect of urbanization on energy consumption. Theoretical Economics Letters 8: 2220. [Google Scholar] [CrossRef] [Green Version]
  39. Liu, Yaobin. 2009. Exploring the relationship between urbanization and energy consumption in China using ARDL (autoregressive distributed lag) and FDM (factor decomposition model). Energy 34: 1846–54. [Google Scholar] [CrossRef]
  40. Lukasiewicz, Mariusz. 2018. The making of the Johannesburg Stock Exchange, 1888–1890. Journal of Southern African Studies 43: 715–32. [Google Scholar] [CrossRef]
  41. Ma, Xiaoxin, and Qiang Fu. 2020. The influence of financial development on energy consumption: Worldwide evidence. International Journal of Environmental Research and Public Health 17: 1428. [Google Scholar] [CrossRef] [PubMed] [Green Version]
  42. Mahalik, Mantu Kumar, and Hrushikesh Mallick. 2014. Energy consumption, economic growth and financial development: Exploring the empirical linkages for India. The Journal of Developing Areas 48: 139–59. [Google Scholar] [CrossRef]
  43. Mahalik, Mantu Kumar, M. Suresh Babu, Nanthakumar Loganathan, and Muhammed Shahbaz. 2017. Does financial development intensify energy consumption in Saudi Arabia? Renewable and Sustainable Energy Reviews 75: 1022–34. [Google Scholar] [CrossRef] [Green Version]
  44. Masanet-Llodra, Maria Jose. 2012. Environmental Management in Businesses: Does It Make Money? An Accounting Perspective. London: InTech. [Google Scholar] [CrossRef] [Green Version]
  45. Minsky, Hyman Philip. 1982. The Financial-Instability Hypothesis: Capitalist Processes and the Behavior of the Economy. Hyman P. Minsky Archive Paper No. 282. Available online: http://digitalcommons.bard.edu/hm_archive/282 (accessed on 13 October 2020).
  46. Mukhtarov, Shahriyar, Jeyhun I. Mikayilov, Jeyhun Mammadov, and Elvin Mammadov. 2018. The impact of financial development on energy consumption: Evidence from an oil-rich economy. Energies 11: 1536. [Google Scholar] [CrossRef] [Green Version]
  47. Mukhtarov, Shahriyar, Sugra Humbatova, Ilgar Seyfullayev, and Yashar Kalbiyev. 2020a. The effect of financial development on energy consumption in the case of Kazakhstan. Journal of Applied Economics 23: 75–88. [Google Scholar] [CrossRef] [Green Version]
  48. Mukhtarov, Shahriyar Sugra Humbatova, Natig Gadim-Oglu Hajiyev, and Sannur Aliyev. 2020b. The financial development—Renewable energy consumption nexus in case of Azerbaijan. Energies 13: 6265. [Google Scholar] [CrossRef]
  49. Muyambiri, Brian, and Nicholas Mbaya Odhiambo. 2018. South Africa’s financial development and its role in investment. Journal of Central Banking Theory and Practice 7: 101–120. [Google Scholar] [CrossRef]
  50. Narayan, Paresh, and Saud Al-Siyabi. 2005. An Empirical Investigation of the Determinants of Oman’s National Savings. Economics Bulletin 3: 1–7. [Google Scholar]
  51. Nasreen, Samia, and Sofia Anwar. 2014. Causal relationship between trade openness, economic growth and energy consumption: A panel data analysis of Asian countries. Energy Policy 69: 82–91. [Google Scholar] [CrossRef]
  52. Nkalu, Chigozie Nelson, Samuel Chinwero Ugwu, Fredrick Onyebuchi Asogwa, Mwuese Patricia Kuma, and Queen O. Onyeke. 2020. Financial development and energy consumption in Sub-Saharan Africa: Evidence from Panel Vector Error Correction Model. Sage Open 10: 1–12. [Google Scholar] [CrossRef]
  53. Nowbutsing, Baboo A. 2014. The impact of openness on economic growth: Case of Indian Ocean rim countries. Journal of Economics and Development Studies 2: 407–427. [Google Scholar]
  54. Odhiambo, Nicholas Mbaya. 2010. Energy consumption, prices and economic growth in three SSA countries: A comparative study. Energy Policy 38: 2463–69. [Google Scholar] [CrossRef]
  55. Odhiambo, Nicholas Mbaya. 2018. Energy Consumption and Financial Development in South Africa: An Empirical Investigation. UNISA Economic Research Working Paper Series No. 03; Pretoria: University of South Africa, Preliminary Statement. [Google Scholar] [CrossRef] [Green Version]
  56. Odhiambo, Nicholas Mbaya. 2019. Energy consumption and financial development in South Africa: An empirical investigation. Ekonomski Pregled 70: 41–61. [Google Scholar] [CrossRef] [Green Version]
  57. Paganini, Fernando. 1994. White Noise Rejection in a Deterministic Setting. Pasadena: California Institute of Technology Pasadena Department of Electrical Engineering. [Google Scholar]
  58. Pesaran, M. Hashem, and Yongcheol Shin. 1999. An autoregressive distributed lag modeling approach to cointegration analysis. In Econometrics and Economic Theory in the 20th Century: The Ragna Frisch centennial Symposium. Edited by S. Strom. Cambridge, UK: Cambridge University Press. [Google Scholar]
  59. Pesaran, M. Hashem, Yoncheol Shin, and Richard J. Smith. 2001. Bounds testing approaches to the analysis of level relationships. Journal of Applied Econometrics 16: 289–326. [Google Scholar] [CrossRef]
  60. Peterson, E. Wesley F. 2017. The role of population in economic growth. Sage Open 7. [Google Scholar] [CrossRef] [Green Version]
  61. Phiri, Andrew, and Bothwell Nyoni. 2015. Re-Visiting the Electricity-Growth Nexus in South Africa, Munich. Available online: https://mpra.ub.uni-muenchen.de/id/eprint/64489 (accessed on 30 November 2020).
  62. Piketty, Thomas. 2013. The Kuznets’ curve, yesterday and tomorrow. In Understanding Poverty. Edited by Abhijit Vinayak Banerjee, Ronald Benabou and Dilip Mookherjee. Oxford: Oxford University Press. [Google Scholar]
  63. Raza, Syed Ali, Muhammad Shahbaz, and Duc Khuong Nguyen. 2015. Energy conservation policies, growth and trade performance: Evidence of feedback hypothesis in Pakistan. Energy Policy 80: 1–10. [Google Scholar] [CrossRef] [Green Version]
  64. Raza, Syed Ali, Nida Shah, Muhammad Asif Qureshi, Shahzad Qaiser, Ramsha Ali, and Farhan Ahmed. 2020. Non-linear threshold effect of financial development on renewable energy consumption: Evidence from panel smooth transition regression approach. Environmental Science and Pollution Research 27: 32034–47. [Google Scholar] [CrossRef]
  65. Regan, Michael. 2017. Capital markets, infrastructure investment and growth in the Asia Pacific region. International Journal of Financial Studies 5: 5. [Google Scholar] [CrossRef] [Green Version]
  66. Rehman, Mobeen Ur, and Mushab Rashid. 2017. Energy consumption to environmental degradation, the growth appetite in SAARC nations. Renewable Energy 111: 284–94. [Google Scholar] [CrossRef]
  67. Renke, Stefan, and Reinhard Steennot. 2020. The marketing of consumer and mortgage credit as a responsible lending tool: A comparison of South African, European and Belgian Law: Part 1. PER: Potchefstroomse Elektroniese Regsblad 23: 1–26. [Google Scholar]
  68. Roubaud, David, and Muhammad Shahbaz. 2018. Financial development, economic growth, and electricity demand: A sector analysis of an emerging economy. The Journal of Energy and Development 43: 47–98. [Google Scholar]
  69. Rüttenauer, Tobias, and Volker Ludwig. 2020. Fixed effects individual slopes: Accounting and testing for heterogeneous effects in panel data or other multilevel models. Sociological Methods & Research 34: 52–63. [Google Scholar]
  70. Sadorsky, Perry. 2011. Financial development and energy consumption in central and eastern European frontier economies. Energy Policy 39: 999–1006. [Google Scholar] [CrossRef]
  71. Sadorsky, Perry. 2012. Energy consumption, output and trade in South America. Energy Economics 34: 476–88. [Google Scholar] [CrossRef]
  72. Sadorsky, Perry. 2014. The effect of urbanization on CO2 emissions in emerging economies. Energy Economics 41: 147–53. [Google Scholar] [CrossRef]
  73. Sadorsky, Perry. 2019. The impact of financial development on energy consumption in emerging economies. Energy Policy 38: 2528–35. [Google Scholar] [CrossRef]
  74. Sadraoui, Tarek, Hamid Hamlaoui, Zine Youness, and B. I. Sadok. 2019. A dynamic panel data analysis for relationship between energy consumption, financial development and economic growth. International Journal of Econometrics and Financial Management 7: 20–26. [Google Scholar] [CrossRef] [Green Version]
  75. Sare, Yakubu Awudu. 2019. Effect of financial sector development on energy consumption in Africa: Is it threshold specific? International Journal of Green Energy 16: 1637–45. [Google Scholar] [CrossRef]
  76. Sbia, Rashid, Muhammad Shahbaz, and Iihan Ozturk. 2017. Economic growth, financial development, urbanisation and electricity consumption nexus in UAE. Economic Research–Ekonomska Istraživanja 30: 527–49. [Google Scholar] [CrossRef] [Green Version]
  77. Sekantsi, Lira Peter, and Mamofokeng Motlokoa. 2015. Evidence on the nexus between electricity consumption and economic growth through empirical investigation of Uganda. Review of Economic and Business Studies 8: 149–65. [Google Scholar] [CrossRef] [Green Version]
  78. Sekantsi, Lira Peter, Retselisitsoe I. Thamae, and Letsie E. Mohatonyane. 2016. Electricity consumption in Lesotho: The role of financial development, industrialisation and urbanisation. Journal of International Business and Economics 4: 1–12. [Google Scholar] [CrossRef] [Green Version]
  79. Sekantsi, Lira Peter, and Sayed Timuno. 2017. Electricity consumption in Botswana: The role of financial development, industrialization and urbanization. Review of Economic and Business Studies 10: 75–102. [Google Scholar] [CrossRef] [Green Version]
  80. Shafik, Nemat. 1994. Economic development and environmental quality: An econometric analysis. Oxford Economic Papers 46: 757–73. [Google Scholar] [CrossRef]
  81. Shahbaz, Muhammad, and Hooi Hooi Lean. 2012. Does financial development increase energy consumption? The role of industrialization and urbanization in Tunisia. Energy Policy 40: 473–79. [Google Scholar] [CrossRef] [Green Version]
  82. Simon, Angela Uzoamaka. 2016. Financial Development and Energy Use (Consumption), Urbanization and Industrialization Role in South Africa. Master’s thesis, Eastern Mediterranean University (EMU)—Doğu Akdeniz Üniversitesi (DAÜ), Gazimağusa, Turkey. [Google Scholar]
  83. Singh, Kamaljit, and Simmi Vashishtha. 2020. A re-examination of the relationship between electricity consumption and economic growth in India. Energy Economics Letters 7: 36–45. [Google Scholar] [CrossRef]
  84. Stern, David I., and J. Cutler Cleveland. 2004. Energy and Economic Growth. Rensselaer Working Papers in Economics, No. 0410. Troy: Rensselaer Polytechnic Institute. [Google Scholar]
  85. Takahashi, Maressa Q., Jessica M. Rothman, David Raubenheimer, and Marina Cords. 2019. Dietary generalists and nutritional specialists: Feeding strategies of adult female blue monkeys (Cercopithecus mitis) in the Kakamega Forest, Kenya. American Journal of Primatology 81: e23016. [Google Scholar] [CrossRef]
  86. Tamazian, Artur, Juan Pineiro Chousa, and Krishna Chaitanya Vadlamannati. 2009. Does higher economic and financial development lead to environmental degradation: Evidence from BRIC countries. Energy Policy 37: 246–53. [Google Scholar] [CrossRef]
  87. Topcu, Mert, and James E. Payne. 2017. The financial development–energy consumption nexus revisited. Energy Sources, Part B: Economics, Planning, and Policy 12: 822–30. [Google Scholar] [CrossRef]
  88. Vermeulen, Cobus. 2020. On the mandate, ownership and independence of the South African Reserve Bank. South African Journal of Economic and Management Sciences 23: 1–11. [Google Scholar] [CrossRef]
  89. Wirth, Harry. 2020. Recent Facts about Photovoltaics in Germany. Germany: Fraunhofer Institute for Solar Energy Systems. [Google Scholar]
  90. World Bank. 2020. World Development Indicators. Available online: http://databank.worldbank.org/data/views/reports/tableview.aspx (accessed on 10 March 2019).
  91. Wu, Hung-Ming. 2015. The impact of energy consumption and financial development on economic growth in the United States: An ARDL bounds testing approach. Journal of Business Economics and Policy 2: 179–86. [Google Scholar]
  92. Xu, Shao Jun. 2012. The impact of financial development on energy consumption in China: Based on SYS-GMM estimation. In Advanced Materials Research. Edited by Jianguo Wu, Jie Yang, Nobukazu Nakagoshi, Xixi Lu and He Xu. Stafa-Zurich, Switzerland: Trans Tech Publications Ltd., vol. 524, pp. 2977–81. [Google Scholar]
  93. Yang, Xinyu, Ping Jiang, and Yao Pan. 2020. Does China’s carbon emission trading policy have an employment double dividend and a Porter effect? Energy Policy 142. [Google Scholar] [CrossRef]
  94. Yue, Shujin, Rou Lu, Yongchang Shen, and Hongtao Chen. 2019. How does financial development affect energy consumption? Evidence from 21 transitional countries. Energy Policy 130: 253–62. [Google Scholar] [CrossRef]
Figure 1. Normality test. Source: Author’s own drawing. Results obtained from Eviews 10.
Economies 09 00158 g001
Figure 2. CUSUM test results. Source: Author’s own drawing. Results obtained from Eviews 10.
Economies 09 00158 g002
Figure 3. CUSUMSQ test results. Source: Author’s own drawing. Results obtained from Eviews 10.
Economies 09 00158 g003
Table 1. Descriptive statistics results.
Energy Consumption (EC)Financial Development (FD)Economic Growth (GDPC)Industrialisation (IND)Urbanisation (URB)
Mean2612.47560.863150.48577431.7546856.76839
Median2614.26962.177830.84293229.5187756.65100
Maximum2964.77078.294134.27778345.2775966.35500
Minimum2289.55841.50275−4.55033325.8534948.42500
Standard Deviation172.08659.6337192.3768305.7830775.702014
Skewness0.111072−0.102290−0.4716500.8151340.060729
Kurtosis2.3355331.9717892.5025382.2764621.738409
Jarque-Bera1.7401951.7401951.8006975.0370292.543409
Probability0.4189110.4189110.4064280.0805790.280353
Sum2312.8002312.80018.459411206.6782157.199
Sum Sq. Dev.3433.9163433.916209.02491237.4271202.979
Observations3838383838
Source: Author’s own drawing. Results obtained from Eviews 10.
Table 2. Augmented Dickey–Fuller test results.
VariablesModel Specificationt-Statistic Order of Integrationp-Value
ECTrend and Intercept −1.787251I(0)0.3809
Trend and Intercept −5.783402 **I(1)0.0000
FDTrend and Intercept −1.984325I(0)0.2921
Trend and Intercept −6.741113 **I(1)0.0000
GDPCTrend and Intercept −3.780510 **I(0)0.0065
INDTrend and Intercept −3.388540 **I(0)0.0176
URBTrend and Intercept 0.506745I(0)0.9846
Trend and Intercept −3.606268 **I(1)0.0105
Notes: ** 5% significance level. Source: Author’s own drawing. Results obtained from Eviews 10.
Table 3. Phillips–Perron test results.
VariablesModel Specificationt-Statistic Order of Integrationp-Value
ECTrend and Intercept
Trend and Intercept
−2.046652
−5.781845 ***
I(0)
I(1)
0.2666
0.0000
FDTrend and Intercept
Trend and Intercept
−1.956598
−6.743105 ***
I(0)
I(1)
0.3039
0.0000
GDPCTrend and Intercept−3.781243 ***I(0)0.0065
INDTrend and Intercept−3.693658 ***I(0)0.0082
URBTrend and Intercept2.255979I(0)0.9999
Trend and Intercept−3.109118 **I(1)0.0345
Notes: ** 5%, *** 10% significance level. Source: Author’s own drawing. Results obtained from Eviews 10.
Table 4. ARDL bounds test for cointegration results.
t-StatisticValueK
F Statistic17.637285
Critical value bounds
(Actual sample size = 88)
SignificanceI(0) BoundI(1) Bound
10%2.083
5%2.393.38
2.5%2.73.73
Source: Author’s own drawing. Results obtained from Eviews 10.
Table 5. Results of the long-run elasticities.
Variable Coefficient Standard Errorst-Statisticp-Value
FD0.1134140.0589521.9238350.0625 *
GDPC0.0453250.2651110.1709680.8652
IND0.0231310.00227210.178660.0000 ***
URB0.3326850.1047303.1766010.0031 ***
D−0.0839400.2963900.2832090.7786
Notes: *** 1%, * 10% significance level. Source: Author’s own drawing. Results obtained from Eviews 10.
Table 6. Short-run elasticities and ECM.
Variable Coefficient Standard Errorst-Statisticp-Value
D (FD)0.0269330.00116223.170460.0000 ***
D(GDPC)0.2085320.2604240.8007410.4285
D(IND)0.4357560.0933044.6703030.0000 ***
D(URB)0.0169210.00129713.048200.0000 ***
D(D)−0.2092130.0566903.6904520.0007 ***
ECM CointEq (−1)−0.3326850.104730−3.1766010.0031 ***
Notes: *** 1%, significance level. Source: Author’s own drawing. Results obtained from Eviews 10.
Table 7. Granger causality test results.
Null HypothesisObsF-StatisticProb.
FD does not Granger cause EC
EC does not Granger cause FD
340.26795
0.14114
0.0348 **
0.8690
GDPC does not Granger cause EC
EC does not Granger cause GDPC
370.25597
1.10445
0.7757
0.3437
IND does not Granger cause EC
EC does not Granger cause IND
370.39439
0.93556
0.0453 **
0.4028
URB does not Granger cause EC
EC does not Granger cause URB
372.36644
1.27168
0.1100 *
0.0821 *
Notes: ** 5%, * 10% significance level. Source: Author’s own drawing. Results obtained from Eviews 10.
Table 8. Serial correlation results.
Breusch-Godfrey Serial Correlation LM Test
F Statistic0.008002Prob. F0.9303
Obs R Squared0.025443Prob. Chi-Squared0.8733
Source: Author’s own drawing. Results obtained from Eviews 10.
Table 9. ARCH test for heteroscedasticity results.
Heteroscedasticity Test: Breusch-Pagan-Godfrey
F statistic1.978931Prob. F0.1109
Obs*R Squared27.43740Prob. Chi-Squared0.1951
Scaled explained SS3.439248Prob. Chi-Squared1.0000
Source: Author’s own drawing. Results obtained from Eviews 10.
Publisher’s Note: MDPI stays neutral with regard to jurisdictional claims in published maps and institutional affiliations.

