Quantitative Analysis of Fragrance and Odorants Released from Fresh and Decaying Strawberries

Abstract
: The classes and concentrations of volatile organic compounds (VOC) released from fresh and decaying strawberries were investigated and compared. In this study, a total of 147 strawberry volatiles were quantified before and after nine days of storage to explore differences in the aroma profile between fresh strawberries (storage days (SRD) of 0, 1, and 3) and those that had started to decay (SRD = 6 and 9). In terms of concentration, seven compounds dominated the aroma profile of fresh strawberries (relative composition (RC) up to 97.4% by mass, sum concentration): (1) ethyl acetate = 518 mg·m−3, (2) methyl acetate = 239 mg·m−3, (3) ethyl butyrate = 13.5 mg·m−3, (4) methyl butyrate = 11.1 mg·m−3, (5) acetaldehyde = 24.9 mg·m−3, (6) acetic acid = 15.2 mg·m−3, and (7) acetone = 13.9 mg·m−3. In contrast, two alcohols dominated the aroma profile of decayed samples (RC up to 98.6%): (1) ethyl alcohol = 94.2 mg·m−3 and (2) isobutyl alcohol = 289 mg·m−3. Alternatively; if the aroma profiles are re-evaluated by summing odor activity values (ΣOAV); four ester compounds ((1) ethyl butyrate (6,160); (2) ethyl hexanoate (3,608); (3) ethyl isovalerate (1,592); and (4) ethyl 2-methylbutyrate (942)) were identified as the key constituents of fresh strawberry aroma (SRD-0). As the strawberries began to decay; isobutyl alcohol recorded the maximum OAV of 114 (relative proportion (RP) (SRD = 6) = 58.3%). However, as the decay process continued, the total OAV dropped further by 3 to 4 orders of magnitude—decreasing to 196 on SRD = 6 to 7.37 on SRD = 9. The overall results of this study confirm dramatic changes in the aroma profile of strawberries over time, especially with the onset of decay.1. Introduction
Strawberries are one of the most widely consumed fruits with a good flavor and high nutritional value [1,2]. The aroma and odor-quality of strawberries depend on the type and concentration of volatile hydrocarbons (HC) in the aroma profile [3–5]. In fact, it is estimated that more than 360 volatile organic compounds (VOC) are emitted from strawberries [6,7]. However, only a small number of these contribute significantly to the strawberry fragrance and impact its perceived quality [8]. The intensity of strawberry fragrance has also been found to vary with the degree of freshness of the fruit. If the characteristics of VOC emitted from strawberries are evaluated thoroughly over time, this information can be used to improve our understanding of the natural strawberry fragrance and allow growers and retailers to optimize their harvesting, packing, storage and retail display procedures.
In order to assess the VOCs released from strawberry, researchers have used several different analytical approaches. Gas chromatographs (GCs) equipped with either flame ionization (FID) or mass spectrometer (MS) detectors have been the most common choices [9–11]. Recently, strawberry fragrances were also evaluated by combining olfactometry and GC techniques—i.e., harnessing state-of-the-art analytical technology alongside the particular selectivity of the human nose [1,2,12].
In this study, the concentrations and chemical types of strawberry volatiles were analyzed to characterize the fragrance (aroma profile: freshness staging) and offensive odorants (due to decay). All volatile compounds released from strawberry samples were collected at five different intervals (up to 9 days of storage period) at 25 °C. For the quantification of volatile components, liquid-phase standard was prepared containing a total of 19 odorous compounds for external calibration (Table 1S) The numbering of all supplementary (S) Tables and Figures are made with an S symbol following the number and placed in the Appendix section at the end. These calibration results were then used to develop predictive equations based on effective carbon number (ECN) [13]. These equations were then used for an extensive list of ‘compounds lacking authentic standards/surrogates (CLASS)’ due to the absence of standard material (i.e., authentic compounds) or to the synthesis complexities or costs involved in standard preparation [14]. The use of the predictive equations based on response factor vs. effective carbon number (ECN) linear correlation allowed robust, statistical estimation of all CLASS. The results of this approximation method allowed us to characterize the emission pattern of most fragrance and odorous components released from strawberry samples in a quantitative manner. In this research, we undertook measurements of strawberry aromas and odorants to provide detailed descriptions on their emission patterns in relation to storage duration. The results of this study will thus help us understand the characteristics of the flavor changes in strawberries that occur during storage.
2. Materials and Methods
In this research, a total of 19 VOCs that had relatively strong odor intensities with a wide range of volatility and polarity were selected for external calibration (Table 1S). The calibration results obtained using this standard mixture was used to derive predictive equations based on ‘effective carbon number (ECN)’ theory [13]. These ECN-based predictive equations were then used to calculate the concentrations of ‘CLASS’ due to the absence of standard material (i.e., authentic compounds) or to the complexity involved in standard preparation [14].
Liquid-phase working standards (L-WS) of 19 VOCs in methanol were prepared to include: (1) five aldehydes: acetaldehyde (AA), propionaldehyde (PA), butyraldehyde (BA), isovaleraldehyde (IA), and n-valeraldehyde (VA), (2) six aromatics hydrocarbons: benzene (B), toluene (T), styrene (S), p-xylene (p-X), m-xylene (m-X), and o-xylene (o-X), (3) two ketones: methyl ethyl ketone (MEK) and methyl isobutyl ketone (MIBK), (4) one alcohol: isobutyl alcohol (i-BuAl), (5) one ester: n-butyl acetate (BuAc), and (6) four volatile fatty acids: propionic acid (PPA), butyric acid (BTA), isovaleric acid (IVA), and n-valeric acid (VLA) (Table 1S). The detailed procedures to make the L-WS are described in Table 2S.
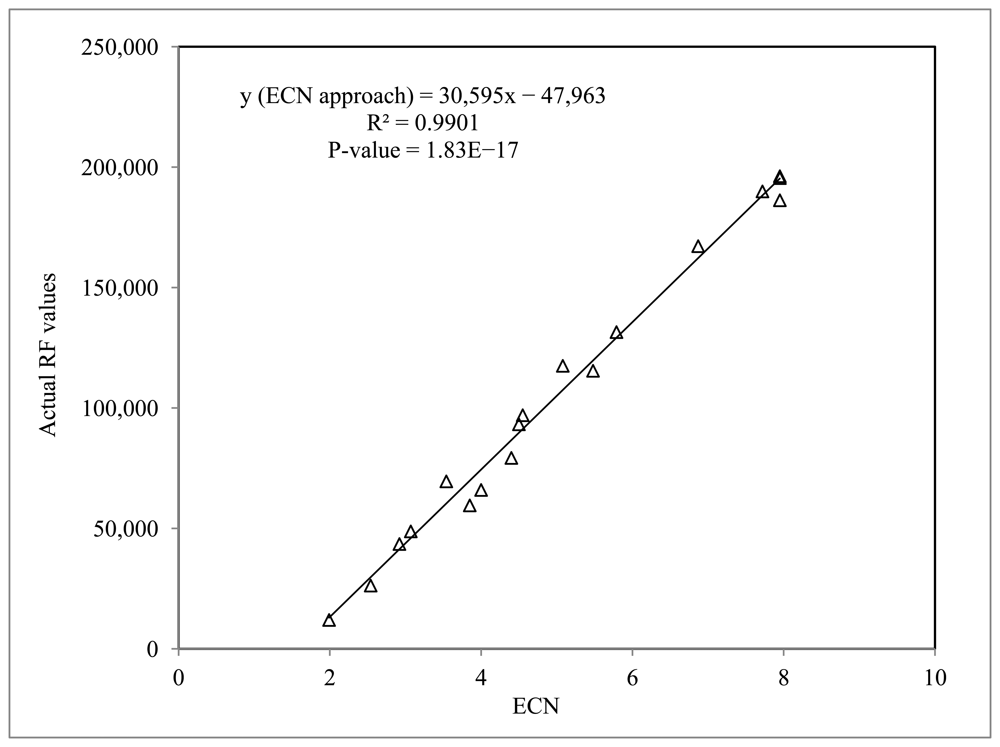
The concentrations of CLASS were derived from the predictive equations based on linear regression equations between RF values of target standard compounds (Table 3S) and their effective carbon numbers (ECNs). The ECN was determined by counting the number of the atoms (C, H, and O) and moieties in functional groups (e.g., ether, carbonyl, and methyl groups) in terms of ‘carbon number equivalent (CNE)’ in light of their approximate relative contribution to the sensitivity (RF) in the MS system: ECN = I × (CNE of C) + J × (CNE of H) + K × (CNE of O) + (CNE of > C = O) + M × (CNE of -O-) + N × (CNE of -CH3) (Figure S1): (1) C = 1, (2) H = -0.035, (3) O = 0, (4) >C = O = -0.95, (5) -O- = 0.55, and (6) -CH3 = 0.15). As 10 out of 147 volatiles detected from the strawberry samples matched with 19 VOCs contained in the L-WS, they were quantified directly using the calibration data of the L-WS. However, we did not prepare standards for the remaining 137 volatiles for many different reasons. For simple quantitation of those strawberry aroma components, we treated them as CLASS to quantify their concentrations based on the ECN approach (Table 4S).
2.1. Approaches for the Collection of Volatile Components and Instrumental Setup
2.1.1. The Collection of Strawberry Volatiles
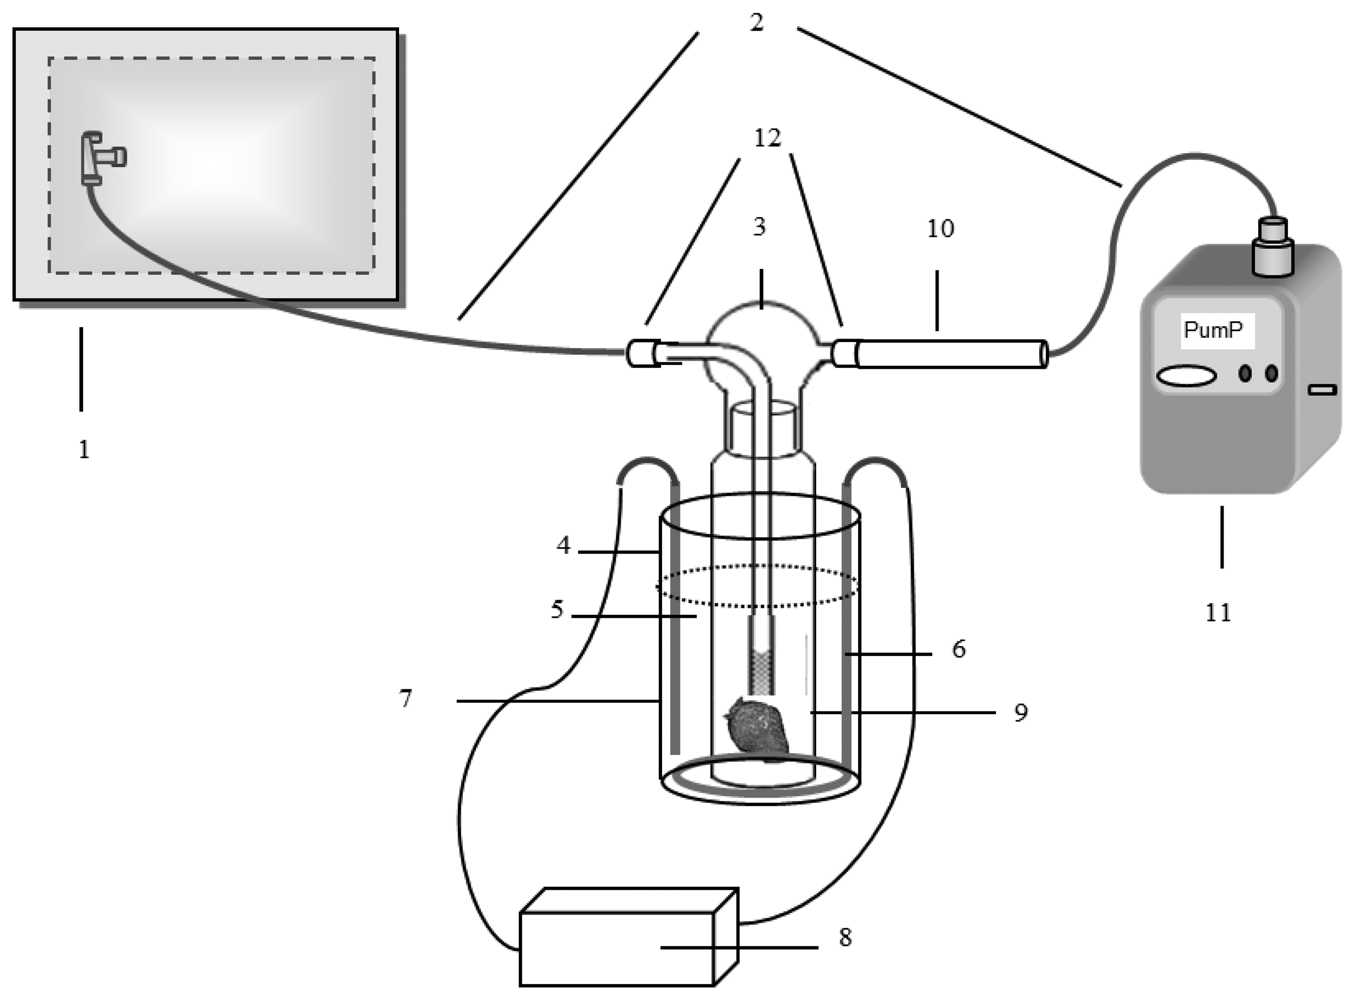
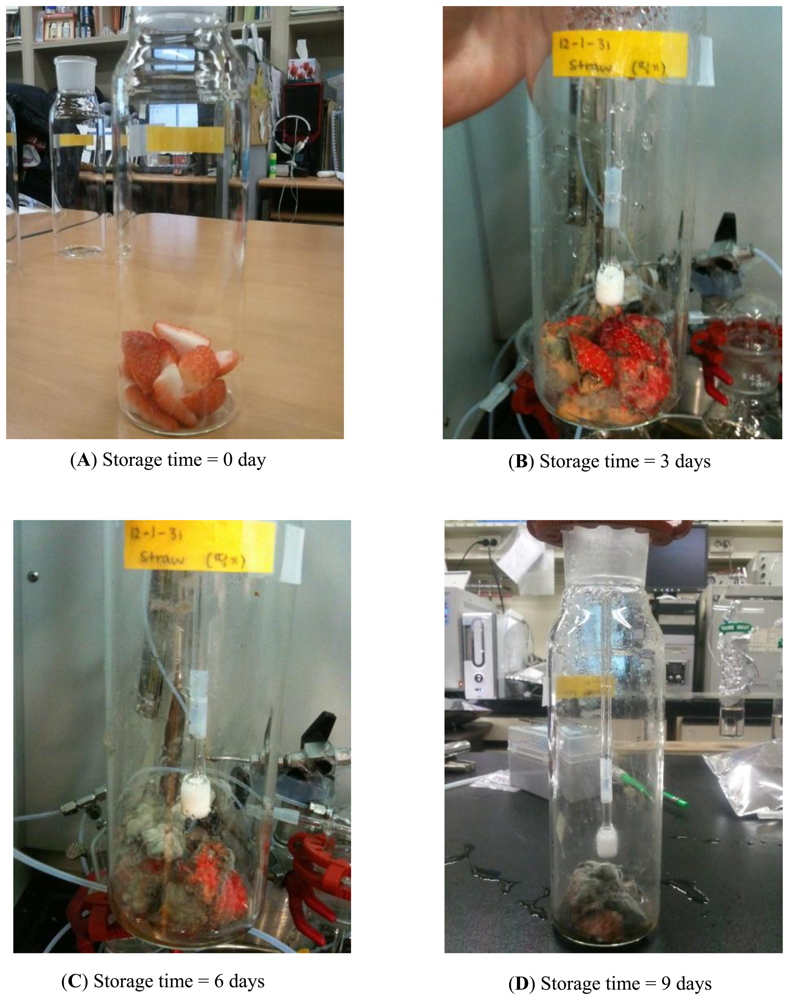
The sorbent tube sampling method was used for the collection of the VOCs released from the cut strawberry sample. In the case of ammonia and RSC, the bag sampling method (polyester aluminum-PEA bag) was used as discussed in the next subsection. The sorbent tube was prepared as a three-bed sorbent by packing with 100 mg of Tenax TA, Carbopack B, and Carboxen 1000 (Supelco, Bellefonte, PA, USA) in a SS tube holder (tube size: length: 9 cm, OD: 6 mm, and ID: 5 mm; Camsco, Houston, TX, USA). The strawberries for this study were grown in Jin Ju city, Gyeong Sang Nam Do Province, Korea. The strawberries (1 kg in a Styrofoam tray) were purchased from a local market within one day after harvesting. An approximately 50 gram of strawberry sample was sliced and placed inside a 750 mL capacity impinger with the gas inlet and outlet positioned as the side arm and nozzle cap, respectively (ID: 3 mm and length: 30 mm). The strawberry samples were cut into four pieces (3 cm ×3 cm × 5.5 cm) (The weight of sample was adjusted to ∼50 g) (Figure S2). The inlet and outlet of the impinger were connected to a 10 L PEA bag filled with back-up gas (ultra-pure nitrogen > 99.999%) and the inlet of the sorbent tube (ST), respectively. A Teflon tube was used to connect the impinger and the PEA bag at one end and the ST at the other. The outlet of the ST was connected to the mini vacuum pump interfaced with mass flow controller (MFC) (Shibata ΣMP-30, Saitama, Japan) using silicon tubing. The VOCs emitted from the strawberry were flushed onto the ST by pumping the nitrogen gas through the impinger containing the strawberry samples at a flow rate of 50 mL·min −1 for 1 min. The impinger was maintained at 25 °C using a temperature-controlling water bath (Figure 1). VOCs emitted from the strawberry sample were collected five times during the entire storage period of 9 days set for this study at 0, 1, 3, 6 and 9 days (Table 5S). For each selected day, the collection of samples was made as replicate for each target group (VOC, RSC, ammonia, and olfactory analysis). To initiate each sampling at a given day, a pre-purge was conducted by supplying ultra-pure nitrogen into the impinger at a flow rate of 50 mL·min −1 for 20 min. Throughout the storage period, the strawberry sample in the impinger was maintained in an aerobic state as the inlet and outlet of the impinger were left open to the air in the laboratory.
2.1.2. Instrumental Setup for VOC Analysis
All the analyses in this study were carried out using a GC-2100 (Shimadzu, Kyoto, Japan) equipped with a QP2010 MS (Shimadzu) and a UNITY thermal desorber (TD: Markes International, Ltd, Llantrisant, UK). The TD focusing cold trap was packed with Tenax TA and Carbopack B in a 1:1 volume ratio (inner diameter = 2 mm and total sorbent bed length: 50 mm). The VOCs were separated on a CP Wax column (diameter = 0.25 mm, length = 60 m, and film thickness = 0.25 μm) using a 50 min GC analytical cycle. The separated VOCs were detected by MS system and identified through library searching (NIST mass spectral library, NIST, Gaithersburg, MD, USA). The detailed conditions are also presented in Table 5S.
2.2. Calibration of the Liquid Working Standards of VOCs
Five-point calibration curves were prepared by analyzing sorbent tubes loaded with 1 μL of L-WS at these different concentration levels: (1) 1.30, (2) 6.52, (3) 13.0, (4) 26.1, and (5) 65.2 ng·μL−1) (Table 2S). Details of the approach used to introduce the liquid standards to the sorbent tubes in the vapor phase have been described in detail elsewhere [15]. In short, a micro-syringe was used to introduce the liquid standard into the sampling end of the ST in a 50 mL·min−1 flow of nitrogen for 10 minutes. Each loaded sorbent tube was then analyzed by the TD-GC-MS system described below.
The sensitivity of the instrumental system remained fairly constant leading to stable response factors throughout the 9-day study period (Table 3S). All coefficients of variation (CV (%): SD/mean × 100) for the RF values were fairly stable (CV = 1.46 ± 1.29% (<4%)) allowing mean RF values to be applied to all the data. The correlation coefficients (R2) of nearly all VOCs were above 0.99 (mean = 0.9954 ± 0.0075%), although there was a slight anomaly in the case of AA (0.9619 (SRD = 0) and 0.9698 (SRD-9)). In addition, to assess reproducibility, the L-WS with a mean of 26.1 ng·μL−1 was analyzed repeatedly prior to analysis of each batch of samples (SRD -0, 1, 3, 6, and 9). If the RF values of the 19 VOCs determined using this consecutive series of analyses, the RSE values generally fell below 4% (mean RSE = 1.39 ± 0.82%).
2.3. The Analysis of Ammonia and Reduced Sulfur Species
Although strawberries are noted for their attractive fragrance, the fruit can release unpleasant odors if stored for too long. Important offensive odorants such as ammonia and reduced sulfur compounds (RSC) [16,17] were therefore also quantified in this study. As expected, these compounds were found to be difficult to detect in the fresh fruit but they became increasingly abundant as the decay progressed. The TD-GC-MS setup optimized for the VOC analysis in this study is not optimal choice for ammonia or RSCs, thus these compounds were determined using alternative analytical approaches.
For the collection of samples to analyze for ammonia and RSC, the bag sampling method (PEA bag) was employed. The inlet and outlet of the impinger filled with the strawberry samples were connected to a gas cylinder filled with ultra-pure air (>99.999%) and a 10 L empty PEA bag, respectively. Teflon tubing was used to connect the impinger and the gas cylinder at one end and the empty PEA bag at the other. Air for the cylinder was plowed through the impinger containing the strawberry sample and into the 10 L empty PEA bag at a flow rate of 100 mL·min−1 for 100 min afterapre-purge was conducted by supplying ultra-pure air into the impinger at a flow rate of 100 mL·min−1 for 10 min. Ammonia was analyzed using absorption photometry (Genysys 10 series, Thermo Scientific, Waltham, MA, USA) based on the indophenol method, a well-known approach for amino compounds [18,19]. The reduced sulfur compounds were analyzed using an on-line thermal desorption system (UNITY-Air Server, Markes International, Ltd.) coupled with a GC (CP-3800, Varian, Palo Alto, CA, USA) and pulsed flame photometric detector (PFPD: Varian). The RSCs in the PEA bag were transferred to the TD system using pump and collected into the focusing trap (cold trap) in TD system. The RSCs loaded on the focusing trap were then thermally desorbed and transferred to the GC column for separation and detection. Finally, the dilution-to-threshold (D/T) ratios of the strawberry samples were also determined using an air dilution sensory (ADS) test, as a direct means to assess odor intensity [20].
3. Results and Discussion
3.1. Major Volatile Components Emitted from Strawberry Samples
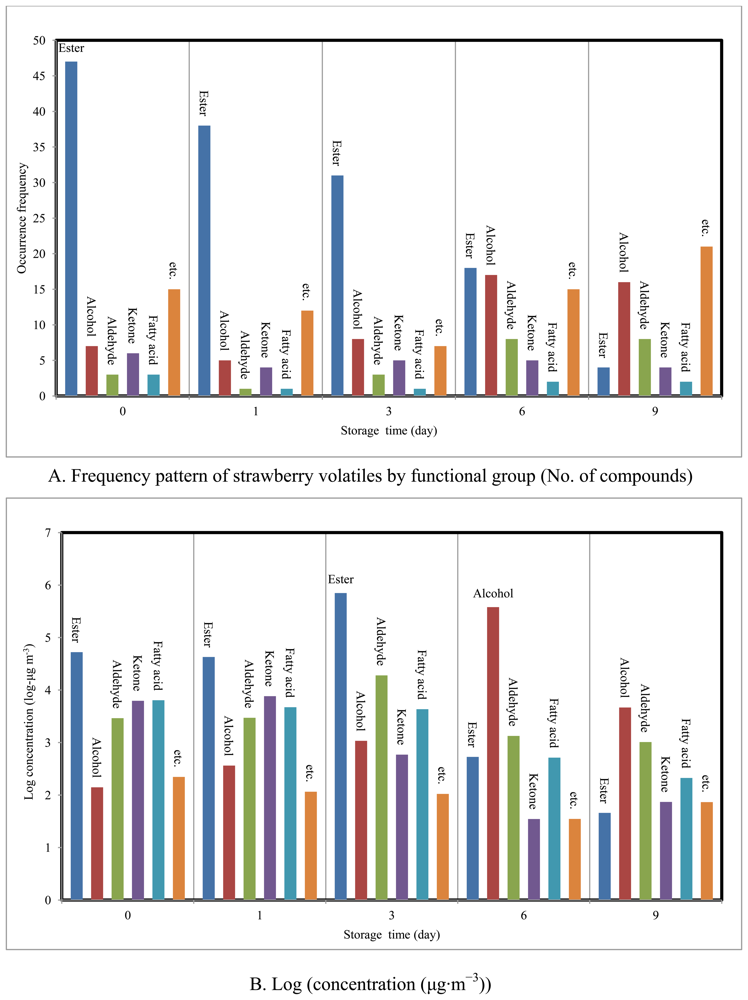
The concentration and occurrence frequency of these species is classified in terms of functional groups in Table 1. The types and concentration levels of 147 VOCs detected from all strawberry samples are also summarized in Table 6S. If they are arranged by the chemical grouping and occurrence frequency, they can be classified as follows: (1) ester = 61, (2) alcohol = 21, (3) aldehyde = 11, (4) ketone = 9, (5) fatty acid = 5 and (6) miscellaneous (etc.) = 40.
Esters (n = 47), with total concentration of 52,648 μg· m−3 (76.8% by mass), represented more than half of the 81 VOCs detected at the start of the study (SRD = 0). Similarly, approximately 130 different types of esters have been reported from strawberry fragrances [21], where they were found to represent 25 to 90% of strawberry volatiles [22-24]. At SRD-1, esters (n = 38) still recorded the highest concentration (42,713 μg· m−3). By day 3, while the total concentration of esters had continued to increase (sum concentration = 705,447 μg· m−3) their numbers had fallen down to 31. However, once decay had started, their concentration dropped dramatically down to 533 (SRD = 6) and 45.7 μg·m−3 (SRD = 9). In contrast, alcohols exhibited a reversed trend. Although alcohols were much less abundant in fresh strawberries (sum concentration of SRD-0, 1, and 3 = 1,582 μg· m−3), they tended to peak noticeably at 380 mg·m−3 on SRD-6. Thus, the best indicators of the fresh and decayed stages of strawberries are identified as esters and alcohols, respectively. If the other classes of chemicals are considered, aldehydes were detected in all samples and recorded the highest concentration (19,054 μg· m−3) on day 3. Ketones and fatty acids were also relatively abundant in fresh strawberries, although they faded away during decay (Figure 2).
In order to evaluate the indicative fragrance of strawberry, the relative composition (RC) of the strawberry volatiles was assessed initially by normalizing the concentration of an individual compound against the total concentration of all species at each sampling day (Table 2). If any compound with more than 0.05% of RC (total mass) on one or more sampling day was selected, 53 were observed. The compound contribution pattern of these 53 VOCs was then analyzed both in terms of concentration and odor intensity. The sum concentration for these major VOCs (RC > 0.05%) generally exceeded 99.9% of the total mass of VOCs from each individual measurement (99.4% (SRD-0) to 99.99% (SRD-6).
Ethyl acetate [mass concentration = 17,240 μg·m−3 (25.1%)] and methyl acetate 11,945 μg·m−3 (17.4%) were the highest from the SRD-0 sample along with ethyl butyrate (7,290 μg·m−3), methyl butyrate (4,977 μg·m−3), ethyl hexanoate (4,270 μg·m−3), and methyl hexnoate (2,492 μg· m−3). These six esters thus showed the highest RC (70.3%) at SRD-0. Other than esters, acetone and acetic acid had relatively high concentrations of 5,960 and 6,177 μg· m−3 at SRD-0.
If the results of all fresh stages (SRD-0, 1, and 3) are combined together, esters maintained the maximum abundance (n = 23) with the sum of 80,015 μg· m−3 (93.4%). However, patterns changed dramatically during decay, esters dropped down to 20 μg· m−3 (n = 22) in SRD-6 after excluding ethyl acetate (SRD-6 = 467 μg·m−3). Acetaldehyde also underwent 15-fold reduction to 1,313 μg· m−3 in SRD-6 compared to its maximum at (SRD-3). In contrast, two alcohols rose significantly to 287,758 μg·m−3 [75.3% (isobutyl alcohol)] and 91,537 μg·m−3 [23.9% (ethyl alcohol)] at SRD-6. In the case of SRD-9, the concentrations of those alcohols decreased to 967 (15.9%) and 2,665 μg·m−3 (43.8%), respectively. Moreover the sum quantity (μg· m−3) of strawberry volatiles detected recorded the lowest value of 6,055 at SRD-9 [(RC [SRD-9/Σ SRD-all] × 100) = 0.49%] compared with all other periods (58,281 (SRD-2) to 730,144 μg· m−3 (SRD-3)).
Although our analysis focused mainly on volatile organics by GC-MS, we also analyzed some offensive odorants like reduced sulfur compounds (RSC) and NH3 (Table 7S). It can be seen that three RSCs and ammonia were detected from the strawberry sample. Especially, methane thiol and dimethyl disulfide were seen fairly consistently and recorded fairly high concentrations of 267 μg· m−3 and 196 μg m−3 in SRD-1, respectively. In contrast, ammonia was detected apparently only under the decaying conditions (concentration (μg· m−3) = 169 (SRD-6) and 445 (SRD-9)) relative to the fresh period below 81.3 (SRD-0, 1, and 3).
3.2. The Variety of VOC Threshold Values for Strawberry Volatiles and Their Relationship with Molecular Weights
The odor threshold of a compound is defined as the lowest concentration that can be detected by human olfaction [25]. The lower the odor threshold, the stronger the odorant will be. However, many authors have investigated the threshold values of various volatiles and results for individual compounds can be very variable. In this study, a literature survey was conducted for the odor strengths (thresholds) of the strawberry volatiles. Although we measured a total of 147 VOCs during this study period, we were only able to obtain threshold values for up to of 79 species (Table 6S). The results of this survey are also summarized in Table 8S.
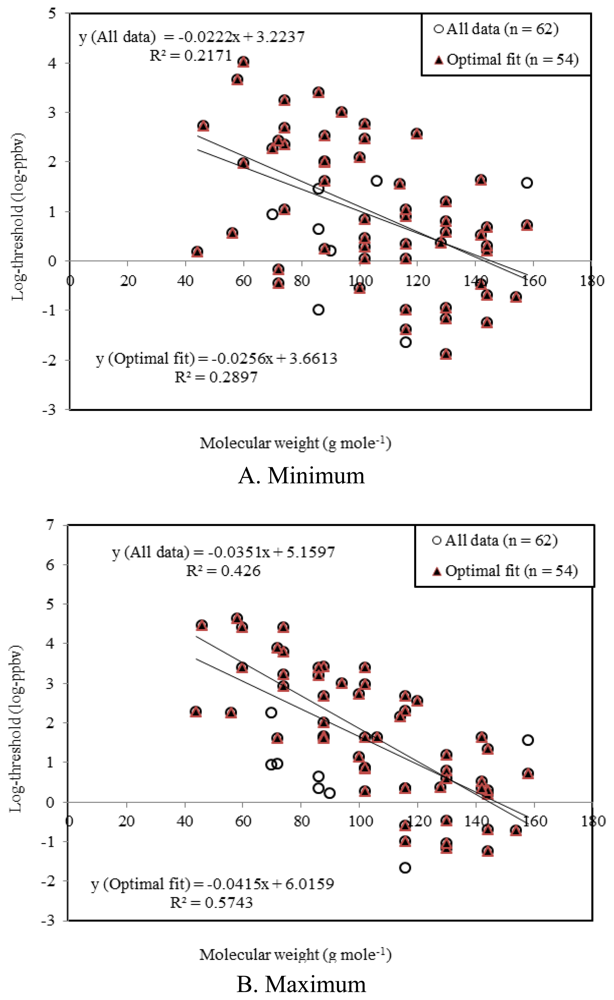
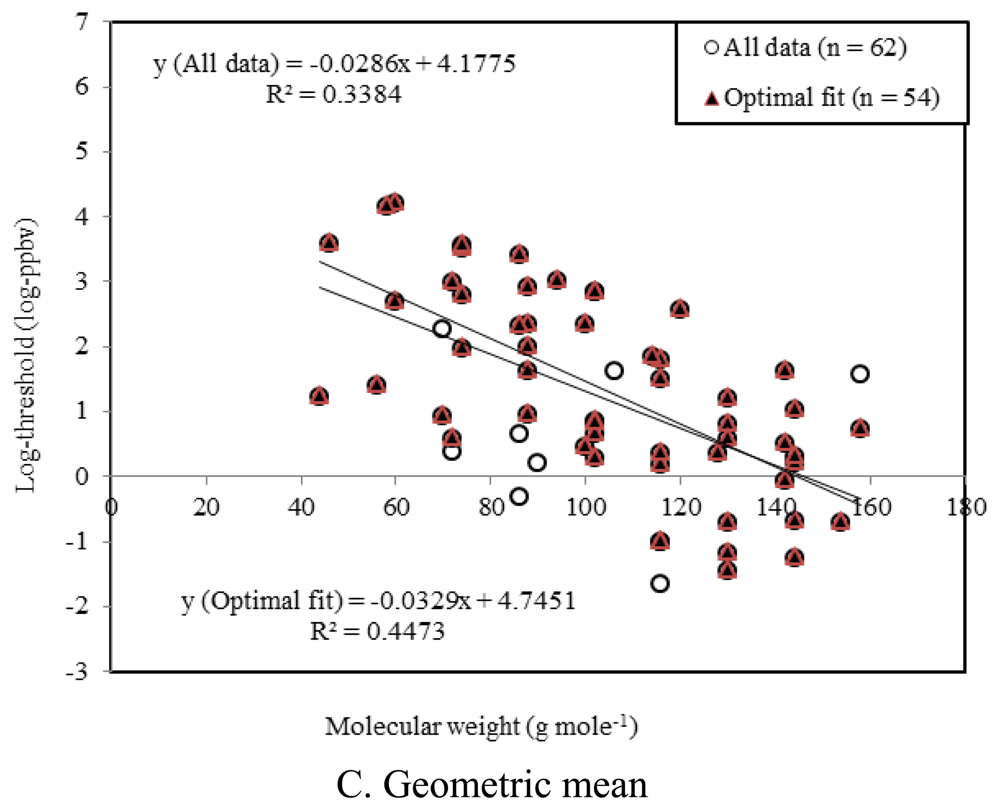
As reported previously, the odor strengths of VOCs tend to exhibit strong relationships with their physicochemical properties, e.g., the number of carbons and molecular weight [26]. Hence, a number of combinations between such variables (e.g., log thresholds vs. molecular weights) were tested to seek for such linear relationship. For this comparative analysis, fatty acids and some miscellaneous groups were however excluded due to the lack of threshold data. As shown in Table 9S, an inverse correlation was seen consistently between the log (thresholds) and molecular weights of VOCs without a single exception. However, the magnitude of slope values differed greatly between the VOC groups, while the strongest correlation with molecular weights was seen from the maximum (out of all available) threshold values.
As shown in Figure 3, the strongest correlations were seen from a pair of log-maximum threshold values and molecular weight among all matching combinations (<1> for all data (n = 62): (1) R2 (maximum) = 0.4260, (2) R2 (minimum) = 0.2171, and (3) R2 (geometric mean) = 0.3384, and <2> For optimal fit (n = 54): (1) R2 (maximum) = 0.5743, (2) R2 (minimum) = 0.2897, and (3) R2 (geometric mean) = 0.4473).
3.3. The Evaluation of the Odor Strengths with Changes in Freshness Status
In previous sections, the changes of VOC quantities and their threshold values were evaluated from fresh to decayed stages of strawberry. To learn more about strawberry fragrance, our results were examined further with respect to type and strength of strawberry odors. The selection of reasonable threshold value is important to help understand the contribution of a compound at its given concentration level to the overall perception of odor. It is however difficult to assign a single meaningful figure because the threshold of a given compound is often available as multiple reported values.
In this study, the odor strengths of strawberry were calculated in terms of odor activity values (OAV) by dividing the concentrations of the VOCs with the corresponding threshold in the same concentration unit: OAV = concentration (ppbv)/threshold value (ppbv) [27]. For the 53 selected major VOCs, multiple threshold values have been reported for many (21 (one value), 21 (two values), 10 (three values), and 1 (four values)). In case of two or more reported value thresholds, the one with maximum value was used to calculate the OAVs in light of consistency as seen in correlation analysis.
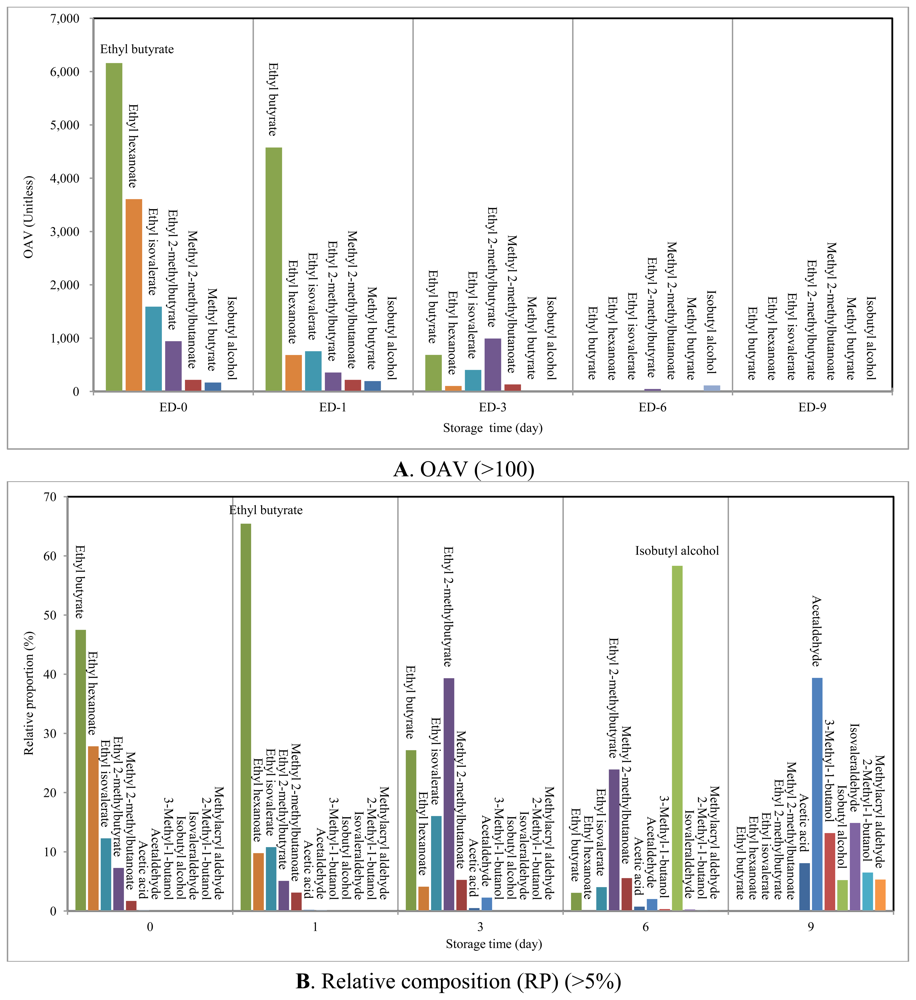
Table 3 presents the specific description of odor types for each of the major VOCs with their OAV (n = 53). Information of the odor types was obtained by surveying the GC-olfactometry analysis of VOC [refer to a list of references (n = 24) in Table 3]. The ΣOAV values of the strawberries tended to decrease abruptly with storage time from their maximum at SRD-0 (OAV from SRD-0 to SRD-9 were 12,972, 6,992, 2,524, 196 and 7.37, respectively). The OAV values at SRD-0 decreased in order of ethyl butyrate (6,160), ethyl hexanoate (3,608), ethyl isovalerate (1,592), and ethyl 2-methylbutyrate (942).
To assess the relative contribution of a given compound in terms of OAV, its relative proportion (RP) was also calculated by dividing OAV (a given compound) with ΣOAV (all) (Table 3). This RP term for OAV is distinguished from the RC term used for relative mass concentration. If OAVs of these four esters are summed, their RP represents 94.8% of total OAV at SRD-0. It thus suggests that the fragrance of fresh strawberries is governed predominantly by these four esters. The scent of these esters is characterized as fruity, apple, and sweet (Table 3). Although their OAVs decreased from SRD-0 to SRD-1, they still recorded the highest OAVs among all the VOCs evaluated at SRD-1 with ΣRP = 91.1%. The fragrance pattern of SRD-0 and -1 is not likely to have changed because the key volatiles (the four esters) remained constant. In case of SRD-3, esters had high OAV along with significantly large ΣRP (97.2%), although their ΣOAV decreased considerably to 2,453 in SRD-3 relative to the earlier period (SRD-0 (12,917) and SRD-1 (6,942)). As a result, we were able to confirm that the esters should dominate the quality of fresh strawberry fragrance (SRD-0, 1, and 3).
To evaluate the occurrence patterns of fresh strawberry volatiles, our results were compared to a number of previous studies. Du et al. [1] analyzed the volatiles emitted from fresh strawberries using solid-phase micro-extraction (SPME)-GC-MS analysis. A total of 54 volatiles from two cultivar samples (Strawberry Festival and Florida Radiance) were selected as the main target compounds (with their respective standards). It is interesting to note that 52 target volatiles were found in both samples, while 23 of them were seen consistently in all fresh stage samples in this study. They further calculated the OAVs of detected volatiles using thresholds of 44 compounds. Accordingly, OAVs were seen to be dominated by two esters (ethyl butyrate and methyl butyrate), 2,5-dimethyl-4-hydroxy-3(2H)-furanone (DMHF), and linalool in two samples [(1) Strawberry Festival = 461 (ethyl butyrate: RP = 28.7%), 358 (methyl butyrate: 22.3%), 424 (DMHF: 26.4%), and 102 (linalool: 6.3%) and (2) Florida Radiance = 553 (ethyl butyrate: 33.7%) and 261 (methyl butyrate: 15.9%), 359 (DMHF: 21.9%), and 162 (linalool: 9.9%)]. In this study, ethyl butyrate exhibited relatively high OAV in fresh stages with its RP ((1) 47.5% (SRD-0), 65.4% (SRD-1), and 27.2% (SRD-3)). Likewise, methyl butyrate also showed high OAV with the RP values of 1.30% (SRD-0), 2.79% (SRD-1), and 0.50% (SRD-3). In contrast, the RP values of DMHF and linalool were relatively insignificant, although they were selected as the major VOCs in this study.
Nuzzi et al. [12] analyzed strawberry fragrances of six different cultivars such as ApoScaligera ((1) Darselect, (2) Eva, and (3) VR4) and Cesena area in Italy ((4) Alba, (5) Dora, and (6) CS4). The volatiles from these samples were collected by a charcoal adsorption tube and extracted using dichloromethane solution. Lastly, the GC-MS analysis of these extracts yielded a total of 37 volatiles (ester = 28, alcohol = 2, sulfide = 2, lactone = 2, and 3 others (2-pentanone, limonene, and linalool)) in their fresh stage. If the OAV is computed for each compound, nine of them showed the highest contributions with ΣRP = 96.7% (consisting of methyl 2-methylbutyrate (3.46%) to dimethyl trisulfide (23.2%)). Eight out of the nine volatiles with the high RP measured in studies of Nuzzi et al. [12] were also detected from our fresh strawberry samples (SRD-0 ,1, and 3). Especially, ethyl butyrate, ethyl 2-methylbutyrate, ethyl hexnoate, and ethyl isovalerate had the highest contribution to OAV in fresh periods. As such, the results of previous studies confirmed the significant role of esters in the fresh strawberries [1,12].
During decay, ΣOAVs of all detected esters (except ethyl 2-methylbutyrate with OAV = 46.9) were below 10, while accounting for 12.9% by ΣRP (ester (n = 12)). In contrast, isobutyl alcohol exhibited the highest OAV of 114 in SRD-6 (RP = 58.3%). As the odor of isobutyl alcohol is characterized as plastic and bad, is is distinguishable from pleasant fresh scents. As a result, odor intensity decreased with the progress of strawberry decay with the emergence of some offensive odors (e.g., ΣOAV of 7.37 in SRD-9). In SRD-9, only two compounds (acetaldehyde and isovaleraldehyde) showed OAVs above 1. For the reader's reference, volatiles that showed up at least once in terms of either OAV (above 100) or RP (above 5%) during the whole study period are illustrated in Figure 4.
If the OAVs of the RSCs and ammonia detected in strawberry aroma profiles are examined, their values from decayed strawberry samples (SRD-6 and 9) generally had very low OAV (below 1). Only methanethiol had high OAVs above 10 in SRD-0 and SRD-1 (OAV = 14.9 (SRD-0) and 64.6 (SRD-1)] compared with other RSCs or ammonia. However, if these results are compared with ΣOAV (all) of all hydrocarbons in fresh strawberry samples (SRD-0 and 1), the RP value of methane thiol were as low as 0.13% (SRD-0) and 1.04% (SRD-1). As a result, it is reasonable to infer that the volatile hydrocarbons should represent the odor/fragrance characteristics of strawberry most effectively.
3.4. Comparison between Odor Activity Value (OAV) and Dilution-to-Threshold Ratio
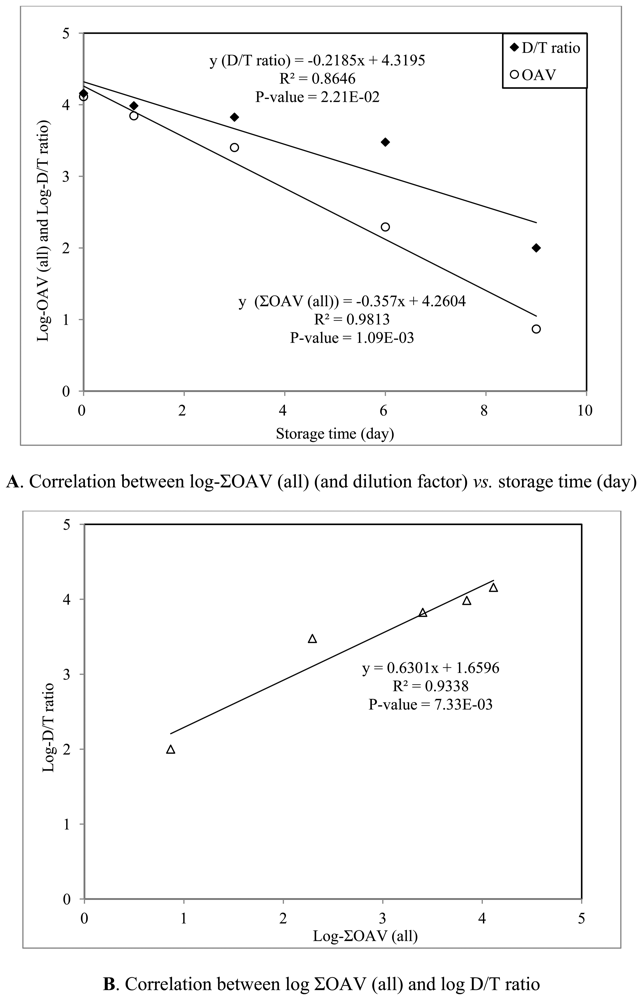
In this section, the TD-GC-MS odor profiles were compared between fresh and decaying strawberries. The results were then evaluated to assess the relationship between the classes of volatile components and their odor intensity. To estimate the key volatiles which dominate the strawberry scent, the odor strengths (OAV) were examined against the relative (mass) composition. Evaluation of our data indicated that the use of ΣOAV was useful to assess the actual occurrence of fragrance/odor from strawberry samples. As another means to explore the odor intensities of strawberry samples, we estimated the dilution-to-threshold (D/T) ratio derived experimentally based on air dilution sensory (ADS) test [20]. The D/T ratio is commonly used as a tool to measure the level of dilution by which the odor threshold is recognized [20]. As the D/T ratio of strawberry samples was measured concurrently with the analysis of their chemical composition, the ΣOAV values at each SRD interval can also be evaluated in relation to the D/T ratio.
The results of correlation analyses between storage day and log odor intensities (log ΣOAV and log D/T ratio) are plotted in Figure S3(A). In compliance with general expectation, the log D/T ratio decreased with the progress of decay to show the slope values of -0.2185 (with R2 = 0.8646 and p-value = 2.21E-2) (log D/T ratio). A similar trend is also observable from ΣOAV. As such, the results of this correlation analysis between the log ΣOAV and log D/T ratio show a strong correlation with R2 = 0.9338 (p-value = 7.33E-3). As a result, the computation of ΣOAV values can be used as sensitively as that of the D/T ratios to assess the fragrance occurrence pattern. In other words, the ΣOAV should be considered a good criterion to assess the fragrance or odor intensity of strawberry samples.
4. Conclusions
The volatiles emitted from strawberry are important components to accurately assess its fragrance. Although the fragrance of the strawberry can influence its flavor and taste, its smell types can vary greatly with aging conditions. If the volatiles from strawberry were analyzed at the fresh stage, the results should be useful enough to understand the natural flavor of strawberries. In this study, the mass concentrations and odor strength (odor activity values: OAV) from strawberries were analyzed by the sorbent tube method at storage times of 0, 1, 3, 6 and 9 days at 25 °C.
The results of our analysis indicated that the mass concentration (μg·m−3) of all strawberry volatiles varied greatly over time: 68,569 (SRD-0), 58,503 (SRD-1), 730,593 (SRD-3), 382,245 (SRD-6), and 6,086 (SRD-9). The concentrations of strawberry volatiles released at fresh period before (SRD-3) were absolutely dominated in this order, ethyl acetate, methyl acetate, ethyl butyrate, methyl butyrate, acetaldehyde, acetic acid, and acetone (ΣRC of 97.4%). However, as the strawberry samples began to decay, its RC was dominated by two alcohols (isobutyl alcohol and ethyl alcohol) with significant reductions in their summed concentration.
In this study, we were able to quantify a total of 147 strawberry volatiles (with 79 corresponding odor threshold values from literature survey). In order to assess the fragrance/odorant characteristics of strawberries, the OAV values were calculated for a total of 53 major volatiles that comprised more than 0.05% in mass concentration of all strawberry volatiles. The OAV values decreased abruptly with storage time (ΣOAV: SRD-0 (12,972) to SRD-9 (7.37)). If the ΣOAV values of a given strawberry volatiles are computed for the whole fresh period, their magnitude was dominated by four esters with fruity and sweet scents [(1) ethyl butyrate (11,422), (2) ethyl hexanoate (4,395), (3) ethyl isovalerate (2,751), and (4) ethyl 2-methylbutyrate (2,290)] [ΣRP (four esters) of 92.8%]. However, relative dominance of esters as the key strawberry fragrance changed abruptly with the onset of decay. Hence, as the transition proceeds, relationships between key parameters tended to vary widely. In case of SRD-6, the ΣOAV of the four esters decreased to 60.9 with ΣRC of below 1%, while isobutyl alcohol exhibited the highest OAV of 114 with RC of 75.3%. The ΣOAV was reduced further to reach the minimum value of 7.37 in SRD-9.
In this study, the strawberry volatiles were analyzed from fresh stage to 9 day storage at 25 °C, and the concentration of the strawberry volatiles were evaluated in relation to their occurrence patterns and olfaction data derived as D/T ratio. The overall results of our study suggest that strawberry volatiles are useful indicators to characterize the flavor changes of strawberry at the latter stages of its storage period.
Acknowledgments
This work was supported by a grant from the National Research Foundation of Korea (NRF) funded by the Ministry of Education, Science and Technology (MEST) (No. 2009-0093848).
Conflict of Interest
The authors declare no conflict of interest.
Appendix

| Order | Group | Compounds | Short name | MW (g·mol−1) | Density (g·cm−3) | Boiling point (°C) | Formula | CAS number |
|---|---|---|---|---|---|---|---|---|
| 1 | Aldehyde | Acetaldehyde | AA | 44.1 | 0.785 | 20.2 | C2H4O | 75-07-0 |
| 2 | Propionaldehyde | PA | 58.1 | 0.798 | 46–50 | C3H6O | 123-38-6 | |
| 3 | Butyraldehyde | BA | 72.1 | 0.805 | 74.8 | C4H8O | 123-72-8 | |
| 4 | Isovaleraldehyde | IA | 86.1 | 0.797 | 90–93 | C5H10O | 590-86-3 | |
| 5 | n-Valeraldehyde | VA | 86.1 | 0.81 | 102–103 | C5H10O | 110-62-3 | |
| 6 | Aromatic | Benzene | B | 78.11 | 0.878 | 80.1 | C6H6 | 71-43-2 |
| 7 | Toluene | T | 92.14 | 0.866 | 111 | C7H8 | 108-88-3 | |
| 8 | Styrene | S | 104.2 | 0.906 | 145 | C8H8 | 100-42-5 | |
| 9 | p-Xylene | p-X | 106.2 | 0.865 | 138 | C8H10 | 106-42-3 | |
| 10 | m-Xylene | m-X | 106.2 | 0.865 | 139 | C8H10 | 108-38-3 | |
| 11 | o-Xylene | o-X | 106.2 | 0.88 | 144 | C8H10 | 95-47-6 | |
| 12 | Ketone | Methyl ethyl ketone | MEK | 72.11 | 0.805 | 79.64 | C4H8O | 78-93-3 |
| 13 | Methyl isobutyl ketone | MIBK | 100.2 | 0.802 | 117–118 | C6H12O | 108-10-1 | |
| 14 | Alcohol | Isobutyl alcohol | i-BuAl | 74.12 | 0.801 | 108 | C4H10O | 78-83-1 |
| 15 | Ester | n-Butyl acetate | BuAc | 116.2 | 0.881 | 126 | C6H12O2 | 123-86-4 |
| 16 | Fatty acid | Propionic acid | PPA | 74.1 | 0.99 | 141 | C3H6O2 | 79-09-04 |
| 17 | n-Butyric acid | BTA | 88.1 | 0.958 | 163.5 | C4H8O2 | 107-92-6 | |
| 18 | i-Valeric acid | IVA | 102 | 0.925 | 175–177 | C5H10O2 | 503-74-2 | |
| 19 | n-Valeric acid | VLA | 102 | 0.938 | 186–187 | C5H10O2 | 109-52-4 | |
| A. Preparation of liquid phase standard for 19 VOCs | |||||||||||||||||||||
|---|---|---|---|---|---|---|---|---|---|---|---|---|---|---|---|---|---|---|---|---|---|
| Compounds | Methanol | AA | PA | BA | IA | VA | B | T | S | p-X | m-X | o-X | MEK | MIBK | i-BuAl | BuAc | PPA | BTA | IVA | VLA | |
| Primary grade chemical | Concentration (%) | 99.0 | 97.0 | 99.0 | 97.0 | 97.0 | 99.5 | 99.5 | 99.0 | 99.0 | 99.0 | 97.0 | 99.0 | 99.5 | 99.0 | 99.5 | 99.0 | 99.0 | 99.0 | 99.0 | |
| PSa | Volume (μL) | 13,700 | 900 | 300 | 300 | 300 | 300 | 300 | 300 | 300 | 300 | 300 | 300 | 300 | 300 | 300 | 300 | 300 | 300 | 300 | 300 |
| Concentration (ng·μL−1) | 34,972 | 11,611 | 11,954 | 11,596 | 11,786 | 13,104 | 12,925 | 13,454 | 12,845 | 12,845 | 12,804 | 11,954 | 11,970 | 11,895 | 13,149 | 14,702 | 14,226 | 13,736 | 13,929 | ||
| 1st L-WSb | volume (μL) | 19,800 | 200 (of PS) | ||||||||||||||||||
| Concentration ( ng·μL−1) | 350 | 116 | 120 | 116 | 118 | 131 | 129 | 135 | 128 | 128 | 128 | 120 | 120 | 119 | 131 | 147 | 142 | 137 | 139 | ||
| B. Preparation of final working standard (F-WS) for 5 point calibration: absolute mass (ng) of VOC loaded on tube sampler | |||||||||||||||||||||
|---|---|---|---|---|---|---|---|---|---|---|---|---|---|---|---|---|---|---|---|---|---|
| Order | Mixing volume (μL) | Concentration c (ng μL−1) | |||||||||||||||||||
| 1st L-WS | Methanol | AA | PA | BA | IA | VA | B | T | S | p-X | m-X | o-X | MEK | MIBK | i-BuAl | BuAc | PPA | BTA | IVA | VLA | |
| 1 | 14 | 1,486 | 3.26 | 1.08 | 1.12 | 1.08 | 1.10 | 1.22 | 1.21 | 1.26 | 1.20 | 1.20 | 1.20 | 1.12 | 1.12 | 1.11 | 1.23 | 1.37 | 1.33 | 1.28 | 1.30 |
| 2 | 70 | 1,430 | 16.3 | 5.42 | 5.58 | 5.41 | 5.50 | 6.12 | 6.03 | 6.28 | 5.99 | 5.99 | 5.98 | 5.58 | 5.59 | 5.55 | 6.14 | 6.86 | 6.64 | 6.41 | 6.50 |
| 3 | 140 | 1,360 | 32.6 | 10.8 | 11.2 | 10.8 | 11.0 | 12.2 | 12.1 | 12.6 | 12.0 | 12.0 | 12.0 | 11.2 | 11.2 | 11.1 | 12.3 | 13.7 | 13.3 | 12.8 | 13.0 |
| 4 | 280 | 1,220 | 65.3 | 21.7 | 22.3 | 21.6 | 22.0 | 24.5 | 24.1 | 25.1 | 24.0 | 24.0 | 23.9 | 22.3 | 22.3 | 22.2 | 24.5 | 27.4 | 26.6 | 25.6 | 26.0 |
| 5 | 700 | 800 | 163 | 54.2 | 55.8 | 54.1 | 55.0 | 61.2 | 60.3 | 62.8 | 59.9 | 59.9 | 59.8 | 55.8 | 55.9 | 55.5 | 61.4 | 68.6 | 66.4 | 64.1 | 65.0 |
aPS: Dilution of pure chemical (primary grade chemical) to make 20 mL solutionb1st L-WS: Dilution of PS to make 20 mL solutioncAnalysis volume: 1 μL
| Order | Group | Compound | RF | R2 | RSEa (%) | |||||
|---|---|---|---|---|---|---|---|---|---|---|
| Exp_day 0 | Exp_day 9 | Mean | CVb | Exp_day 0 | Exp_day 9 | Mean | ||||
| 1 | Aldehyde | AA | 522 | 497 | 509.5 | 3.47 | 0.9619 | 0.9698 | 0.9659 | 2.52 |
| 2 | PA | 12,017 | 11,950 | 11,984 | 0.40 | 0.9991 | 0.9991 | 0.9991 | 3.49 | |
| 3 | BA | 43,572 | 43,467 | 43,520 | 0.17 | 0.9963 | 0.9938 | 0.9951 | 1.05 | |
| 4 | IA | 66,125 | 65,836 | 65,981 | 0.31 | 0.9962 | 0.9932 | 0.9947 | 1.93 | |
| 5 | VA | 59,322 | 59,804 | 59,563 | 0.57 | 0.9973 | 0.9973 | 0.9973 | 1.35 | |
| 6 | Aromatic | B | 131,760 | 131,280 | 131,520 | 0.26 | 0.9909 | 0.9930 | 0.9920 | 2.06 |
| 7 | T | 168,602 | 165,819 | 167,211 | 1.18 | 0.9995 | 0.9995 | 0.9995 | 0.83 | |
| 8 | S | 188,198 | 191,709 | 189,954 | 1.31 | 0.9995 | 0.9997 | 0.9996 | 1.32 | |
| 9 | p-X | 188,510 | 184,038 | 186,274 | 1.70 | 0.9997 | 0.9987 | 0.9992 | 0.49 | |
| 10 | m-X | 197,068 | 193,888 | 195,478 | 1.15 | 0.9992 | 0.9994 | 0.9993 | 0.56 | |
| 11 | o-X | 198,376 | 194,140 | 196,258 | 1.53 | 0.9991 | 0.9991 | 0.9991 | 0.73 | |
| 12 | Ketone | MEK | 48,980 | 48,566 | 48,773 | 0.60 | 0.9969 | 0.9987 | 0.9978 | 1.79 |
| 13 | MIBK | 117,383 | 117,646 | 117,515 | 0.16 | 0.9998 | 0.9985 | 0.9992 | 0.85 | |
| 14 | Alcohol | i-BuAl | 93,667 | 92,778 | 93,223 | 0.67 | 0.9969 | 0.9972 | 0.9971 | 1.73 |
| 15 | Ester | BuAc | 113,114 | 117,791 | 115,453 | 2.86 | 0.9982 | 0.9973 | 0.9978 | 0.79 |
| 16 | Carboxyl | PPA | 25,574 | 26,963 | 26,269 | 3.74 | 0.9977 | 0.9953 | 0.9965 | 1.68 |
| 17 | BTA | 71,259 | 67,832 | 69,546 | 3.48 | 0.9963 | 0.9967 | 0.9965 | 0.13 | |
| 18 | IVA | 99,441 | 94,589 | 97,015 | 3.54 | 0.9965 | 0.9935 | 0.9950 | 2.09 | |
| 19 | VLA | 79,615 | 78,950 | 79,283 | 0.59 | 0.9918 | 0.9925 | 0.9922 | 0.97 | |
| Mean | 1.46 | 0.9954 | 1.39 | |||||||
| SD | 1.29 | 0.0075 | 0.82 | |||||||
aFive replicate analyses of 26.1 ng (mean mass) of analytes per 1 μL injection of F-WS (4th calibration point)bCV (coefficient of variation) = SD/mean * 100
| Order | Group | Compounds | Short name | Number of atom and functional groupa | ECNc | RF values | PDe | ||||||
|---|---|---|---|---|---|---|---|---|---|---|---|---|---|
| CIb | HJb | OKb | (>C=O)Lb | (-O-)Mb | (-CH3)Nb | Actucal exp | ECN approachd | ||||||
| 1 | Aldehyde | Acetaldehyde | AA | 2 | 4 | 1 | 1 | 0 | 1 | 1.06 | 510 | -15,532 | |
| 2 | Propionaldehyde | PA | 3 | 6 | 1 | 1 | 0 | 1 | 1.99 | 11,984 | 12,921 | 7.82 | |
| 3 | Butyraldehyde | BA | 4 | 8 | 1 | 1 | 0 | 1 | 2.92 | 43,520 | 41,375 | 4.93 | |
| 4 | Isovaleraldehyde | IA | 5 | 10 | 1 | 1 | 0 | 2 | 4.00 | 65,981 | 74,418 | 12.8 | |
| 5 | n-Valeraldehyde | VA | 5 | 10 | 1 | 1 | 0 | 1 | 3.85 | 59,563 | 69,828 | 17.2 | |
| 6 | Aromatic | Benzene | B | 6 | 6 | 0 | 0 | 0 | 0 | 5.79 | 131,520 | 129,183 | 1.78 |
| Toluene | T | 7 | 8 | 0 | 0 | 0 | 1 | 6.87 | 167,211 | 162,226 | 2.98 | ||
| 8 | Styrene | S | 8 | 8 | 0 | 0 | 0 | 0 | 7.72 | 189,954 | 188,232 | 0.91 | |
| 9 | p-Xylene | p-X | 8 | 10 | 0 | 0 | 0 | 2 | 7.95 | 186,274 | 195,269 | 4.83 | |
| 10 | m-Xylene | m-X | 8 | 10 | 0 | 0 | 0 | 2 | 7.95 | 195,478 | 195,269 | 0.11 | |
| 11 | o-Xylene | o-X | 8 | 10 | 0 | 0 | 0 | 2 | 7.95 | 196,258 | 195,269 | 0.50 | |
| 12 | Ketone | Methyl ethyl ketone | MEK | 4 | 8 | 1 | 1 | 0 | 2 | 3.07 | 48,773 | 45,964 | 5.76 |
| 13 | Methyl isobutyl ketone | MIBK | 6 | 12 | 1 | 1 | 0 | 3 | 5.08 | 117,515 | 107,460 | 8.56 | |
| 14 | Alcohol | Isobutyl alcohol | i-BuAl | 4 | 10 | 1 | 0 | 1 | 2 | 4.50 | 93,223 | 89,715 | 3.76 |
| 15 | Ester | n-Butyl acetate | BuAc | 6 | 12 | 2 | 1 | 1 | 2 | 5.48 | 115,453 | 119,698 | 3.68 |
| 16 | Fatty acid | Propionic acid | PPA | 3 | 6 | 2 | 1 | 1 | 1 | 2.54 | 26,269 | 29,748 | 13.2 |
| 17 | n-Butyric acid | BTA | 4 | 6 | 2 | 1 | 1 | 1 | 3.54 | 69,546 | 60,344 | 13.2 | |
| 18 | i-Valeric acid | IVA | 5 | 10 | 2 | 1 | 1 | 2 | 4.55 | 97,015 | 91,245 | 5.95 | |
| 19 | n-Valeric acid | VLA | 5 | 10 | 2 | 1 | 1 | 1 | 4.40 | 79,283 | 86,656 | 9.30 | |
| Mean:6.52 ± 4.99 | |||||||||||||
aCarbon number equivalent for each atom and functional group (CNE): (1) C = 1, (2) H = −0.035, (3) O = 0, (4) >C=0 = −0.95, (5) -O- = 0.55, and (6) − CH3 = 0.15bI, J, K, L, M and N = number of C, H, O, >=O, -O-, CH3 (atoms or functional groups) in each VOC, respectivelycECN = I + J*(CNE of -H) + L*(CNE of >C=O) + M*(CNE of -O-) + N*(CNE of -CH3)dThe predictive equation (by ECN approach) for estimation of VOC concentration was determined using 18 liquid working standards except for AA: (1) RF = 30,595, (2) intercept = -47,963, and (3) R2 = 0.9901ePercent different (PD, %) = ABS{[RF (actual exp)-RF (ECN approach)] / RF (actual exp) * 100}
| [A] Sampling information of strawberry volatiles | |||
|---|---|---|---|
| a. Information of strawberry for sampling | |||
| Order | Sample code | Storage time (day) | Storage temp. (°C ) |
| 1 | SRD-0 | 0 | 25 |
| 2 | SRD-1 | 1 | 25 |
| 3 | SRD-3 | 3 | 25 |
| 4 | SRD-6 | 6 | 25 |
| 5 | SRD-9 | 9 | 25 |
| Initial weight = 50.09 g | |||
| b. Sampling approach | |
|---|---|
| Sampler: | 3 bed sorbent tube |
| Purge gas: | Nitrogen (>99.999%) |
| Purge gas flow: | 50 mL·min−1 |
| Pump model: | MP-Σ30 (Sibata, Japan) |
| Heater model: | TC200P (Korea) |
| [B] Instrumental setups for VOC analysis | |||
|---|---|---|---|
| a. GC (Shimadzu GC-2010, Japan) and MS (Shimadzu GCMS-QP2010, Japan) Column: CP Wax (diameter: 0.25 mm, length: 60 m, and film thickness: 0.25 μm ) | |||
| Oven setting | Detector setting | ||
| Initial temp: | 35 °C (10 min) | Ionization mode: | EI (70 eV) |
| Ramp rate: | 6 °C·min −1 | Ion source temp.: | 200 °C |
| Max oven temp: | 215 °C (10 min) | Interface temp.: | 200 °C |
| Total time: | 50 min | TIC scan range: | 35∼260 m/z |
| Carrier gas: | He (99.999%) | ||
| Carrier gas flow: | 1 mL·min −1 | ||
| b. Thermal desorber (Unity, Markes, UK) | |||
| Cold trap sorbent: | Tenax TA + Carbopack B (volume ratio=1:1) (diameter: 2 mm and sorbent bed length = 5 mm) | ||
| Split ratio: | 1:5 | Adsorption temp.: | -10 °C |
| Split flow: | 5 mL·min−1 | Desorption temp.: | 320 °C |
| Trap hold time: | 20 min | Flow path temp: | 150 °C |
| c. Sorbent (Sampling) Tube | |||
| Sorbent material: | Tenax TA + Carbopack B + Carboxen 1000 (mass (mg)=100 : 100: 100 ) | ||
| Desorption flow: | 50 mL·min−1 | ||
| Desorption time: | 5 min | Desorption temp.: | 300 °C |
| Order | Compounds | MW | Formula | Concentration | Odor threshold | Averaged Similarity * (%) | |||||||||||
|---|---|---|---|---|---|---|---|---|---|---|---|---|---|---|---|---|---|
| ppb | (μg m−3) | ||||||||||||||||
| (g mole−1) | SRD-0 | SRD-1 | SRD-3 | SRD-6 | SRD-9 | SRD-0 | SRD-1 | SRD-3 | SRD-6 | SRD-9 | (ppbv) | (μg m3) | Reference | ||||
| A. Ester (61) | |||||||||||||||||
| 1 | Methyl acetate | 74 | C3H6O2 | 3,949 | 3,875 | 71,077 | 1.57 | 0.75 | 11,945 | 11,720 | 214,987 | 4.76 | 2.28 | 1,700-6,170 | 5,142- | b, c | 98.4 |
| 2 | Ethyl acetate | 88 | C4 H8 O2 | 4,793 | 4,277 | 134,969 | 130.0 | 11.80 | 17,240 | 15,384 | 485,476 | 467 | 42.5 | 610-329 | 1,183-9,460 | a, b, c, e | 98.8 |
| 3 | Methyl propionate | 88 | C4H8O2 | 40.8 | 51.0 | 23.6 | 0.17 | 0.009 | 147 | 183 | 85.0 | 0.63 | 0.031 | 98 | 352 | b | 97.8 |
| 4 | S-Methyl thioacetate | 90 | C3 H6 O S | 94.2 | 130 | 0.031 | 0.031 | 0.031 | 346 | 475.8 | 0.113 | 0.113 | 0.113 | 1.6 | 5.9 | a | 97.0 |
| 5 | Methyl trans-crotonate | 100 | C5 H8 O2 | 2.77 | 3.16 | 8.51 | 0.005 | 0.005 | 11.3 | 12.9 | 34.8 | 0.021 | 0.021 | 92.0 | |||
| 6 | Isopropyl acetate | 102 | C5H10O2 | 52.8 | 16.7 | 27.5 | 0.005 | 0.005 | 220 | 69.5 | 114.5 | 0.021 | 0.021 | 290-2,400 | 1,209- | a, b, c | 98.3 |
| 7 | Methyl isobutyrate | 102 | C5H10O2 | 0.005 | 0.005 | 0.005 | 0.43 | 0.005 | 0.021 | 0.021 | 0.021 | 1.77 | 0.021 | 1.9 | 10,006 7.9 | b | 91.0 |
| 8 | Ethyl propionate | 102 | C5 H10 O2 | 52.7 | 0.005 | 53.5 | 0.005 | 0.005 | 219.8 | 0.022 | 223 | 0.022 | 0.022 | 7 | 29 | b | 98.5 |
| 9 | Propyl acetate | 102 | C5 H10 O2 | 0.005 | 0.005 | 185 | 0.72 | 0.005 | 0.022 | 0.022 | 769 | 3.02 | 0.022 | 568-960 | 2,367-4,002 | a, b, c | 97.5 |
| 10 | Methyl butyrate | 102 | C5 H10 O2 | 1194 | 1,384 | 88.8 | 0.47 | 0.005 | 4,977 | 5,772 | 370 | 1.95 | 0.022 | 2.8-7.1 | 12-30 | a, b | 98.0 |
| 11 | Ethyl crotonate | 114 | C6 H10 O2 | 7.13 | 4.49 | 26.2 | 0.003 | 0.003 | 33.22 | 20.91 | 122 | 0.016 | 0.016 | 95.7 | |||
| 12 | Methyl tiglate | 114 | C6H10O2 | 0.003 | 0.003 | 1.26 | 0.003 | 0.003 | 0.016 | 0.016 | 5.88 | 0.016 | 0.016 | 95.0 | |||
| 13 | Ethyl isobutyrate | 116 | C6 H12 O2 | 3.80 | 1.29 | 8.57 | 0.86 | 0.003 | 18.0 | 6.11 | 40.6 | 4.07 | 0.016 | 0.22 | 0.10 | b | 95.0 |
| 14 | Methyl 2-methylbutanoate | 116 | C6H12O2 | 21.8 | 21.7 | 13.2 | 1.08 | 0.003 | 104 | 103 | 62.7 | 5.14 | 0.016 | 0.1 | 0.5 | a | 97.3 |
| 15 | Isobutyl acetate | 116 | C6H12O2 | 9.11 | 7.00 | 88.9 | 1.86 | 0.003 | 43.2 | 33.2 | 421 | 8.80 | 0.016 | 8-479 | 38-2,271 | b, c | 98.0 |
| 16 | Methyl isovalerate | 116 | C6 H12 O2 | 54.8 | 56.9 | 7.78 | 0.003 | 0.003 | 260 | 270 | 36.9 | 0.016 | 0.016 | 1.1-2.2 | 5.2-10 | a, b | 97.7 |
| 17 | Ethyl butyrate | 116 | C6 H12 O2 | 1,537 | 1,142 | 171 | 1.50 | 0.003 | 7,290 | 5,415 | 812 | 7.10 | 0.017 | 0.04-0.2 | 0.19-1.2 | a, b | 97.5 |
| 18 | Butyl acetate | 116 | C6 H12 O2 | 34.2 | 36.5 | 26.4 | 0.05 | 0.003 | 162 | 173 | 125 | 0.24 | 0.017 | 10.7-195 | 50.9-925 | a, b, c | 93.0 |
| 19 | Methyl valerate | 116 | C6 H12 O2 | 3.91 | 1.74 | 0.003 | 0.003 | 0.003 | 18.5 | 8.26 | 0.017 | 0.017 | 0.017 | 2.2 | 10 | b | 95.5 |
| 20 | S-Methyl thiobutyrate | 118 | C5H10OS | 0.006 | 4.47 | 0.006 | 0.006 | 0.006 | 0.027 | 21.57 | 0.027 | 0.027 | 0.027 | 92.0 | |||
| 21 | Methyl 2-vinylbutanoate | 128 | C7 H12 O2 | 0.77 | 0.003 | 0.003 | 0.003 | 0.003 | 4.03 | 0.013 | 0.013 | 0.013 | 0.013 | 96.0 | |||
| 22 | 4-Penten-1-yl acetate | 128 | C7 H12 O2 | 2.65 | 0.80 | 3.74 | 0.003 | 0.003 | 13.8 | 4.20 | 19.6 | 0.014 | 0.014 | 91.3 | |||
| 23 | Ethyl tiglate | 128 | C7H12O2 | 0.002 | 1.41 | 16.6 | 0.002 | 0.002 | 0.013 | 7.40 | 86.7 | 0.013 | 0.013 | 94.5 | |||
| 24 | cis-2-Penten-1-yl acetate | 128 | C7 H12 O2 | 4.96 | 0.003 | 0.003 | 0.003 | 0.003 | 25.95 | 0.013 | 0.013 | 0.013 | 0.013 | 91.0 | |||
| 25 | Prenyl acetate | 128 | C7H12O2 | 0.48 | 2.83 | 0.002 | 0.002 | 0.002 | 2.52 | 14.81 | 0.013 | 0.013 | 0.013 | 96.0 | |||
| 26 | Methyl (2E)-2-hexenoate | 128 | C7H12O2 | 1.66 | 0.89 | 0.66 | 0.003 | 0.003 | 8.66 | 4.68 | 3.44 | 0.013 | 0.013 | ||||
| 27 | Isopropyl butyrate | 130 | C7H14O2 | 30.7 | 25.9 | 0.002 | 0.002 | 0.002 | 163.0 | 137.8 | 0.013 | 0.013 | 0.013 | 6.2 | 33 | b | 93.5 |
| 28 | Ethyl 2-methylbutyrate | 130 | C7H14O2 | 63.0 | 23.8 | 66.3 | 3.13 | 0.002 | 335 | 126 | 352 | 16.6 | 0.013 | 0.07 | 0.36 | a | 97.0 |
| 29 | Ethyl isovalerate | 130 | C7 H14 O2 | 142 | 67.2 | 36.1 | 0.70 | 0.002 | 753 | 357 | 192 | 3.73 | 0.013 | 0.013-0.09 | 0.069-0.47 | a, b | 96.3 |
| 30 | Isoamyl acetate | 130 | C7 H14 O2 | 81.3 | 69.1 | 165 | 1.21 | 0.002 | 432 | 367.15 | 878 | 6.43 | 0.013 | 3.8 | 20 | e | 98.0 |
| 31 | Ethyl valerate | 130 | C7 H14 O2 | 7.31 | 1.73 | 0.003 | 0.003 | 0.003 | 38.83 | 9.22 | 0.013 | 0.013 | 0.013 | 0.11-0.33 | 0.58-1.78 | a, b | 96.5 |
| 32 | Methyl 4-methylvalerate | 130 | C7H14O2 | 2.58 | 0.96 | 0.002 | 0.002 | 0.002 | 13.72 | 5.09 | 0.013 | 0.013 | 0.013 | 94.5 | |||
| 33 | Methyl hexanoate | 130 | C7 H14 O2 | 469 | 185 | 11.36 | 0.003 | 0.003 | 2,492 | 982 | 60.34 | 0.013 | 0.013 | 15.6 | 82.8 | a | 97.0 |
| 34 | 3-Methyl-2-butyl acetate | 130 | C7 H14 O2 | 0.002 | 0.002 | 0.48 | 0.002 | 0.002 | 0.013 | 0.013 | 2.55 | 0.013 | 0.013 | 93.0 | |||
| 35 | Hex-5-enoic acid, ethyl ester | 142 | C8H14O2 | 1.31 | 0.002 | 0.002 | 0.002 | 0.002 | 7.62 | 0.011 | 0.011 | 0.011 | 0.011 | 92.0 | |||
| 36 | cis-3-Hexenyl acetate | 142 | C8 H14 O2 | 2.43 | 0.002 | 0.002 | 0.002 | 0.002 | 14.1 | 0.011 | 0.011 | 0.011 | 0.011 | 3.3 | 19 | a | 95.0 |
| 37 | (4E)-4-Hexenyl acetate | 142 | C8H14O2 | 5.41 | 2.68 | 0.002 | 0.002 | 0.002 | 31.4 | 15.5 | 0.011 | 0.011 | 0.011 | 91.0 | |||
| 38 | trans-2-Hexenyl acetate | 142 | C8 H14 O2 | 38.6 | 1.78 | 0.002 | 0.002 | 0.002 | 224 | 10.4 | 0.011 | 0.011 | 0.011 | 42.8 | 249 | a | 92.0 |
| 39 | Ethyl 2-hexenoate | 142 | C8H14O2 | 3.29 | 1.24 | 0.002 | 0.002 | 0.002 | 19.1 | 7.21 | 0.011 | 0.011 | 0.011 | 95.5 | |||
| 40 | Methyl amyl acetate | 144 | C8 H16 O2 | 0.002 | 0.002 | 0.37 | 0.002 | 0.002 | 0.011 | 0.011 | 2.16 | 0.011 | 0.011 | 93.0 | |||
| 41 | Isobutyl butyrate | 144 | C8H16O2 | 0.002 | 1.13 | 0.91 | 0.002 | 0.002 | 0.011 | 6.65 | 5.35 | 0.011 | 0.011 | 1.6 | 9.4 | b | 93.5 |
| 42 | Propyl isovalerate | 144 | C8H16O2 | 0.39 | 0.48 | 0.75 | 0.002 | 0.002 | 2.29 | 2.85 | 4.40 | 0.011 | 0.011 | 0.056 | 0.330 | b | 91.0 |
| 43 | Butyl butylate | 144 | C8 H16 O2 | 0.78 | 1.37 | 0.002 | 0.002 | 0.002 | 4.60 | 8.08 | 0.011 | 0.011 | 0.011 | 4.8-22.1 | 28-130 | a, b | 96.5 |
| 44 | Ethyl hexanoate | 144 | C8H16O2 | 725 | 137 | 20.9 | 0.03 | 0.002 | 4,270 | 808 | 123 | 0.16 | 0.011 | 0.2 | 1.2 | a | 97.0 |
| 45 | Hexyl acetate | 144 | C8H16O2 | 110 | 25.5 | 4.70 | 0.002 | 0.002 | 647 | 150 | 27.7 | 0.011 | 0.011 | 2 | 12 | a | 97.7 |
| 46 | Valeric acid, thio-, S-ethyl ester | 146 | C7 H14 O S | 0.89 | 0.003 | 0.003 | 0.003 | 0.003 | 5.29 | 0.015 | 0.015 | 0.015 | 0.015 | 95.0 | |||
| 47 | Ethyl 3-hydroxy-3-methylbutanoate | 146 | C7 H14 O3 | 0.002 | 0.002 | 0.002 | 0.04 | 0.002 | 0.012 | 0.012 | 0.012 | 0.21 | 0.012 | 97.0 | |||
| 48 | Ethyl benzoate | 150 | C9H10O2 | 0.39 | 0.002 | 0.002 | 0.02 | 0.002 | 2.37 | 0.009 | 0.009 | 0.15 | 0.009 | 90.0 | |||
| 49 | Isobutyl isovalerate | 158 | C9H18O2 | 0.001 | 0.001 | 0.33 | 0.001 | 0.001 | 0.009 | 0.009 | 2.15 | 0.009 | 0.009 | 5.2 | 34 | b | 94.0 |
| 50 | Neopentyl butyrate | 158 | C9H18O2 | 0.001 | 0.59 | 0.001 | 0.001 | 0.001 | 0.009 | 3.78 | 0.009 | 0.009 | 0.009 | 93.0 | |||
| 51 | Isoamyl butyrate | 158 | C9 H18 O2 | 1.58 | 1.53 | 0.001 | 0.001 | 0.001 | 10.2 | 9.87 | 0.009 | 0.009 | 0.009 | 94.0 | |||
| 52 | Heptyl acetate | 158 | C9H18O2 | 0.29 | 0.001 | 0.001 | 0.001 | 0.001 | 1.85 | 0.010 | 0.010 | 0.010 | 0.010 | 91.0 | |||
| 53 | Methyl octanoate | 158 | C9 H18 O2 | 5.84 | 0.88 | 0.001 | 0.001 | 0.001 | 37.7 | 5.710 | 0.010 | 0.010 | 0.010 | 36.7 | 237 | a | 95.5 |
| 54 | Octyl acetate | 172 | C10 H20 O2 | 0.55 | 0.001 | 0.001 | 0.001 | 0.001 | 3.86 | 0.008 | 0.008 | 0.008 | 0.008 | 95.0 | |||
| 55 | Hexyl butyrate | 172 | C10H20O2 | 0.52 | 0.001 | 0.001 | 0.001 | 0.001 | 3.65 | 0.008 | 0.008 | 0.008 | 0.008 | 92.0 | |||
| 56 | Ethyl octanoate | 172 | C10H20O2 | 4.55 | 0.001 | 0.001 | 0.001 | 0.001 | 32.0 | 0.008 | 0.008 | 0.008 | 0.008 | 94.0 | |||
| 57 | Octyl acetate | 172 | C10H20O2 | 1.25 | 0.001 | 0.001 | 0.001 | 0.001 | 8.80 | 0.008 | 0.008 | 0.008 | 0.008 | 91.0 | |||
| 58 | Cyclopentanecarboxylic acid, decyl ester | 254 | C16H30O2 | 0.0005 | 0.0005 | 0.0005 | 0.0005 | 0.0555 | 0.0049 | 0.0049 | 0.0049 | 0.005 | 0.58 | 92.0 | |||
| 59 | 2-(Dodecyloxy)ethyl acetate | 272 | C16H32O3 | 0.0004 | 0.0004 | 0.11 | 0.0004 | 0.0004 | 0.0047 | 0.0047 | 1.21 | 0.005 | 0.0047 | 92.0 | |||
| 60 | Linalylanthranilate N-(tert-butoxycarbonyl)-glycyl- | 273 | C17 H23 N O2 | 0.44 | 0.0004 | 0.0004 | 0.0004 | 0.0004 | 4.95 | 0.0044 | 0.0044 | 0.004 | 0.0044 | 93.0 | |||
| 61 | glycin-imidthiosaure-s-ethylester | 275 | C11H21N3O3S | 0.001 | 0.001 | 0.001 | 0.05 | 0.03 | 0.008 | 0.008 | 0.008 | 0.58 | 0.39 | 92.5 | |||
| Σconcentration (ester) | 52,648 | 42,713 | 705,447 | 533 | 45.7 | ||||||||||||
| B. Alcohol (21) | |||||||||||||||||
| 62 | Ethyl alcohol | 46 | C2H6O | 0.037 | 0.037 | 309 | 48,685 | 1,417 | 0.070 | 0.070 | 580 | 91,537 | 2,665 | 520-28,800 | 978-54,150 | b, c | 95 .6 |
| 63 | Isopropyl Alcohol | 60 | C3H8O | 8.76 | 4.58 | 45.3 | 92.8 | 278 | 21.5 | 11.2 | 111 | 228 | 680.73 | 10,200- | 25,015- | b, c | 95.6 |
| 64 | n-Propyl alcohol | 60 | C3 H8 O | 0.014 | 0.014 | 30.40 | 46.6 | 36.1 | 0.035 | 0.035 | 74.54 | 114.4 | 88.51 | 94-2,400 | 231-5,886 | b, c | 94.3 |
| 65 | sec-Butyl alcohol | 74 | C4 H10 O | 0.007 | 0.007 | 0.007 | 0.56 | 0.55 | 0.022 | 0.022 | 0.022 | 1.70 | 1.65 | 220-1,700 | 665-5,142 | b, c | 93.5 |
| 66 | Isobutyl alcohol | 74 | C4 H10 O | 0.007 | 0.007 | 31.84 | 95,136 | 319.8 | 0.021 | 0.021 | 96.30 | 287,758 | 967 | 11-832 | 33-2,517 | b, c | 97.7 |
| 67 | n-Butyl alcohol | 74 | C4H10O | 0.008 | 2.40 | 8.78 | 0.86 | 0.37 | 0.023 | 7.26 | 26.6 | 2.61 | 1.12 | 490-26,000 | 1,482- | b, c | 96.3 |
| 68 | 1-Penten-3-ol | 86 | C5 H10 O | 0.005 | 0.005 | 0.61 | 0.005 | 0.005 | 0.017 | 0.017 | 2.13 | 0.017 | 0.017 | 94.0 | |||
| 69 | Isopropenylethyl alcohol | 86 | C5H10O | 0.005 | 0.005 | 0.005 | 2.41 | 4.47 | 0.017 | 0.017 | 0.017 | 8.48 | 15.7 | 2,500 | 8,788 | e | 96.0 |
| 70 | 3-Methyl-1-butanol | 88 | C5 H12 O | 1.09 | 1.28 | 50.7 | 26.9 | 43.4 | 3.91 | 4.61 | 182.26 | 96.9 | 156 | 2-45 | 6-161 | b, c | 93.2 |
| 71 | 2-Methyl-1-butanol | 88 | C5 H12 O | 0.005 | 0.005 | 0.005 | 9.48 | 19.6 | 0.017 | 0.017 | 0.017 | 34.12 | 70.50 | 41 | 147 | e | 98.0 |
| 72 | n-Pentanol | 88 | C5 H12 O | 0.005 | 0.005 | 0.005 | 0.99 | 0.86 | 0.017 | 0.017 | 0.017 | 3.57 | 3.10 | 100-468 | 360-1,683 | b, c | 96.0 |
| 73 | 1-Chloro-2-propanol | 94 | C3 H7 CL O | 20.03 | 80.3 | 0.009 | 0.009 | 0.009 | 77.0 | 309 | 0.034 | 0.034 | 0.034 | 1,000 | 3,842 | f | 93.0 |
| 74 | 3-Methylpentanol | 102 | C6 H14 O | 0.003 | 0.003 | 0.003 | 0.05 | 0.34 | 0.013 | 0.013 | 0.013 | 0.22 | 1.41 | 93.0 | |||
| 75 | n-Hexanol | 102 | C6 H14 O | 0.52 | 0.003 | 1.16 | 0.15 | 1.08 | 2.17 | 0.014 | 4.83 | 0.63 | 4.51 | 1.1-43.7 | 4.6-182 | b, c, e | 92.8 |
| 76 | 2-Heptanol | 116 | C7 H16 O | 0.002 | 0.002 | 0.002 | 0.42 | 0.17 | 0.011 | 0.011 | 0.011 | 2.01 | 0.81 | 93.5 | |||
| 77 | Phenethyl alcohol | 122 | C8 H10 O | 0.002 | 0.002 | 0.002 | 0.15 | 0.13 | 0.010 | 0.010 | 0.010 | 0.73 | 0.65 | 92.0 | |||
| 78 | (E)-2-Octen-1-ol | 128 | C8H16O | 0.25 | 0.002 | 0.002 | 0.002 | 0.002 | 1.31 | 0.010 | 0.010 | 0.010 | 0.010 | ||||
| 79 | 1-Octen-3-ol | 128 | C8 H16 O | 0.002 | 0.002 | 0.002 | 0.02 | 0.12 | 0.010 | 0.010 | 0.010 | 0.09 | 0.62 | 2.26 | 11.8 | a | 91.0 |
| 80 | 2-Ethylhexanol | 130 | C8 H18 O | 0.42 | 0.002 | 0.002 | 0.05 | 0.12 | 2.21 | 0.010 | 0.010 | 0.28 | 0.63 | 91.0 | |||
| 81 | Linalool | 154 | C10 H18 O | 5.14 | 5.08 | 0.001 | 0.001 | 0.001 | 32.4 | 32.0 | 0.007 | 0.007 | 0.007 | 0.19 | 1.18 | a | 93.0 |
| 82 | .alpha.-Methyl-.alpha.-[4-methyl-3-pentenyl]oxiranemethanol | 170 | C10H18O2 | 0.001 | 0.001 | 0.001 | 0.03 | 0.001 | 0.007 | 0.007 | 0.007 | 0.17 | 0.007 | 91.0 | |||
| Sum | 140 | 364 | 1,078 | 379,789 | 4,658 | ||||||||||||
| C. Aldehyde (11) | |||||||||||||||||
| 83 | Acetaldehyde | 44 | C2 H4 O | 1,618 | 1,646 | 10,584 | 730 | 540 | 2,909 | 2,959 | 19,035 | 1,313 | 971 | 1.5-186 | 2.7-335 | b, c | 99 .2 |
| 84 | Allyl aldehyde (Acrolein) | 56 | C3 H4 O | 0.082 | 0.082 | 0.082 | 5.08 | 6.90 | 0.189 | 0.189 | 0.189 | 11.62 | 15.8 | 3.6-174 | 8.2-398 | b, c | 98.0 |
| 85 | Methylacryl aldehyde | 70 | C4 H6 O | 0.016 | 0.016 | 0.016 | 1.80 | 3.33 | 0.045 | 0.045 | 0.045 | 5.14 | 9.52 | 8.5 | 24 | b | |
| 86 | Isobutyraldehyde | 72 | C4H8O | 0.015 | 0.015 | 0.015 | 0.24 | 3.80 | 0.043 | 0.043 | 0.043 | 0.71 | 11.17 | 0.35-40.7 | 1.03-120 | b, c | |
| 87 | Butyraldehyde | 72 | C4H8O | 0.015 | 0.015 | 0.015 | 0.35 | 0.015 | 0.045 | 0.045 | 0.045 | 1.04 | 0.045 | 0.67-8.91 | 1.97-26.2 | b, c | 96.0 |
| 88 | Methylethylacetaldehyde | 86 | C5H10O | 0.008 | 0.008 | 0.008 | 0.15 | 0.51 | 0.027 | 0.027 | 0.027 | 0.52 | 1.79 | 94.5 | |||
| 89 | Isovaleraldehyde | 86 | C5 H10 O | 0.009 | 0.009 | 0.009 | 1.03 | 2.45 | 0.030 | 0.030 | 0.030 | 3.60 | 8.62 | 0.1-2.24 | 0.4-7.87 | b, c | 96.0 |
| 90 | n-Caproaldehyde | 100 | C6H12O | 1.38 | 0.005 | 0.77 | 0.005 | 0.005 | 5.66 | 0.020 | 3.14 | 0.020 | 0.020 | 0.28-13.8 | 1.14-56.4 | a, b, c | 91.0 |
| 91 | Benzaldehyde | 106 | C7 H6 O | 0.003 | 0.003 | 3.71 | 0.50 | 0.22 | 0.015 | 0.015 | 16.1 | 2.16 | 0.97 | 41.7 | 181 | c | 94.3 |
| 92 | n-Nonylaldehyde | 142 | C9 H18 O | 0.55 | 0.002 | 0.002 | 0.002 | 0.002 | 3.17 | 0.011 | 0.011 | 0.011 | 0.011 | 0.34-2.24 | 1.97-13.0 | b, c | 91.0 |
| 93 | 2,4-dihydroxy-6-(2′-oxoheptyl)benzaldehyde | 250 | C14 H18 O4 | 0.001 | 0.001 | 0.001 | 0.001 | 0.36 | 0.006 | 0.006 | 0.006 | 0.006 | 3.64 | 96.0 | |||
| Sum | 2,918 | 2,959 | 19,054 | 1,338 | 1,022 | ||||||||||||
| D. Ketone (9) | |||||||||||||||||
| 94 | Acetone | 58 | C3 H6 O | 2,514 | 3,131 | 224 | 7.35 | 28.0 | 5,960 | 7,422 | 532 | 17.43 | 66.5 | 4,580-42,000 | 10,858- | b, c, e | 97.8 |
| 95 | Methyl vinyl ketone | 70 | C4 H6 O | 0.016 | 0.016 | 1.25 | 0.016 | 0.016 | 0.045 | 0.045 | 3.57 | 0.045 | 0.045 | 183 | 524 | d | 91.0 |
| 96 | Methyl ethyl ketone | 72 | C4 H8 O | 0.014 | 0.014 | 0.014 | 1.15 | 1.35 | 0.041 | 0.041 | 0.041 | 3.39 | 3.96 | 270-7,760 | 795-22,837 | b, c, e | 93.0 |
| 97 | Methyl n-propyl ketone | 86 | C5H10O | 54.0 | 47.1 | 0.008 | 0.008 | 0.008 | 190 | 166 | 0.027 | 0.027 | 0.027 | 28-1,550 | 98-5,449 | b, c | 93.5 |
| 98 | Dimethyl diketone | 86 | C4H6O2 | 13.7 | 0.030 | 13.9 | 3.21 | 0.030 | 48.10 | 0.104 | 48.89 | 11.3 | 0.104 | 4.37 | 15.4 | c | 96.3 |
| 99 | Methyl Isobutyl Ketone | 100 | C6H12O | 4.62 | 7.50 | 1.11 | 0.004 | 0.004 | 18.87 | 30.7 | 4.53 | 0.017 | 0.017 | 121-537 | 495-2,195 | b, c, e | 95.0 |
| 100 | Methyl amyl ketone | 114 | C7 H14 O | 5.64 | 6.52 | 0.003 | 0.51 | 0.61 | 26.28 | 30.4 | 0.015 | 2.36 | 2.85 | 35.6-141 | 166-657 | a, b, c | 97.8 |
| 101 | Spiro[3.6]deca-5,7-diene-1-one | 148 | C10 H12 O | 0.001 | 0.001 | 0.15 | 0.001 | 0.001 | 0.009 | 0.009 | 0.91 | 0.009 | 0.009 | 94.0 | |||
| 102 | Phenyl methyl ketone | 120 | C8 H8 O | 1.56 | 0.002 | 0.002 | 0.10 | 0.13 | 7.67 | 0.012 | 0.012 | 0.50 | 0.62 | 363 | 1,780 | c | 91.3 |
| Sum | 6,251 | 7,649 | 589 | 35 | 74 | ||||||||||||
| E. Fatty acid (5) | |||||||||||||||||
| 103 | Acetic acid | 60 | C2H4O2 | 2,519 | 1,918 | 1,761 | 210 | 86 | 6,177 | 4,703 | 4,319 | 514 | 212 | 6-145 | 15-356 | b, c, e | 93 .0 |
| 104 | 2-Propynoic acid | 70 | C3 H2 O2 | 69.6 | 0.023 | 0.023 | 0.023 | 0.023 | 199 | 0.067 | 0.067 | 0.067 | 0.067 | 94 | 269 | i | 93.0 |
| 105 | Methacrylic acid | 86 | C4H6O2 | 3.92 | 0.009 | 0.009 | 0.009 | 0.009 | 13.8 | 0.033 | 0.033 | 0.033 | 0.033 | 93.0 | |||
| 106 | 2-Methylbutanoic acid | 102 | C5 H10 O2 | 0.005 | 0.005 | 0.005 | 0.31 | 0.005 | 0.022 | 0.022 | 0.022 | 1.30 | 0.022 | 8-186 | 33-775 | a, c, e | 93.0 |
| 107 | Undec-10-ynoic acid | 182 | C11H18O2 | 0.001 | 0.001 | 0.001 | 0.001 | 0.04 | 0.008 | 0.008 | 0.008 | 0.008 | 0.28 | 92.0 | |||
| Sum | 6,390 | 4,703 | 4,319 | 516 | 212 | ||||||||||||
| F.etc. (40) | |||||||||||||||||
| 108 | Isoprene | 68 | C5 H8 | 3.98 | 6.11 | 4.08 | 0.007 | 0.77 | 11.06 | 17.0 | 11.34 | 0.020 | 2.13 | 48-455 | 133-1,265 | b, e | 95.3 |
| 109 | Ethylidenecyclopropane | 68 | C5 H8 | 0.007 | 0.007 | 0.007 | 0.06 | 0.007 | 0.020 | 0.020 | 0.020 | 0.17 | 0.020 | 93.0 | |||
| 110 | cis-Piperylene | 68 | C5 H8 | 1.54 | 1.49 | 0.007 | 0.17 | 0.007 | 4.29 | 4.14 | 0.020 | 0.46 | 0.020 | 89.3 | |||
| 111 | Methylenecyclobutane | 68 | C5H8 | 0.007 | 0.79 | 0.54 | 0.007 | 0.007 | 0.020 | 2.20 | 1.49 | 0.020 | 0.020 | 84.5 | |||
| 112 | Divinylene oxide | 68 | C4H4O | 0.008 | 0.008 | 0.008 | 0.008 | 0.60 | 0.023 | 0.023 | 0.023 | 0.023 | 1.66 | 97.0 | |||
| 113 | Propylethylene | 70 | C5 H10 | 0.007 | 0.007 | 0.74 | 0.007 | 0.007 | 0.020 | 0.020 | 2.12 | 0.020 | 0.020 | 90.0 | |||
| 114 | n-Pentane | 72 | C5 H12 | 12.1 | 0.007 | 0.007 | 0.29 | 2.20 | 35.7 | 0.019 | 0.019 | 0.86 | 6.48 | 1,400-31,600 | 4,120-92,997 | b, c | 96.3 |
| 115 | Furanidine | 72 | C4H8O | 0.008 | 0.008 | 0.008 | 0.008 | 0.56 | 0.024 | 0.024 | 0.024 | 0.024 | 1.65 | 97.0 | |||
| 116 | Ethyl ether | 74 | C4 H10 O | 0.007 | 0.007 | 0.70 | 0.41 | 1.45 | 0.022 | 0.022 | 2.12 | 1.23 | 4.38 | 330 | 998 | h | 93.7 |
| 117 | 1,3-Hexadiene | 82 | C6 H10 | 25.0 | 1.77 | 0.005 | 0.005 | 0.005 | 83.9 | 5.94 | 0.015 | 0.015 | 0.015 | 2,000 | 6,703 | g | 97.0 |
| 118 | Furan, 2-methyl- | 82 | C5 H6 O | 0.005 | 0.005 | 0.005 | 0.005 | 0.60 | 0.016 | 0.016 | 0.016 | 0.016 | 2.00 | 24,678 | 82,713 | d | 93.0 |
| 119 | Methylcyclopentane | 84 | C6H12 | 0.005 | 0.005 | 0.005 | 0.005 | 0.57 | 0.016 | 0.016 | 0.016 | 0.016 | 1.97 | 96.0 | |||
| 120 | n-Hexane | 86 | C6H14 | 1.21 | 1.02 | 1.02 | 0.004 | 8.03 | 4.27 | 3.60 | 3.57 | 0.015 | 28.22 | 1,500-21,900 | 5,273-76,983 | b, c | 94.3 |
| 121 | 2,2-Dimethylbutane | 86 | C6 H14 | 3.49 | 0.004 | 0.004 | 0.004 | 0.004 | 12.27 | 0.014 | 0.014 | 0.014 | 0.014 | 90.0 | |||
| 122 | Toluene | 92 | C7H8 | 0.003 | 0.003 | 0.003 | 0.003 | 2.48 | 0.012 | 0.012 | 0.012 | 0.012 | 9.32 | 160-1,550 | 602-5,829 | b, c, e | 97.0 |
| 123 | Phenol | 94 | C6H6O | 0.004 | 0.004 | 0.004 | 0.22 | 0.004 | 0.014 | 0.014 | 0.014 | 0.84 | 0.014 | 5.60-110 | 21.5-423 | b, c | 91.0 |
| 124 | 1-Heptene | 98 | C7H14 | 0.42 | 0.63 | 0.47 | 0.17 | 0.56 | 1.69 | 2.51 | 1.87 | 0.68 | 2.24 | 94.4 | |||
| 125 | 3-Methylhexane | 100 | C7H16 | 0.003 | 0.003 | 0.003 | 0.003 | 0.08 | 0.012 | 0.012 | 0.012 | 0.012 | 0.33 | 840 | 3,433 | b | 92.0 |
| 126 | Styrene | 104 | C8 H8 | 10.05 | 11.99 | 19.41 | 3.03 | 1.09 | 42.7 | 51.0 | 82.5 | 12.9 | 4.64 | 34.4-35 | 146-149 | b, e | 93.2 |
| 127 | Ethylbenzene | 106 | C8H10 | 1.65 | 0.002 | 0.002 | 0.002 | 0.10 | 7.16 | 0.010 | 0.010 | 0.010 | 0.44 | 2.88-170 | 12.5-737 | b, c | 94.5 |
| 128 | p-Xylene | 106 | C8 H10 | 0.32 | 0.002 | 0.002 | 0.002 | 0.02 | 1.39 | 0.011 | 0.011 | 0.011 | 0.10 | 58-490 | 251-2,123 | b, c | 93.0 |
| 129 | 3-Cyclohexenyl cyanide | 107 | C7 H9 N | 0.003 | 0.003 | 0.003 | 0.003 | 0.13 | 0.013 | 0.013 | 0.013 | 0.013 | 0.55 | 92.0 | |||
| 130 | Anisole | 108 | C7H8O | 0.002 | 0.002 | 0.002 | 0.06 | 0.002 | 0.011 | 0.011 | 0.011 | 0.27 | 0.011 | 90.0 | |||
| 131 | n-Octane | 114 | C8 H18 | 0.002 | 0.002 | 0.002 | 0.002 | 0.12 | 0.011 | 0.011 | 0.011 | 0.011 | 0.57 | 1,700-5,750 | 7,921-26,793 | b, c | 91.0 |
| 132 | p-Allyltoluene | 132 | C10H12 | 0.52 | 0.001 | 0.001 | 0.001 | 0.001 | 2.78 | 0.008 | 0.008 | 0.008 | 0.008 | 94.0 | |||
| 133 | p-Isopropylphenol | 136 | C9H12O | 0.001 | 0.001 | 0.001 | 0.001 | 0.04 | 0.008 | 0.008 | 0.008 | 0.008 | 0.23 | 93.0 | |||
| 134 | 2-Methyl-6-methylene-2,7-octadiene | 136 | C10 H16 | 0.001 | 0.42 | 0.001 | 0.001 | 0.001 | 0.008 | 2.34 | 0.008 | 0.008 | 0.008 | 92.0 | |||
| 135 | l-Limonene | 136 | C10 H16 | 0.25 | 0.52 | 0.001 | 0.001 | 0.001 | 1.36 | 2.88 | 0.008 | 0.008 | 0.008 | 90.0 | |||
| 136 | (E)-.beta.-Ocimene | 136 | C10 H16 | 0.24 | 0.001 | 0.001 | 0.001 | 0.001 | 1.33 | 0.008 | 0.008 | 0.008 | 0.008 | 90.0 | |||
| 137 | Tetramethylbutanedinitrile | 136 | C8H12N2 | 0.59 | 0.002 | 0.002 | 0.002 | 0.002 | 3.30 | 0.010 | 0.010 | 0.010 | 0.010 | 94.0 | |||
| 138 | 2,2,3,3-Tetramethylhexane | 142 | C10 H22 | 0.001 | 1.65 | 0.001 | 0.001 | 0.001 | 0.008 | 9.57 | 0.008 | 0.008 | 0.008 | 94.0 | |||
| 139 | 2,5-Dimethyl-4-methoxy-3(2H)-furanone | 142 | C7H10O3 | 1.42 | 0.002 | 0.002 | 2.66 | 0.88 | 8.23 | 0.011 | 0.011 | 15.5 | 5.08 | 3.26 | 18.9 | a | 91.7 |
| 140 | m-Dichlorobenzene | 146 | C6H4Cl2 | 0.003 | 0.003 | 0.003 | 0.06 | 0.08 | 0.015 | 0.015 | 0.015 | 0.34 | 0.46 | 96.5 | |||
| 141 | 3,5-Dihydroxybenzamide | 153 | C7H7NO3 | 0.002 | 0.002 | 0.002 | 0.03 | 0.002 | 0.012 | 0.012 | 0.012 | 0.18 | 0.012 | 91.0 | |||
| 142 | n-Butanoic anhydride | 158 | C8H14O3 | 0.002 | 0.53 | 0.002 | 0.002 | 0.002 | 0.013 | 3.44 | 0.013 | 0.013 | 0.013 | 93.0 | |||
| 143 | Genitron | 164 | C8H12N4 | 0.001 | 0.001 | 0.001 | 0.05 | 0.001 | 0.010 | 0.010 | 0.010 | 0.33 | 0.010 | 90.0 | |||
| 144 | 2-Propyloctahydro-2H-thiochromene | 198 | C12H22S | 0.001 | 0.001 | 0.001 | 0.01 | 0.001 | 0.007 | 0.007 | 0.007 | 0.04 | 0.007 | 90.0 | |||
| 145 | l-Caryophyllene | 204 | C15 H24 | 0.001 | 0.001 | 0.001 | 0.15 | 0.11 | 0.005 | 0.005 | 0.005 | 1.28 | 0.88 | 92.0 | |||
| 146 | .alpha.-Muurolene | 204 | C15 H24 | 0.001 | 0.001 | 0.001 | 0.01 | 0.01 | 0.005 | 0.005 | 0.005 | 0.11 | 0.11 | 91.0 | |||
| 147 | 2,3-Epoxy-.beta.-ionone | 208 | C13 H20 O2 | 0.001 | 1.28 | 0.001 | 0.001 | 0.001 | 0.006 | 10.9 | 0.006 | 0.006 | 0.006 | 98.0 | |||
| Sum | 221 | 115 | 105 | 35.1 | 73.4 | Mean | 94.1 | ||||||||||
| Total | 68,569 | 58,503 | 730,593 | 382,245 | 6,086 | ||||||||||||
Below detection limitReferences: a. Van Gemert [50], b. Nagata [26], c. Devos et al. [51], d. Ruth [52], e. Woodfield and Hall [53], f. Chemwatch [54], g. Evans et al. [55], h. U.S. Department of Labor [56], and i. Amoore and Hautala [57].*Mean similarity of mass spectra between actual experiment and library (NIST)
| Order | Compounds | SRD-0 | SRD-1 | SRD-3 | SRD-6 | SRD-9 | Thresholdsb (μg m−3) | Reference |
|---|---|---|---|---|---|---|---|---|
| [A] Concentration (μg m−3) | ||||||||
| 1 | Hydrogen sulfide | 0.02a | 0.02 | 0.02 | 0.02 | 0.02 | 24.8 | Schiffman et al. [58] |
| 2 | Sulfur dioxide | 0.03 | 0.03 | 0.03 | 0.03 | 0.03 | 1,635 | Nagata [26] |
| 3 | Methanethiol | 61.4 | 267 | 0.79 | 0.02 | 0.49 | 4.13 | Iowa State University [59] |
| 4 | Dimethyl sulfide | 0.02 | 3.83 | 0.91 | 0.02 | 0.02 | 7.60 | Nagata [26] |
| 5 | Dimethyl disulfide | 18.9 | 196 | 35.8 | 0.57 | 0.79 | 47.3 | Schiffman et al. [58] |
| 6 | Ammonia | 81.3 | 81.3 | 81.3 | 169 | 445 | 1,042 | Nagata [26] |
| [B] Odor activity value (OAV: concentration/ threshold) | ||||||||
| 1 | Hydrogen sulfide | |||||||
| 2 | Sulfur dioxide | |||||||
| 3 | Methanethiol | 14.9 | 64.6 | 0.19 | 0.12 | |||
| 4 | Dimethyl sulfide | 0.50 | 0.12 | |||||
| 5 | Dimethyl disulfide | 0.40 | 4.14 | 0.76 | 0.01 | 0.02 | ||
| 6 | Ammonia | 0.16 | 0.43 | |||||
aValues below detection limit are underlined (calculated as method detection limit)
| [A] Number of contrasting sources for the VOC with odor thresholds | ||||||
|---|---|---|---|---|---|---|
| No. of sources for odor thresholds | 0 (no data) | 1 | 2 | 3 | 4 | Total |
| No. of VOC | 73 | 35 | 31 | 12 | 1 | 152 |
| [B] The basic statistics of threshold values of VOCs (n = 79) | |||||||
|---|---|---|---|---|---|---|---|
| Statistical parameter | Mean | SD | CV b | Minimum | Maximum | Median | Sum |
| Minimum | 1,929 | 8,272 | 429 | 0.058 | 69,896 | 28 | 152,379 |
| Maximum | 7,576 | 19,199 | 253 | 0.088 | 84,140 | 227 | 598,518 |
| Geo mean | 3,077 | 9,552 | 310 | 0.088 | 69,896 | 123 | 243,085 |
aWe determined the 79 threshold values out of the 147 VOCs detected from strawberry samples from previous studies(references from Table 5S)bCV (coefficient of variation) = SD/mean × 100
| Groups | A. Ester | B. Alcohol | C. Aldehyde | D. Ketone | Sum of all groups b | ||||
|---|---|---|---|---|---|---|---|---|---|
| All data | Optimal fit a | All data | All data | Optimal fit | All data | Optimal fit | All data | Optimal fit | |
| Number of data | (n = 31) | (n = 28) | (n = 14) | (n = 9) | (n = 6) | (n = 8) | (n = 6) | (n = 62) | (n = 54) |
| [A] Slope c | |||||||||
| Min | −0.0237 | −0.0336 | −0.0357 | −0.0043 | −0.0086 | −0.0152 | −0.0171 | −0.0222 | −0.0256 |
| Max | −0.0296 | −0.0406 | −0.0507 | −0.0161 | −0.0187 | −0.0253 | −0.0366 | −0.0351 | −0.0415 |
| Geo mean | −0.0263 | −0.0367 | −0.0432 | −0.0098 | −0.0142 | −0.0197 | −0.0268 | −0.0286 | −0.0329 |
| [B] R2 | |||||||||
| Min | 0.1511 | 0.2842 | 0.5048 | 0.0231 | 0.4825 | 0.1360 | 0.3959 | 0.2171 | 0.2897 |
| Max | 0.1906 | 0.3363 | 0.8397 | 0.4396 | 0.8833 | 0.2113 | 0.9237 | 0.4260 | 0.5743 |
| Geo mean | 0.1743 | 0.3188 | 0.7164 | 0.1934 | 0.8730 | 0.1885 | 0.6547 | 0.3384 | 0.4473 |
| [C] p-value | |||||||||
| Min | 3.07E-02 | 3.49E-03 | 4.40E-03 | 6.96E-01 | 1.26E-01 | 3.69E-01 | 1.81E-01 | 1.35E-04 | 2.69E-05 |
| Max | 1.41E-02 | 1.22E-03 | 4.12E-06 | 5.16E-02 | 5.32E-03 | 2.52E-01 | 2.24E-03 | 9.00E-09 | 3.26E-11 |
| Geo mean | 1.94E-02 | 1.75E-03 | 1.35E-04 | 2.36E-01 | 6.33E-03 | 2.82E-01 | 5.12E-02 | 7.10E-07 | 3.25E-08 |
aAfter excluding outlying data pointsbSum of the four major VOC groups (Ester, Alcohol, Aldehyde, and Ketone)cResults of linear regression analysis between odor threshold and molecular weights: for this comparison, results are compared between minimum, maximum, and geometric mean of threshold values available from previous studies


References
- Du, X.; Plotto, A.; Baldwin, E.; Rouseff, R. Evaluation of volatiles from two subtropical strawberry cultivars using GC-olfactometry, GC-MS odor activity values, and sensory analysis. J. Agric. Food Chem. 2011, 59, 12569–12577. [Google Scholar]
- Ulrich, D.; Hoberg, E.; Rapp, A. Analysis of strawberry flavor-discrimination of aroma types by quantification of volatile compounds. Z. Lebensm. Unters. Forsch. A. 1997, 205, 218–223. [Google Scholar]
- Pickenhagen, W. Enantioselectivity in odor perception. ACS. Symp. Ser. 1989, 388, 151–157. [Google Scholar]
- Werkhoff, P.; Brennecke, S.; Bretschneider, W. Fortschritte bei der dhirospezifischen analyse natürlicher riech-und Aromastoffe. Ache. Mikrobiol. Technol. Lebensm. 1991, 13, 129–152. (in German). [Google Scholar]
- Werkhoff, P.; Brennecke, S.; Bretschneider, W.; Güntert, M.; Hopp, R.; Surburg, H. Chirospecific analysis in essential oil, fragrance and flavor research. Z. Lebensm. Unters. Forsch. 1993, 196, 307–328. [Google Scholar]
- Volatile Compounds in Foods and Beverages; Maarse, H., Ed.; Marcel Dekker: New York, NY, USA, 1991; pp. 1–39.
- Schieberle, P.; Hofmann, T. Evaluation of the character impact odorants in fresh strawberry juice by quantitative measurements and sensory studies on model mixtures. J. Agric. Food Chem. 1997, 45, 227–232. [Google Scholar]
- Larsen, M.; Poll, L.; Olsen, C.E. Evaluation of the aroma composition of some strawberry (FragariaananassaDuch) cultivars by use of odour threshold values. Z. Lebensm. Unters. Forsch. 1992, 195, 536–539. [Google Scholar]
- Lambert, Y.; Demazeau, G.; Largeteau, A.; Bouvier, J.-M. Changes in aromatic volatile composition of strawberry after high pressure treatment. Food Chem. 1999, 67, 7–16. [Google Scholar]
- Jetti, R.R.; Yang, E.; Kurnianta, A.; Finn, C.; Qian, M.C. Quantification of selected aroma-active compounds in strawberries by headspace solid-phase microextraction gas chromatography and correlation with sensory descriptive analysis. J. Food Sci. 2007, 72, 487–496. [Google Scholar]
- Li, H.; Tao, Y.-S.; Wang, H.; Zhang, L. Impact odorants of Chardonnay dry white wine from Changli County (China). Evaluation of fruit aroma quality: Comparison between gas chromatography-olfactometry (GC-O) and odour activity value (OAV) aroma patterns of strawberries. Eur. Food Res. Technol. 2008, 227, 287–292. [Google Scholar]
- Nuzzi, M.; Scalzo, R.L.; Testoni, A.; Rizzolo, A. Evaluation of fruit aroma quality: Comparison between gas chromatography-olfactometry (GC-O) and odour activity value (OAV) aroma patterns of strawberries. Food Anal. Methods 2008, 1, 270–282. [Google Scholar]
- Szulejko, J.E.; Kim, Y.-H.; Kim, K.-H. Prediction of response factors for the quantitation of volatile organic compounds based on effective carbon number (ECN) approach with TD/GC/QMS at 70 eV EI. in prep.
- Kim, Y.-H.; Kim, K.-H. A Statistical Estimation Approach for Quantitative Concentrations of “Compounds Lacking Authentic Standards/Surrogates (CLASS)” based on Linear Correlations between Directly Measured Detector Responses and Carbon Number (CN) of Different Functional Groups. Sci. World J. 2013. [Google Scholar] [CrossRef]
- Kim, Y.-H.; Kim, K.-H. Novel approach to test the relative recovery of liquid-phase standard in sorbent-tube analysis of gaseous volatile organic compounds. Anal. Chem. 2012, 84, 4126–4139. [Google Scholar]
- Lacey, R.E.; Redwine, J.S.; Parnell, C.B., Jr. Particulate matter and ammonia emission factors for tunnel-ventilated broiler production houses in the southern U.S. Trans. ASAE 2003, 46, 1203–1214. [Google Scholar]
- Jo, S.-H.; Kim, K.-H.; Shon, Z.-H.; Parker, D. Identification of control parameters for the sulfur gas storability with bag sampling methods. Anal. Chim. Acta. 2012, 738, 51–58. [Google Scholar]
- Scheiner, D. Determination of ammonia and Kjeldahl nitrogen by indophenol method. Water Res. 1976, 10, 31–36. [Google Scholar]
- Berg, B.R.; Abdullah, M.I. An automatic method for the determination of ammonia in sea water. Water Res. 1977, 11, 637–638. [Google Scholar]
- Kim, K.-H.; Park, S.-Y. A comparative analysis of malodor samples between direct (olfactometry) and indirect (instrumental) methods. Atmos. Environ. 2008, 42, 5061–5070. [Google Scholar]
- Forney, C.F.; Kalt, W.; Jordan, M.A. The composition of strawberry aroma is influenced by cultivar, maturity, and storage. HortScience 2000, 35, 1022–1026. [Google Scholar]
- Pyysalo, T.; Honkanen, E.; Hirvi, T. Volatiles of wild strawberries, Fragaria vesca L., Compared to those of cultivated berries, Fragaria X ananassa cv. Senga Sengana. J. Agric. Food Chem. 1979, 27, 19–22. [Google Scholar]
- Schreier, P. Quantitative composition of volatile constituents in cultivated strawberries, Fragariaananassa cv. Sengasengana, sengalitessa and sengagourmella. J. Sci. Food Agric. 1980, 31, 487–494. [Google Scholar]
- Douillard, C.; Guichard, E. The aroma of strawberry (Fragariaananassa): Characterization of some cultivars and influence of freezing. J. Sci. Food Agric. 1990, 50, 517–531. [Google Scholar]
- Leonardos, G.; Kendall, D.; Barnard, N. Odor threshold determinations of 53 odorant chemicals. J. Air Pollut. Control Ass. 1969, 19, 91–95. [Google Scholar]
- Nagata, Y. Measurement of odor threshold by triangle odor bag method. In Odor Measurement Review; Office of Odor, Noise and Vibration, Environmental Management Bureau, Ministry of Environment: Tokyo, Japan, 2003; pp. 118–127. (in Japanese) [Google Scholar]
- Rothe, M.; Thomas, B. Aromastoffe des brotes: Versuch einer auswertung chemischer geschmacksanalysen mit hilfe des schwellenwertes. Z. Lebensm. Unters. Forsch. 1963, 119, 302–310. (in German). [Google Scholar]
- Schulbach, K.F.; Rouseff, R.L.; Sims, C.A. Relating descriptive sensory analysis to gas chromatography/olfactometry ratings of fresh strawberries using partial least squares regression. J. Food Sci. 2004, 69, 273–277. [Google Scholar]
- Schieberle, P.; Hofmann, T. Evaluation of the character impact odorants in fresh strawberry juice by quantitative measurements and sensory studies on model mixtures. J. Agric. Food Chem. 1997, 45, 227–232. [Google Scholar]
- Aznar, M.; López, R.; Cacho, J.F.; Ferreira, V. Identification and quantification of impact odorants of aged red wines from Rioja. GC-olfactometry, quantitative GC-MS, and odor evaluation of HPLC Fractions. J. Agric. Food Chem. 2001, 49, 2924–2929. [Google Scholar]
- Buchbauer, G.; Jirovetz, L.; Nikiforov, A. Comparative investigation of essential clover flower oils from Austria using gas chromatography-flame ionization detection, gas chromatography-mass spectrometry, and gas chromatography-olfactometry. J. Agric. Food Chem. 1996, 44, 1827–1828. [Google Scholar]
- Cai, L.; Koziel, J.A.; Lo, Y.-C.; Hoff, S.J. Characterization of volatile organic compounds and odorants associated with swine barn particulate matter using solid-phase microextraction and gas chromatography-mass spectrometry-olfactometry. J. Chromatogr. A 2006, 1102, 60–72. [Google Scholar]
- Clausen, P.A.; Knudsen, H.N.; Larsen, K.; Kofoed-Sørensen, V.; Wolkoff, P. Use of thermal desorption gas chromatography-olfactometry/mass spectrometry for the comparison of identified and unidentified odor active compounds emitted from building products containing linseed oil. J. Chromatogr. A. 2008, 1210, 203–211. [Google Scholar]
- Larsen, M.; Poll, L. Odour thresholds of some important aroma compounds in strawberries. Z. Lebensm. Unters. Forsch. 1992, 195, 120–123. [Google Scholar]
- Semmelroch, P.; Grosch, W. Analysis of roasted coffee powders and brews by gas chromatography-olfactometry of headspace samples. Lebensmittel-Wissenschaft und-Technologie 1995, 28, 310–313. [Google Scholar]
- Komes, D.; Ulrich, D.; Lovric, T. Characterization of odor-active compounds in Croatian Rhine Riesling wine, subregion Zagorje. Eur. Food Res. Technol. 2006, 222, 1–7. [Google Scholar]
- Arora, G.; Cormier, F.; Lee, B. Analysis of odor-active volatiles in Cheddar cheese headspace by multidimensional GC/MS sniffing. J. Agric. Food Chem. 1995, 26, 187–191. [Google Scholar]
- Carpino, S.; Mallia, S. Consorzio Ricerca Filiera Lattiero-Casearia: Ragusa, Italy; Personal Communication.
- Kubícková, J.; Grosch, W. Evaluation of potent odorants of Camembert cheese by dilution and concentration techniques. Int. Dairy J. 1997, 7, 65–70. [Google Scholar]
- Kubícková, J.; Grosch, W. Evaluation of flavor compounds of Camembert cheese. Int. Dairy J. 1998, 8, 11–16. [Google Scholar]
- Le Quéré, J.L.; Septier, C.; Demaiziéres, D.; Salles, C. Identification and Sensory Evaluation of the Character-Impact Compounds of Goat Cheese Flavor. Proceedings of the 8th Weurman Flavour Research Symposium, Reading, UK, 23–26 July 1996; pp. 325–330.
- Moio, L.; Addeo, F. Grana Padano cheese aroma. J. Dairy Res. 1998, 65, 317–333. [Google Scholar]
- Moio, L.; Dekimpe, J.; Etiévant, P.X.; Addeo, F. Volatile flavor compounds of water buffalo Mozzarella cheese. Ital. J. Food Sci. 1993, 5, 57–68. [Google Scholar]
- Moio, L.; Piombino, P.; Addeo, F. Odour-Impact compounds in Gorgonzola cheese. J. Dairy Res. 2000, 67, 273–285. [Google Scholar]
- Rychlik, M.; Bosset, J.O. Flavor and off-flavour compounds of Swiss Gruyére cheese. Evaluation of potent odorants. Int. Dairy J. 2001, 11, 895–901. [Google Scholar]
- Christensen, K.R.; Reineccius, G.A. Aroma extract dilution analysis of aged Cheddar cheese. J. Food Sci. 1995, 60, 218–220. [Google Scholar]
- Milo, C.; Reineccius, G.A. Identification and quantification of potent odorants in regular-fat and low-fat mild Cheddar cheese. J. Agric. Food Chem. 1997, 45, 3590–3594. [Google Scholar]
- Preininger, M.; Grosch, W. Evaluation of key odorants of the neutral volatiles of Emmentaler cheese by the calculation of odour activity values. LWT-Food Sci & Technol. 1994, 27, 237–244. [Google Scholar]
- Preininger, M.; Rychlik, M.; Grosch, W. Potent odorants of the neutral volatile fraction of Swiss cheese (Emmentaler). Develop. Food Sci. 1994, 35, 267–270. [Google Scholar]
- van Gemert, L.J. Compilations of Odour Threshold Values in Air, Water and Other Media; Oliemans Punter & Partners: Huizen, the Netherlands, 2003. [Google Scholar]
- Devos, M.; Patte, F.; Rouault, J.; Laffort, P.; van Gemert, L.J. Standardized Human Olfactory Thresholds; IRL Press at Oxford University Press: New York, NY, USA, 1990. [Google Scholar]
- Ruth, J.H. Odor thresholds and irritation levels of several chemical substances: A review. Am. Ind. Hyg. Assoc. J. 1986, 47, 142–151. [Google Scholar]
- Woodfield, M.; Hall, D. Odour Measurement and Control—An Update; AEA Technology: Abingdon, Oxfordshire, UK, 1994. [Google Scholar]
- Duerksen-Hughes, P.J.; Yang, J.; Ozcan, O. p53 induction as a genotoxic test for twenty-five chemicals undergoing in vivo carcinogenicity testing. Enviro Health Pers. 1999, 107, 805. [Google Scholar]
- Chicago Evans, C.D.; Moser, H.A.; List, C.D. Odor and flavor responses to additives in edible oils. J. Am. Oil Chem. Soc. 1971, 48, 495–498. [Google Scholar]
- Occupational Health Guideline for Ethyl Ether; Public Health Service, Centers for Disease Control, National Institute for Occupational Safety and Health (NIOSH): Atlanta, GA, USA, 1978; pp. 1–5.
- Amoore, J.E.; Hautala, E. Odor as an aid to chemical safety: odor thresholds compared with threshold limit values and volatilities for 214 industrial chemicals in air and water dilution. J. Appl. Toxicol. 1983, 3, 272–290. [Google Scholar]
- Schiffman, S.S.; Bennett, J.L.; Raymer, J.H. Quantification of odors and odorants from swine operations in North Carolina. Agr. Forest Meteorol. 2001, 108, 213–240. [Google Scholar]
- The Science of Smell Part 1: Odor Perception and Physiological Response. Available online: http://www.extension.iastate.edu/Publications/pm1963A.pdf (accessed on 1 May 2013).


| Sample Code | Functional Group | Total | |||||
|---|---|---|---|---|---|---|---|
| A. Ester | B. Alcohol | C. Aldehyde | D. Ketone | E. Fatty Acid | F.etc. | ||
| [A] Frequency (Number of chemical compounds for each functional group) | |||||||
| SRD-0 | 47 | 7 | 3 | 6 | 3 | 15 | 81 |
| SRD-1 | 38 (34) a | 5 (4) | 1 (1) | 4 (4) | 1 (1) | 12 (7) | 61(51) |
| SRD-3 | 31 (24) | 8 (3) | 3 (1) | 5 (2) | 1 (1) | 7 (5) | 55 (36) |
| SRD-6 | 18 (14) | 17 (7) | 8 (2) | 5 (2) | 2 (1) | 15 (3) | 65 (29) |
| SRD-9 | 4 (3) | 16 (16) | 8 (7) | 4 (4) | 2 (1) | 21 (8) | 55 (39) |
| Total | 61 | 21 | 11 | 9 | 5 | 40 | 147 |
| [B] Summed concentration (ug m−3) | |||||||
| SRD-0 | 52,648 | 140 | 2,918 | 6,251 | 6,390 | 221 | 68,569 |
| SRD-1 | 42,713 | 364 | 2,959 | 7,649 | 4,703 | 115 | 58,503 |
| SRD-3 | 705,447 | 1,078 | 19,054 | 589 | 4,319 | 105 | 730,593 |
| SRD-6 | 533 | 379,789 | 1,338 | 35.0 | 516 | 35.1 | 382,245 |
| SRD-9 | 45.7 | 4,658 | 1,022 | 73.9 | 212 | 73.4 | 6,086 |
| Total | 801,386 | 386,029 | 27,292 | 14,598 | 16,139 | 550 | 1,245,995 |
aNo. of compounds detected consistently from the previous sample is given in the parenthesis: 33 out of 37 compounds in SRD-1 were for example, also seen in SRD-0.
| Order | Compounds | Concentration | Relative composition a (RC: %) | |||||||||||||
|---|---|---|---|---|---|---|---|---|---|---|---|---|---|---|---|---|
| ppb | μgm−3 | |||||||||||||||
| SRD-0 | SRD-1 | SRD-3 | SRD-6 | SRD-9 | SRD-0 | SRD-1 | SRD-3 | SRD-6 | SRD-9 | SRD-0 | SRD-1 | SRD-3 | SRD-6 | SRD-9 | ||
| A. Ester | ||||||||||||||||
| 1 | Methyl acetate | 3,949 | 3,875 | 71,077 | 1.57 | 0.75 | 11,945 | 11,720 | 214,987 | 4.76 | 2.28 | 17.4 | 20.0 | 29.4 | 1.25E-03 | 0.04 |
| 2 | Ethyl acetate | 4,793 | 4,277 | 134,969 | 130 | 11.8 | 17,240 | 15,384 | 485,476 | 467 | 42.5 | 25.1 | 26.3 | 66.4 | 0.12 | 0.70 |
| 3 | Methyl propionate | 40.8 | 51.0 | 23.6 | 0.17 | 8.75E-03 | 147 | 183 | 85.0 | 0.63 | 3.15E-02 | 0.21 | 0.31 | 0.01 | 1.64E-04 | |
| 4 | S-Methyl thioacetate | 94.2 | 129.3 | 3.07E-02 | 3.07E-02 | 3.07E-02 | 346 | 476 | 1.13E-01 | 1.13E-01 | 1.13E-01 | 0.51 | 0.81 | |||
| 5 | Isopropyl acetate | 52.8 | 16.7 | 27.5 | 4.95E-03 | 4.95E-03 | 220 | 69.5 | 114 | 2.06E-02 | 2.06E-02 | 0.32 | 0.12 | 0.02 | ||
| 6 | Ethyl propionate | 52.7 | 5.19E-03 | 53.5 | 5.19E-03 | 5.19E-03 | 220 | 2.17E-02 | 223 | 2.17E-02 | 2.17E-02 | 0.32 | 0.03 | |||
| 7 | Propyl acetate | 5.19E-03 | 5.19E-03 | 185 | 0.72 | 5.19E-03 | 2.17E-02 | 2.17E-02 | 769 | 3.02 | 2.17E-02 | 0.11 | 7.90E-04 | |||
| 8 | Methyl butyrate | 1,194 | 1,384 | 88.8 | 0.47 | 5.19E-03 | 4,977 | 5,772 | 370 | 1.95 | 2.17E-02 | 7.26 | 9.9 | 0.05 | 5.10E-04 | |
| 9 | Methyl 2-methylbutanoate | 21.8 | 21.7 | 13.2 | 1.08 | 3.35E-03 | 103 | 103 | 62.7 | 5.14 | 1.59E-02 | 0.15 | 0.18 | 0.01 | 1.35E-03 | |
| 10 | Isobutyl acetate | 9.11 | 7.00 | 88.9 | 1.86 | 3.35E-03 | 43.2 | 33.2 | 421 | 8.80 | 1.59E-02 | 0.06 | 0.06 | 0.06 | 2.30E-03 | |
| 11 | Methyl isovalerate | 54.8 | 56.9 | 7.78 | 3.35E-03 | 3.35E-03 | 260 | 270 | 36.9 | 1.59E-02 | 1.59E-02 | 0.38 | 0.46 | 0.01 | ||
| 12 | Ethyl butyrate | 1,537 | 1,142 | 171 | 1.50 | 3.48E-03 | 7,290 | 5,415 | 812 | 7.10 | 1.65E-02 | 10.6 | 9.3 | 0.11 | 1.86E-03 | |
| 13 | Butyl acetate | 34.2 | 36.5 | 26.4 | 0.05 | 3.49E-03 | 162 | 173 | 125 | 0.24 | 1.65E-02 | 0.24 | 0.30 | 0.02 | 6.19E-05 | |
| 14 | Isopropyl butyrate | 30.7 | 25.9 | 2.43E-03 | 2.43E-03 | 2.43E-03 | 163 | 138 | 1.29E-02 | 1.29E-02 | 1.29E-02 | 0.24 | 0.24 | |||
| 15 | Ethyl 2-methylbutyrate | 63.0 | 23.8 | 66.3 | 3.13 | 2.43E-03 | 335 | 126 | 352 | 16.6 | 1.29E-02 | 0.49 | 0.22 | 0.05 | 4.35E-03 | |
| 16 | Ethyl isovalerate | 142 | 67.2 | 36.1 | 0.70 | 2.43E-03 | 753 | 357 | 192 | 3.73 | 1.29E-02 | 1.10 | 0.61 | 0.03 | 9.76E-04 | |
| 17 | Isoamyl acetate | 81.3 | 69.1 | 165 | 1.21 | 2.43E-03 | 432 | 367 | 878 | 6.43 | 1.29E-02 | 0.63 | 0.63 | 0.12 | 1.68E-03 | |
| 18 | Ethyl valerate | 7.31 | 1.73 | 2.51E-03 | 2.51E-03 | 2.51E-03 | 38.8 | 9.22 | 1.33E-02 | 1.33E-02 | 1.33E-02 | 0.06 | 0.02 | |||
| 19 | Methyl hexanoate | 469 | 185 | 11.4 | 2.51E-03 | 2.51E-03 | 2,492 | 982 | 60.3 | 1.33E-02 | 1.33E-02 | 3.63 | 1.68 | 0.01 | ||
| 20 | trans-2-Hexenyl acetate | 38.6 | 1.78 | 1.90E-03 | 1.90E-03 | 1.90E-03 | 224 | 10.4 | 1.11E-02 | 1.11E-02 | 1.11E-02 | 0.33 | 0.02 | |||
| 21 | Ethyl hexanoate | 725 | 137 | 20.8 | 0.03 | 1.90E-03 | 4,270 | 808 | 123 | 0.16 | 1.12E-02 | 6.23 | 1.38 | 0.02 | 4.28E-05 | |
| 22 | Hexyl acetate | 110 | 25.5 | 4.70 | 1.90E-03 | 1.90E-03 | 647 | 150 | 27.7 | 1.12E-02 | 1.12E-02 | 0.94 | 0.26 | 3.79E-03 | ||
| 23 | Methyl octanoate | 5.84 | 0.88 | 1.49E-03 | 1.49E-03 | 1.49E-03 | 37.7 | 5.71 | 9.64E-03 | 9.64E-03 | 9.64E-03 | 0.06 | ||||
| ΣConcentration or its RC (ester) | 52,346 | 42,553 | 705,116 | 526 | 44.7 | 76.3 | 72.7 | 96.5 | 0.14 | 0.74 | ||||||
| B. Alcohol | ||||||||||||||||
| 1 | Ethyl alcohol | 3.72E-02 | 3.72E-02 | 309 | 48,685 | 1,417 | 7.00E-02 | 7.00E-02 | 580 | 91,537 | 2,665 | 0.08 | 23.9 | 43.8 | ||
| 2 | Isopropyl Alcohol | 8.76 | 4.58 | 45.3 | 92.8 | 278 | 21.5 | 11.2 | 111 | 228 | 681 | 0.03 | 0.02 | 0.02 | 0.06 | 11.2 |
| 3 | n-Propyl alcohol | 1.42E-02 | 1.42E-02 | 30.4 | 46.6 | 36.1 | 3.49E-02 | 3.49E-02 | 74.5 | 114 | 88.5 | 0.01 | 0.03 | 1.45 | ||
| 4 | Isobutyl alcohol | 7.01E-03 | 7.01E-03 | 31.8 | 95,136 | 320 | 2.12E-02 | 2.12E-02 | 96.3 | 287,758 | 967 | 0.01 | 75.3 | 15.9 | ||
| 5 | Isopropenylethyl alcohol | 4.86E-03 | 4.86E-03 | 4.86E-03 | 2.41 | 4.47 | 1.71E-02 | 1.71E-02 | 1.71E-02 | 8.48 | 15.7 | 2.22E-03 | 0.26 | |||
| 6 | 3-Methyl-1-butanol | 1.09 | 1.28 | 50.7 | 26.9 | 43.3 | 3.91 | 4.61 | 182 | 96.9 | 156 | 0.01 | 0.01 | 0.02 | 0.03 | 2.56 |
| 7 | 2-Methyl-1-butanol | 4.65E-03 | 4.65E-03 | 4.65E-03 | 9.48 | 19.6 | 1.67E-02 | 1.67E-02 | 1.67E-02 | 34.1 | 70.5 | 0.01 | 1.16 | |||
| 8 | n-Pentanol | 4.84E-03 | 4.84E-03 | 4.84E-03 | 0.99 | 0.86 | 1.74E-02 | 1.74E-02 | 1.74E-02 | 3.57 | 3.10 | 9.33E-04 | 0.05 | |||
| 9 | 1-Chloro-2-propanol | 20.0 | 80.3 | 8.91E-03 | 8.91E-03 | 8.91E-03 | 77.0 | 309 | 3.42E-02 | 3.42E-02 | 3.42E-02 | 0.11 | 0.53 | |||
| 10 | n-Hexanol | 0.52 | 3.34E-03 | 1.16 | 0.15 | 1.08 | 2.17 | 1.39E-02 | 4.83 | 0.63 | 4.51 | 3.16E-03 | 6.61E-04 | 1.65E-04 | 0.07 | |
| 11 | Linalool | 5.14 | 5.08 | 1.17E-03 | 1.17E-03 | 1.17E-03 | 32.4 | 32.0 | 7.34E-03 | 7.34E-03 | 7.34E-03 | 0.05 | 0.05 | |||
| ΣConcentration or its RC (alcohol) | 137 | 356 | 1,049 | 379,781 | 4,651 | 0.20 | 0.61 | 0.14 | 99.4 | 76.4 | ||||||
| C. Aldehyde | ||||||||||||||||
| 1 | Acetaldehyde | 1,618 | 1,646 | 10,584 | 730 | 540 | 2,909 | 2,959 | 19,035 | 1313 | 971 | 4.24 | 5.06 | 2.61 | 0.34 | 16.0 |
| 2 | Allyl aldehyde (Acrolein) | 8.24E-02 | 8.24E-02 | 8.24E-02 | 5.08 | 6.90 | 1.89E-01 | 1.89E-01 | 1.89E-01 | 11.6 | 15.8 | 3.04E-03 | 0.26 | |||
| 3 | Methylacryl aldehyde | 1.59E-02 | 1.59E-02 | 1.59E-02 | 1.80 | 3.33 | 4.54E-02 | 4.54E-02 | 4.54E-02 | 5.14 | 9.52 | 1.34E-03 | 0.16 | |||
| 4 | Isobutyraldehyde | 1.46E-02 | 1.46E-02 | 1.46E-02 | 0.24 | 3.80 | 4.30E-02 | 4.30E-02 | 4.30E-02 | 0.71 | 11.2 | 1.85E-04 | 0.18 | |||
| 5 | Isovaleraldehyde | 8.52E-03 | 8.52E-03 | 8.52E-03 | 1.03 | 2.45 | 2.99E-02 | 2.99E-02 | 2.99E-02 | 3.60 | 8.62 | 9.43E-04 | 0.14 | |||
| ΣConcentration or its RC (aldehyde) | 2,909 | 2,959 | 19,035 | 1,334 | 1,016 | 4.24 | 5.06 | 2.61 | 0.35 | 16.7 | ||||||
| D. Ketone | ||||||||||||||||
| 1 | Acetone | 2,514 | 3,131 | 224 | 7.35 | 28.0 | 5,960 | 7,422 | 532 | 17.4 | 66.5 | 8.69 | 12.7 | 0.07 | 4.56E-03 | 1.09 |
| 2 | Methyl ethyl ketone | 1.38E-02 | 1.38E-02 | 1.38E-02 | 1.15 | 1.35 | 4.05E-02 | 4.05E-02 | 4.05E-02 | 3.39 | 3.96 | 8.86E-04 | 0.07 | |||
| 3 | Methyl n-propyl ketone | 54.0 | 47.1 | 7.55E-03 | 7.55E-03 | 7.55E-03 | 190 | 165 | 2.66E-02 | 2.66E-02 | 2.66E-02 | 0.28 | 0.28 | |||
| 4 | Methyl Isobutyl Ketone | 4.62 | 7.50 | 1.11 | 4.11E-03 | 4.11E-03 | 18.9 | 30.7 | 4.53 | 1.68E-02 | 1.68E-02 | 0.03 | 0.05 | 6.19E-04 | ||
| 5 | Methyl amyl ketone | 5.64 | 6.52 | 3.23E-03 | 0.51 | 0.61 | 26.3 | 30.4 | 1.50E-02 | 2.36 | 2.85 | 0.04 | 0.05 | 6.18E-04 | 0.05 | |
| ΣConcentration or its RC (ketone) | 6,195 | 7,649 | 536 | 23.2 | 73.3 | 9.04 | 13.1 | 0.07 | 6.06E-03 | 1.20 | ||||||
| E. Fatty acid | ||||||||||||||||
| 1 | Acetic acid | 2,519 | 1,918 | 1,761 | 210 | 86.3 | 6,177 | 4,703 | 4,319 | 514 | 212 | 9.01 | 8.04 | 0.59 | 1.35E-01 | 3.48 |
| 2 | 2-PROPYNOIC ACID | 69.6 | 2.35E-02 | 2.35E-02 | 2.35E-02 | 2.35E-02 | 199.3 | 6.71E-02 | 6.71E-02 | 6.71E-02 | 6.71E-02 | 0.29 | ||||
| ΣConcentration or its RC (fatty acid) | 6,376 | 4,703 | 4,319 | 514 | 212 | 9.30 | 8.04 | 0.59 | 1.35E-01 | 3.48 | ||||||
| E. etc. | ||||||||||||||||
| 1 | n-Pentane | 12.1 | 6.63E-03 | 6.63E-03 | 0.29 | 2.20 | 35.7 | 1.95E-02 | 1.95E-02 | 0.86 | 6.48 | 0.05 | 2.26E-04 | 0.11 | ||
| 2 | Ethyl ether | 7.28E-03 | 7.28E-03 | 0.70 | 0.41 | 1.45 | 2.20E-02 | 2.20E-02 | 2.12 | 1.23 | 4.38 | 2.90E-04 | 3.21E-04 | 0.07 | ||
| 3 | 1,3-Hexadiene | 25.0 | 1.77 | 4.55E-03 | 4.55E-03 | 4.55E-03 | 83.9 | 5.94 | 1.53E-02 | 1.53E-02 | 1.53E-02 | 0.12 | 0.01 | |||
| 4 | n-Hexane | 1.21 | 1.02 | 1.02 | 4.33E-03 | 8.03 | 4.27 | 3.60 | 3.57 | 1.52E-02 | 28.2 | 0.01 | 0.01 | 4.89E-04 | 0.46 | |
| 5 | Toluene | 3.14E-03 | 3.14E-03 | 3.14E-03 | 3.14E-03 | 2.48 | 1.18E-02 | 1.18E-02 | 1.18E-02 | 1.18E-02 | 9.32 | 0.15 | ||||
| 6 | Styrene | 10.0 | 12.0 | 19.4 | 3.03 | 1.09 | 42.7 | 51.0 | 82.5 | 12.9 | 4.64 | 0.06 | 0.09 | 0.01 | 3.36E-03 | 0.08 |
| 7 | 2,5-Dimethyl-4-methoxy-3(2H)-furanone | 1.42 | 1.96E-03 | 1.96E-03 | 2.66 | 0.88 | 8.23 | 1.14E-02 | 1.14E-02 | 15.5 | 5.08 | 0.01 | 4.04E-03 | 0.08 | ||
| ΣConcentration or its RC (etc) | 175 | 60.5 | 88.2 | 30.4 | 58.1 | 0.25 | 0.10 | 0.01 | 0.01 | 0.96 | ||||||
| ΣConcentration or its RC (all) | 68,139 | 58,281 | 730,144 | 382,209 | 6,055 | 99.4 | 99.6 | 99.9 | 99.99 | 99.5 | ||||||
aRC = [Mass concentration (‘i’th compound) / mass concentration (sum) at a given exp day] s100bValues below detection limit (BDL) are underlined (calculated as method detection limit)
| Order | Compounds | OAV (concentration/ threshold) | Relative proportion * (RP, %) | Odor type / descriptor | ||||||||
|---|---|---|---|---|---|---|---|---|---|---|---|---|
| SRD-0 | SRD-1 | SRD-3 | SRD-6 | SRD-9 | SRD-0 | SRD-1 | SRD-3 | SRD-6 | SRD-9 | |||
| A. Ester | ||||||||||||
| 1 | Methyl acetate | 0.64 | 0.63 | 11.52 | 2.55E-04 | 1.22E-04 | 4.93E-03 | 8.98E-03 | 0.46 | 1.30E-04 | 1.66E-03 | |
| 2 | Ethyl acetate | 1.82 | 1.63 | 51.3 | 0.05 | 4.49E-03 | 0.01 | 0.02 | 2.03 | 0.03 | 0.06 | sweet fruita, grapea, contact gluei, fruityl, pinapplel |
| 3 | Methyl propionate | 0.42 | 0.52 | 0.24 | 1.78E-03 | 3.21E-03 | 0.01 | 0.01 | 9.08E-04 | |||
| 4 | S-Methyl thioacetate | 58.6 | 80.4 | 0.45 | 1.15 | sulfurousa, cheesya | ||||||
| 5 | Isopropyl acetate | 0.02 | 0.01 | 0.01 | 1.70E-04 | 9.93E-05 | 4.53E-04 | |||||
| 6 | Ethyl propionate | 7.53 | 7.65 | 0.06 | 0.30 | |||||||
| 7 | Propyl acetate | 0.19 | 7.54E-04 | 0.01 | 3.85E-04 | |||||||
| 8 | Methyl butyrate | 168 | 195 | 12.5 | 0.07 | 1.30 | 2.79 | 0.50 | 0.03 | applea, fruityb, c, d, i, cheesei | ||
| 9 | Methyl 2-methylbutanoate | 218 | 217 | 132 | 10.86 | 1.68 | 3.10 | 5.25 | 5.54 | green applea, fruitya, sweeta | ||
| 10 | Isobutyl acetate | 0.02 | 0.01 | 0.19 | 3.88E-03 | 1.47E-04 | 2.09E-04 | 0.01 | 1.98E-03 | strawberrye, light fruityi, floweryi | ||
| 11 | Methyl isovalerate | 24.9 | 25.9 | 3.54 | 0.19 | 0.37 | 0.14 | fruitya, applea, pineapplea | ||||
| 12 | Ethyl butyrate | 6,160 | 4,576 | 686 | 6.00 | 47.5 | 65.4 | 27.2 | 3.06 | fruitya, b, c, d, e, i, sweeta, b, i, pineapplea, ester-likeb, strawberrye, cheesei, fruity sweetm, p, r, u | ||
| 13 | Butyl acetate | 0.18 | 0.19 | 0.14 | 2.56E-04 | 1.35E-03 | 2.68E-03 | 0.01 | 1.31E-04 | fruitya, bananaa, applei, gluei | ||
| 14 | Isopropyl butyrate | 4.95 | 4.18 | 0.04 | 0.06 | fruitya, sweeta, pineapplea | ||||||
| 15 | Ethyl 2-methylbutyrate | 942 | 356 | 993 | 46.9 | 7.26 | 5.08 | 39.3 | 23.9 | soura, cheesya, sweatya, fruityd | ||
| 16 | Ethyl isovalerate | 1,592 | 755 | 405 | 7.88 | 12.3 | 10.8 | 16.0 | 4.02 | fruitya, d, applea, pineapplea, sweet fruite | ||
| 17 | Isoamyl acetate | 21.4 | 18.2 | 43.5 | 0.32 | 0.16 | 0.26 | 1.72 | 0.16 | |||
| 18 | Ethyl valerate | 21.9 | 5.19 | 0.17 | 0.07 | |||||||
| 19 | Methyl hexanoate | 30.1 | 11.9 | 0.73 | 0.23 | 0.17 | 0.03 | fruitya, b, i, pineapplea, ester-likeb | ||||
| 20 | trans-2-Hexenyl acetate | 0.90 | 0.04 | 0.01 | 0.001 | |||||||
| 21 | Ethyl hexanoate | 3,608 | 683 | 103.7 | 0.14 | 27.8 | 9.77 | 4.11 | 0.07 | fruitya, b, i, sweeta, pineapplea, ester-likeb, green appleb, fruit gumi | ||
| 22 | Hexyl acetate | 54.7 | 12.7 | 2.34 | 0.42 | 0.18 | 0.09 | fruitya, i, green applea, bananaa, i, applei, peari | ||||
| 23 | Methyl octanoate | 0.16 | 0.02 | 1.23E-03 | 3.45E-04 | Sweet fruitye | ||||||
| ΣConcentration (ester) | 12,917 | 6,942 | 2,453 | 72.2 | 4.61E-03 | 99.6 | 99.3 | 97.2 | 36.8 | 0.06 | ||
| B. Alcohol | ||||||||||||
| 1 | Ethyl alcohol | 0.01 | 1.69 | 0.05 | 4.25E-04 | 0.86 | 0.67 | |||||
| 2 | Isopropyl Alcohol | 3.37E-04 | 1.76E-04 | 1.74E-03 | 3.57E-03 | 0.01 | 2.60E-06 | 2.52E-06 | 6.90E-05 | 1.82E-03 | 0.14 | fruityl |
| 3 | n-Propyl alcohol | 0.01 | 0.02 | 0.02 | 5.02E-04 | 0.01 | 0.20 | Sweet (candy)l | ||||
| 4 | Isobutyl alcohol | 0.04 | 114 | 0.38 | 1.52E-03 | 58.3 | 5.22 | Plasticl, badl | ||||
| 5 | Isopropenylethyl alcohol | 9.64E-04 | 1.79E-03 | 4.92E-04 | 0.02 | |||||||
| 6 | 3-Methyl-1-butanol | 0.02 | 0.03 | 1.13 | 0.60 | 0.97 | 1.87E-04 | 4.10E-04 | 0.04 | 0.31 | 13.2 | bittere, harshe, k, Chemicalk, stalek, Alcoholicr, greenr, Fusel oils, pomaces |
| 7 | 2-Methyl-1-butanol | 0.23 | 0.48 | 0.12 | 6.49 | Alcoholics, greens, Fusel oilt, pomacet | ||||||
| 8 | n-Pentanol | 2.12E-03 | 1.84E-03 | 0.001 | 0.02 | |||||||
| 9 | 1-Chloro-2-propanol | 0.02 | 0.08 | 1.54E-04 | 1.15E-03 | |||||||
| 10 | n-Hexanol | 0.01 | 0.03 | 3.45E-03 | 0.02 | 9.16E-05 | 1.05E-03 | 1.76E-03 | 0.34 | winey-fruityf, Greeni, k, r, heavyi, nutsi, grassk, freshk | ||
| 11 | Linalool | 27.4 | 27.0 | 0.21 | 0.39 | citrusa, fruitya, e, florala, floweryb, k, sweetb, lemonc, floral-lavenderf, rosek | ||||||
| ΣConcentration or its RC (alcohol) | 27.4 | 27.1 | 1.22 | 117 | 1.94 | 0.21 | 0.39 | 0.05 | 59.6 | 26.3 | ||
| C. Aldehyde | ||||||||||||
| 1 | Acetaldehyde | 8.70 | 8.85 | 56.9 | 3.92 | 2.90 | 6.70E-02 | 0.13 | 2.25 | 2.00 | 39.4 | green applea, fruityj, pungentj, chemicalk, alcoholk, aldehydek, acetaldehydek, pungentk, v, greenn, o, t, sweetv |
| 2 | Allyl aldehyde (Acrolein) | 0.03 | 0.04 | 1.49E-02 | 0.54 | |||||||
| 3 | Methylacryl aldehyde | 0.21 | 0.39 | 0.11 | 5.31 | |||||||
| 4 | Isobutyraldehyde | 0.01 | 0.09 | 3.01E-03 | 1.27 | greenl, maltyl, floralt | ||||||
| 5 | Isovaleraldehyde | 0.46 | 1.09 | 0.23 | 14.9 | greenn, o, maltyn, o | ||||||
| ΣConcentration or its RC (aldehyde) | 8.70 | 8.85 | 56.9 | 4.63 | 4.52 | 6.70E-02 | 0.13 | 2.25 | 2.36 | 61.4 | ||
| D. Ketone | ||||||||||||
| 1 | Acetone | 0.06 | 0.07 | 5.34E-03 | 1.75E-04 | 6.68E-04 | 4.61E-04 | 1.07E-03 | 2.12E-04 | 8.93E-05 | 9.06E-03 | aldehydicg, wood pulpl, hayl |
| 2 | Methyl ethyl ketone | 1.48E-04 | 1.73E-04 | 7.56E-05 | 2.35E-03 | Butterh, sweeth, chocolateh, Butterscotchl | ||||||
| 3 | Methyl n-propyl ketone | 0.03 | 0.03 | 2.69E-04 | 4.34E-04 | thinnerb, acetoneb, kerosenei, solventsi, orange peelq, sweetw, x, fruityw, x | ||||||
| 4 | Methyl Isobutyl Ketone | 0.01 | 0.01 | 2.06E-03 | 6.63E-05 | 2.00E-04 | 8.17E-05 | |||||
| 5 | Methyl amyl ketone | 0.04 | 0.05 | 3.60E-03 | 4.34E-03 | 3.08E-04 | 6.61E-04 | 1.83E-03 | 0.06 | meatyb, danish blue cheesei, greent, Animalsr, bluer, cheeser | ||
| ΣConcentration or its RC (ketone) | 0.143 | 0.165 | 7.40E-03 | 3.92E-03 | 5.18E-03 | 1.10E-03 | 2.36E-03 | 2.93E-04 | 2.00E-03 | 0.07 | ||
| E. Fatty acid | ||||||||||||
| 1 | Acetic acid | 17.37 | 13.23 | 12.15 | 1.45 | 0.60 | 1.34E-01 | 0.19 | 0.48 | 0.74 | 8.08 | sourd, vinagere, i, k |
| 2 | 2-PROPYNOIC ACID | 0.74 | 5.71E-03 | |||||||||
| ΣConcentration or its RC (fatty acid) | 18.1 | 13.2 | 12.1 | 1.45 | 0.60 | 0.14 | 0.19 | 0.48 | 0.74 | 8.08 | ||
| E.etc. | ||||||||||||
| 1 | n-Pentane | 3.84E-04 | 9.29E-06 | 6.97E-05 | 2.96E-06 | 4.74E-06 | 9.46E-04 | |||||
| 2 | Ethyl ether | 2.12E-03 | 1.23E-03 | 4.39E-03 | 8.40E-05 | 6.26E-04 | 0.06 | |||||
| 3 | 1,3-Hexadiene | 0.01 | 8.86E-04 | 9.65E-05 | 1.27E-05 | |||||||
| 4 | n-Hexane | 5.55E-05 | 4.67E-05 | 4.64E-05 | 3.67E-04 | 4.28E-07 | 6.68E-07 | 1.84E-06 | 0.005 | |||
| 5 | Toluene | 1.60E-03 | 0.02 | |||||||||
| 6 | Styrene | 0.29 | 0.34 | 0.55 | 0.09 | 0.03 | 2.21E-03 | 0.00 | 0.02 | 0.04 | 0.42 | |
| 2,5-Dimethyl-4-methoxy-3(2H)-furanone | ||||||||||||
| ΣConcentration or its RC (etc) | 0.73 | 0.34 | 0.56 | 0.90 | 0.31 | 0.01 | 0.00 | 0.02 | 0.46 | 4.15 | ||
| ΣConcentration or its RC (all) | 12,972 | 6,992 | 2,524 | 196 | 7.37 | 100 | 100 | 100 | 100 | 100 | ||
*RP = [OAV (n) / OAV (sum of main VOCs) at the exp day] x 100References:aDu et al. [1],bUlrich et al. [2],cSchulbach et al. [28],dSchieberle and Hofmann [29],eAznar et al. [30],fBuchbauer et al. [31],gCai et al. [32],hClausen et al. [33],iLarsen and Poll [34],jSemmelroch and Grosch (1995) [35],kKomes et al. [36],lArora et al. [37],mCarpino and Mallia [38],nKubck ova and Grosch [39],oKubícková and Grosch [40],pLe Quéré et al. [41],qMoio and Addeo [42],rMoio et al. [43],sMoio et al. [44],tRychlik and Bosset [45],uChristensen and Reineccius [46],vMilo and Reineccius [47],wPreininger and Grosch [48],xPreininger et al. [49]
© 2013 by the authors; licensee MDPI, Basel, Switzerland. This article is an open access article distributed under the terms and conditions of the Creative Commons Attribution license (http://creativecommons.org/licenses/by/3.0/).
Share and Cite
Kim, Y.-H.; Kim, K.-H.; Szulejko, J.E.; Parker, D. Quantitative Analysis of Fragrance and Odorants Released from Fresh and Decaying Strawberries. Sensors 2013, 13, 7939-7978. https://doi.org/10.3390/s130607939
Kim Y-H, Kim K-H, Szulejko JE, Parker D. Quantitative Analysis of Fragrance and Odorants Released from Fresh and Decaying Strawberries. Sensors. 2013; 13(6):7939-7978. https://doi.org/10.3390/s130607939
Chicago/Turabian StyleKim, Yong-Hyun, Ki-Hyun Kim, Jan E. Szulejko, and David Parker. 2013. "Quantitative Analysis of Fragrance and Odorants Released from Fresh and Decaying Strawberries" Sensors 13, no. 6: 7939-7978. https://doi.org/10.3390/s130607939