Array of Hall Effect Sensors for Linear Positioning of a Magnet Independently of Its Strength Variation. A Case Study: Monitoring Milk Yield during Milking in Goats

 ,
,
Abstract
: In this study we propose an electronic system for linear positioning of a magnet independent of its modulus, which could vary because of aging, different fabrication process, etc. The system comprises a linear array of 24 Hall Effect sensors of proportional response. The data from all sensors are subject to a pretreatment (normalization) by row (position) making them independent on the temporary variation of its magnetic field strength. We analyze the particular case of the individual flow in milking of goats. The multiple regression analysis allowed us to calibrate the electronic system with a percentage of explanation R2 = 99.96%. In our case, the uncertainty in the linear position of the magnet is 0.51 mm that represents 0.019 L of goat milk. The test in farm compared the results obtained by direct reading of the volume with those obtained by the proposed electronic calibrated system, achieving a percentage of explanation of 99.05%.1. Introduction
Currently, there is a great interest in automating the flow measurements and total milk production in milking of goats. With milk flow record it is possible to characterize the kinetic of milk emission, aspect of physiological interest [1] which traditionally has been manually performed [2]. Moreover, control of total milk yield per animal, fundamental variable in genetic improvement schemes [3], is performed by the official milk control agencies using volumetric meters, proportional meters or automated systems.
Automation of milk recording in dairy small ruminants may be a way of reducing costs and human errors [4,5] due to the large number of animals processed on the test-days. In goats, one of the most widely used meters is WB Mini-Test (Tru-Test), which operates by collecting a cumulative proportion (about 1/20) of the milk yield from an animal in a cylindrical container, with a capacity of approximately 300 mL, and the user performs a visual reading of a graduated scale to obtain an estimate of the total milk yield. In goats, this equipment allows to carry out measurements up to 5.5 L of milk yield per animal. There are currently several automatic milk meters to measure the flow and production of goats' milk, but we should point out that in many countries there are hardly used by official milk control agencies in goats' milk, either because they are fixed and cannot be transported routinely to farms (Afifree, MM25SG), or because of their high cost (Lactocorder). In practice few commercial goat farms have implemented automatic milk recording systems due to the high acquisition costs of the equipment [6].
Currently, there are two ways of determining magnetic fields vector distributions: (i) using a scanning machine [7,8]; (ii) using an array of sensors [9–12]. The first type of device offers a high special resolution, but their structure is complicated and they require a longer time than array type magnetic sensor for measuring magnetic fields vectors. There is another hybrid type [13] that is a scanning with an array of sensors to increase the resolution.
All cited works try to develop a 1, 2 or 3 dimension camera to determine the magnetic field vectors. In this work we try to develop an array of magnetic Hall Effect sensors to determine the position of the magnet. The aim of this work is to design a level meter, of low-cost, to be used in combination with the proportional meter WB Mini-Test, and thus automate the record of the flow and total milk production in milking of goats.
The proposed electronic system surmount the inherent difficulties in these measures: (i) the milk composition and so the physico-chemical properties of the milk vary between animals; (ii) within the milk meter the milk is subjected to vacuum (about 35–40 kPa) and foaming may occur; (iii) the meter is subjected to washing with acid and basic detergents and hot water (50–70 °C), as well as all components added into the milk flow.
In this study, with the intention of overcome the above described obstacles, we propose a milk volume meter where the entire electronic components are positioned outside the milk flow. This is achieved because the proposed volume meter is based on the detection of the variation of the magnetic field created by a magnet placed on a floating device and an array of linear Hall Effect sensors.
The magnets may age changing the strength of its magnetic field. This causes that the calibration of a Hall Effect sensor with linear response would not be lasting. This paper also proposes a basic statistical methodology to overcome this problem.
2. Materials and Methods
In this section, the developed measurement system, as well as the methodology followed for the magnetic field calibration, will be described.
2.1. Array of Sensors
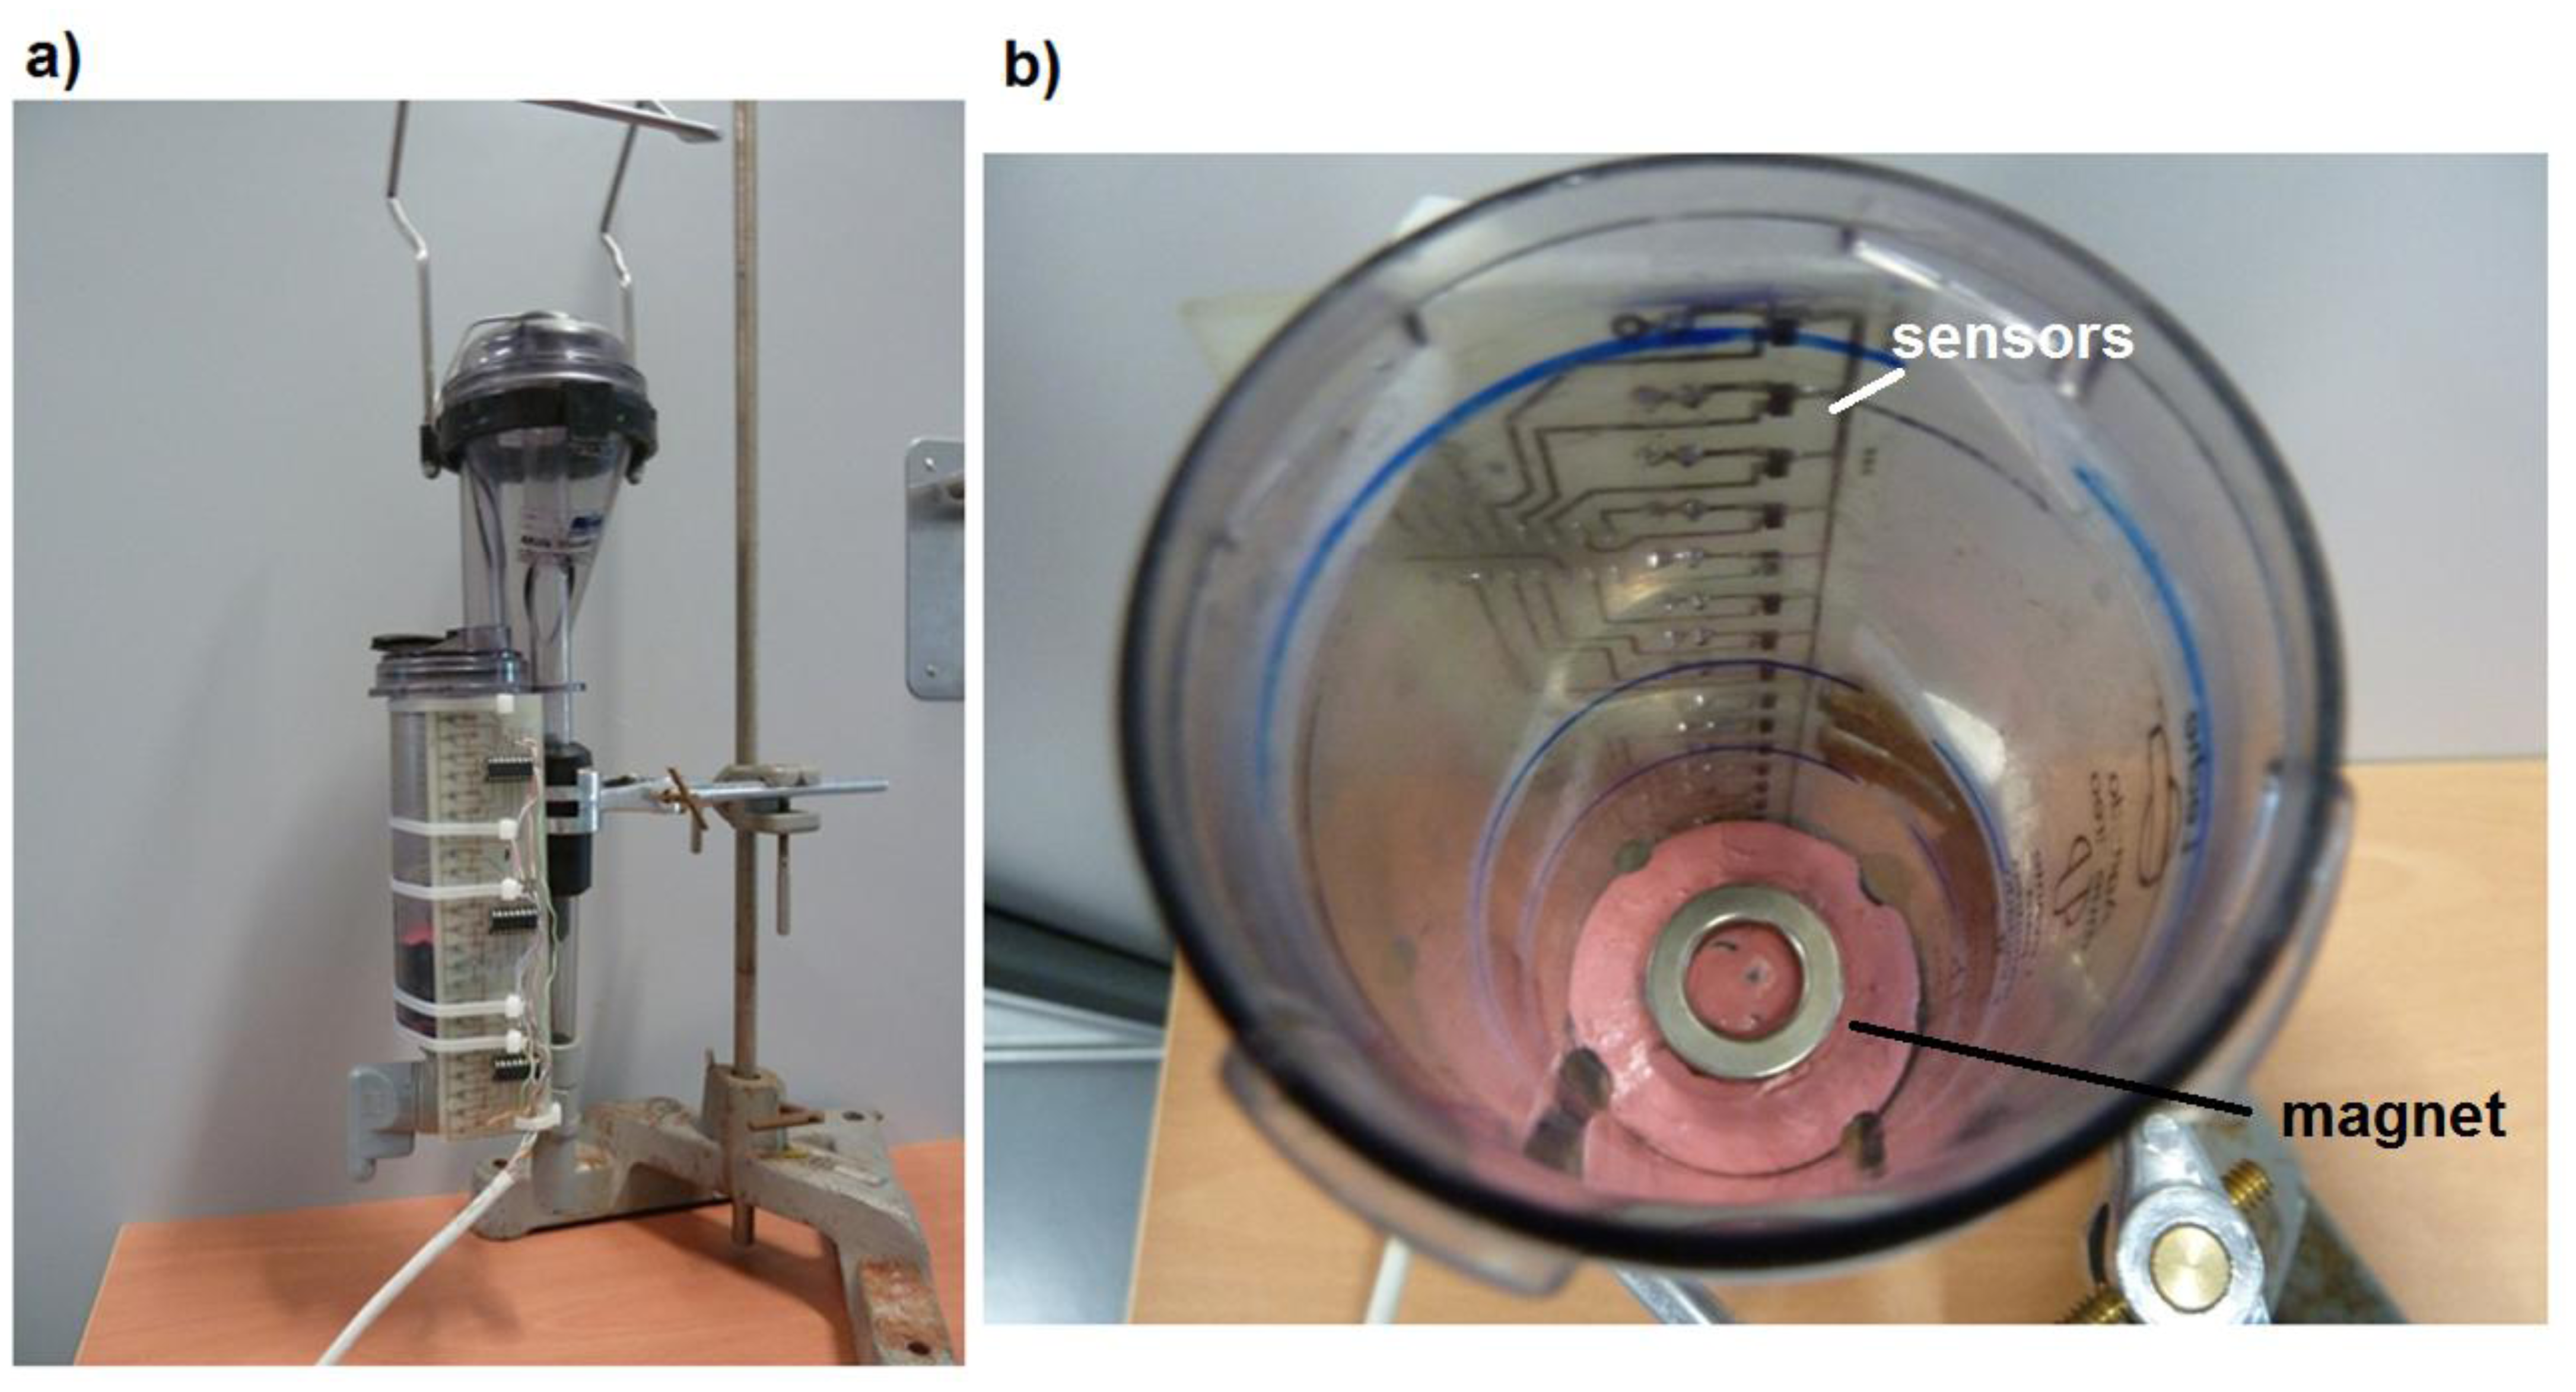
The proposed system consists of an electronic board attached to the proportional meter WB Mini-Test, where Hall Effect sensors are welded vertically. Inside the proportional meter, a floating device containing a magnet is placed, so that the reading of the Hall Effect sensors will vary as the float raises its height, as a result of the volume increase (Figure 1).
The Hall Effect sensor chosen is A1301 [14], which is optimized to accurately provide a voltage output proportional to the flux of the applied magnetic field which cross the sensor. These devices have a quiescent output voltage (2.5 V in our case), which is the half of the applied one. With an output sensitivity of 2.5 mV/G, high precision in output levels are obtained by internal gain and offset trim adjustments made at end-of-line during the manufacturing process.
They are well-suited for industrial applications; it is immune to vibrations end extended temperature ranges (from −40 °C to 125 °C). These features make the A1301 ideal for use in linear position sensing systems [14]. The device package was a 3-pin SOT23W type for surface mount, this package has a better stability in temperature changes than other ones [14].
An array of 24 sensors (A1301), placed with a linear separation of 8 mm, was constructed. The total length of the array of sensors was of 184 mm. Because of constructional reasons, the upper sensor was placed close to the edge of proportional measurement device. A total of five sensors protruded below the lower edge of the container. The array was placed on the outside of the cylindrical milking measuring device, parallel to its axis, so that its internal washing with acid and basic detergents and hot water does not interfere in the array.
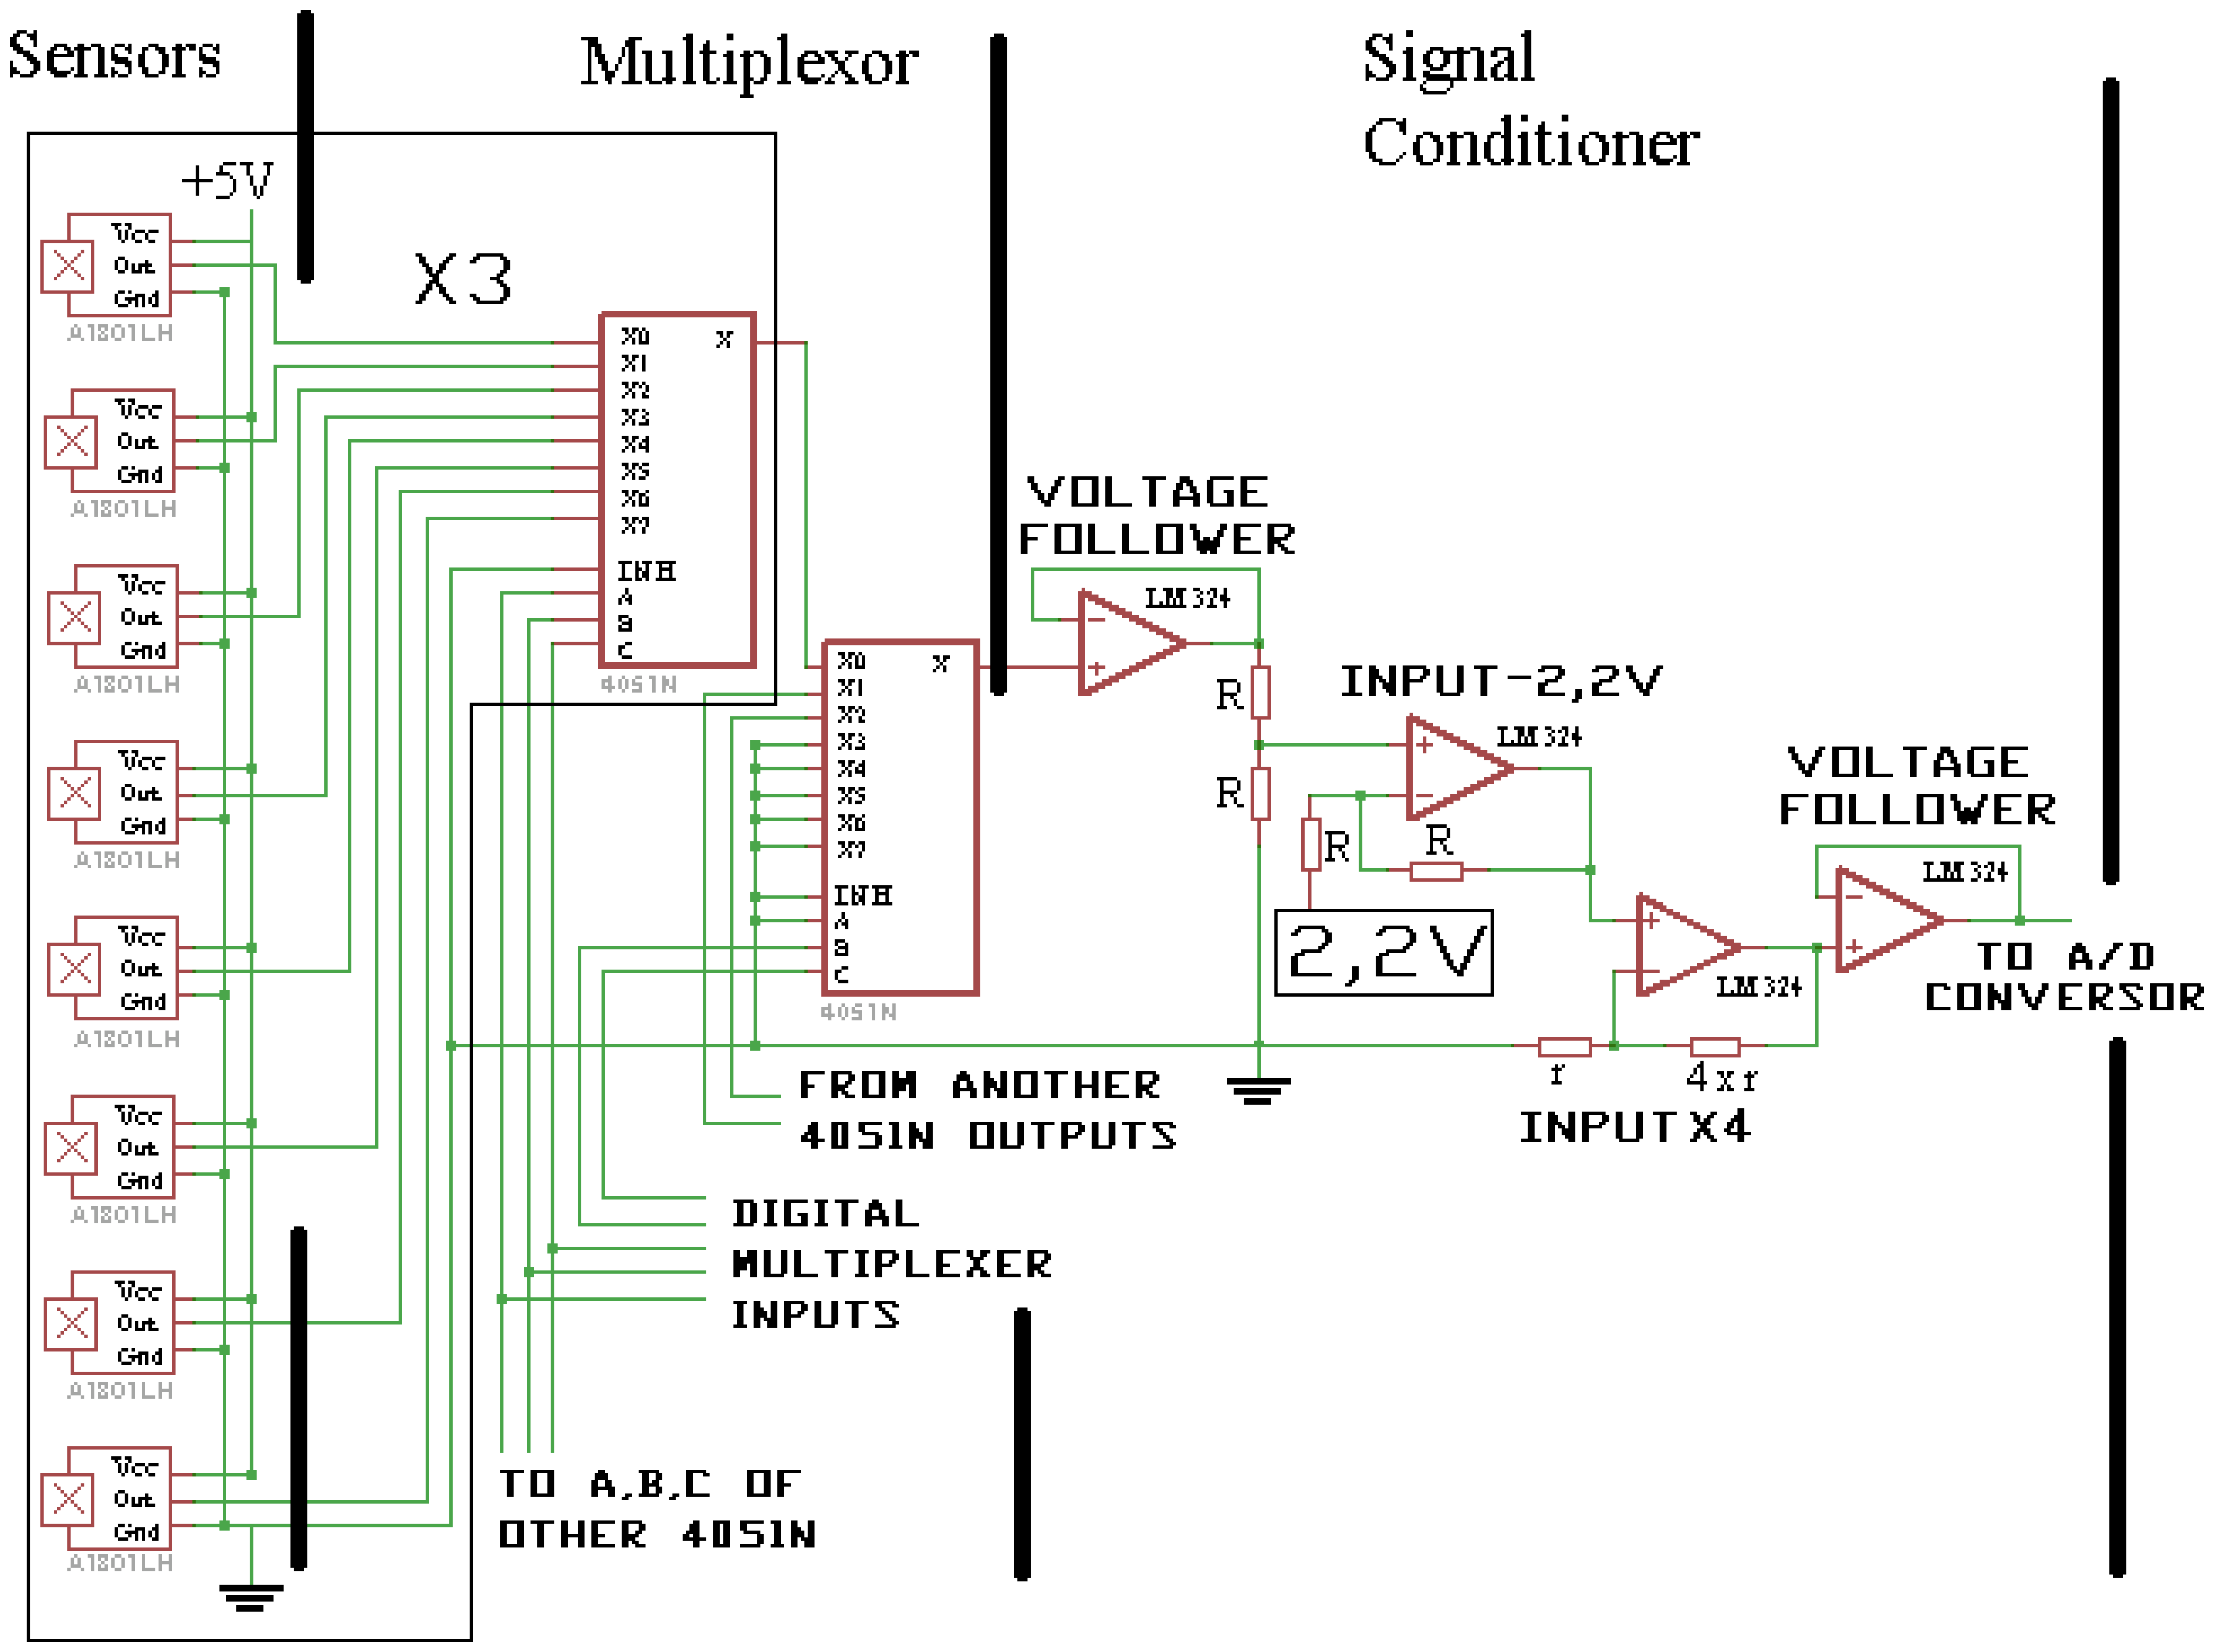
As shown in Figure 2 the array was multiplexed with four 8-channel analog multiplexer (4051N) with the intention of obtaining a single signal, which was conditioned by four operational amplifiers contained in a LM324. The four operational amplifiers were connected in the following order: the first as a voltage follower, the second subtracts 2.2 V to the input signal, the third multiplies the second signal by five, and the last one follows the tension of the third amplifier.
The analog signal is read by a 10-bit ADC (Analogue to Digital Converter), from an ATMEGA168 (Atmel, San Jose, CA, USA) microcontroller. Five digital pins of the microcontroller were used to manage the multiplexors. The microcontroller was programmed using the Arduino [15] Integrated Development Environment (IDE). The microcontroller saved milking data in a USB memory with a frequency programmable by the user.
To create the magnetic field, a permanent magnet shaped washer, to lighten its weight, was selected. A NdFeB magnet [16], with 26.75/16 mm diameter (outside/inside, respectively), with 5 mm in height, with their north and south poles on the flat circular surfaces (axial magnetisation), 14 g in weight, and a nickel plated (Ni-Cu-Ni), is capable of withstanding temperatures of 80 °C. The magnet was attached to the upper base of a cylindrical floating device, in PVC, with 52 mm diameter and 50 mm high, and a weight of 70 g. The floating device has vertical grooves to make the milk flowing up and down. As the float fitted perfectly into proportional measuring device the floating device requires a minimal volume (50 mL) to start floating.
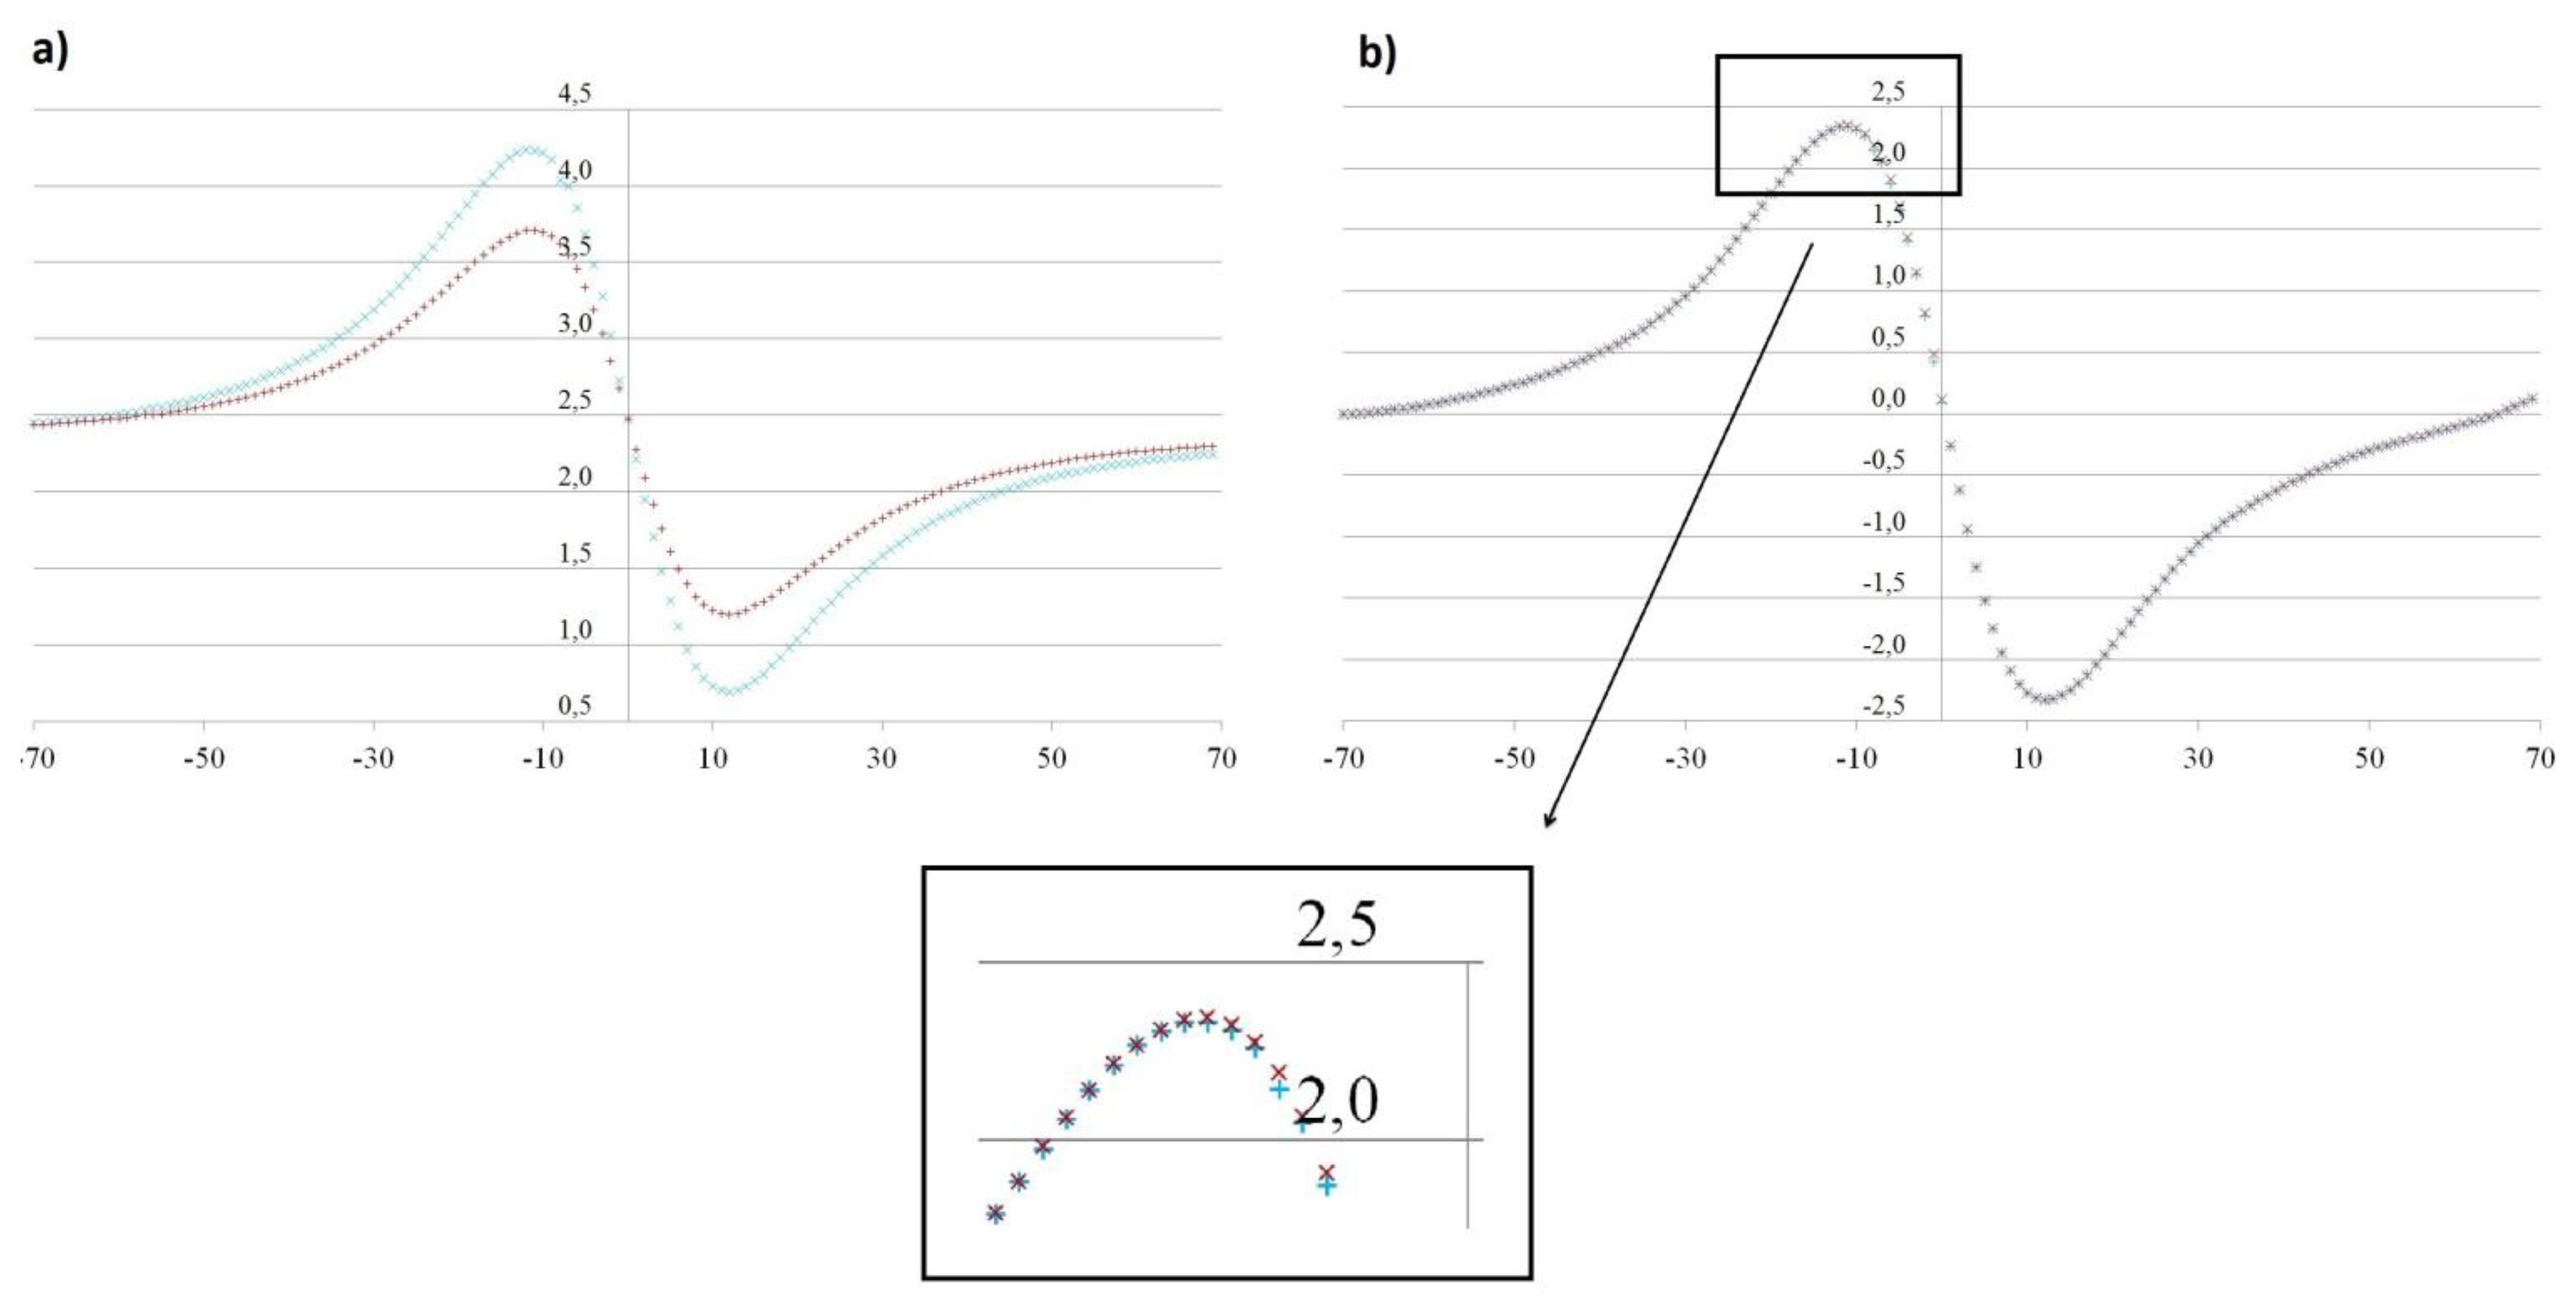
The magnetic field created by a permanent magnet is explained elsewhere [17,18]. The magnetic field produced by the magnet is not distorted by the measuring system because all was made of non-ferromagnetic materials (plastic, stainless steel, copper and tin). In our case, we are interested only in the radial component of the magnetic field, which will vary the flow of the magnetic field on our sensors. A result greater than 2.5 V is obtained when the magnet surpasses the sensor, and score less than 2.5 V is obtained when the magnet is below the sensor, as shown in Figure 3(a). In a commercial device, the magnet could be placed into the PVC floating device or painted with a suitable paint to prevent rusting.
2.2. Experimental Design for Calibration
The scale of the original proportional meter represents a total volume of 5.5 L of milking. Given the height of the floating device, which contains the magnet, the final proportional meter is capable of measuring 4.07 L, more than enough for the Murciano-Grenadine goats used in this experiment because they do not exceed 2 L of total milking [6]. For the calibration procedure, these 4.07 L were divided into 110 parts, each one of 1 mm. The float moves jointly with a plastic metric screw of 6 mm of diameter, which each screw turn lifts the float 1 mm (0.037 L). Goat's milk was manually added to the cuvette as the float height was increased. Each experiment consists of 110 measures for each of the 24 sensors.
There were two batches of different experiments, each one consisting of eight individual experiments. Since the meter is subjected to proportional washed with hot water (50–70 °C), the first batch was carried out to check the effects on the heat treatment on the magnet and how data pretreatment (Section 2.3) overcomes this problem. Three of these eight initial experiments were made after subjecting the magnet to a heat treatment at 80 °C for 5 minutes.
The second batch was made for final calibration of the system and checking the effects of different fat content in milk. Of the eight experiments, which were used to perform the final calibration system, five experiments were performed with whole cream milk and three with the same milk after a skimming process to check, through a regression analysis, if the fat content of the milk appreciably alters the magnetic field strength detected by the sensors. Milk fat composition was determined by mid-range infrared spectroscopy using a MilkoScan FT120 (Foss, Hillerød, Denmark).
Note that, after verifying that the normalization eliminates the effects of heat treatment on the magnet (Section 3.1), the second batch of experiments, performed with milk with different fat content, were all made with the magnet without heat treatment.
Each batch was composed of a total of eight experiments, so that in this study there are two data matrices of 880 (8 × 110) rows and 25 columns (24 sensors and variable volume) each one. All analysis and subsequent sections work with the calibration of the eight experiments of the second batch.
2.3. Data and Pretreatment
The data were subjected to a pretreatment with the intention of obtaining the best possible results in calibration and to extend this approach to all situations in which an event, inherent or not to the monitoring system, affects the response of all the sensors at the same time without altering the shape of the magnetic field.
The pretreatment consisted of normalizing the data by rows, obtaining from a random variable of unknown distribution a new random variable with normal distribution N(0,1), a treatment used in basic statistics [19]:
The data are centered so that the analysis is focused on the variability around the average. Data are scaled to homogenize the importance of the variables in the model. The evolution vs. time of μ(t) is of relevant interest for the identification of different kinetics of milk emission. This common pattern of μ(t) is followed by all sensors, and the goal in this case is to diagnose the slight variations of each sensor respect this average performance. Thus, if data variability caused by time, equally affecting the magnitude of the magnetic field for all volume values but not its shape and direction, is eliminated from the matrix, the subsequent analysis will reflect more clearly the relationships among sensors. For example, changes in magnet strength, temperature, etc. such as the magnet aging which affects the modulus (strength) of the magnetic field, but not its shape [17,18]. Furthermore, using centered variables can help reduce some types of multicollinearity [20]. The idea of applying this pretreatment comes from the literature on the multivariate statistical control of batch chemical processes [21-25]. For this purpose, we centered (i.e., subtracting μ(t)from the elements of row t) and scaled the data to unit variance by rows (dividing each value by the standard deviation of the row), so that all centered rows have null average and standard deviation equal to 1.
2.4. Regression Analyses
The sensors return a 10-bit value (P) between 0 and 5 Volts (i.e., 5 V is divided in 1,024 parts), however for the calibration and future practical use of the system, it is interesting to propose a model that allows to infer the value of total milk yield (V, in L) in time t from the returned value (P) of each sensor in the moment of time t.
Therefore, a multiple regression analysis (GLM, Generalized linear model) is performed, with dependent variable Vf(t) manually measured every 0.037 L (1 mm in the float height) through the aforementioned procedure. The independent variables in the regression are the values of P for each sensor (Pi) normalized as explained in Section 2.3.
A sample of 880 values was used to calibrate the system. For each calibration, the output volume (Vf(t)) was measured as a linear function of Hall Effect sensors response (Pi(t)), following Equation (1), where π represents the error. In the case of thermal treatment a variable dummy d, taking the value 1 when the magnet has a heat treatment and the value 0 otherwise. In the case of variable fat content the variable dummy d, takes the value 1 when the goat milk is skimmed and the value 0 for the case where it is whole cream, was also included:
A least-squares algorithm is used to obtain the coefficients of the linear regression (α, βi, γ and Ωi) for the reference volume (Vf(t)) measured by the procedure described in Section 2.2. This analysis was performed using the software Statgraphics 5.1 [26].
Note that some pairs of Pi are significantly correlated. Multicollinearity (correlated predictor variables) is bad in regression because it reduces the precision of the parameter estimates. While it affects the estimation of the individual parameters (each sensor in this case), multicollinearity does not affect inferences regarding the full model [20]. In the present study, it is of interest an accurate prediction of V, despite the exact contribution of each sensor to the prediction, so the multicollinearity will not cause any inference problem.
2.5. Experimental Design in Farm
Once the electronic system was calibrated in the laboratory, its operation was validated under farm conditions. For this purpose, it was installed in the line of the milking machine in the experimental farm of the Universitat Politècnica de València. The (2×12) milking parlour used had six clusters (Almatic™ cluster G50, Delaval Agri, Tumba, Sweden) and a milk pipeline at 1.0 m above the platform (midlevel). Milking parameters were rate of 90 pulsations per minute, vacuum level of 40 kPa, and 60% pulsation ratio. Five goats of Murciano-Grenadine race were milked, with a milk production ranging between 1.2 and 4 L. The milk flow was recorded according to the method in [2], so that the volume milked was manually recorded (according to the scale of the proportional meter) every 5 s, while, at the same time, the milk production was recorded by the electronic system every second. The verticality of the apparatus was ensured by holding a weight of 1 kg of the WB Mini-Test (Tru-Test).
In order to avoid the problem of the minimum volume to which the floating device starts to float, which depends on its shape and not on the electronic system, the measuring of milk yield is started with an initial volume of 50 mL in the proportional measurement device. These 50 mL have been subtracted from all the results.
3. Results and Discussion
3.1. Calibration with Thermal Treatment
Initially a multiple regression analysis was performed with the data of the first batch of experiments, in which it was found that the applied pretreatment was able to neutralize the effect that a heat treatment of the magnet has on the magnetic field, resulting not a significant variable (dummy variable which takes the value 1 if the magnet has been heat treated and 0 otherwise, p-value>0.05).
Figure 3(a) shows the reduction in the sensor response after subjecting the magnet to a reversible heat treatment (decreased potency). Figure 3(a) also allows observing the excellent repeatability of the sensors, taking into account that each one of the paths is the superposition of 5 and 3 experiments for the case with thermal treatment of the magnet and without it, respectively.
This made the magnet lose intensity as shown in Figure 3(a). It was found with the graphs (Figure 3(b)) and an exploratory regression analysis that the normalized data showed no influence of thermal treatment.
3.2. Calibration with Cariable Fat Content
In later analyses have been performed on the second batch of experiments. Then, the multiple regression analysis has allowed obtaining a system calibration.
Milk fat content was 5.05% whole cream milk and 0.55% after skimmed process, measured by mid-range infrared spectroscopy. The total milking volume in each time t can be predicted according to Equation (1), with the parameter values. Sensors 1 and 5 were not significant with a p-value > 0.05. The dummy variable modeling the influence of the fat content was not significant (p-value > 0.05). The fact that sensor 1 is not significant evidences that there is a maximum distance from which the sensors cannot detect differences in magnetic field caused by the movement of the magnet and sensor 5 because it could have a lineal dependence whith other sensors of the array. The model was significant (p-value < 0.01), with an R2 de 99.962%, a mean absolute error of 0.019 L (average of the error) and a standard error of estimate of 0.024 L (standard deviation of the error).
A regression analysis to the data without amplification was also performed. For the signal without amplifier the mean absolute error was 0.023 L and the standard error of estimate was 0.029 L, so that amplify the signal has improved the model by reducing the error by approximately 18%.
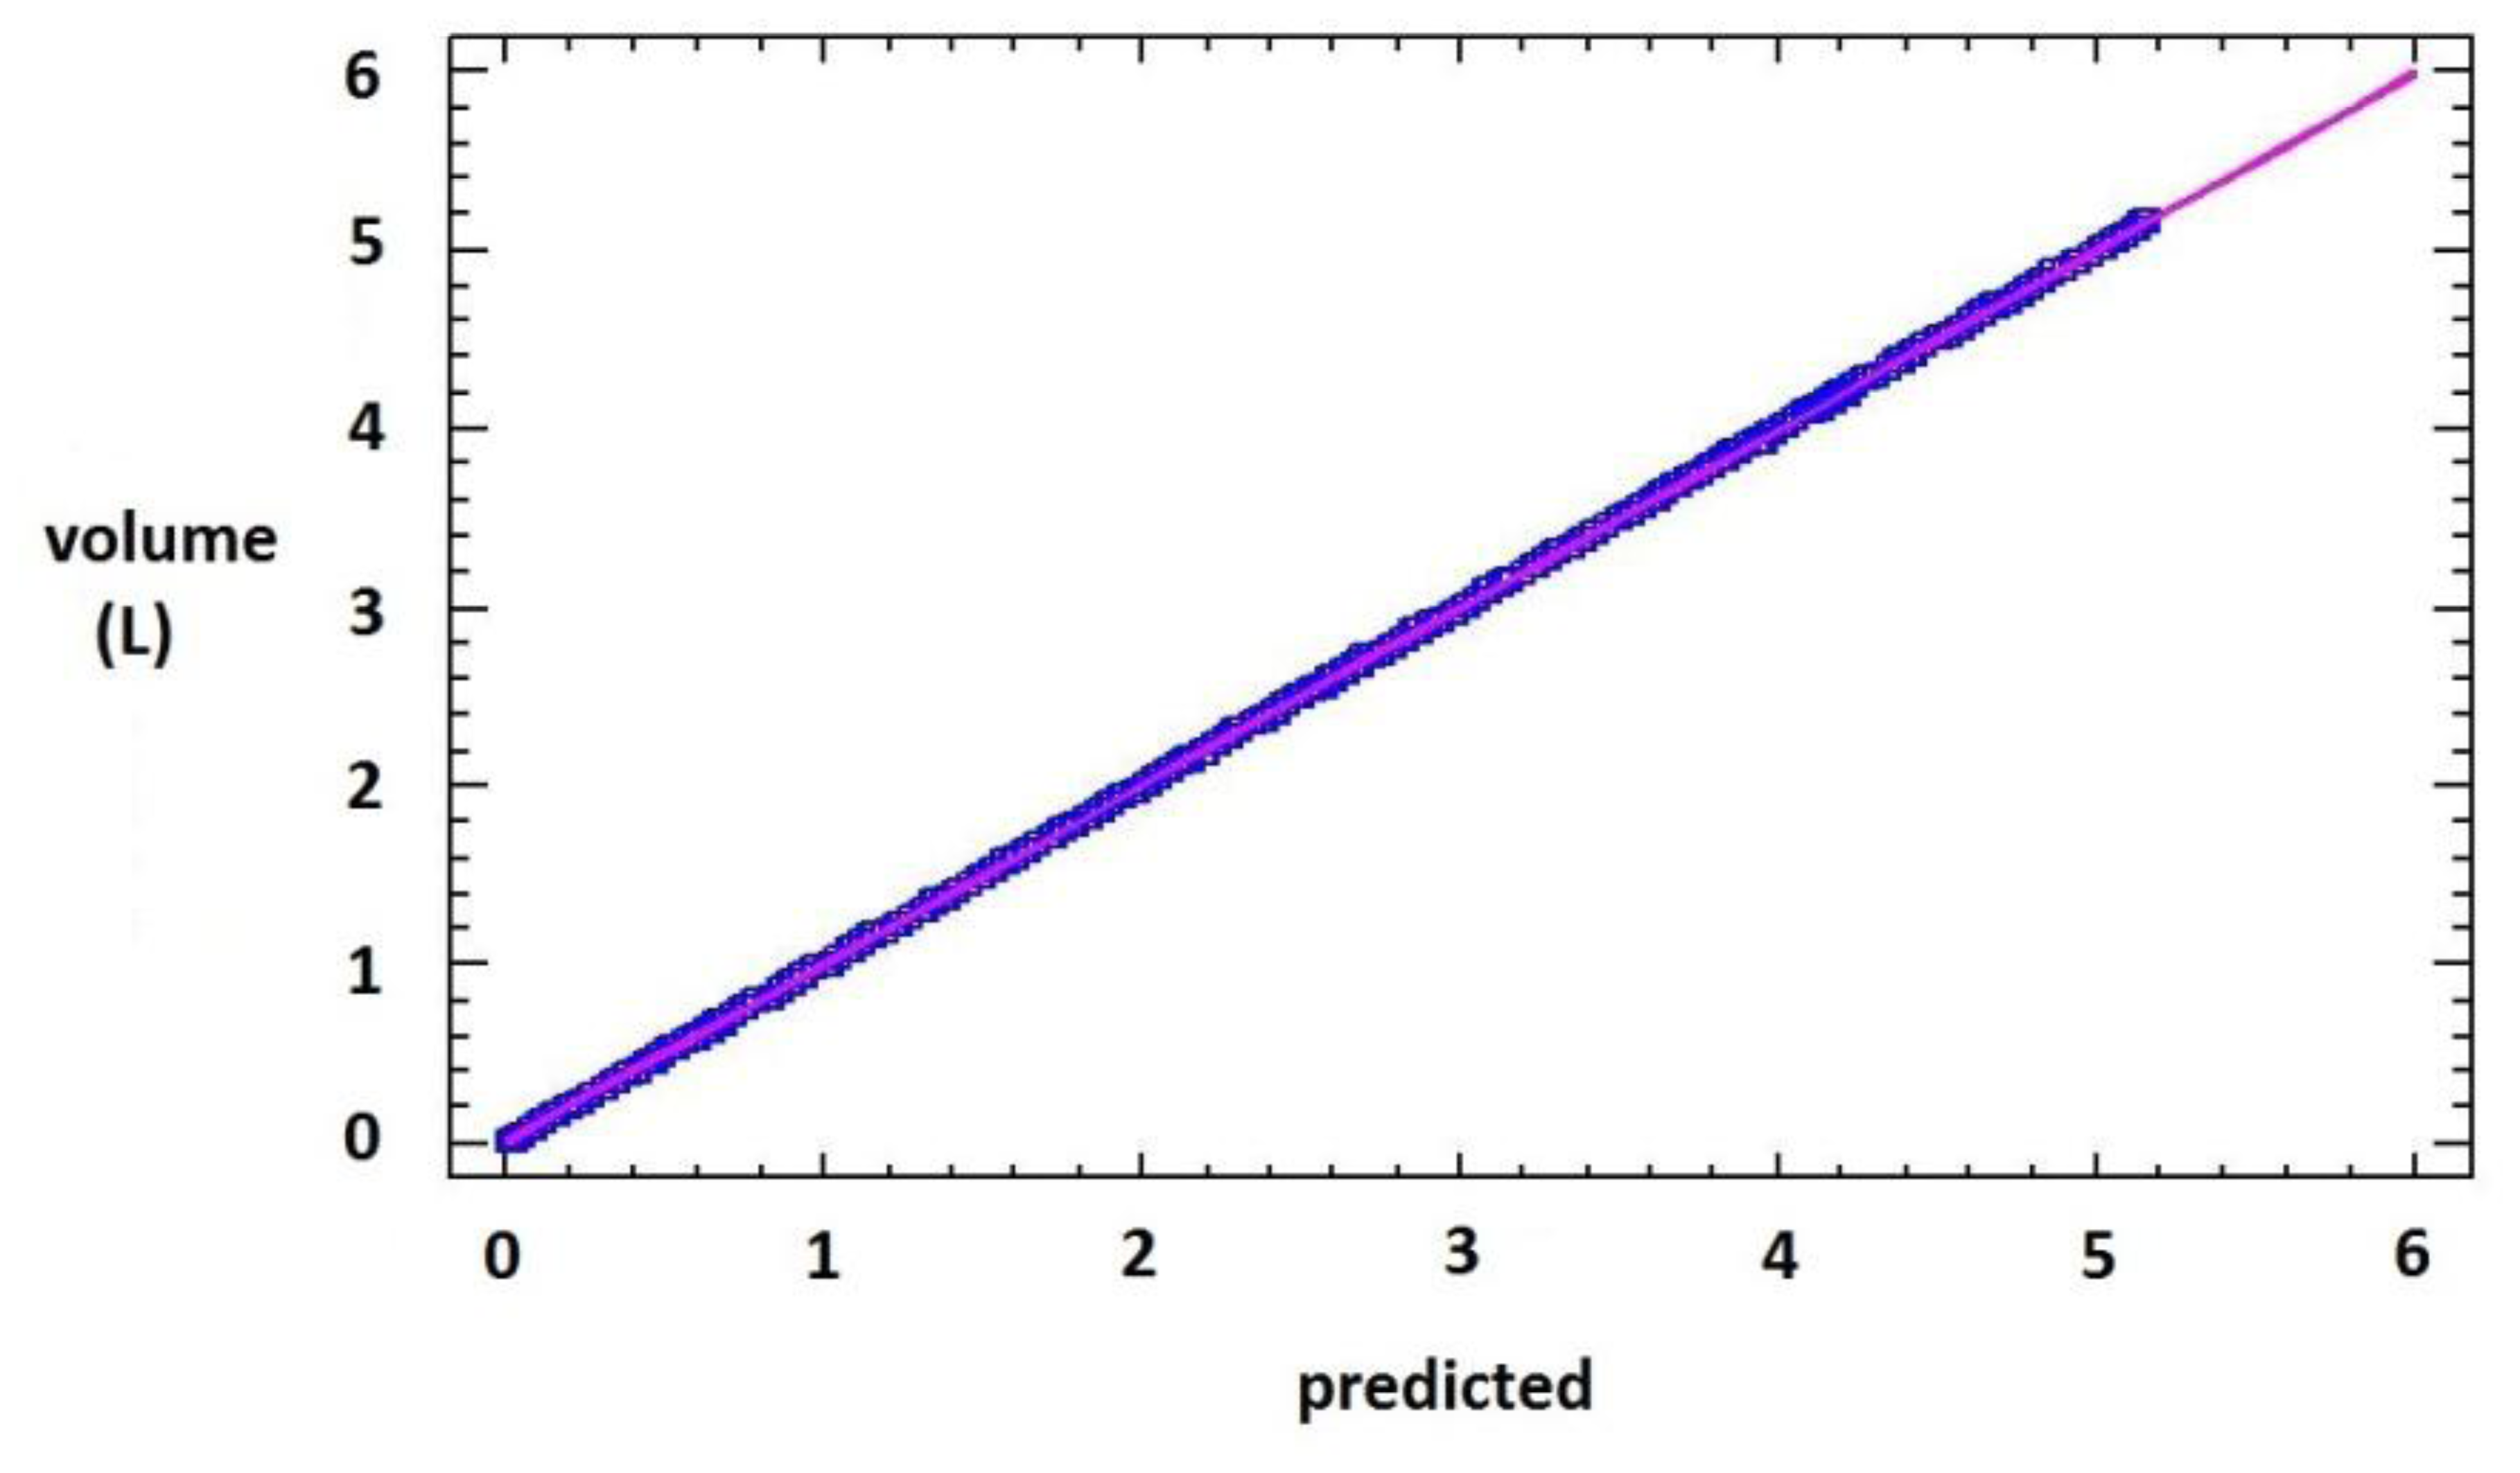
A second linear regression analysis was performed, with dependent variable the manually measured volume (Vf(t)) [2] and the predicted volume (Vp(t)) by the calibration model (Table 1) as independent variable. The model fitting is shown in Figure 4, which is a significant model (P-value < 0.01), with intercept near cero and a slope near 1 in Equation (2), a percentage of explanation (R2) of 99.962%, and a mean absolute error of 0.054 L:
3.3. Verification and Validation in Farm
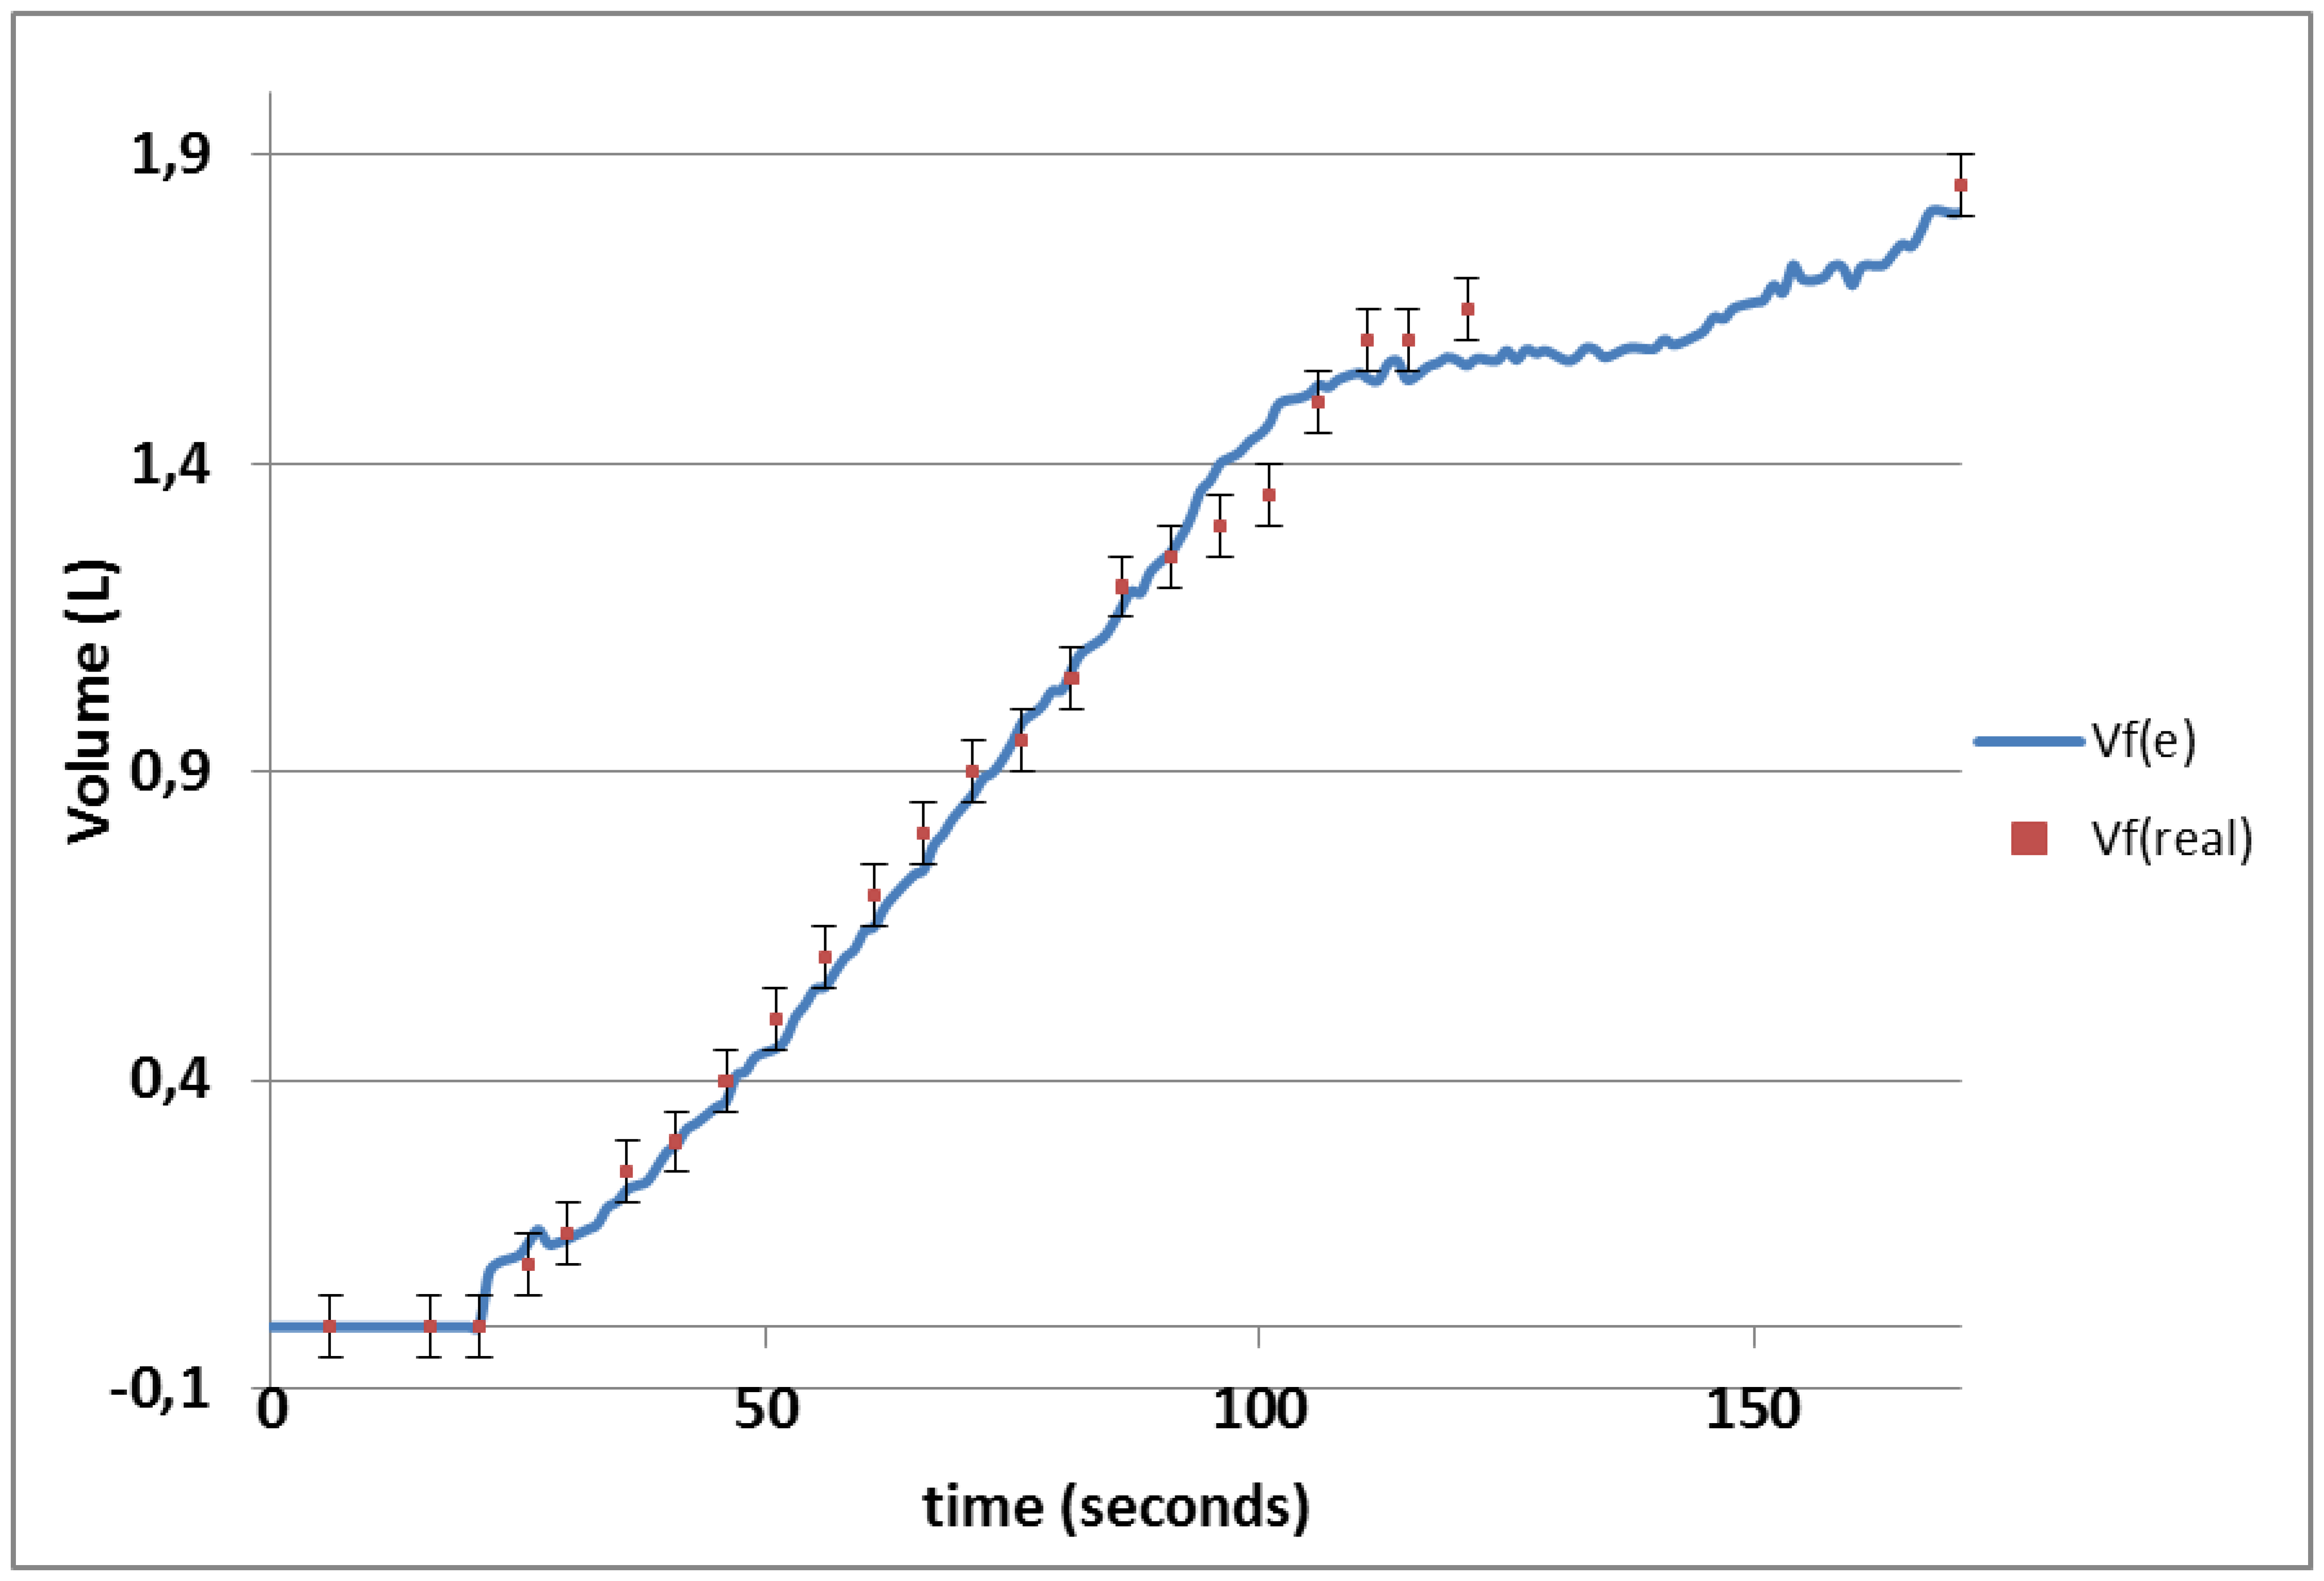
Once the calibration model is obtained for the electronic system considering the different sensors responses (Table 1), in order to ascertain the validity of the calibration a linear regression analysis between the manually measured volume in a practical experiment in the farm (Vf(real)) and the volume estimated by the proposed system (Vf(e)) is performed. The model is described by Equation (3), with intercept zero, slope 0.9931 ≈ 1 (Equation (3)), and an explanation percentage (R2) of 99.05%:
The farm test has revealed the practical use of this system under real ambient conditions and milking kinetics. The calibration model (Table 1) allowed predicting a 99.05% of the variability of the data. A confidence interval of ±0.05 L was chosen because this is the half of the scale marks in the WB Mini-Test and it could be assumed as the operator error. Furthermore, the instrument error must be added but we could not found it in the builder data-sheet and is supposed to be much less.
Notice that the value predicted by the electronic system is contained within the confidence interval of the manual measurement in the 87.5% (21/24) of the cases (Figure 5). The electronic system could be improved by determining the number of sensors and optimal separation between them to get the best cost-adjustment percentage (R2) possible. These improvements will be studied in a future work.
4. Conclusions
We have designed an electronic system using Hall Effect sensors. The electronic system is low-cost and has a high portability and, thanks to a pretreatment performed by row on the data, it circumvents problems as changes in the magnetic field strength generated by heat treatment on the magnet (as might result after washing with hot water the proportional measurement device) or other cause of magnet aging.
The calibration of the system has achieved very successful results, with a percentage adjustment of 99.962% and a mean absolute error of 0.019 L. The fat content of the milk was not a significant factor in the response of the sensors. By means of a practical test in farm, the correct operation of the system under uncontrolled conditions and in direct use with animals has been proven. The system has achieved a prediction adjusted in a 99.05% to the volume measured manually from the proportional volumetric meter.
Acknowledgments
This work was partially supported by the Spanish Government (Ministerio de Ciencia e Innovación) under projects HAR2010-21944-C02-01 and HAR2010-21944-C02-02. A. Sánchez-Quinche acknowledges the support received from SENESCYT (Secretaria Nacional de Educación Superior, Ciencia, Tecnología e Innovación) from the Equator Republic.
Conflict of Interest
The authors declare no conflict of interest.
References
- Billon, P.; Chastin, P.; Baritaux, B.; Bouvier, F.; Ilahi, H.; Manfredi, E.; Marnet, P.G. La cinétique d'émission du lait chez les chèvres. In Milking and Milk Production of Dairy Sheep and Goats; Zervas, N., Barillet, F., Eds.; EAAP Publication Wageningen Pers: Wageningen, The Netherlands, 1999; Volume 95, pp. 51–58. [Google Scholar]
- Ricordeau, G.; Martinet, J.; Denamur, R. Traite à la machine des brebis préalpes du Sud. Importance des différentes opérations de la traite. Ann. Zootech. 1963, 12, 203–225. [Google Scholar]
- Barillet, F. Genetic improvement for dairy production in sheep and goats. Small Rumin. Res. 2007, 70, 60–75. [Google Scholar]
- Ricard, E.; Arhainx, J.; Guillouet, J.P.; Bouvier, F.; Jacquin, M.; Chastin, P.; Astruc, J.M.; Lagriffoul, G.; Manfredi, E.; Barillet, F. On-farm test of INRA portable electronic jars for automatized milk recording of sheep and goats. In Performance recording of animals; Gailon, P., Chambert, Y., Eds.; EAAP Publication Wageningen Wageningen Pers: Wageningen, The Netherlands, 1994; Volume 50, pp. 47–51. [Google Scholar]
- Ilahi, H.; Chastin, P.; Bouvier, F.; Arhainx, J.; Ricard, E.; Manfredi, E. Milking characteristics of dairy goats. Small Rumin. Res. 1999, 34, 97–102. [Google Scholar]
- Ait-Saidi, A.; Caja, G.; Carné, S.; Salama, A.; Ghirardi, J.J. Short communication: Comparison of manual versus semiautomatic milk recording systems in dairy goats. J. Dairy Sci. 2008, 91, 1438–1442. [Google Scholar]
- Nishio, T.; Chen, Q.; Gillijns, W.; De Keyser, K.; Vervaeke, K.; Moshchalkov, V.V. Scanning Hall probe microscopy of vortex patterns in a superconducting microsquare. Phys. Rev. B. 2008, 77, 012502. [Google Scholar]
- Smith, C.H.; Schneider, R.W.; Dogaru, T.; Smith, S.T. Eddy-current testing with GMR magnetic sensor arrays. In Review of Progress in Quantitative Nondestructive Evaluation, Proceedings of the Quantitative Nondestructive Evaluation Conference, Green Bay, WI, USA, 28 July 2003; Thompson, D.O., Chimenti, D.E., Eds.; American Institute of Physics: Melville, NY, USA; Vol. 23, pp. 68–73.
- Kim, J.; Lee, J.; Jun, J.; Le, M.; Cho, C. Integration of Hall and giant magnetoresistive sensor arrays for real-time 2-D visualization of magnetic field vectors. IEEE T. Magn. 2012, 48, 3708–3711. [Google Scholar]
- Benitez, D.; Gaydecki, P.; Quek, S.; Torres, V. Development of a solid-state multi-sensor array camera for real time imaging of magnetic fields. J. Phys. Conf. Ser. 2007, 76, 012030. [Google Scholar]
- Koen, V. Inspection of magnetization vector and magnetic field distribution of uniaxial and multipole sensor magnets using fast high resolution MagCam magnetic field mapping and analysis. Proc. Sensor Proc. 2011, 1, 762–767. [Google Scholar]
- Jun, J.; Kim, J.; Lee, J.; Park, Y. A hand-held magnetic camera system for real time crack inspection. Proceedings of the IEEE Sensors Applications Symposium, San Antonio, TX, USA, February 2011; pp. 298–301.
- Misron, N.; Shin, N.W.; Shafie, S.; Marhaban, M.H.; Mailah, N.F. A mobile ferromagnetic shape detection sensor using a Hall sensor array and magnetic imaging. Sensors. 2011, 11, 10474–10489. [Google Scholar]
- Allegro Microsystems LLC. Continuous-Time Ratiometric Linear Hall Effect Sensor ICs. Available online: http://www.allegromicro.com/˜/media/Files/Datasheets/A1301–2-Datasheet.ashx (accessed on 30 January 2013).
- Arduino Open-Source Electronics Prototyping Platform. Available online: http://www.Arduino.cc (accessed on 20 June 2013).
- R-27–16–05-N Magnet. Available online: http://www.supermagnete.es/R-27–16–05-N (accessed on 30 January 2013).
- Lemarquand, G.; Lemarquand, V.; Babic, S.; Akyel, C. Magnetic Field Created by Thin Wall Solenoids and Axially Magnetized Cylindrical Permanent Magnets. Proceedings of the Progress In Electromagnetics Research Symposium 2009 (PIERS 2009), Moscow, Russia, 18-21August 2009; Volume 1, pp. 614–618.
- Ravaud, R.; Lemarquand, G.; Lemarquand, V.; Depollier, C. The three exact components of the magnetic field created by a radially magnetized tile permanent magnet. Prog. Electromagnet. Res. 2008, 88, 307–319. [Google Scholar]
- Fisher, R.A. Statistical Methods for Research Workers; Oliver and Boyd: Edinburgh, UK, 1925. [Google Scholar]
- Kutman, M.H.; Nachtsheim, J.; Nefer, J.; Li, W. Applied Linear Statistical Models; McGraw Hill: New York, NY, USA, 2005. [Google Scholar]
- Gallagher, N.B.; Wise, B.M.; Stewart, C.W. Application of multi-way principal components analysis to nuclear waste storage tank monitoring. Comput. Chem. Eng. 1996, 20, 739–744. [Google Scholar]
- Rännar, S.; MacGregor, J.F.; Wold, S. Adaptive batch monitoring using hierarchical PCA. Chemom. Intell. Lab. Syst. 1998, 41, 73–81. [Google Scholar]
- Zarzo, M.; Ferrer, A. Batch process diagnosis: PLS with variable selection versus block-wise PCR. Chemom. Intell. Lab. Syst. 2004, 73, 15–27. [Google Scholar]
- García-Diego, F-J.; Zarzo, M. Microclimate monitoring by multivariate statistical control: The renaissance frescoes of the Cathedral of Valencia (Spain). J. Cult. Herit. 2010, 11, 339–344. [Google Scholar]
- Zarzo, M.; Fernández-Navajas, A.; García-Diego, F-J. Long-term monitoring of fresco paintings in the Cathedral of Valencia (Spain) through humidity and temperature sensors in various locations for preventive conservation. Sensors 2011, 11, 8685–8710. [Google Scholar]
- Statgraphics 5.1. Available online: http://www.statgraphics.net (accessed on 20 June 2013).


| Parameter | Estimation | Statistic T | P-Value | Parameter | Estimation | Statistic T | P-Value |
|---|---|---|---|---|---|---|---|
| α | 3.40876 | 55.8703 | 0.0000 | β14 | 4.09285 | 14.8823 | 0.0000 |
| β2 | 2.56316 | 4.55189 | 0.0059 | β15 | 3.97483 | 14.4389 | 0.0000 |
| β3 | 2.90016 | 5.04019 | 0.0001 | β16 | 3.93641 | 14.31 | 0.0000 |
| β4 | 3.44822 | 6.25207 | 0.0068 | β17 | 3.84902 | 14.0004 | 0.0000 |
| β6 | 5.57883 | 16.8217 | 0.0000 | β18 | 3.85293 | 14.0064 | 0.0000 |
| β7 | 3.03645 | 5.48769 | 0.0000 | β19 | 3.80196 | 13.8264 | 0.0000 |
| β8 | 7.39145 | 13.7871 | 0.0000 | β20 | 3.73793 | 13.6 | 0.0000 |
| β9 | 3.83972 | 9.00275 | 0.0000 | β21 | 3.75852 | 13.6837 | 0.0000 |
| β10 | 5.131 | 18.8555 | 0.0000 | β22 | 3.64796 | 13.2721 | 0.0000 |
| β11 | 3.94889 | 13.2547 | 0.0000 | β23 | 3.75163 | 13.6819 | 0.0000 |
| β12 | 4.28748 | 15.5634 | 0.0000 | β24 | 3.65412 | 13.3037 | 0.0000 |
| β13 | 4.16296 | 15.0817 | 0.0000 | ||||
© 2013 by the authors; licensee MDPI, Basel, Switzerland. This article is an open access article distributed under the terms and conditions of the Creative Commons Attribution license (http://creativecommons.org/licenses/by/3.0/).
Share and Cite
García-Diego, F.-J.; Sánchez-Quinche, A.; Merello, P.; Beltrán, P.; Peris, C. Array of Hall Effect Sensors for Linear Positioning of a Magnet Independently of Its Strength Variation. A Case Study: Monitoring Milk Yield during Milking in Goats. Sensors 2013, 13, 8000-8012. https://doi.org/10.3390/s130608000
García-Diego F-J, Sánchez-Quinche A, Merello P, Beltrán P, Peris C. Array of Hall Effect Sensors for Linear Positioning of a Magnet Independently of Its Strength Variation. A Case Study: Monitoring Milk Yield during Milking in Goats. Sensors. 2013; 13(6):8000-8012. https://doi.org/10.3390/s130608000
Chicago/Turabian StyleGarcía-Diego, Fernando-Juan, Angel Sánchez-Quinche, Paloma Merello, Pedro Beltrán, and Cristófol Peris. 2013. "Array of Hall Effect Sensors for Linear Positioning of a Magnet Independently of Its Strength Variation. A Case Study: Monitoring Milk Yield during Milking in Goats" Sensors 13, no. 6: 8000-8012. https://doi.org/10.3390/s130608000