5.1. Experimental Setup
To evaluate the performance of the nonlinear optimization model for the DFL, we performed some experiments based on the experimental data that can be acquired [
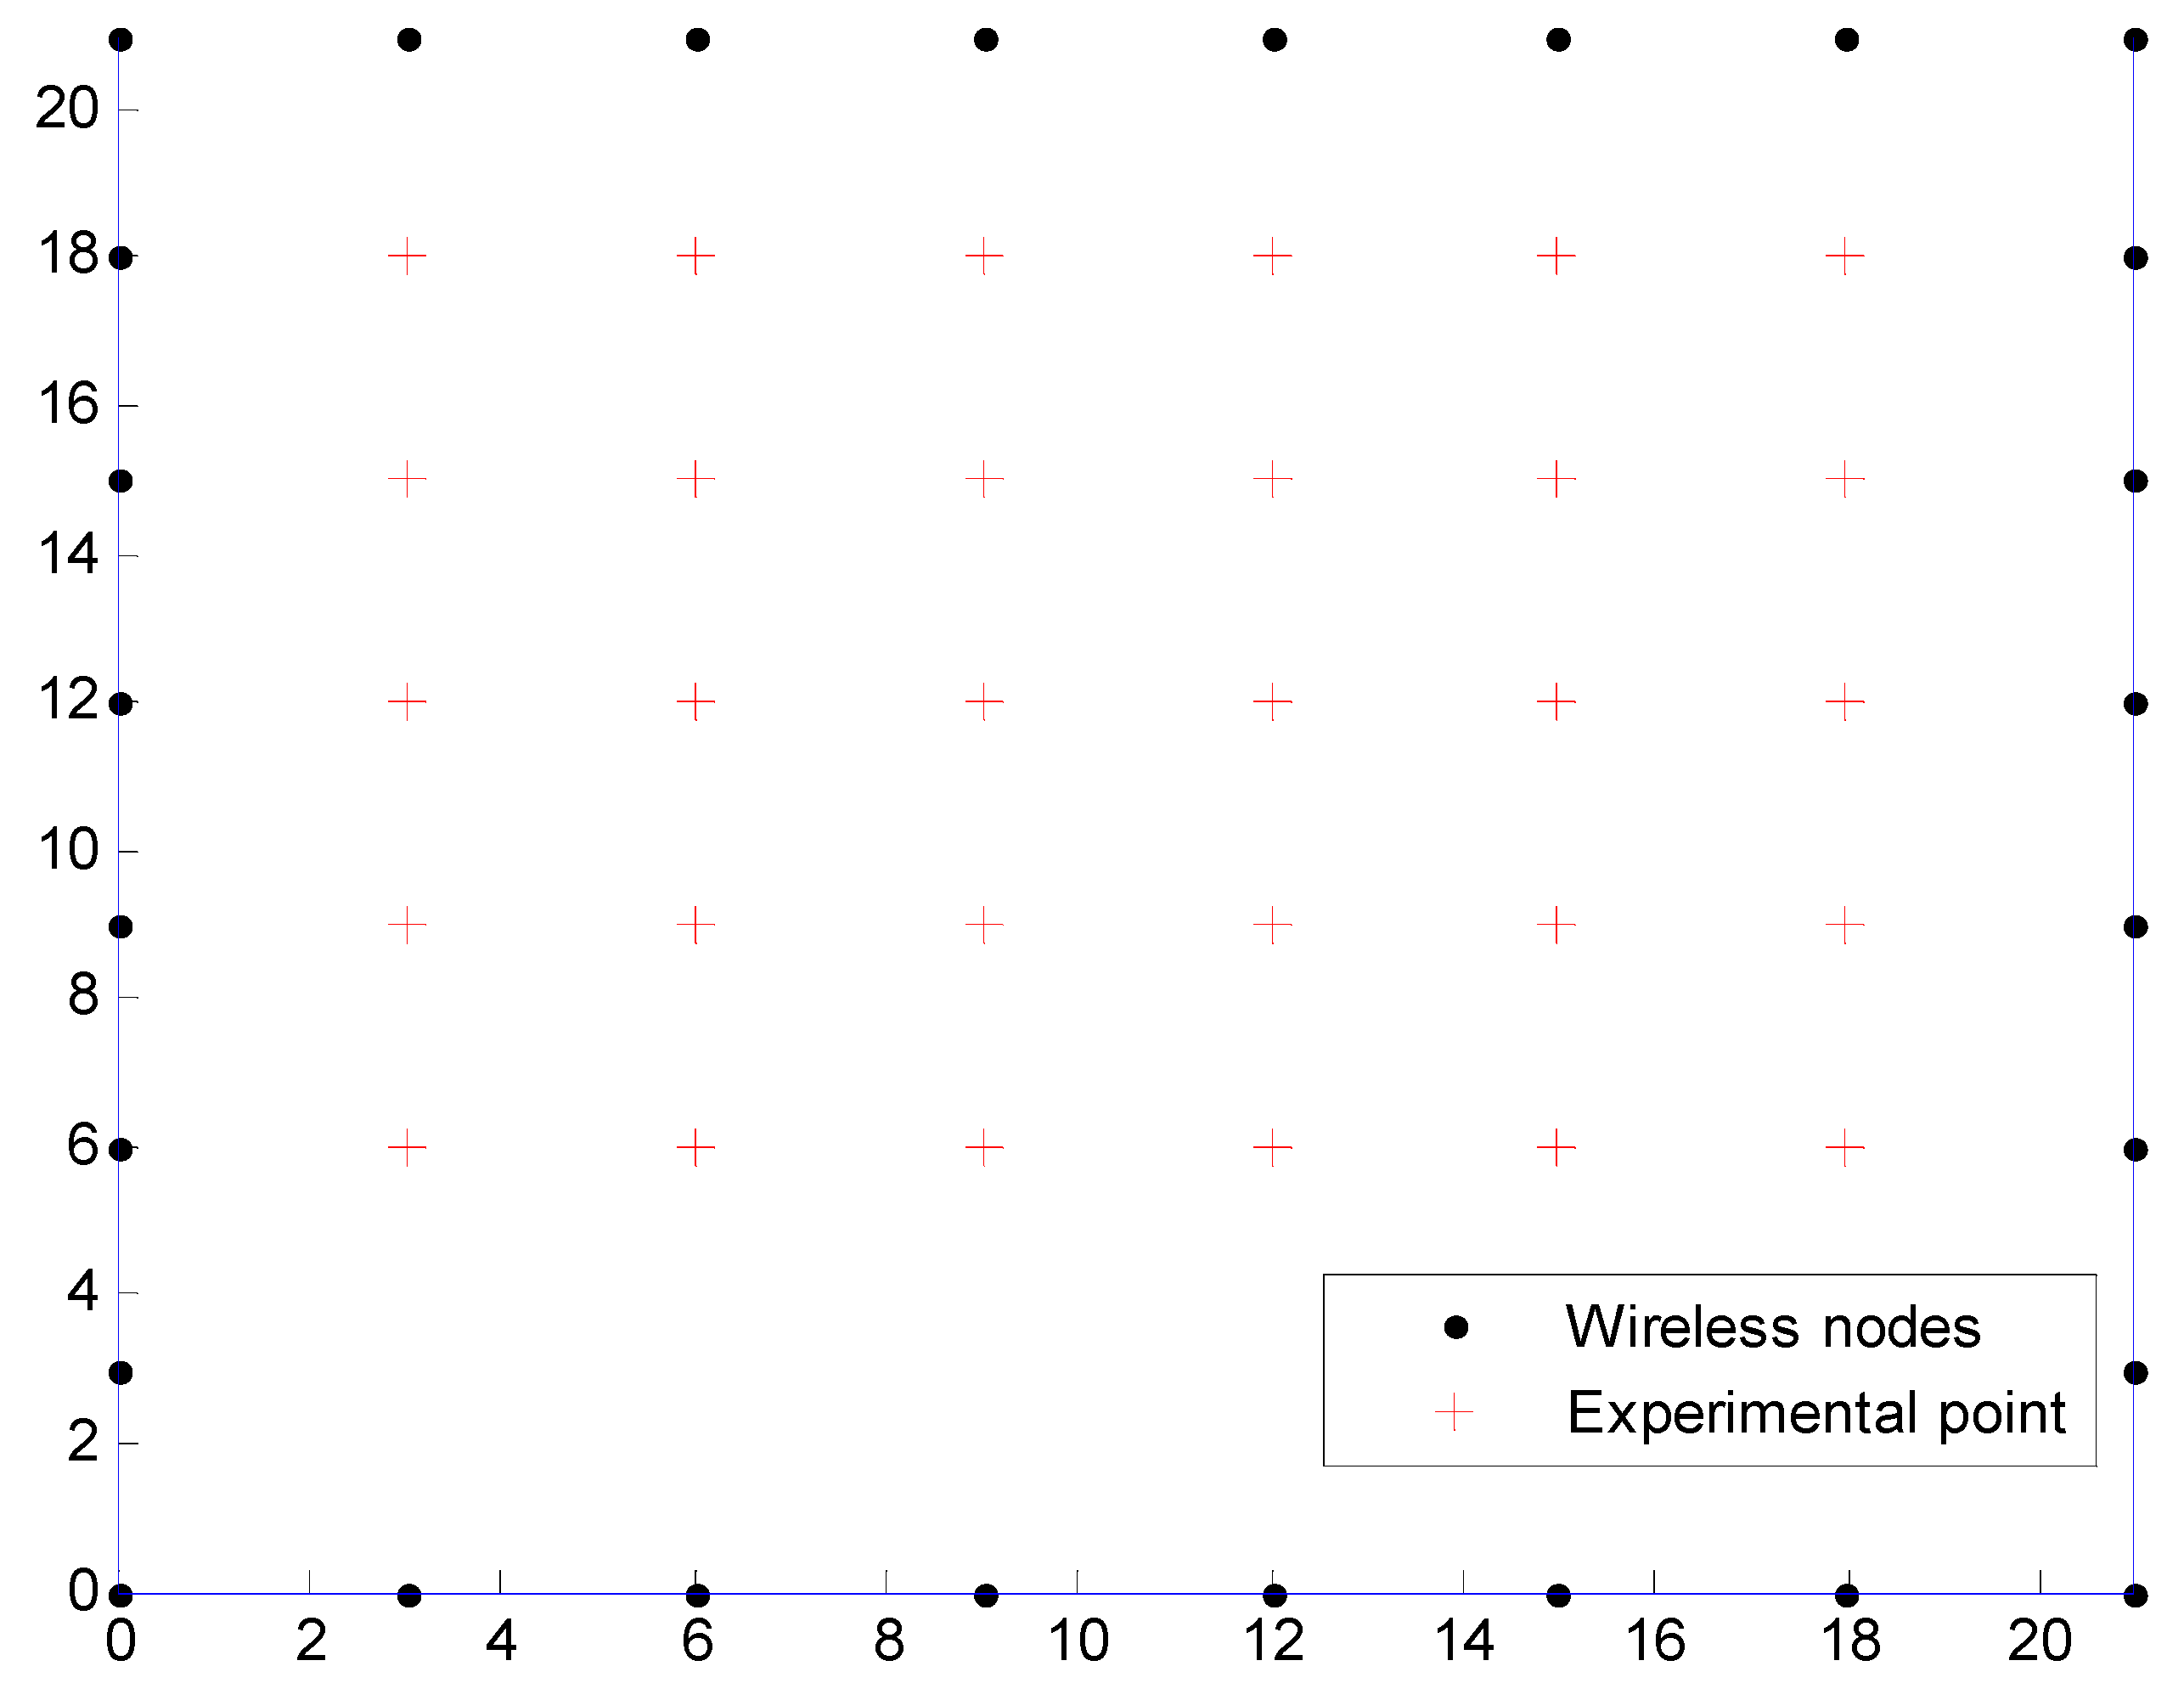
29] from the SPAN Lab of the University of Utah (Salt Lake City, UT, USA). There are 28 wireless devices and a Crossbow base station device, and the total number of links is 378. Each device operates in the 2.4 GHZ frequency band, and uses the IEEE 802.15.4 standard for communication. The base station node listens to all network traffic, then feeds the data to a laptop computer via a USB port for the processing of NOOLR. The RSS of each link is an averaged value of the RSS measurements from bi-directional transmissions. Each wireless device is placed three feet apart along the perimeter of a 21 × 21 feet square, surrounding a total area of 441 square feet, and is placed on a stand at three feet off the ground. In the experiment, the target is a person with the height 1.85 m and the weight 88 kg. As shown in
Figure 5, 30 testing locations are selected to compare the nonlinear optimization model for the DFL with RTI reconstruction [
7].
In this experiment, the system is calibrated by collecting RSS measurements while the network is vacant from targets. The time for calibration is 30 s. The time for data initialization which processes the calibration data is 2.0759 seconds. We perform experiments to test the running time for NOOLR. The running time contains two portions, including the time for processing the real time data and the time for running NOOLR.
Figure 5.
The experimental setup.
Figure 5.
The experimental setup.
We repeat the trials for 30 times, and the statistic results are summarized in
Table 2.
Table 2.
Running time for NOOLR in the experiment.
Table 2.
Running time for NOOLR in the experiment.
| Description | Mean(s) | Worst(s) | Best(s) |
|---|
| 1.5420 | 1.6051 | 1.4917 |
| 0.0204 | 0.1244 | 0.0052 |
| 1.5624 | 1.6973 | 1.5130 |
NOOLR can achieve averaged, worst and best times of 0.0204 s, 0.1244 s and 0.0052 s, which is very low, the average, the worst and the best times for the total running time is 1.5624 s, 1.6973 s and 1.5130 s, respectively, which is acceptable for target location estimation.
In RTI, the monitored area is divided into voxels, aggregately all voxels contribute to the RSS changes of each transmitter-receiver link in the network. The weights of all voxels are computed according to their impacts on all the links, and the voxel with the minimum weight is considered as the location estimation of the target. The RTI reconstruction for obtaining the weights of the voxels uses H1 regularization with the parameters listed in
Table 3.
Table 3.
The parameters of RTI.
Table 3.
The parameters of RTI.
| Parameter | Value | Description |
|---|
| 0.5 | Pixel width(feet) |
| E | 0.01 | Width of weighting ellipse (feet) |
| A | 5 | Regularization parameter |
The NOOLR parameters are listed in
Table 4. As the analytical relationship between the parameters and the system performance of NOOLR is not clear, we use the trial and error method to determine the parameters.
Table 4.
The parameters of NOOLR.
Table 4.
The parameters of NOOLR.
| Parameter | Value | Description |
|---|
| −6 | The threshold for affected link detection |
| 0.5 | The threshold for the variance |
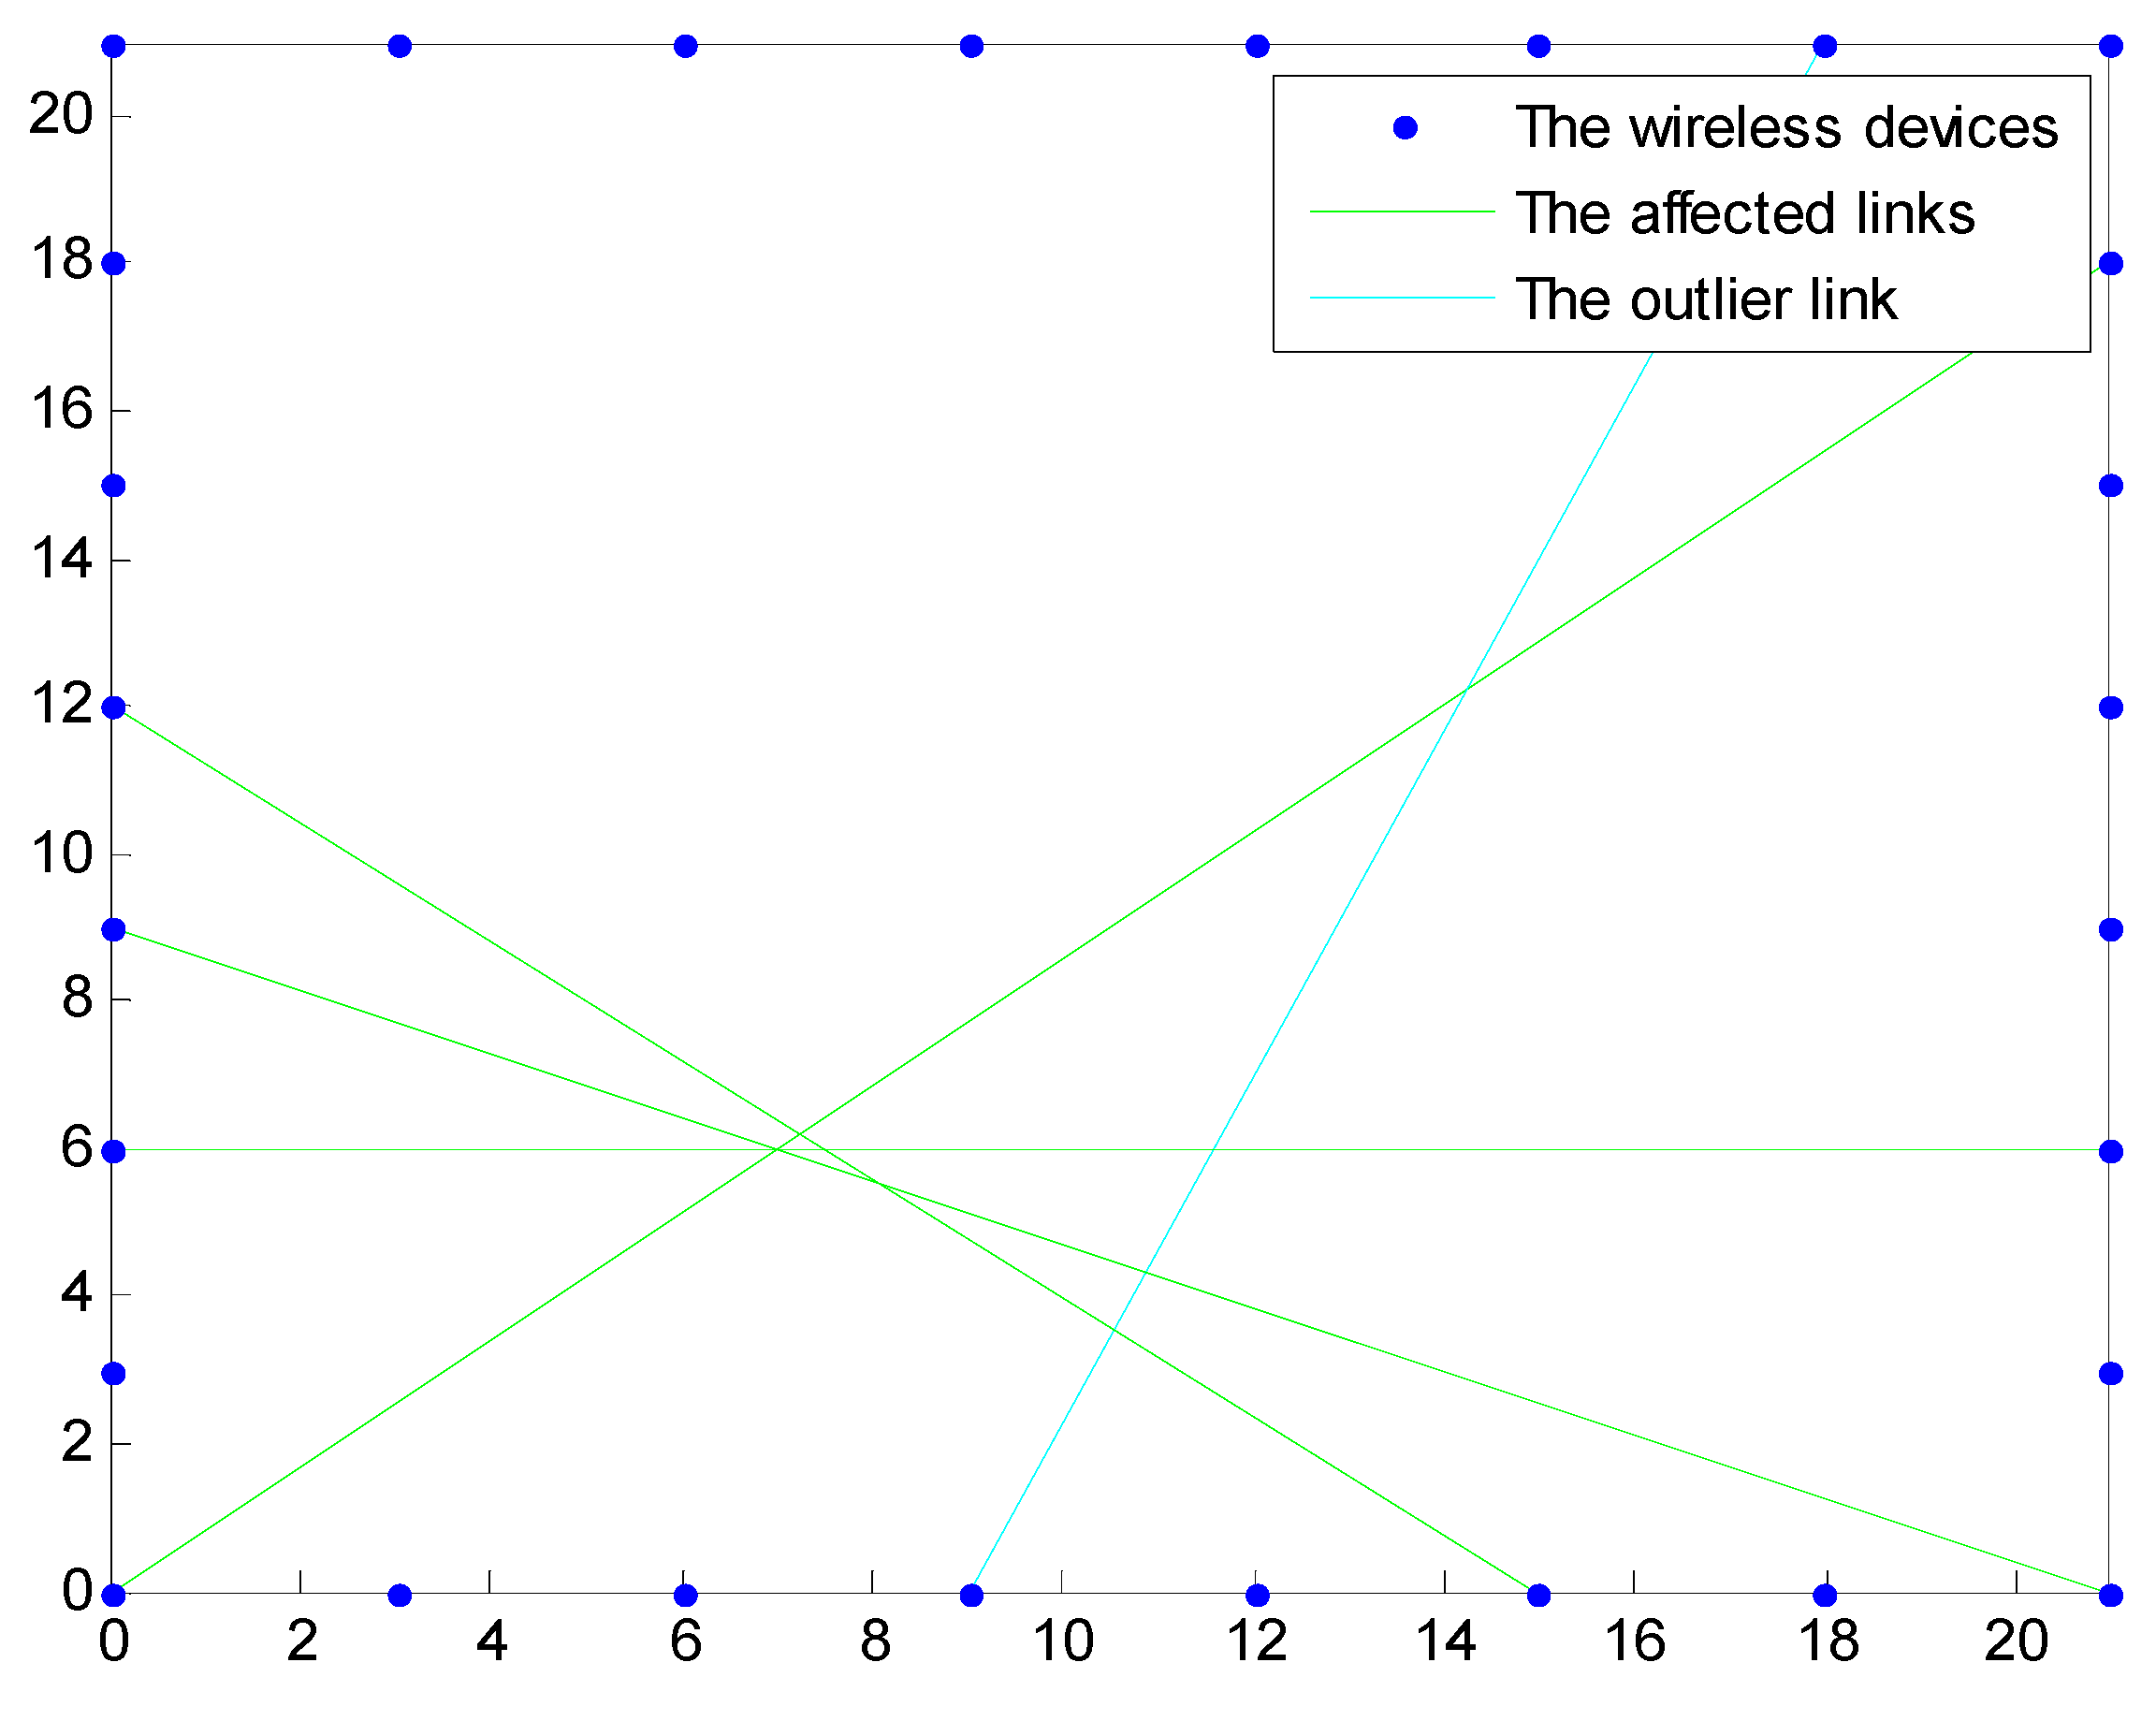
The Euler distance between the “true” location of the target and the estimated location of the target is used as the localization error. The localization errors against different thresholds
are shown in
Figure 6 and
Figure 7 when the threshold for the variance
is 0.5. If
dB, there may be not enough affected links for localization, and the average error of the algorithm increases sharply.
Figure 6.
The errors when γ changes.
Figure 6.
The errors when γ changes.
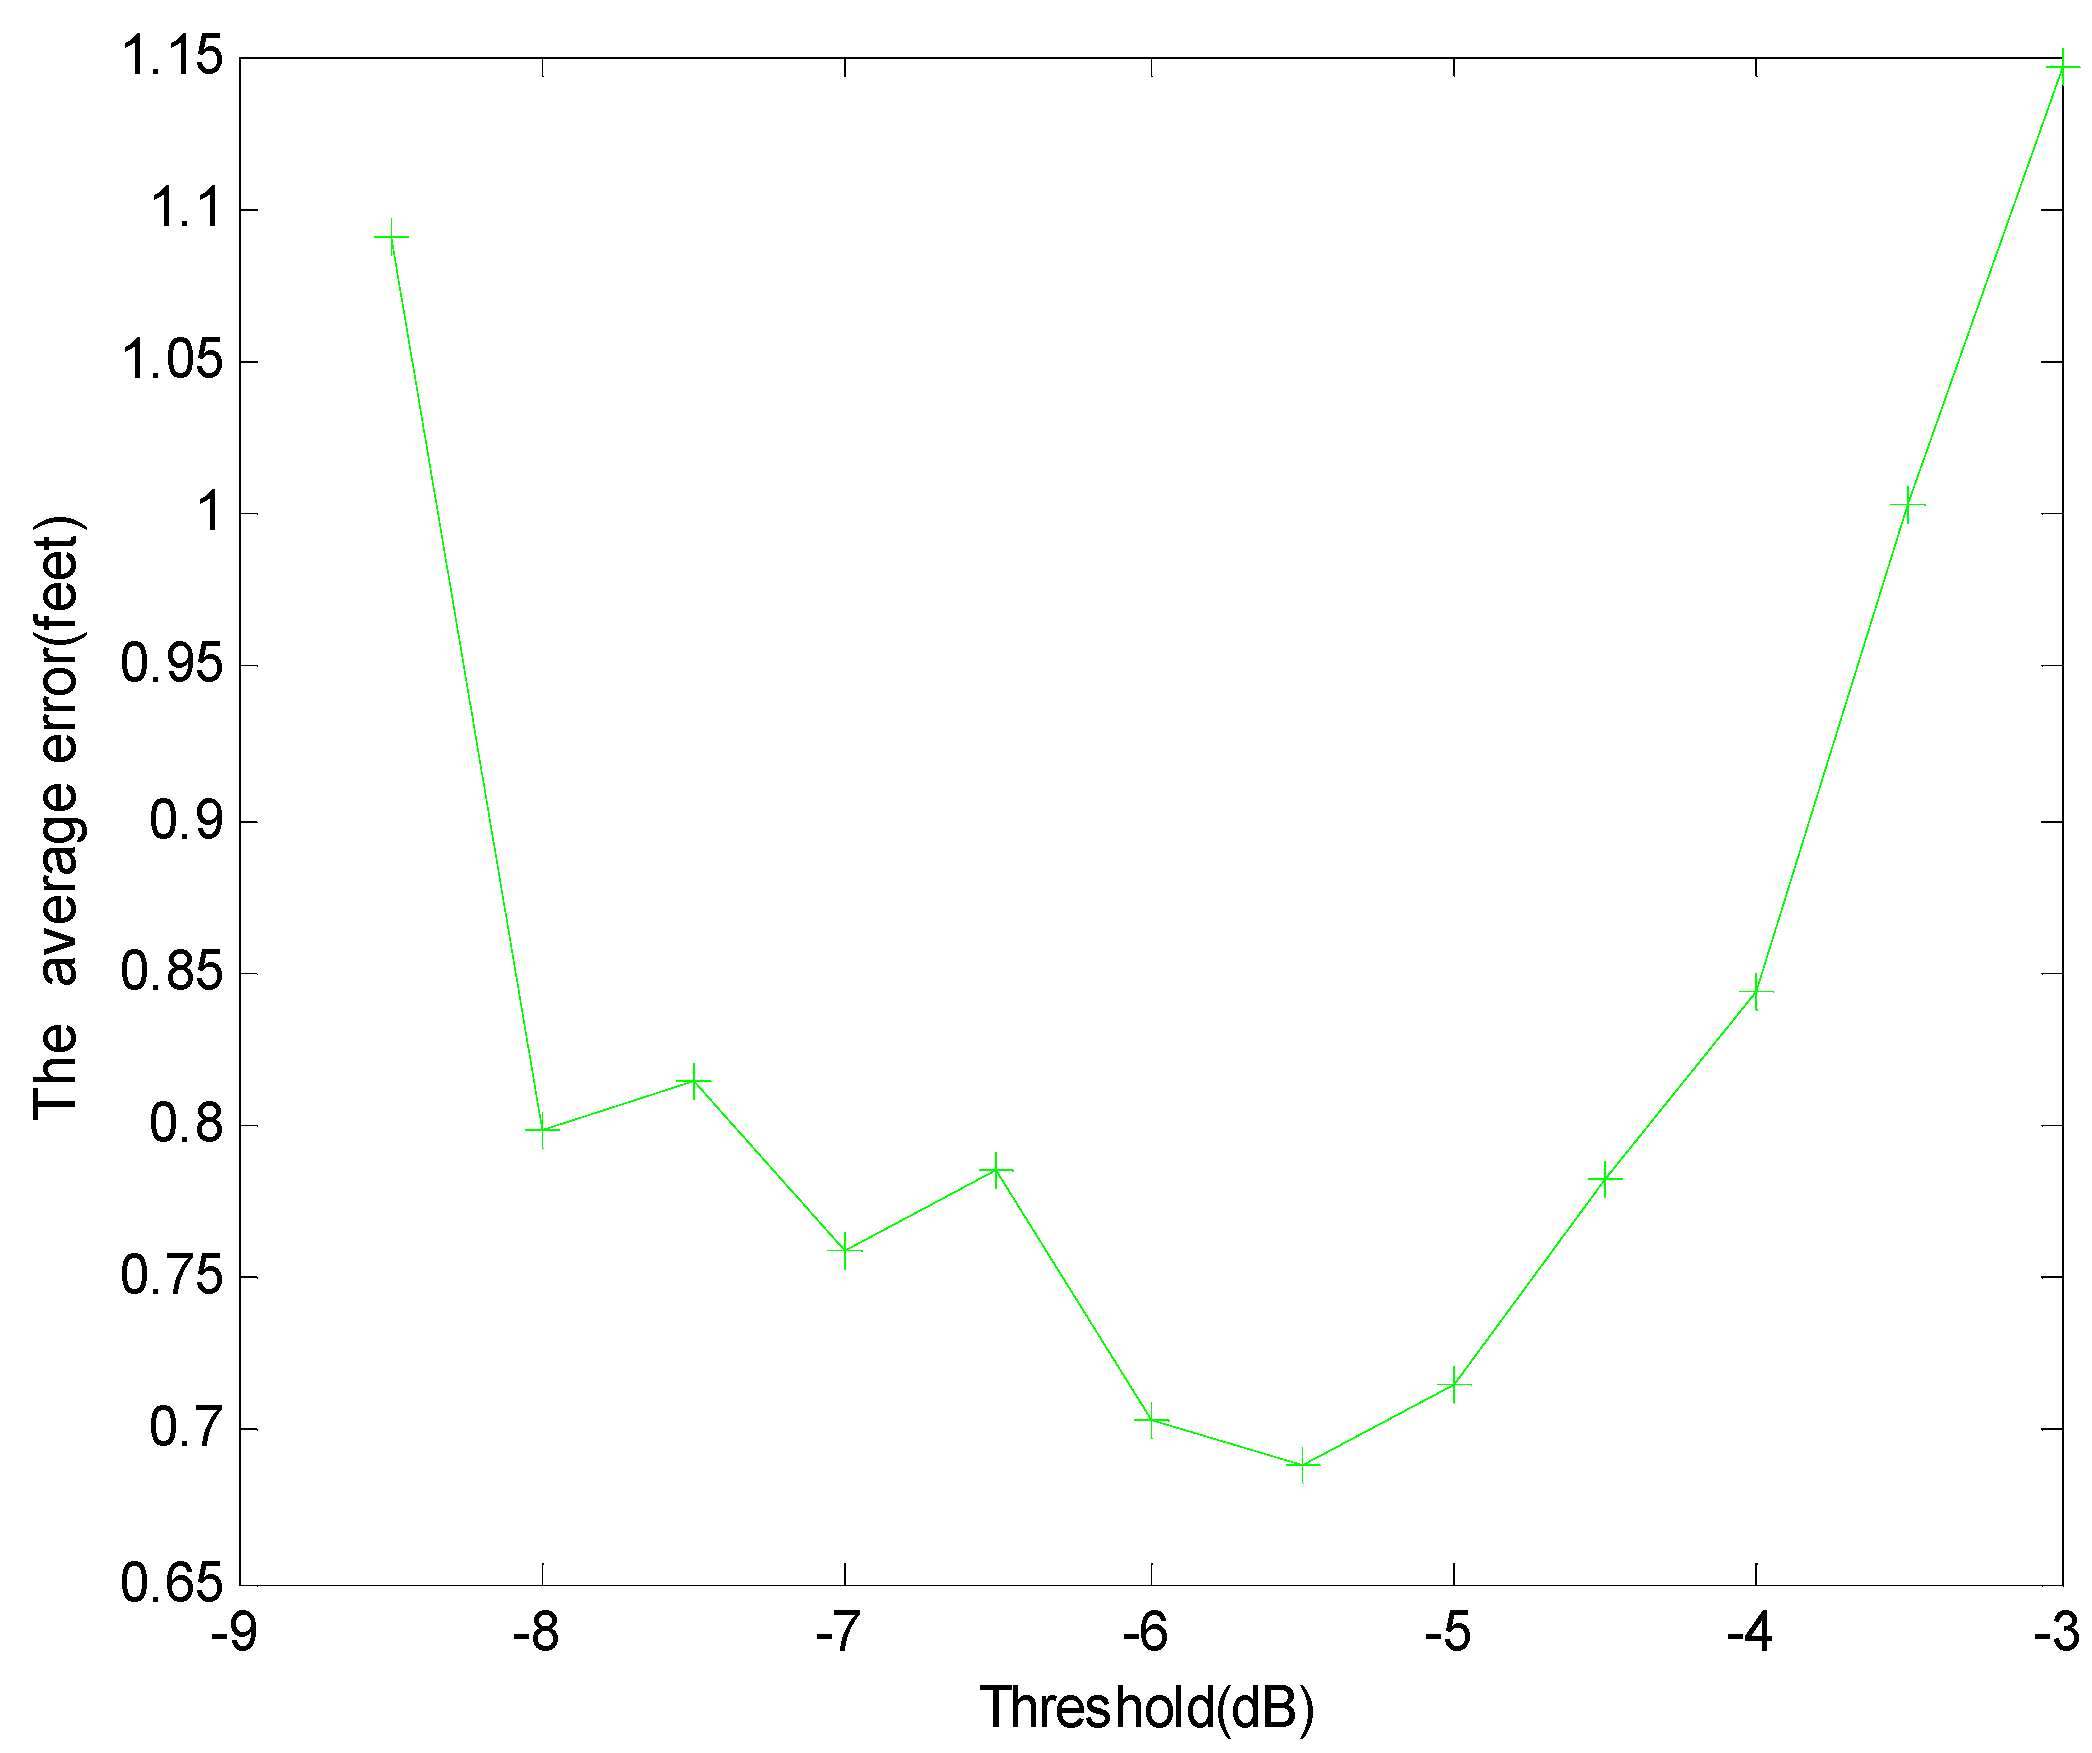
Figure 7.
Average errors for different γ
Figure 7.
Average errors for different γ
Meanwhile, from
Figure 7, due to the uncertain wireless propagation environment, if
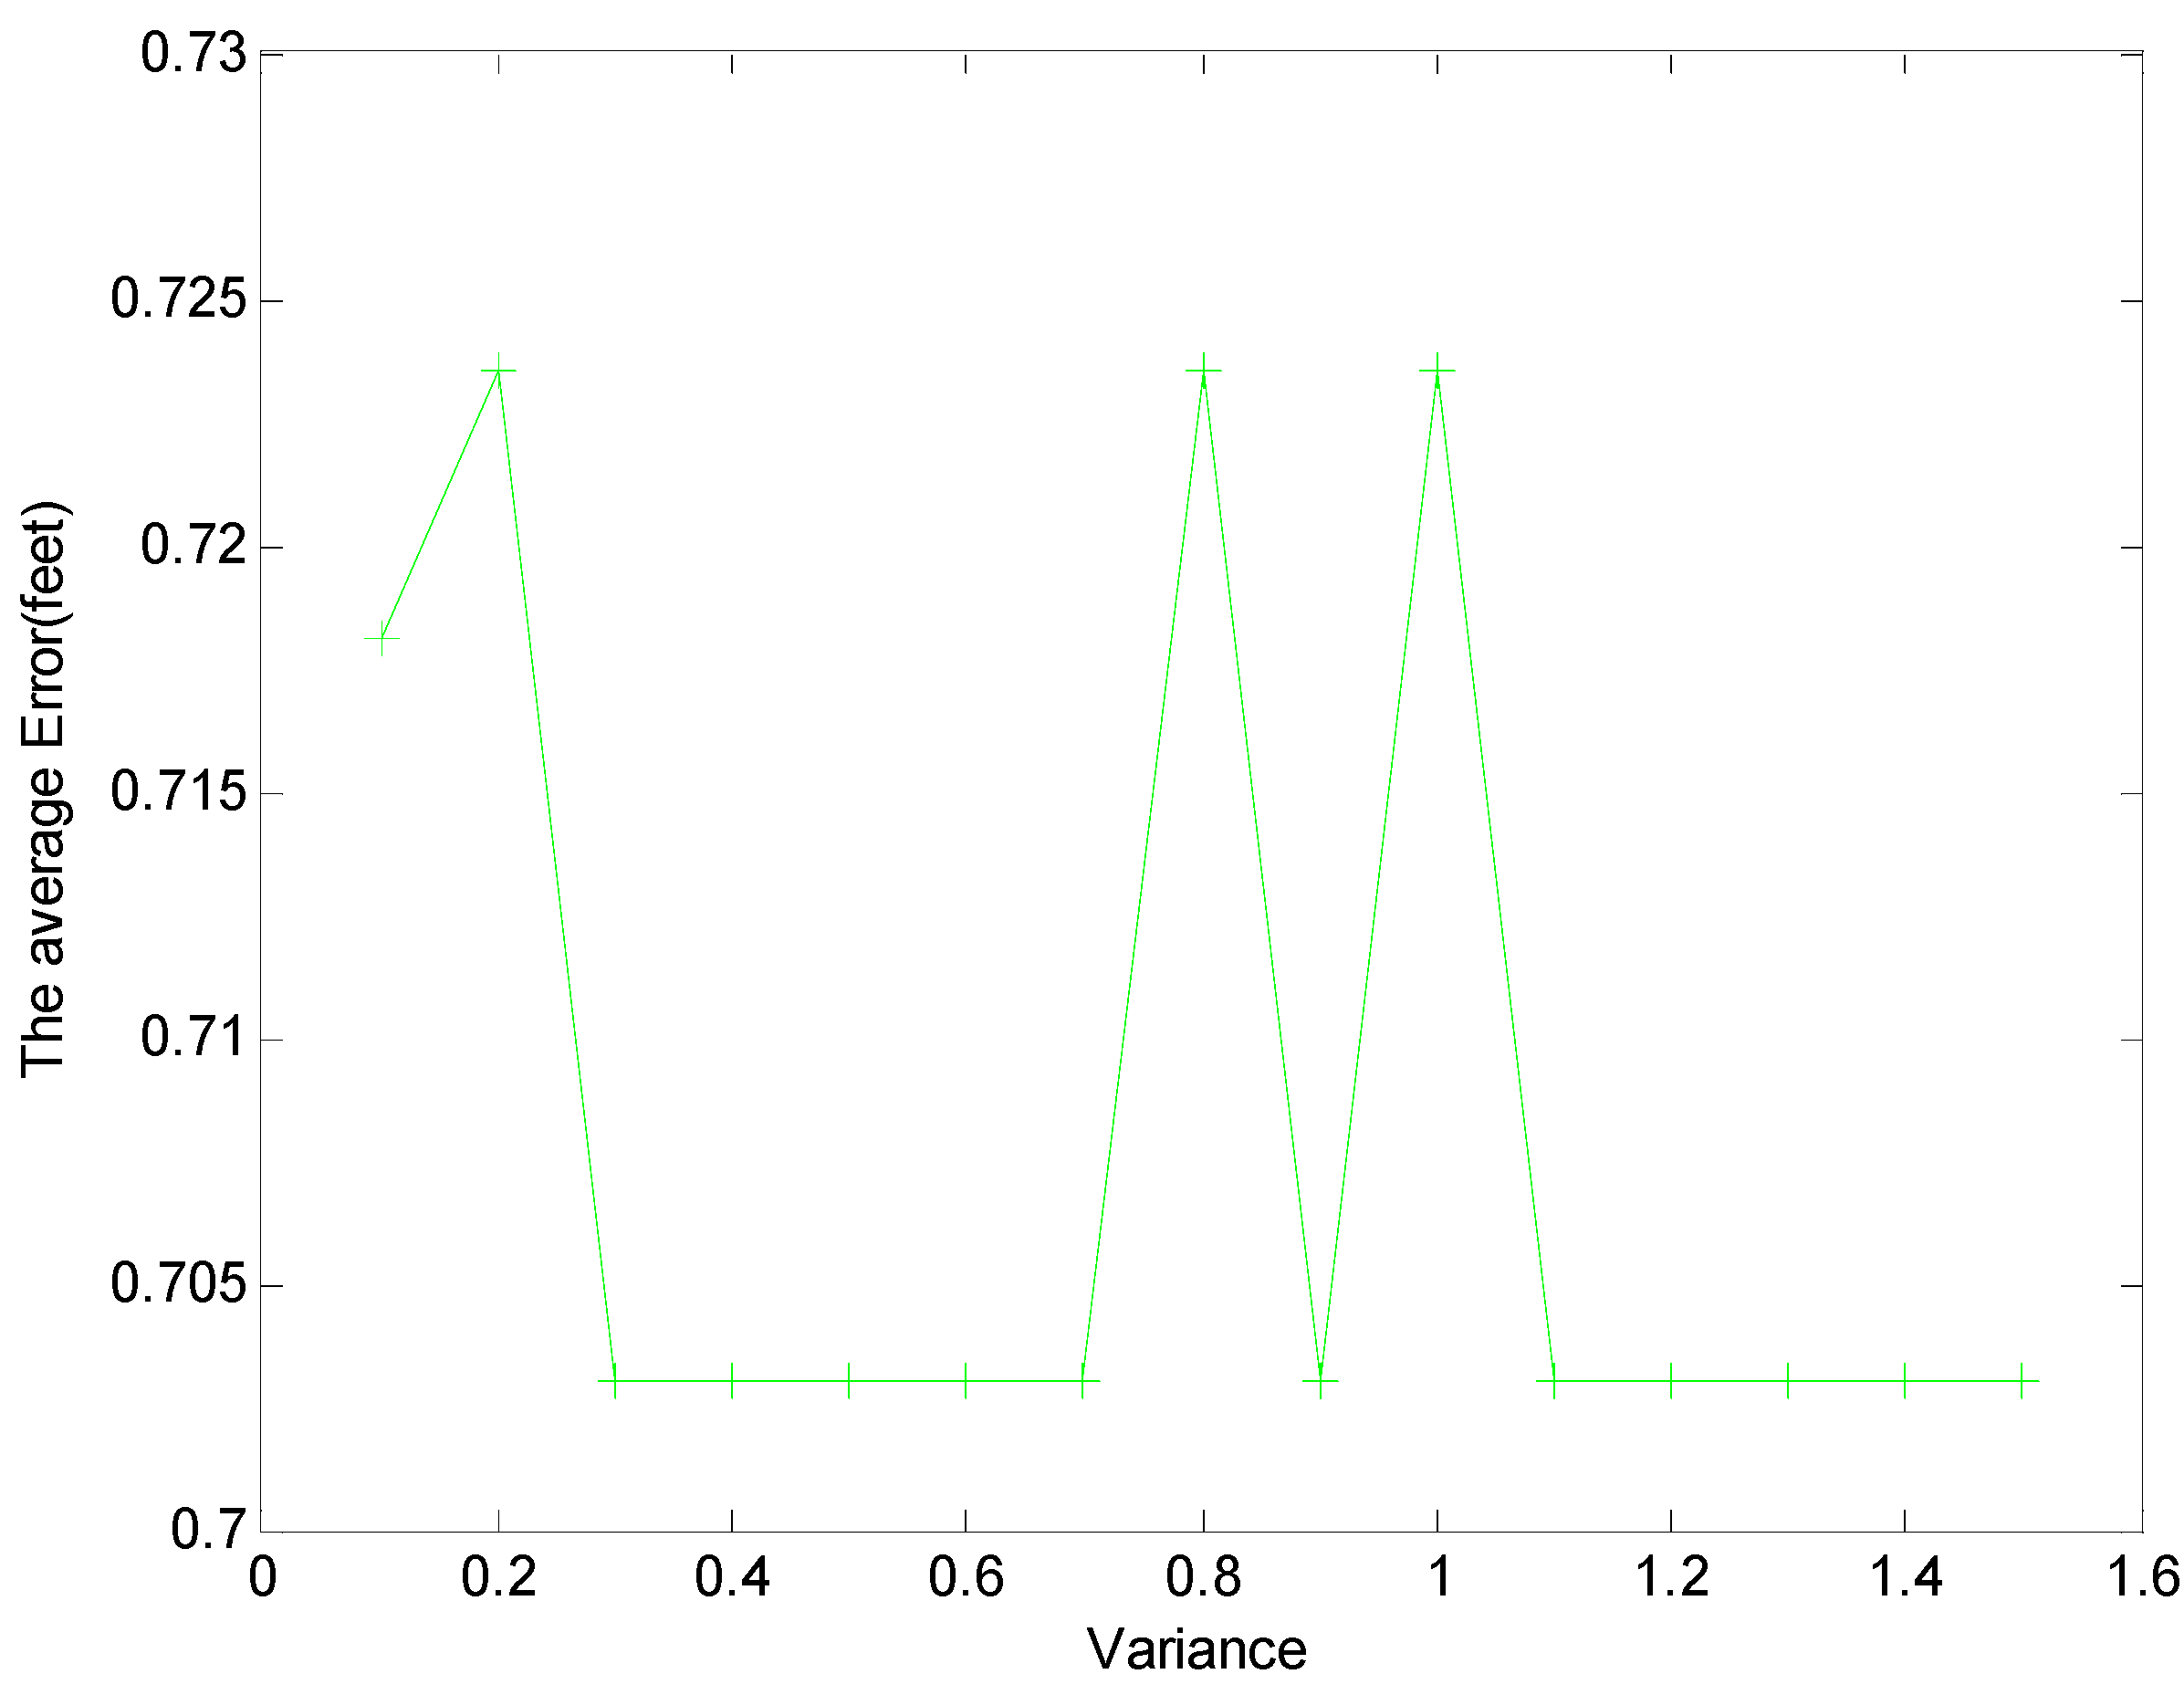
dB, some links with large noise are incorrectly identified as the affected links, the average error of localization will also increase. The localization errors against different thresholds of variance
are shown in
Figure 8 when the threshold
is −6. If
, the outlier state of links
may be incorrectly detected, and the error of localization increases. Nevertheless, if
, an outlier link may be missed, and the error of localization is increased.
Figure 8.
Average errors for the different thresholds of variance (δ).
Figure 8.
Average errors for the different thresholds of variance (δ).


