1. Introduction
The features of a narrow frequency width and fast tunability make DFB-LDs extremely attractive in the areas of communications and optical sensors [
1,
2]. In most cases, the emission wavelength of a DFB-LD is tuned by an injection current at a faster tuning rate that can extend into the megahertz regime, when compared to the temperature tuning method. However, an unwanted optical-intensity modulation will accompany the change of injection current [
3,
4,
5,
6]. It was pointed out that output wavelength and intensity usually respond asynchronously to the fast-changing injection current, and wavelength lags behind intensity for most DFB-LDs [
7]. Such a phase shift always brings a deviation in thedetected signal, such as the residual amplitude modulation noise in harmonic detection technology [
7,
8]. Therefore, to determine this shift is of great importance.
Li
et al. [
7] obtained a phase shift of 0.21π at frequency of 50 kHz with a fiber ring etalon at 1388 nm. Wang
et al. [
6] considered the phase shifts are almost the same at 20 kHz, 30 kHz and 40 kHz, about 0.09π, measured by a phase-generated carrier system with a telecommunication-grade laser at 1550 nm. Both the measurements were based on interferometry and obtained the relation between intensity and wavelength indirectly. However, the measured results can be easily affected by external interference.
Here we propose a convenient approach aimed at measuring such a phase shift mentioned above, which takes advantage of asymmetric absorption positions at the same wavelength but belonging to the wavelength increase and decrease tuning processes in the intensity-time curve with current modulation, respectively. A certain gas absorption line is selected to mark a wavelength in the intensity-time curve. Specifically, when absorption happens, it would reduce the intensity of the transmitted light; therefore, the information of tuning wavelengths can be reflected by such an intensity variation. What is more, within a full and symmetric current tuning circle, the same wavelength will appear twice, during the wavelength increase and decrease tuning processes, respectively, and if there exists a phase shift between output wavelength and intensity, the absorption positions will become asymmetric around the intensity symmetry axis in the transmitted intensity-time curve. The time points where absorption happens can be readily measured, and then the phase shift can be calculated based on the relation between the time points, which is explained in more detail in
Figure 2. Herein we demonstrate the method by measuring the water vapor absorption line at 1368.6 nm with a full width at half maximum of about 0.0348 nm [
9].The wavelength tuning range should be large enough in this measurement method to scan across the absorption line.
2. Basic Statement of the Measurement Method
As shown in
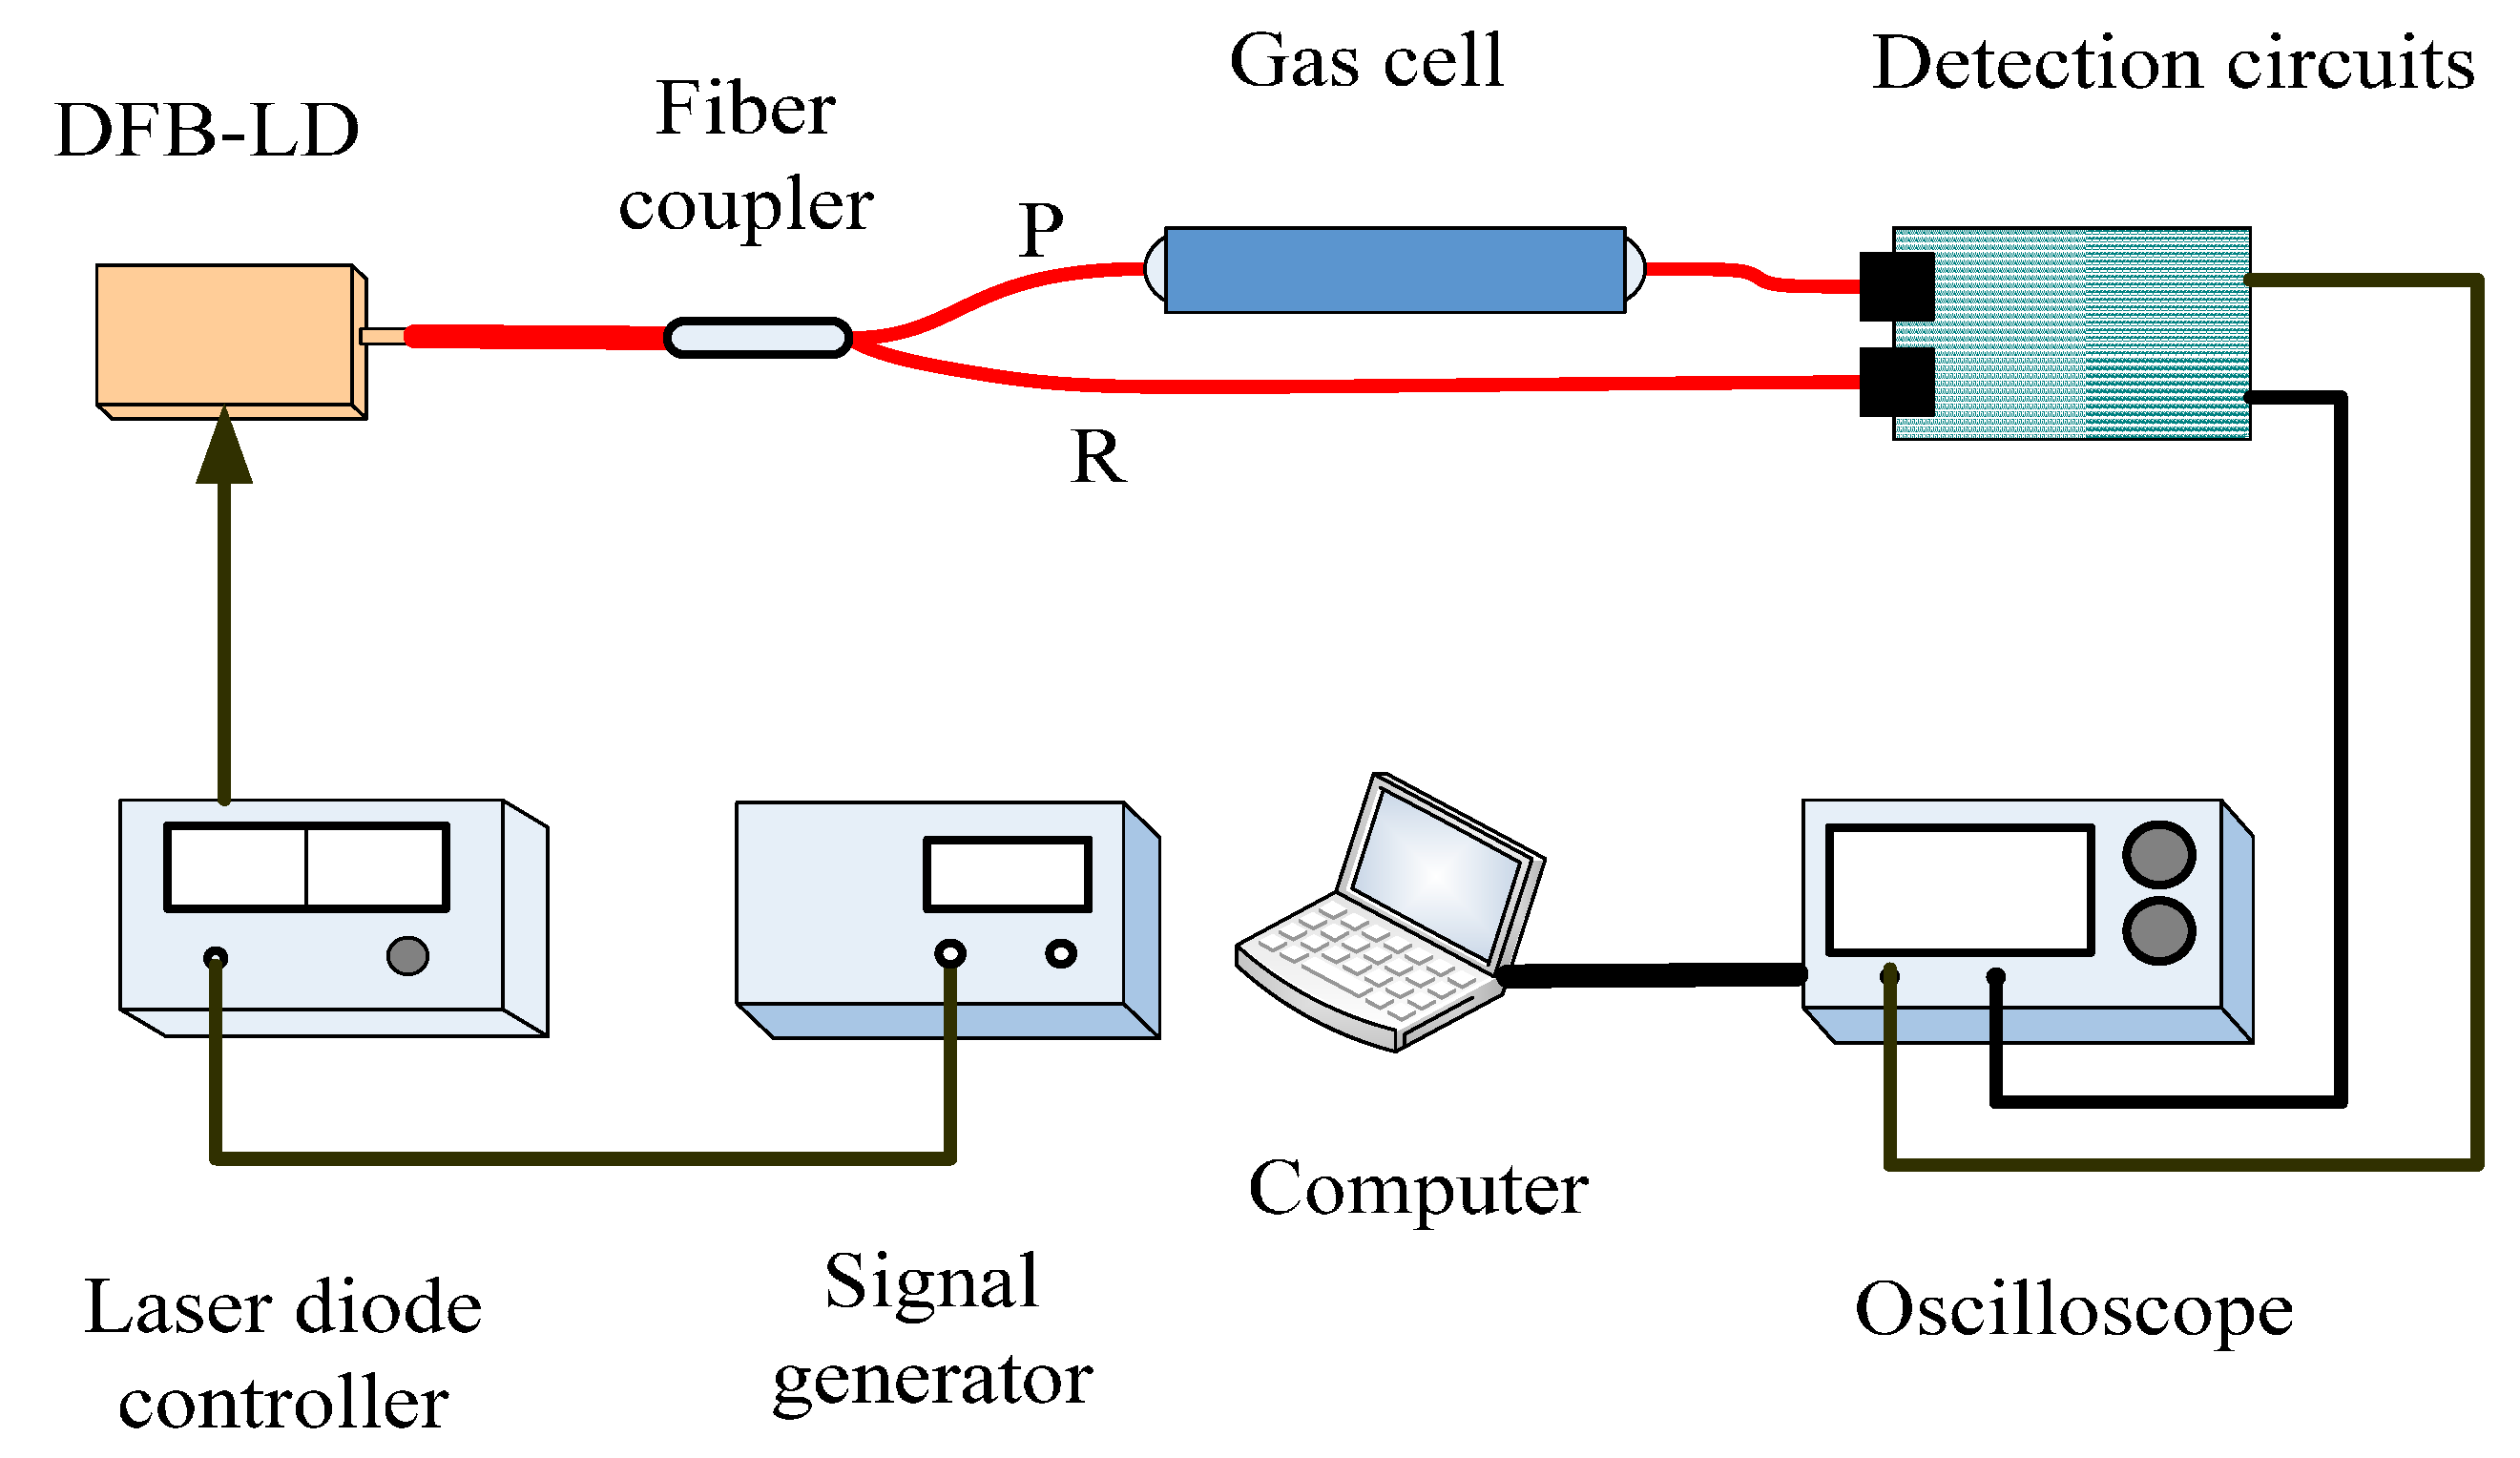
Figure 1, the measurement system is based on the dual-beam optical structure. A DFB-LD (model WSLS-137010C1424-20) operating at 1368.3 nm (at 28 °C with an injection current of 120 mA) is used as the light source, with emission characteristics of 0.1 mW/mA and 0.004nm/mA. A laser diode controller (LDC; model SRS LDC501) is employed to drive the LD with a resolution of 0.001 °C in temperature and a full scale accuracy of ±0.01% in current, which is connected to a signal generator for an external modulation signal with a conversion factor of 25 mA/V. The output light emitted from the DFB-LD is split by a wavelength flattened single-mode 1 × 2 fiber coupler into two paths (P path and R path) with a splitting ratio of 1:1. P path connects a 10-cmgas cell as a probe beam, while R path is used as a reference beam in assist. Light in both paths is detected by two identical InGaAs photo diodes (PDs) and processed with circuits in R minus P mode to get absorption peaks. After further amplification by circuits, the absorption peaks and R path signals are acquired by a digital oscilloscope for analysis with a computer program. The gas cell is placed in the air.
Figure 1.
Structure diagram of TDLAS system: DFB-LD, distributed feedback laser diode; P, R, probe and reference light paths.
Figure 1.
Structure diagram of TDLAS system: DFB-LD, distributed feedback laser diode; P, R, probe and reference light paths.
The DFB-LD is tuned with a sine wave in a large wavelength modulation range (covering the whole absorption line) at central wavelength of 1368.6nm. In view of the delay with respect to the injection current, the time dependent output intensity, wavelength and the phase shift between them can be expressed as:
I(
t) and λ(
t) are the laser output intensity and wavelength; Δ
I and Δλ are the modulation amplitudes; φ
1 and φ
2 are the phase delays of the injection current; λ
c is the central wavelength of the modulation range—ideally it should be the peak wavelength of the selected absorption line, and in implementation, we steadied this wavelength very closely around the ideal value by LDC, and
I0 is average output intensity at λ
c; Δφ is phase shift between output intensity and wavelength.
Target gas absorbs light following the Beer-Lambert law and the transmitted light intensity after gas cell will be:
where
P is the total gas pressure,
S(
T) is the line strength of the selected absorption peak,
N is the mole fraction of the target gas,
L is the gas absorption path length. The equation is based on a Lorentz line shape function with a full width at half maximum of Δυ
L, about 0.0348 nm (0.186 cm
−1) for water 1368.6nm line at normal temperature and pressure, totally included in 0.3 nm (1.6 cm
−1) wavelength tuning range.
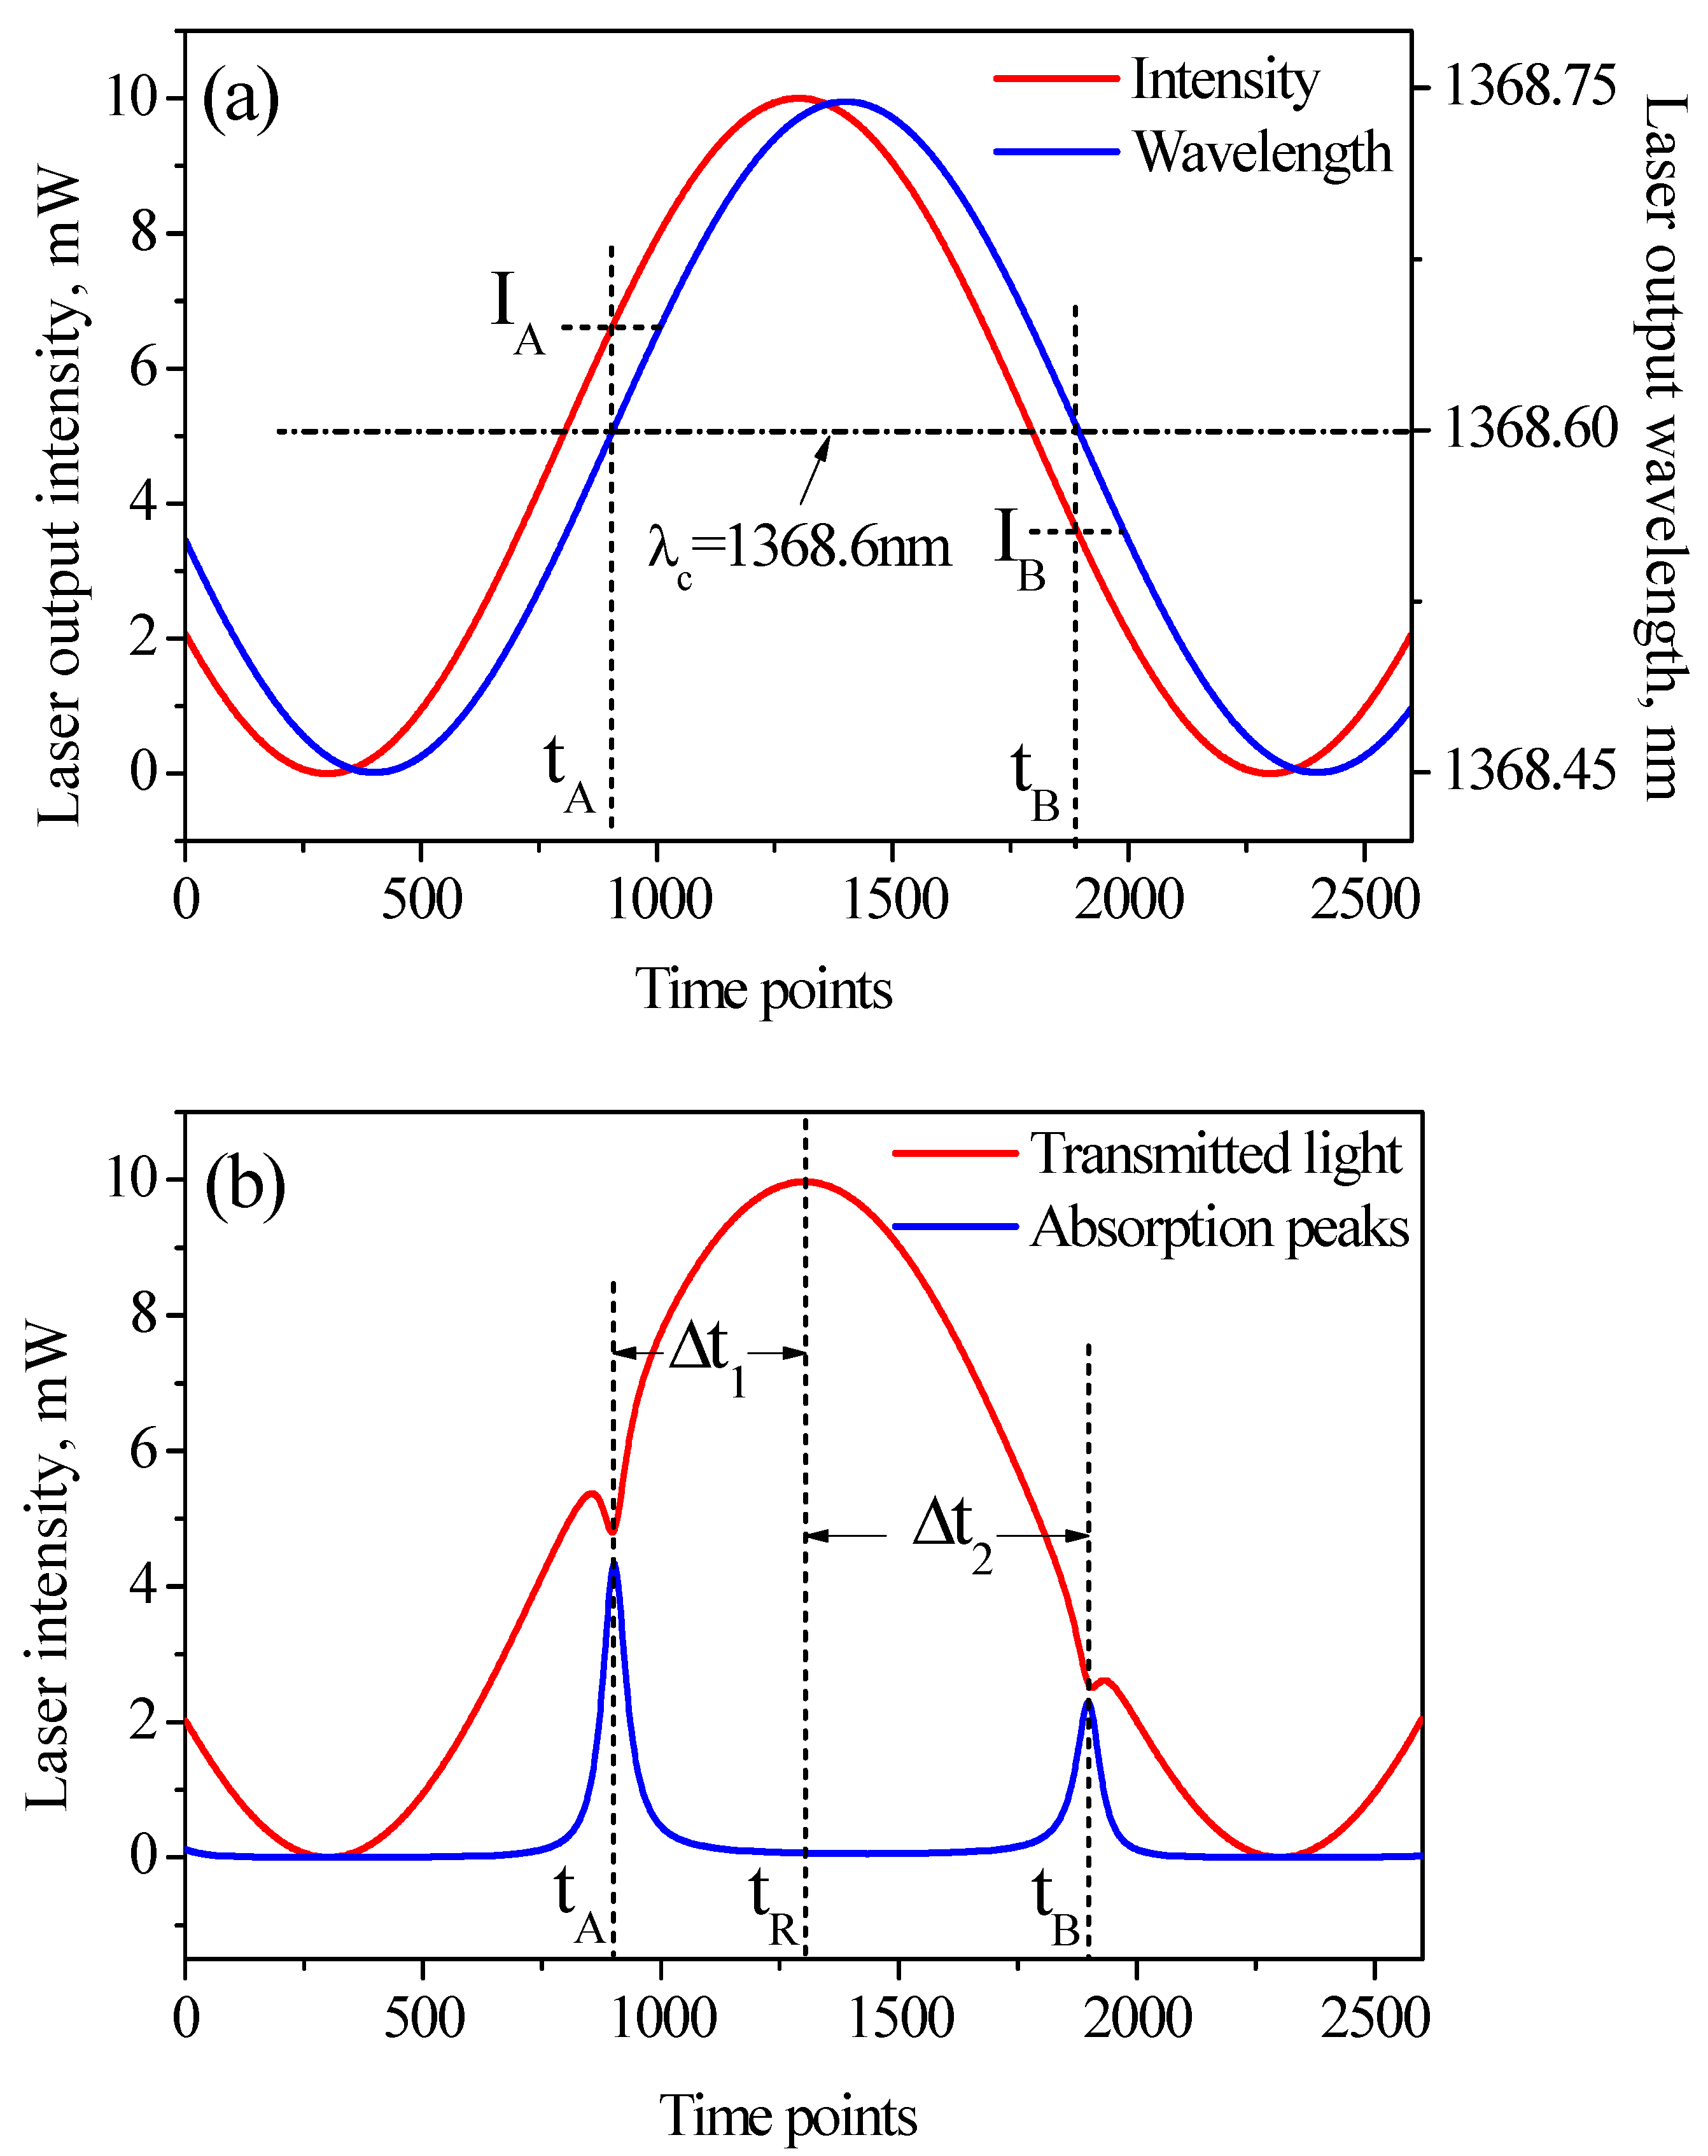
Based on the above equations and conditions, we simulated how the phase shift affects the transmitted light in our system. Assuming that the output wavelength lags behind intensity by 0.1π (
i.e., Δφ
= 0.1π). The time dependent output wavelength and transmitted light intensity would be that shown in
Figure 2. The absorption around 1368.6 nm would appear at
tA and
tB on the rising edge and falling edge, respectively. The related instantaneous laser intensities at the two time points are
IA and
IB, and obviously
IA ≠ IB as is given in
Figure 2a. Namely, the absorption at the same wavelength will happen on
IA and
IB as
Figure 2b shows.
Figure 2.
(a) DFB-LD output intensity (red) and wavelength (blue) with a phase shift of 0.1π; (b) Transmitted light intensity (red) and absorption peaks (blue).
Figure 2.
(a) DFB-LD output intensity (red) and wavelength (blue) with a phase shift of 0.1π; (b) Transmitted light intensity (red) and absorption peaks (blue).
Therefore the phase shift finally gives rise to an asymmetry around the intensity symmetry axis (marked as
tR) on the intensity-time curve with the absorption information. Inversely, we can measure a time shift based on this asymmetric signal:
and the phase shift can be calculated as:
In practical measurements, the P path is subtracted from the R path signal and amplified by circuits to get clear absorption peaks, thus tA and tB can be estimated by extracting the maxima of absorption peaks accurately. tR is estimated by using reference signal (R path), because absorption would influence the maxima extraction on transmitted intensity (P path) when absorption happens nearby.
3. Measurement Experiments and Results
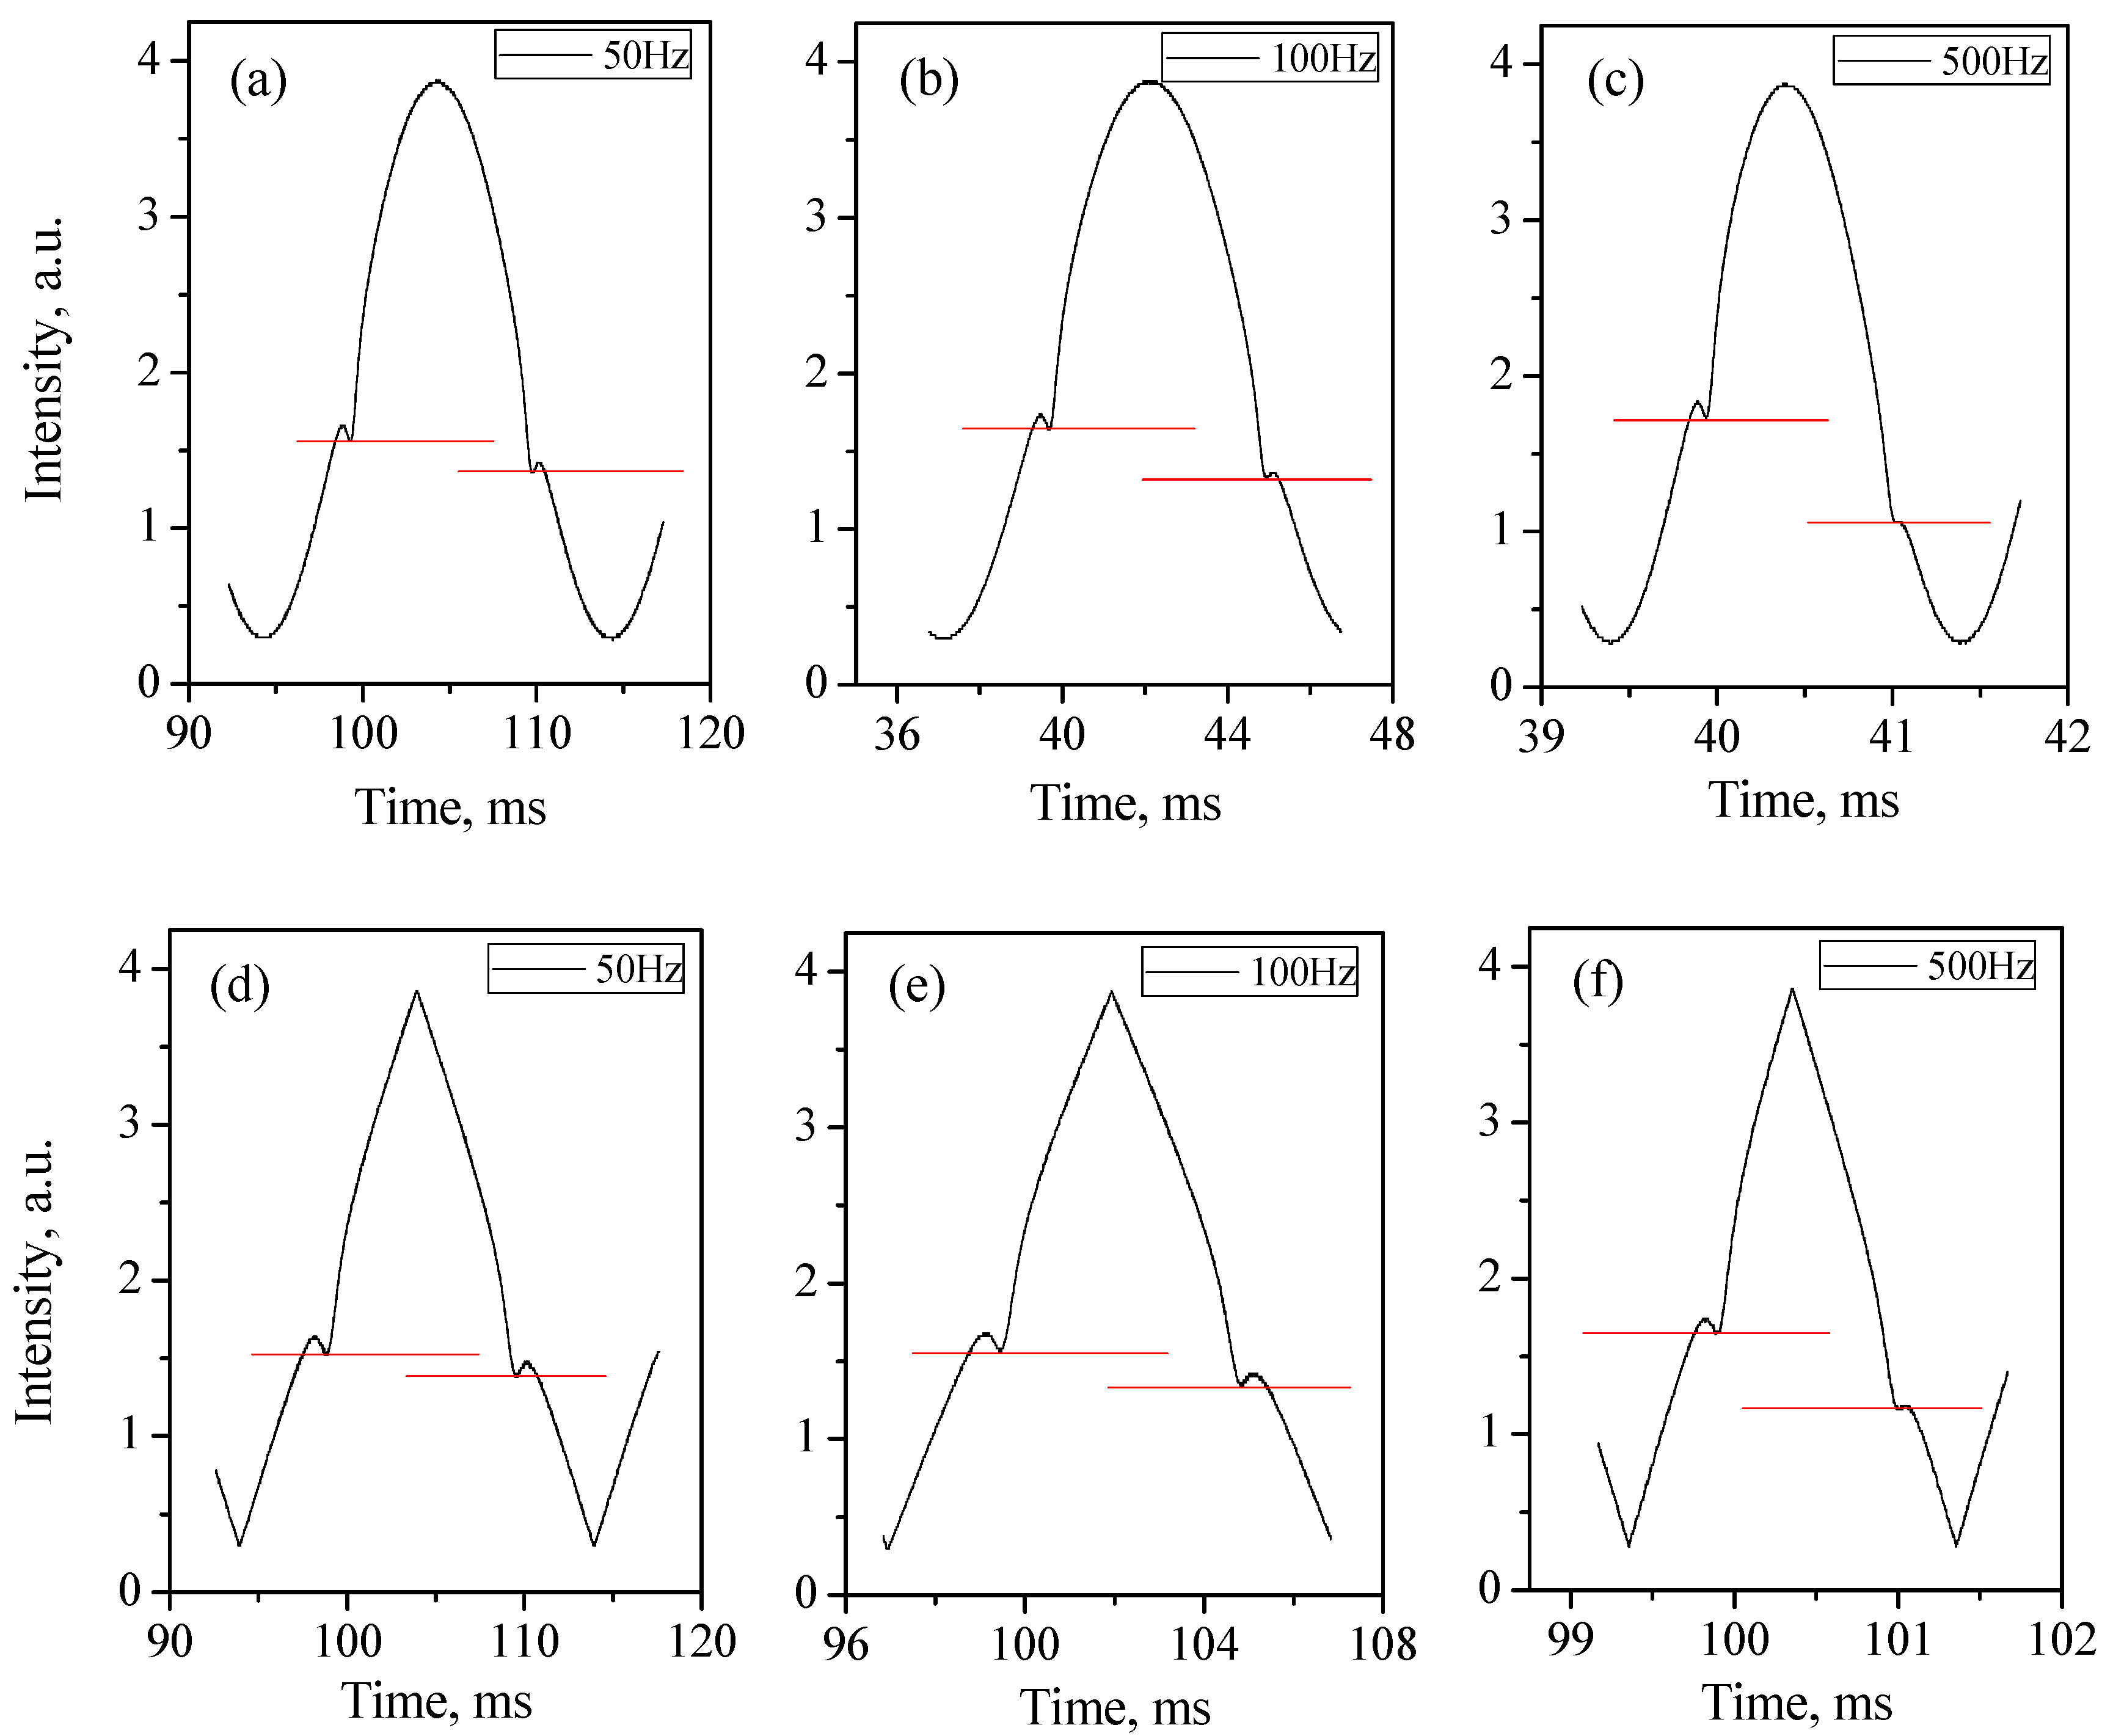
In the following experiments, we adopted a sine wave and triangle wave as modulation waveforms, respectively. The generated wave amplitude is 3 V, providing a wavelength tuning range of about 0.3 nm for our DFB-LD. As the frequency is increased from 50 Hz to 500 Hz, the transmitted intensity asymmetry becomes greater, as
Figure 3 shows.
Figure 3.
Transmitted intensity-time curves of sine and triangle modulation cases respectively at 50 Hz, 100 Hz and 500 Hz, specifically, (a) Sine wave modulation at 50 Hz; (b) Sine wave modulation at 100 Hz; (c) Sine wave modulation at 500 Hz; (d) Triangle wave modulation at 50 Hz; (e) Triangle wave modulation at 100 Hz; (f) Triangle wave modulation at 500 Hz.
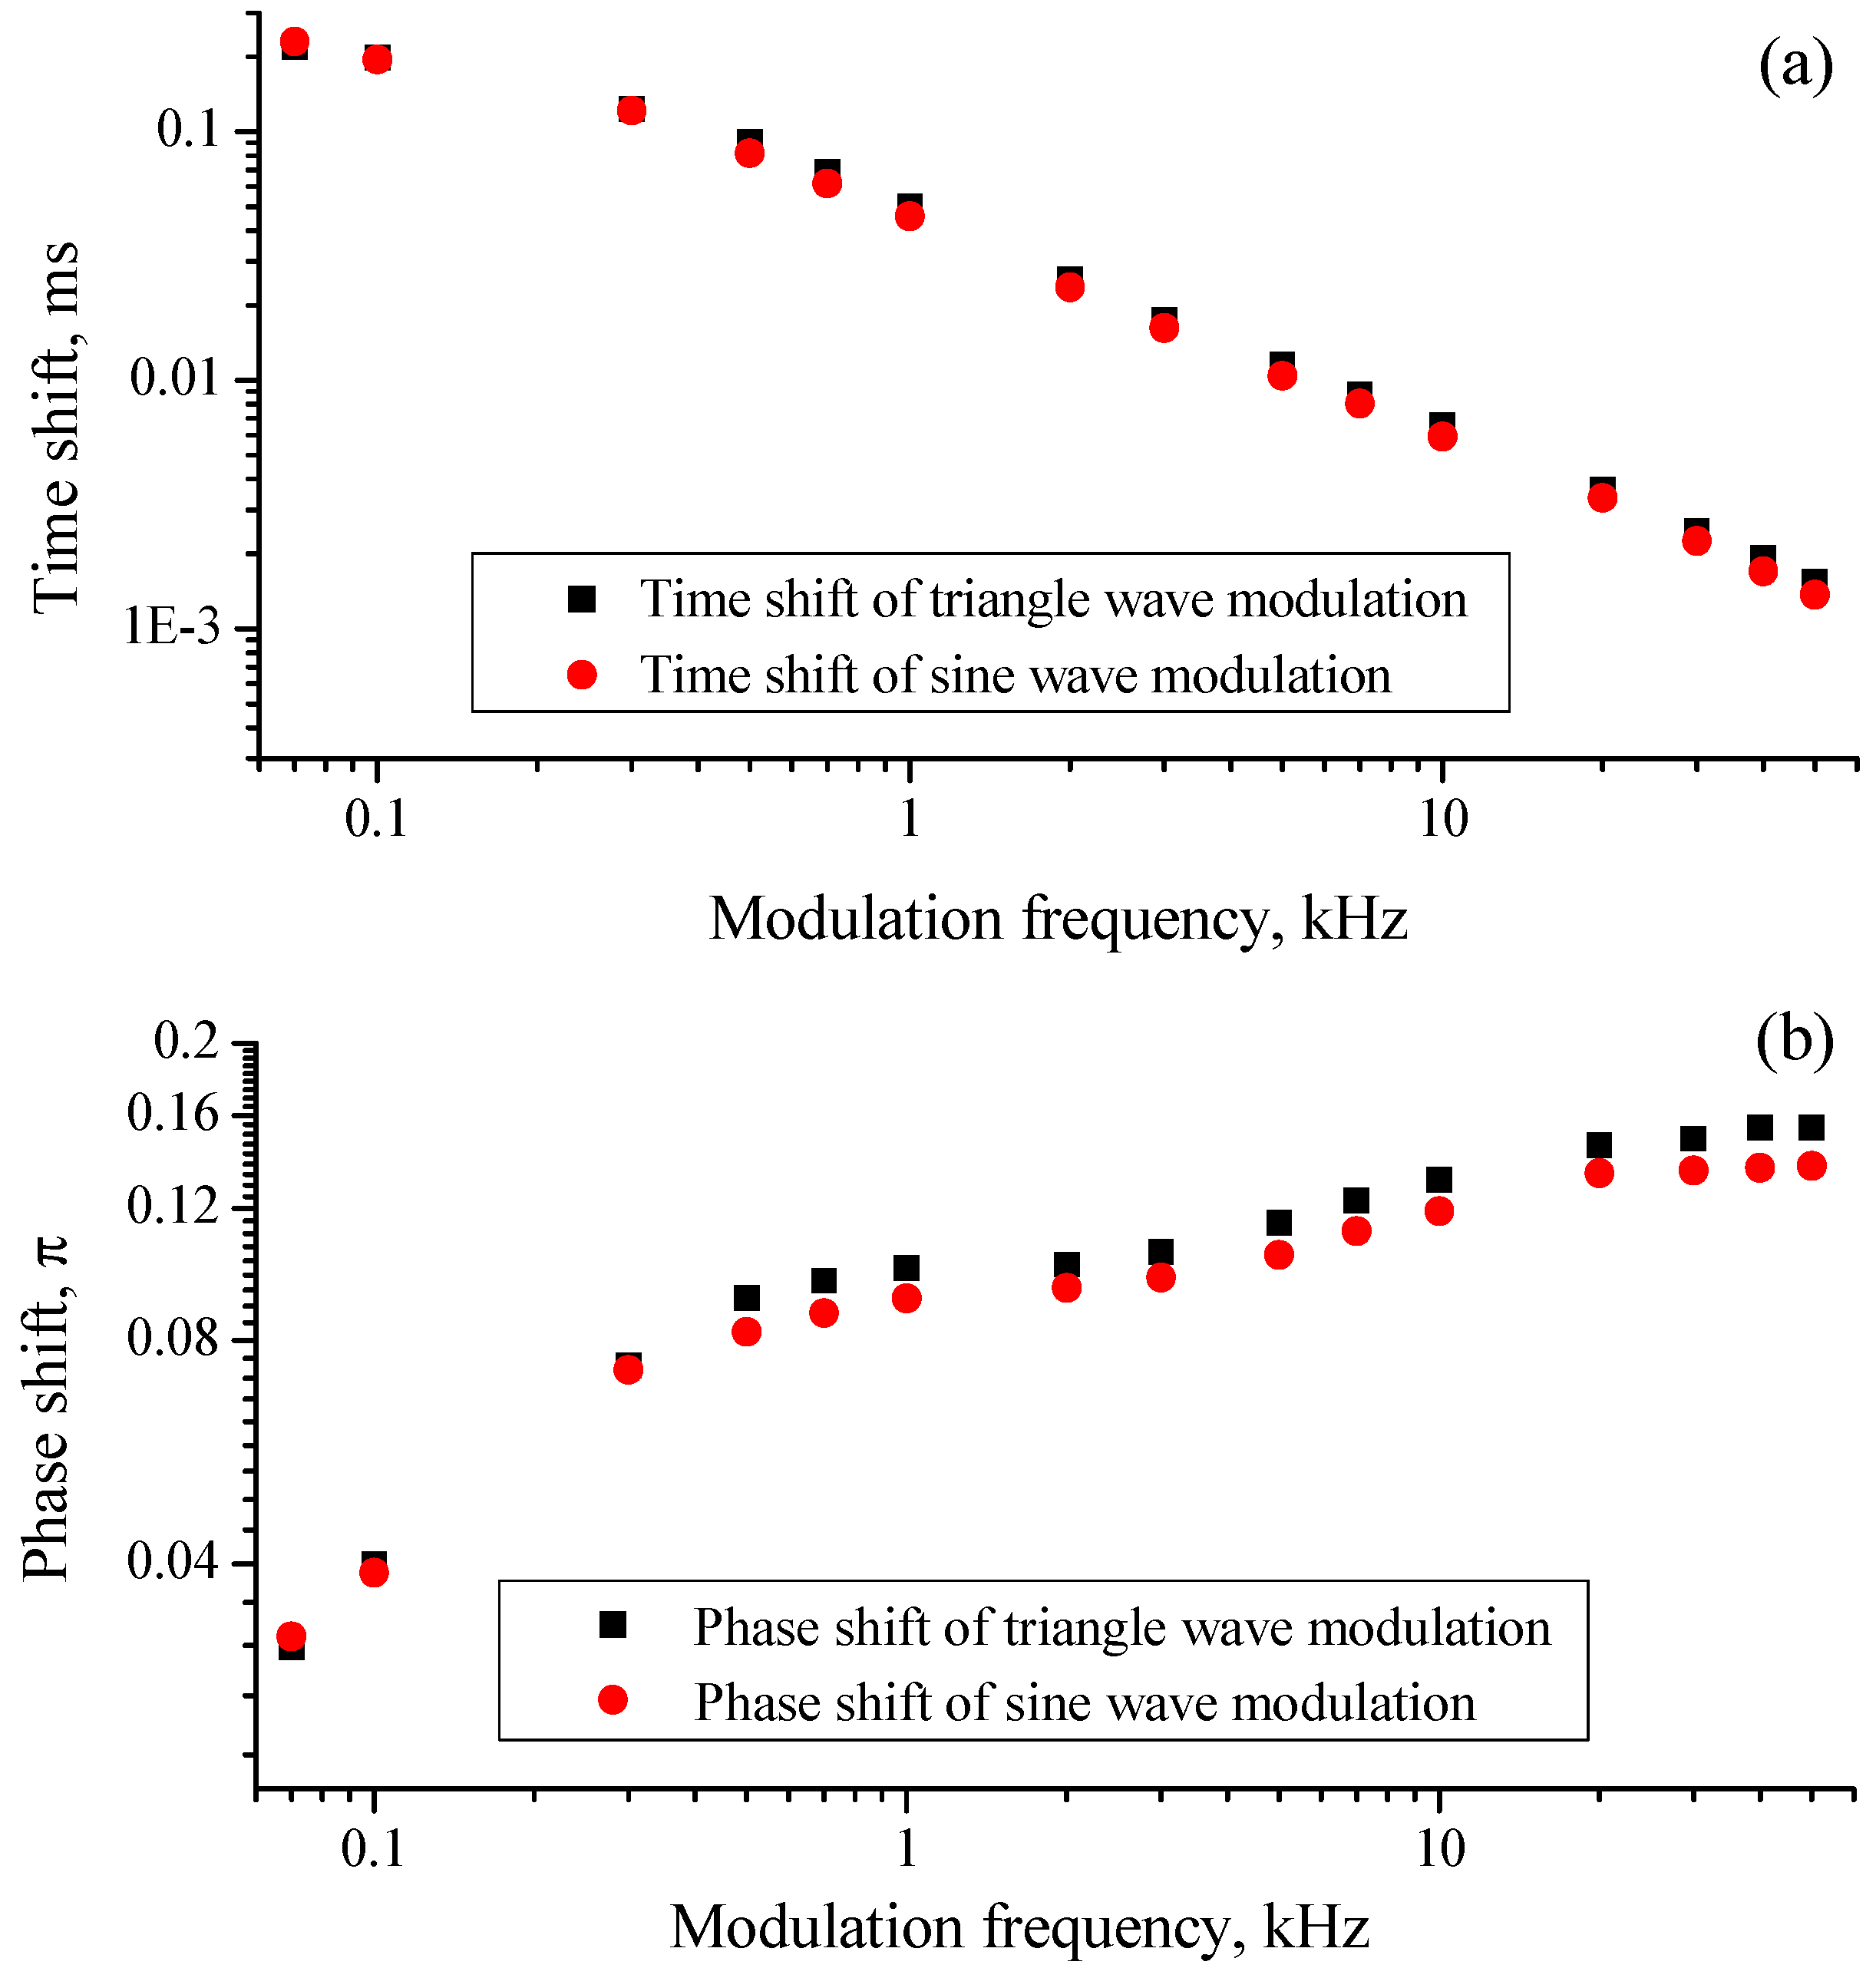
On the transmitted intensity-time curve, the absorption caused by the 1368.6-nm absorption line happened at different positions in the same modulation step, and the experiment data shown that as modulation frequency increased the phase shifts between output wavelength and intensity increased as well. Based on the above system and conditions, phase shifts between output intensity and wavelength were measured at modulation frequencies from 50 Hz to 50 kHz. For 1 kHz modulation, shift values were 0.1π and 0.091π, respectively, for the triangle wave and sine wave with a resolution of 0.001π. More measurement results are detailed in
Figure 4. For both modulation waveforms, phase shifts increased with a slowed growth rate as modulation frequency increased. Shift value of triangle wave modulation was a little greater than that of sine wave at the same modulation frequency, shown in
Figure 4b. This disparity should be on account of two reasons, one is the individual response of DFB-LD to the different current change rates of triangle and sine wave modulation forms, the other is the fact that triangle wave contains harmonics (fundamental frequency and its multiple frequencies) and the phase shift increases with frequency.
Figure 4.
(a) Time shift of triangle wave modulation (black square) and sine wave modulation (red dot) at modulation frequencies from 50 Hz to 50 kHz; (b) Phase shift of triangle wave modulation (black square) and sine wave modulation (red dot) at modulation frequencies from 50 Hz to 50 kHz. All the axes are logarithmically scaled.
The accuracy of the phase shift measurement above depends on the parameters of the hardware system and data processing method used, while the performance of the analog circuits and data acquisition (digital oscilloscope) play a decisive role. Specifically, measurement accuracy of three time points (
tA,
tB, and
tR) determines the system accuracy. However, the noise of each time point measurement is independent, referring to the relation in Equation (5), the total system noise may increase or decrease because of such independence and randomness. In view of the fact that measurement of
tB suffered the greater noise (absorption peak related to
tB will become weaker with frequency increases), we considered the measurement accuracy of
tB as the system accuracy superficially and discuss it particularly. For normal temperature and pressure, gas absorption line obeys Lorentz line shape, and the absorption can be expressed as:
where
Ipeak(
t) is the intensity of absorption peaks,
G is the circuit gain, and
v(
t) is the wavenumber. The measurement signal to noise ratio (
SNR) of the above absorption peak is:
where
Ipeak is the absorption peak maximum, and
Inoise is the noise detected by the digital oscilloscope. Data points nearby the peak maximumat such a noise level allow theerror extraction by the program. Based on the above Equations (7)–(10) and the fact
I(
t) ≈
I0of the nearby peak, we can obtain an error wavelength range corresponding to the range of absorption peak intensity from
Ipeak −
Inoiseto
Ipeak, and express it as:
To explain this more clearly, we define some parameters: in one complete modulation cycle (at frequency of
f), the LD is tuned across a tuning range of
W which can overlap the absorption line twice, and the absorption peaks in one complete modulation cycle are sampled to
N points by the digital oscilloscope with a sampling rate of
S. Taking Δυ as an intermediate parameter, the measuring accuracy can be finally defined as:
and the theoretical resolution should be:
Equation (12) indicates that the phase shift measuring accuracy is strongly decided by the signal to noise ratio of the intensity detection. In our experiment, the nominal oscilloscope sampling rate is 2 GS/s, while the actual sampling rate differed with the modulation frequency due to our options for choosing a suitable number of data points. Here,we take 50 kHz sinewave modulation as an example. For N = 2500, f = 50 kHz, S = 100 MS/s, W = 3.2 cm−1, SNR ≈ 41 (Ipeak = 1.16 V, Inoise = 28 mV), ΔυL = 0.186 cm−1, then the measurement accuracy in this case approximates 0.01π (the calculated result is φ0 = 0.011π). Meanwhile, with the same conditions, a triangle wave modulation at 50 kHz had a worse SNR of 32 (Ipeak = 0.873 V, Inoise = 27 mV), and its measurement accuracy is calculated to be φ0 = 0.013π, bigger than that of the sine form. In practice, noise analysis should be more complex, and the measurement accuracy was a little worse than the calculated value. Additionally, good data processing step by theprogram, such as smoothing, should be very helpful for improving the accuracy.


