Device Centric Throughput and QoS Optimization for IoTsin a Smart Building Using CRN-Techniques


Abstract
:1. Introduction
- An optimization problem is formulated for the channel assignment to different SUs (i.e., IoT devices, mobile user) in a smart building environment. The objective is to serve the maximum SUs while satisfying their desired QoS.
- The optimization problem considers the number of QoS parameters (e.g., data rate, bit error rate and channel stability index) while taking into account the availability of channels by the PU activity and traffic patterns for different IoT applications.
- A novel particle swarm optimization-based algorithm is proposed to solve the optimization problem.
- To evaluate the performance of the proposed algorithm, exhaustive simulations are carried out by varying different parameters (e.g., the number of channels, the number of devices under scenarios where each IoT device uses different applications).
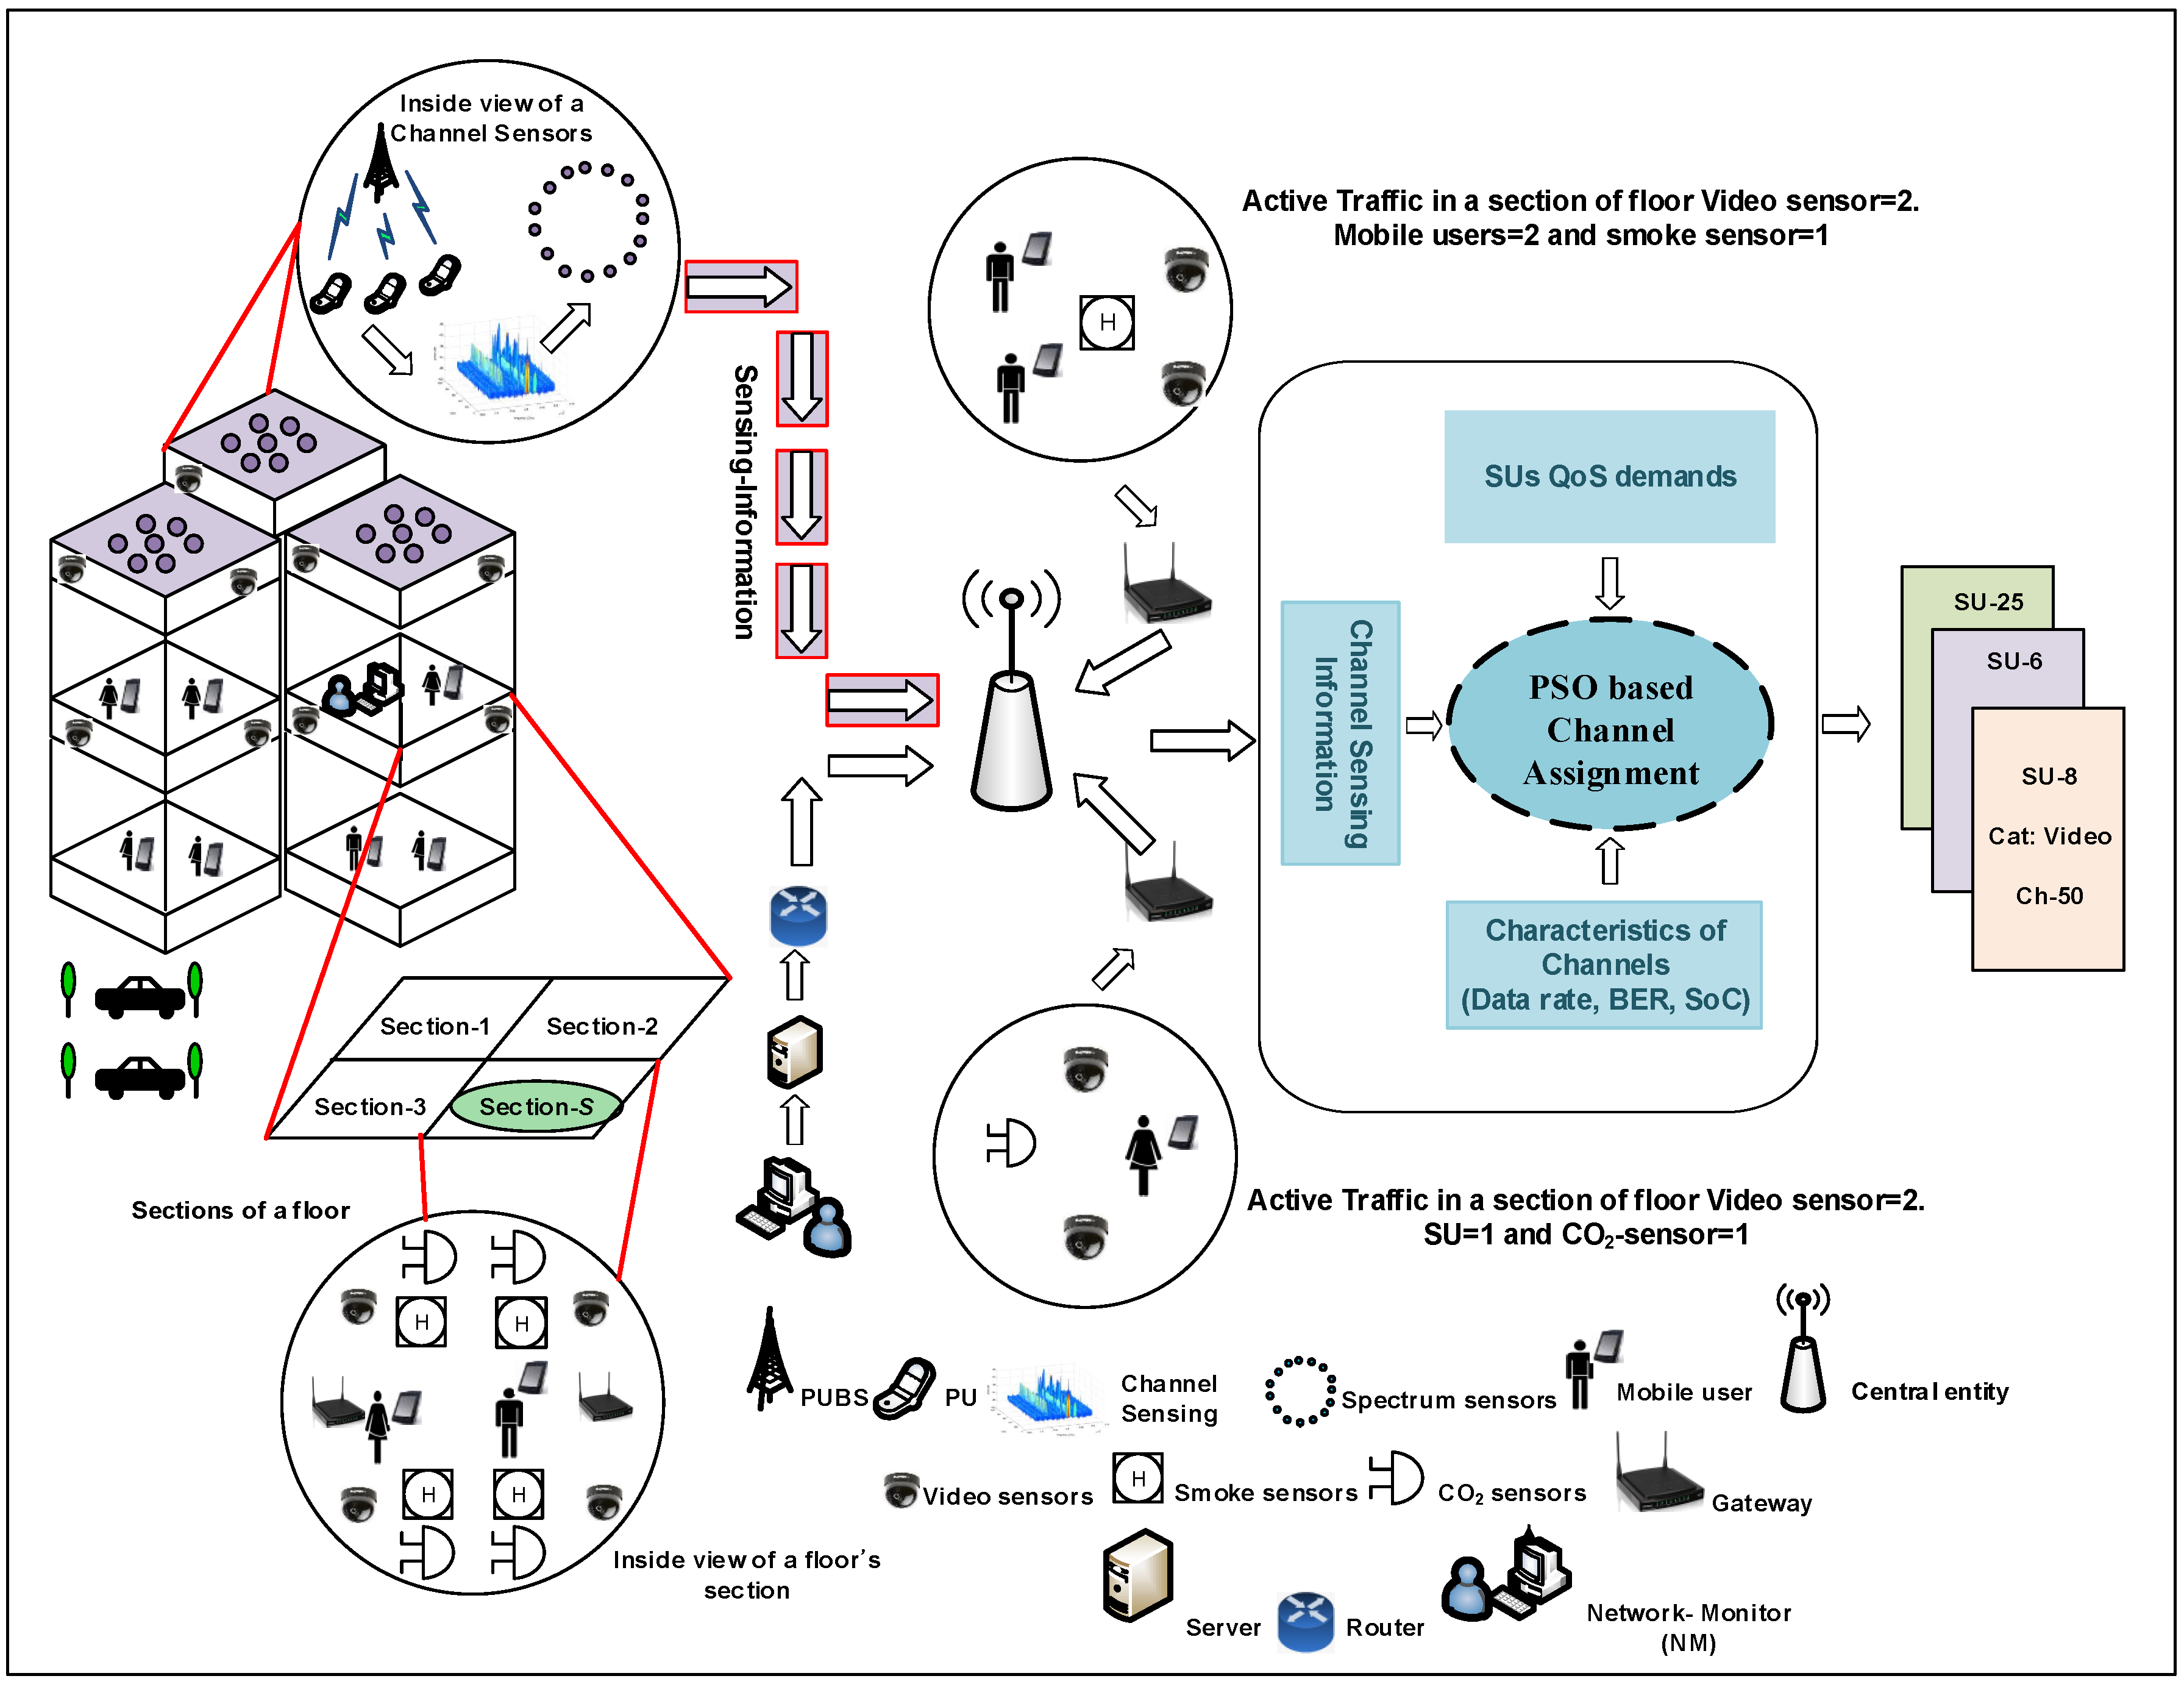
2. System Model
2.1. Capacity and Bit Error Rate
2.2. Spectrum Sensing
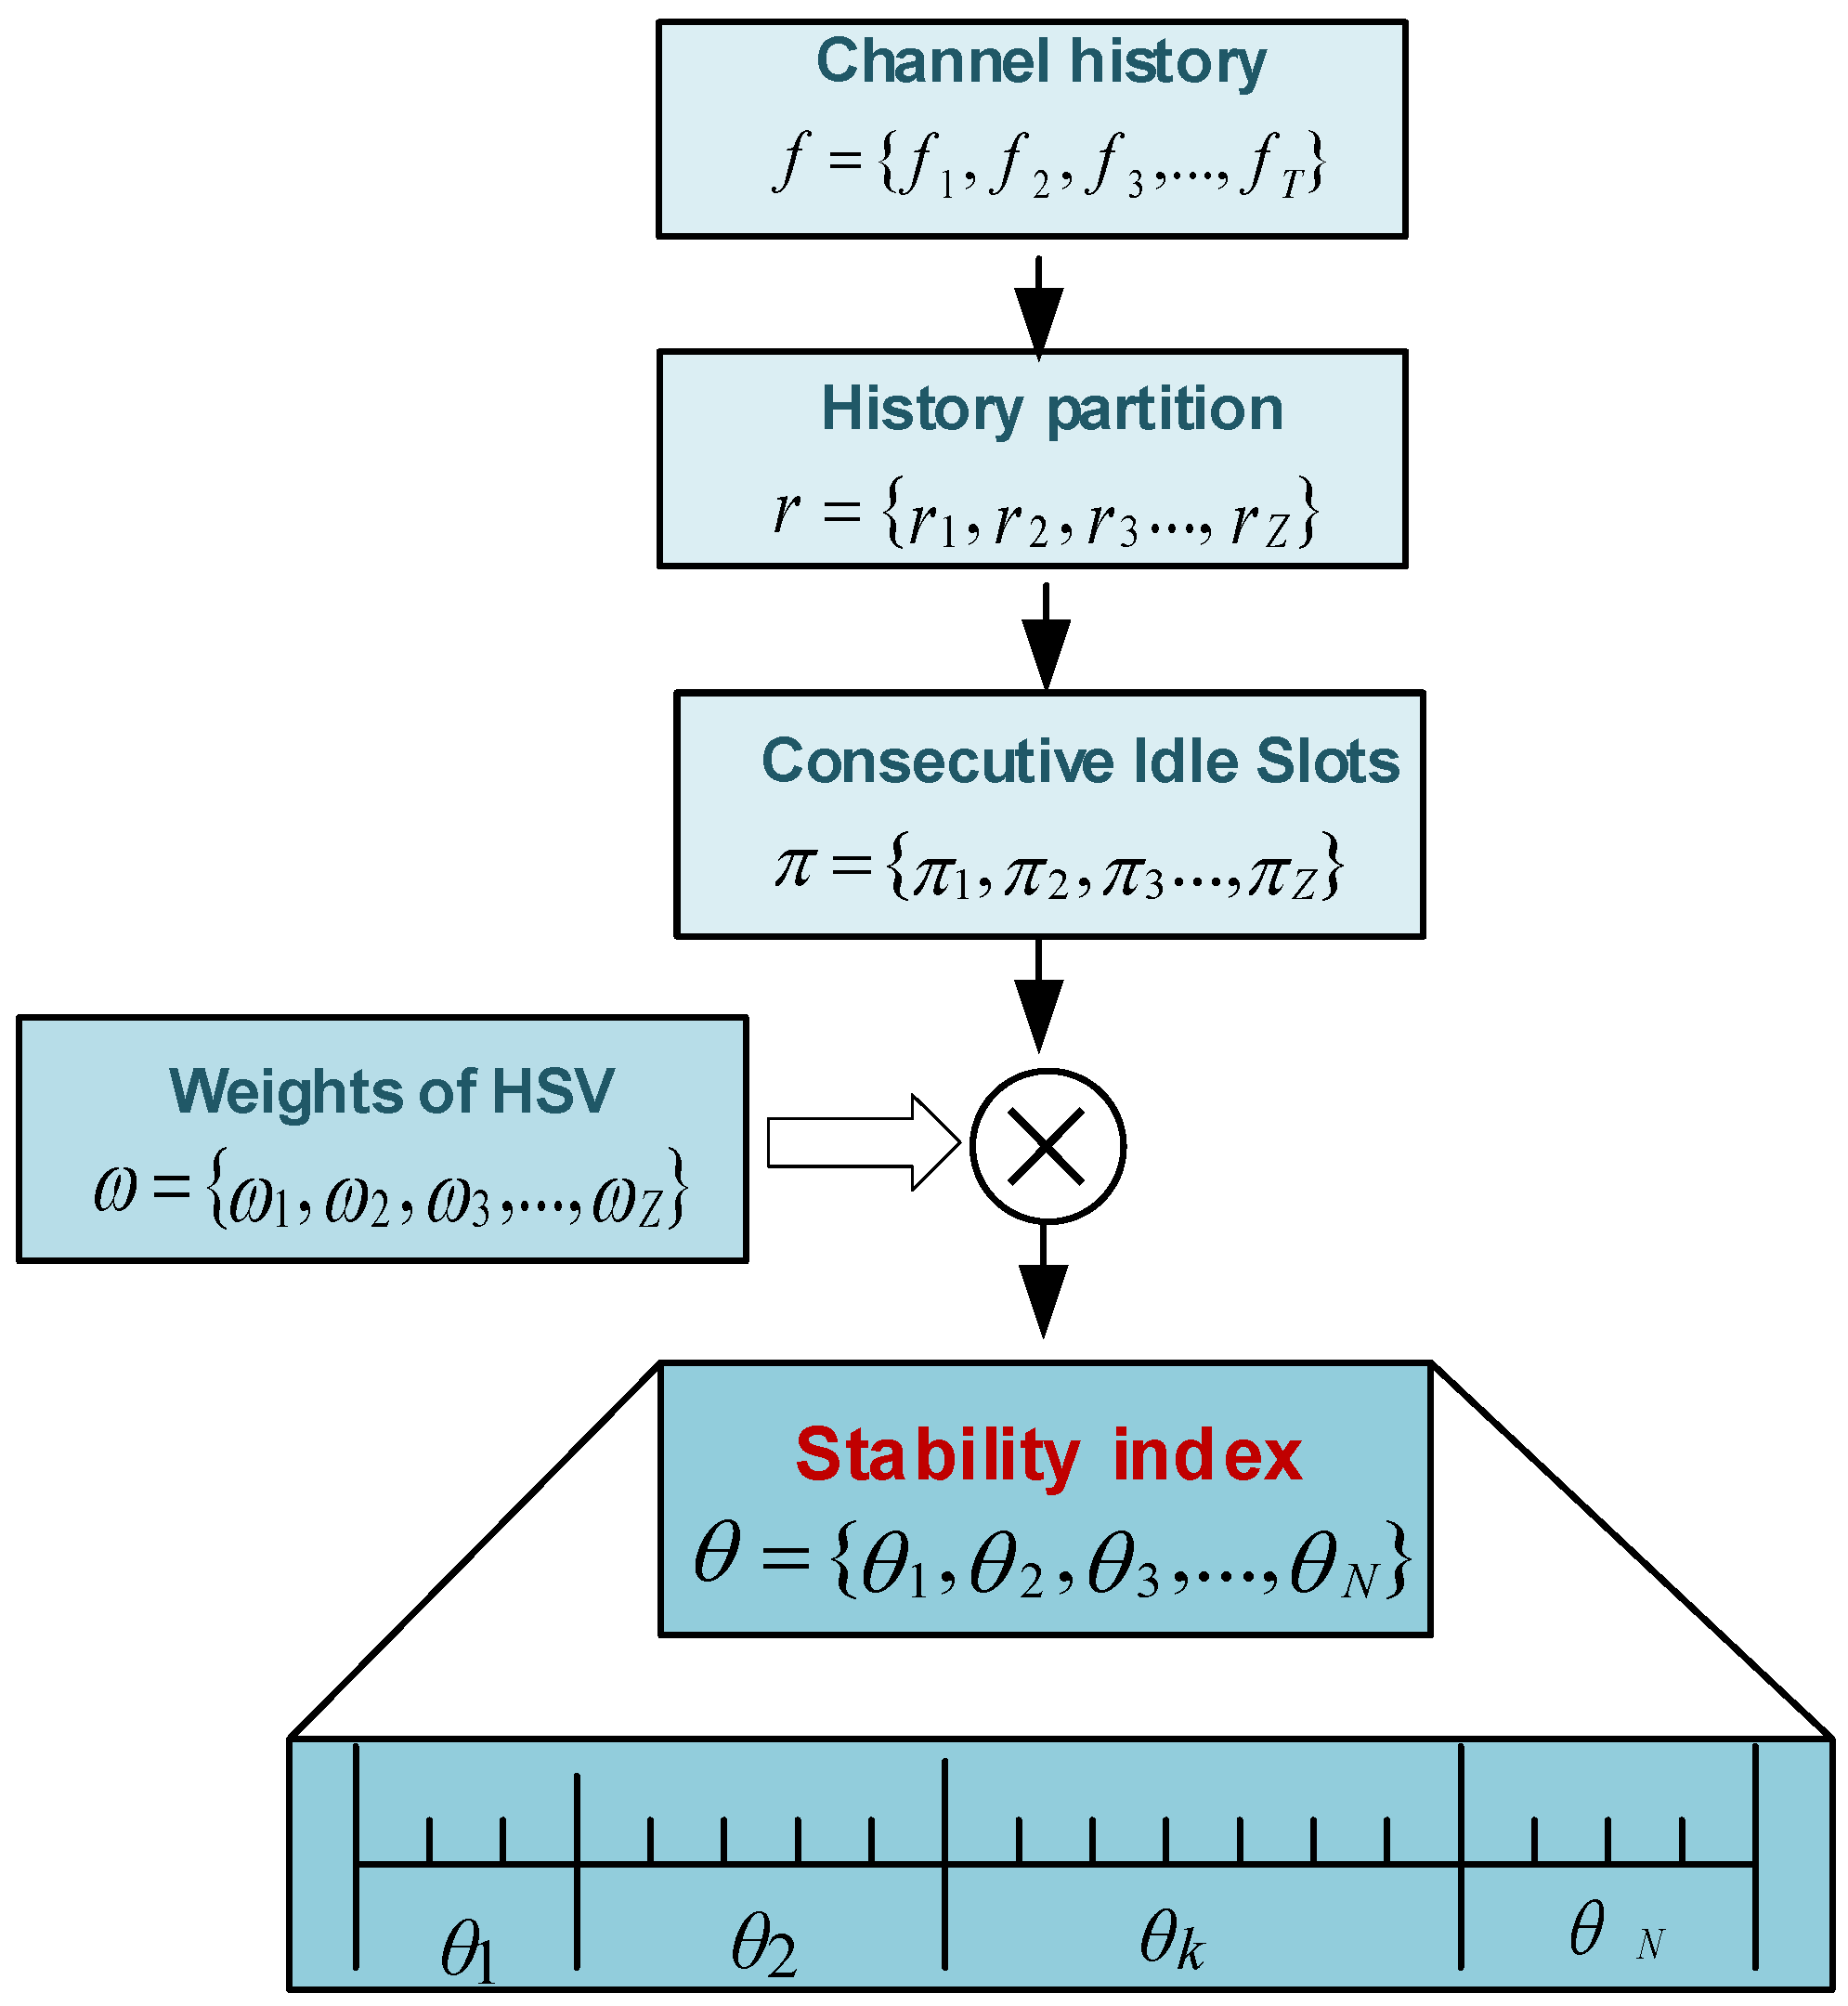
2.3. Channel Stability Index
2.4. Traffic Classes of SUs
3. Problem Formulation
| Algorithm 1 PSO-based device-centric QoS provisioning for SUs in a smart building. |
Require:
|
| Ensure: Resource allocation |
| while stoping criteria not meet do |
| for (j: 1 to P) do |
| for (d: 1 to D) do |
| Initialize position |
| Initialize velocity |
| end for |
| Initialize particle personal best |
| if then |
| global best position |
| end if |
| end for |
| for (j: 1 to P) do |
| for (d: 1 to D) do |
| end for |
| end for |
| end while |
| return ϕ |
4. Particle Swarm Optimization
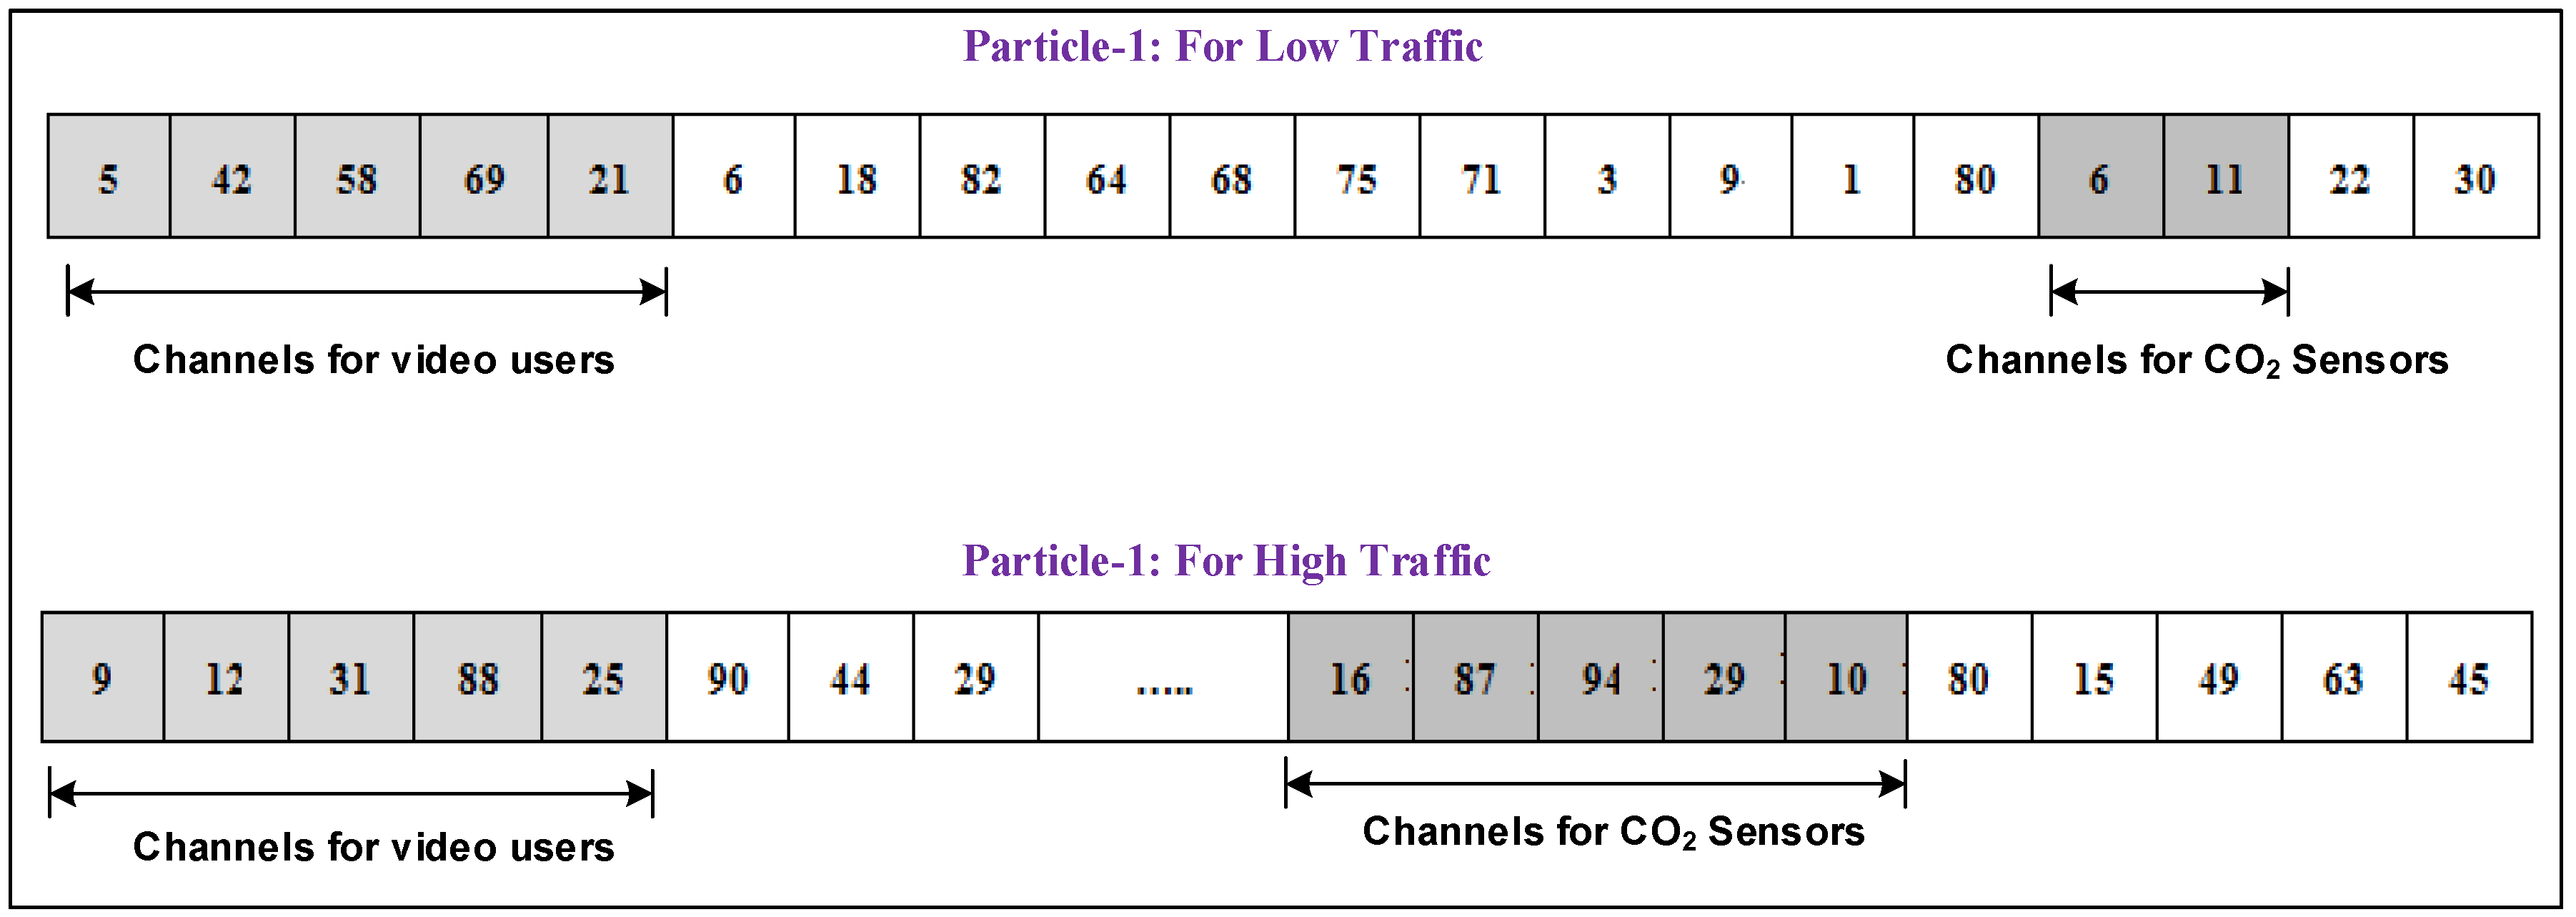
4.1. Particle Encoding
4.2. Position and Velocity Updates
5. Performance Evaluation
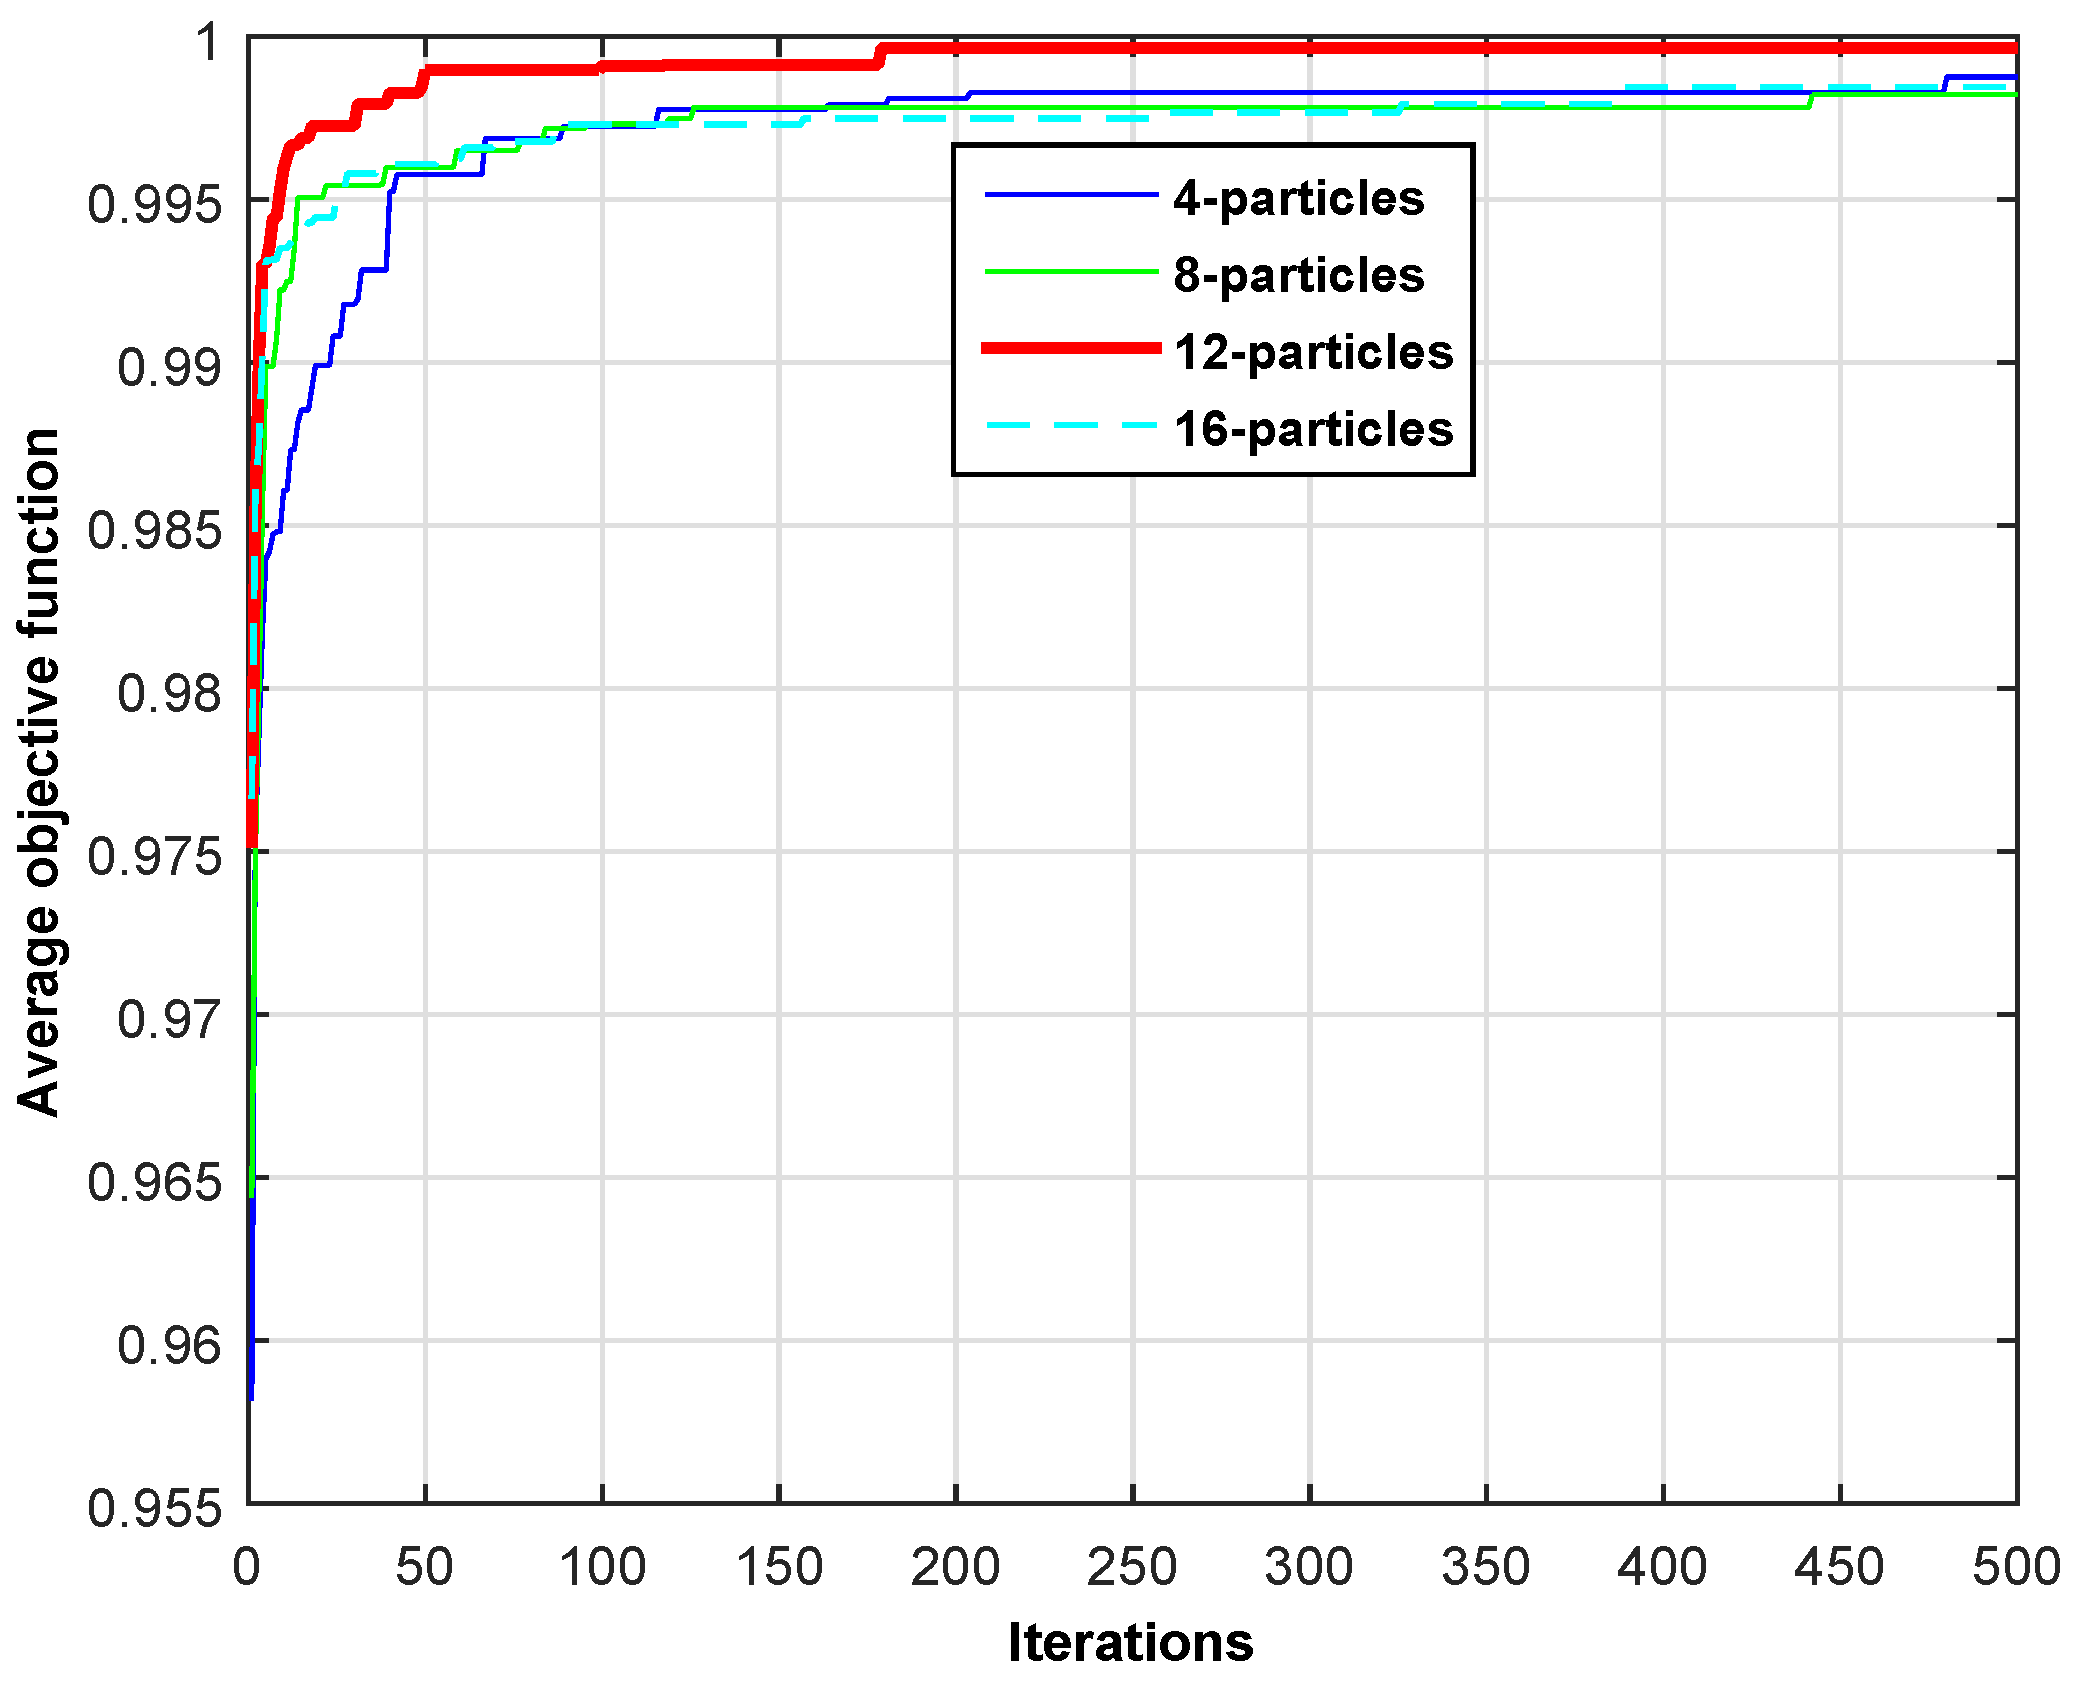
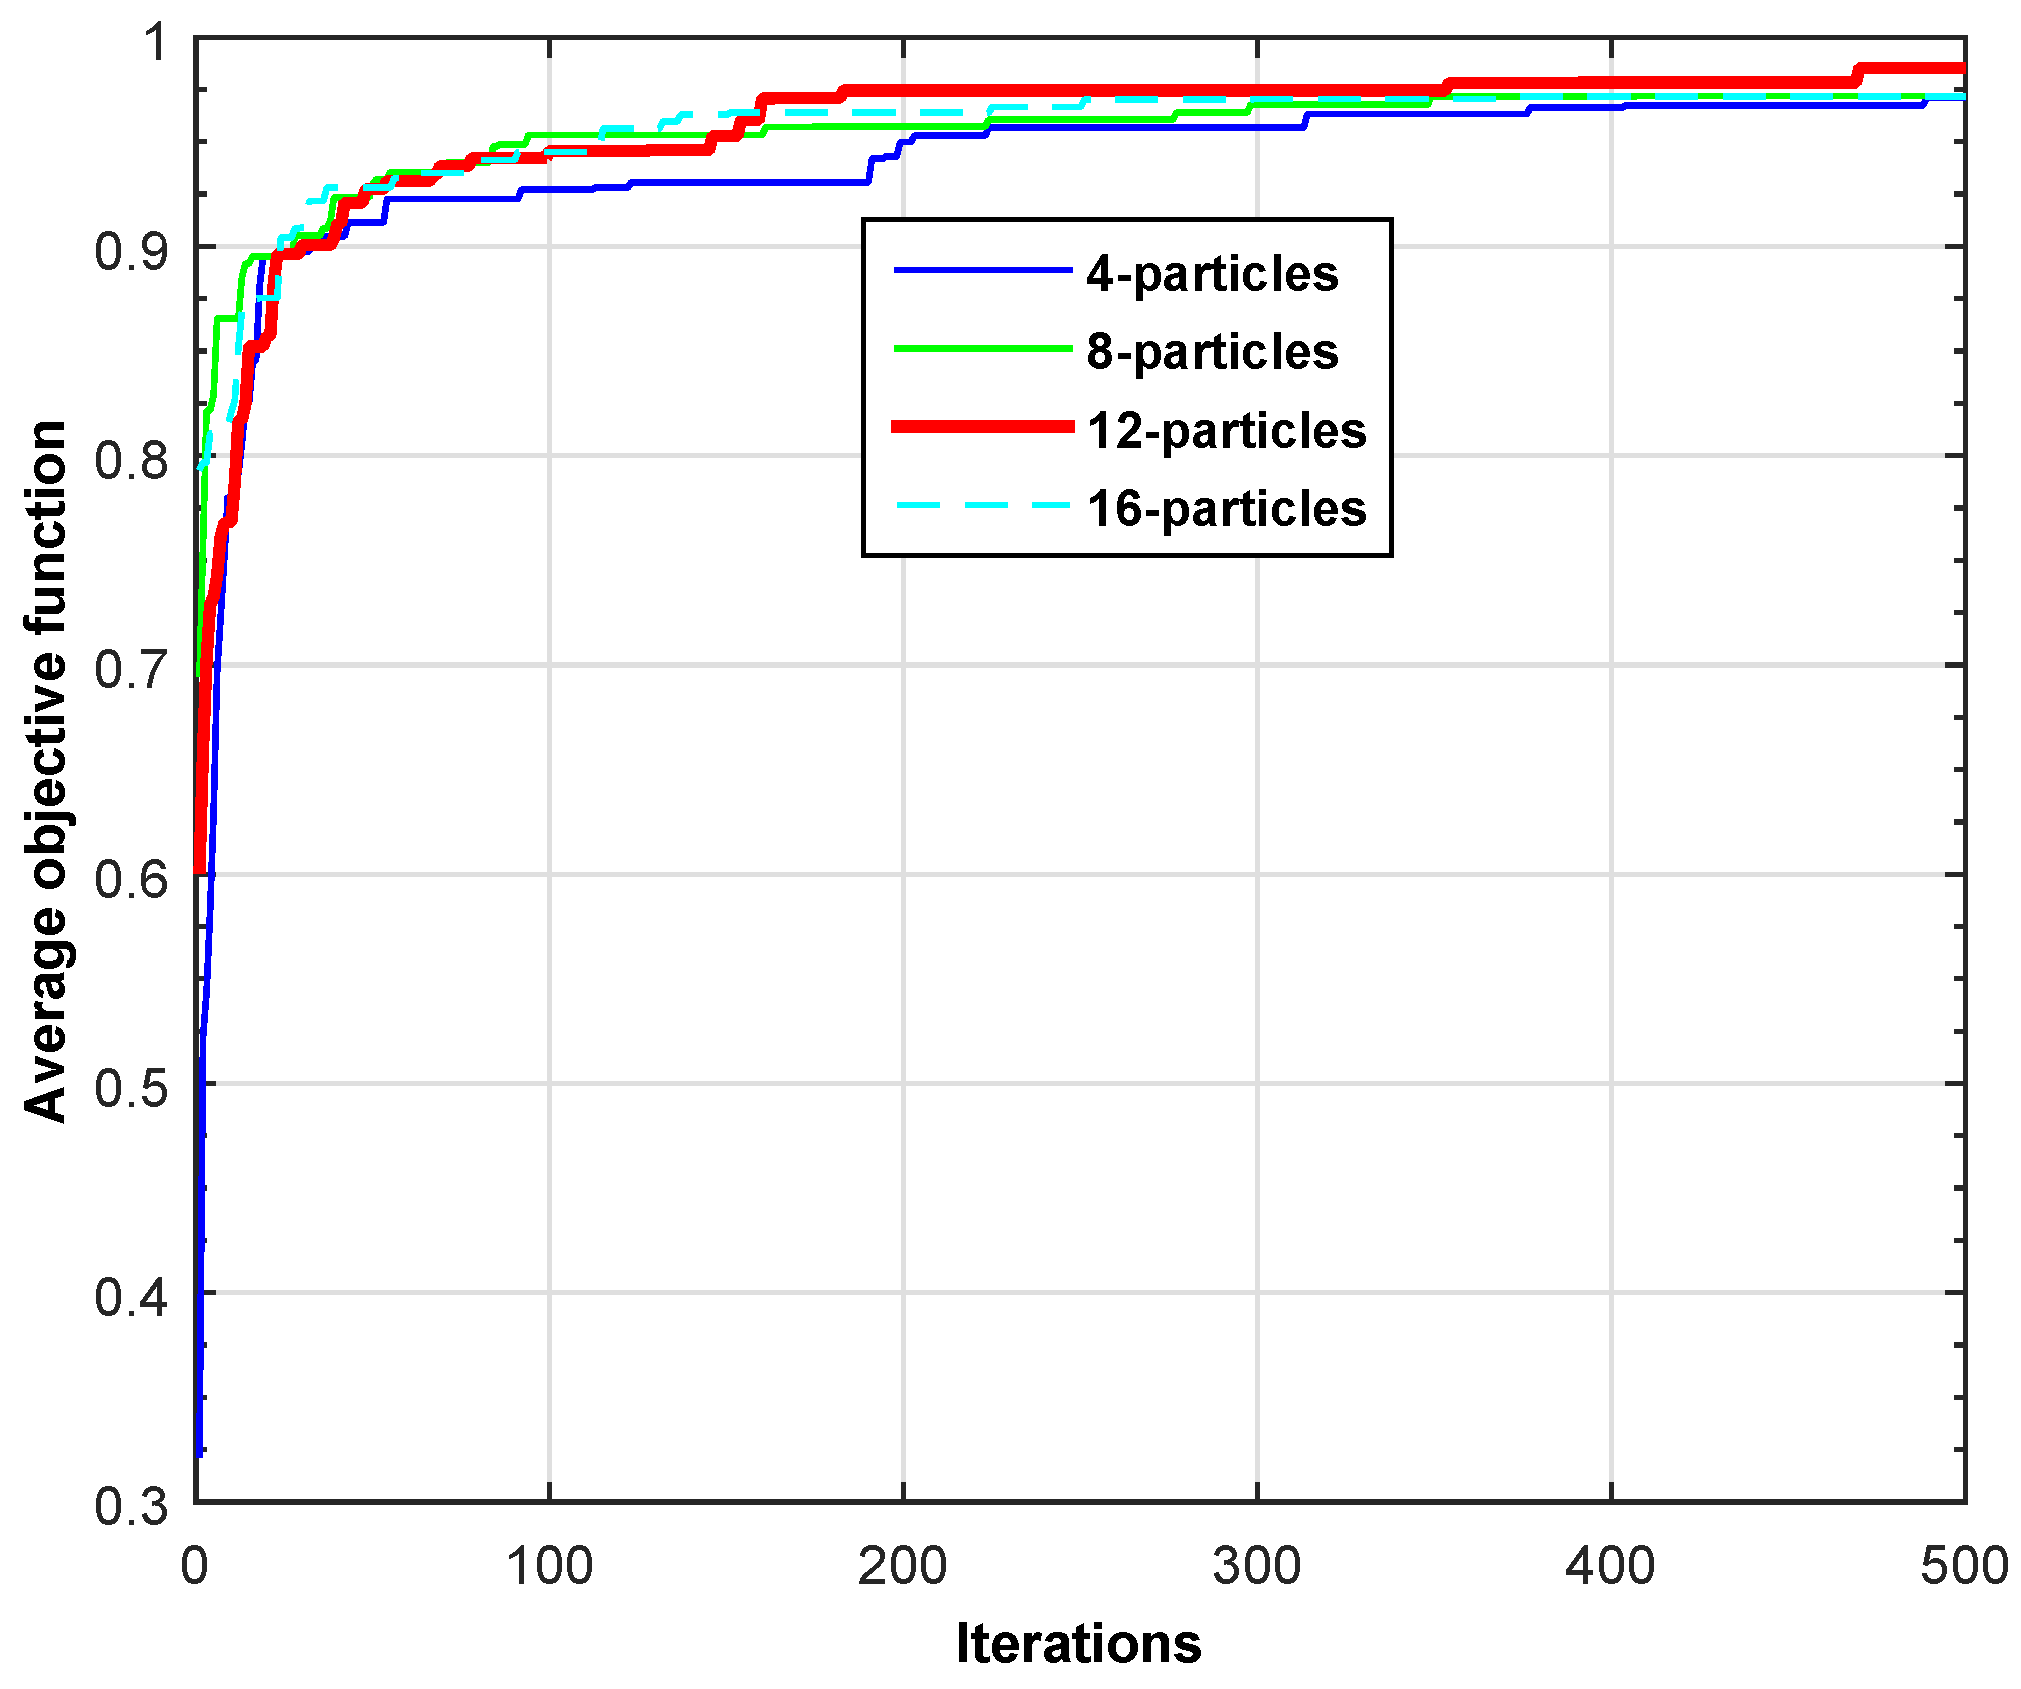
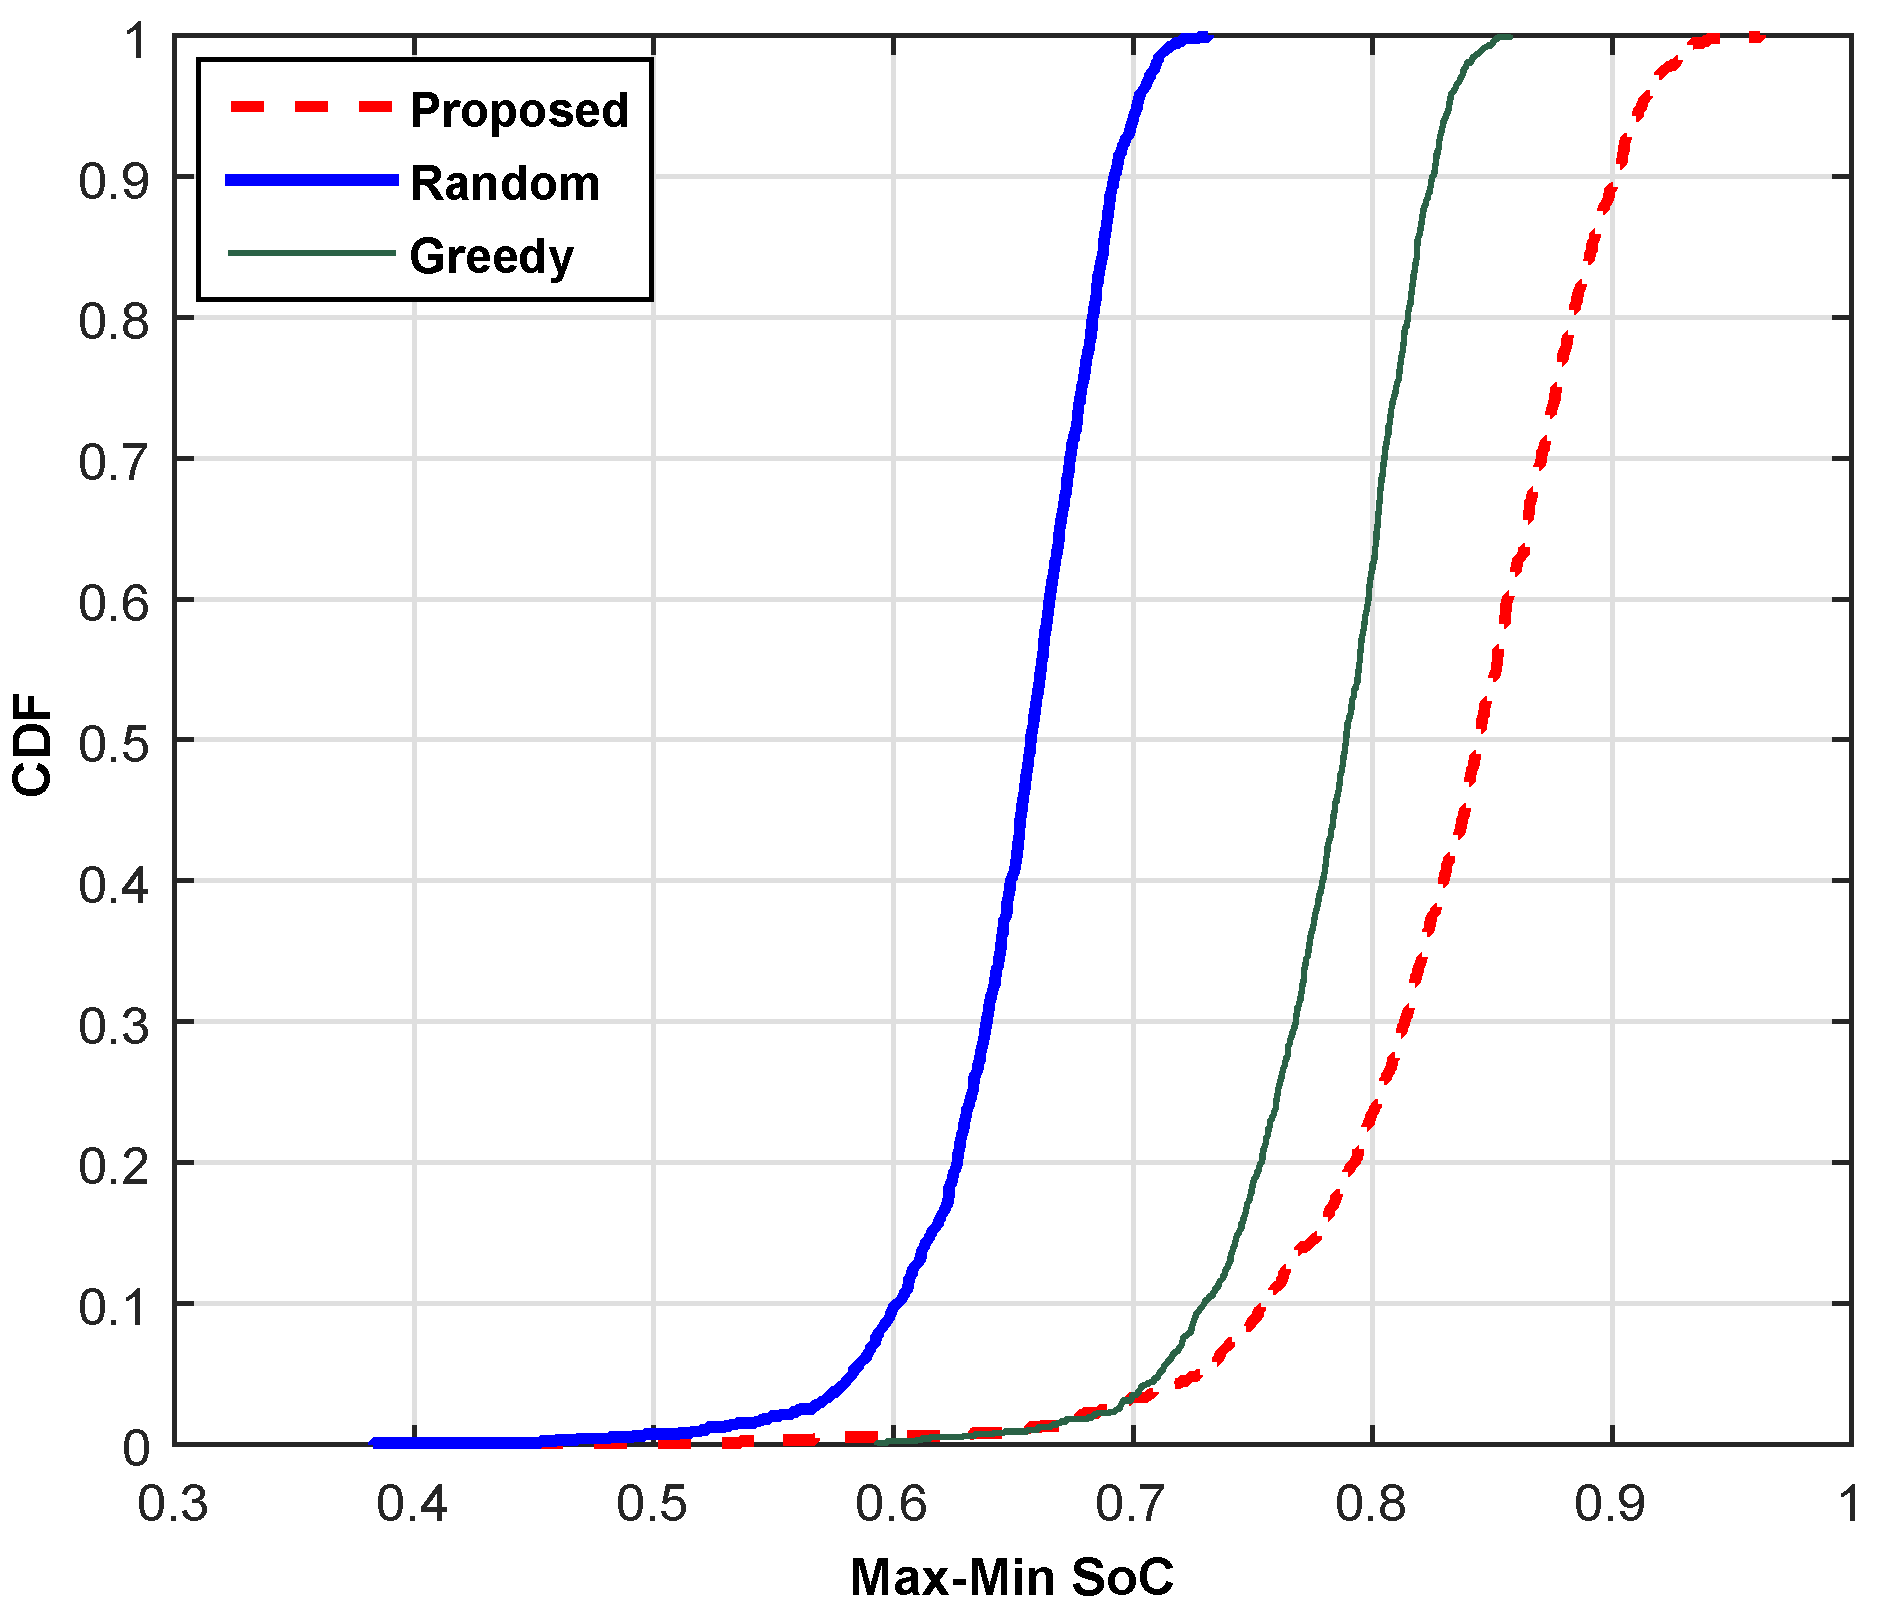
5.1. Average Objective Function
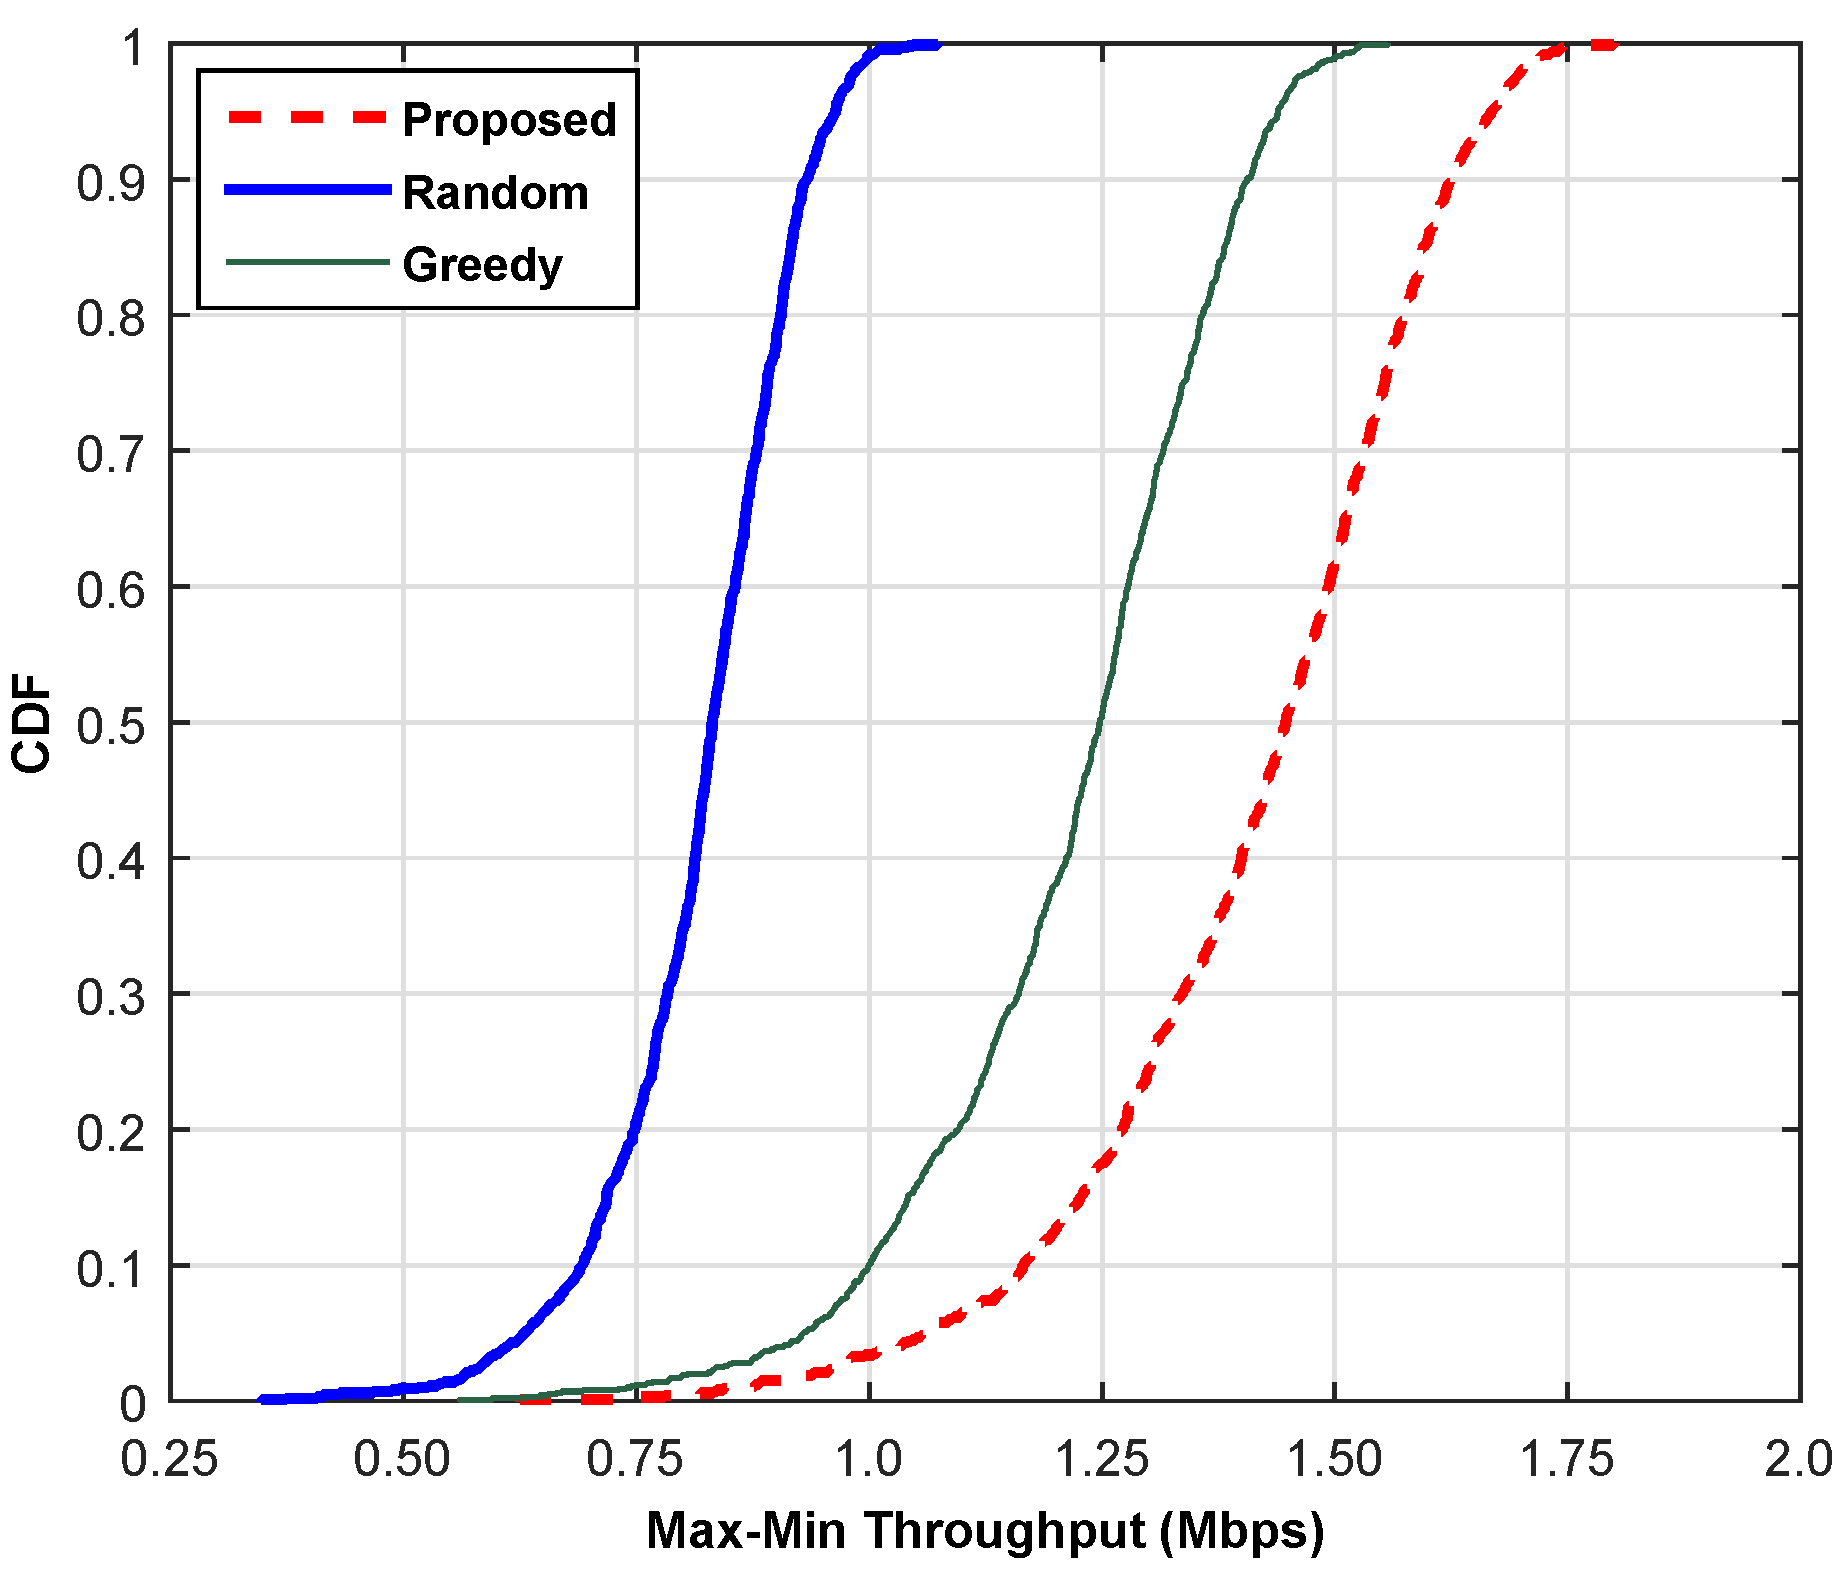
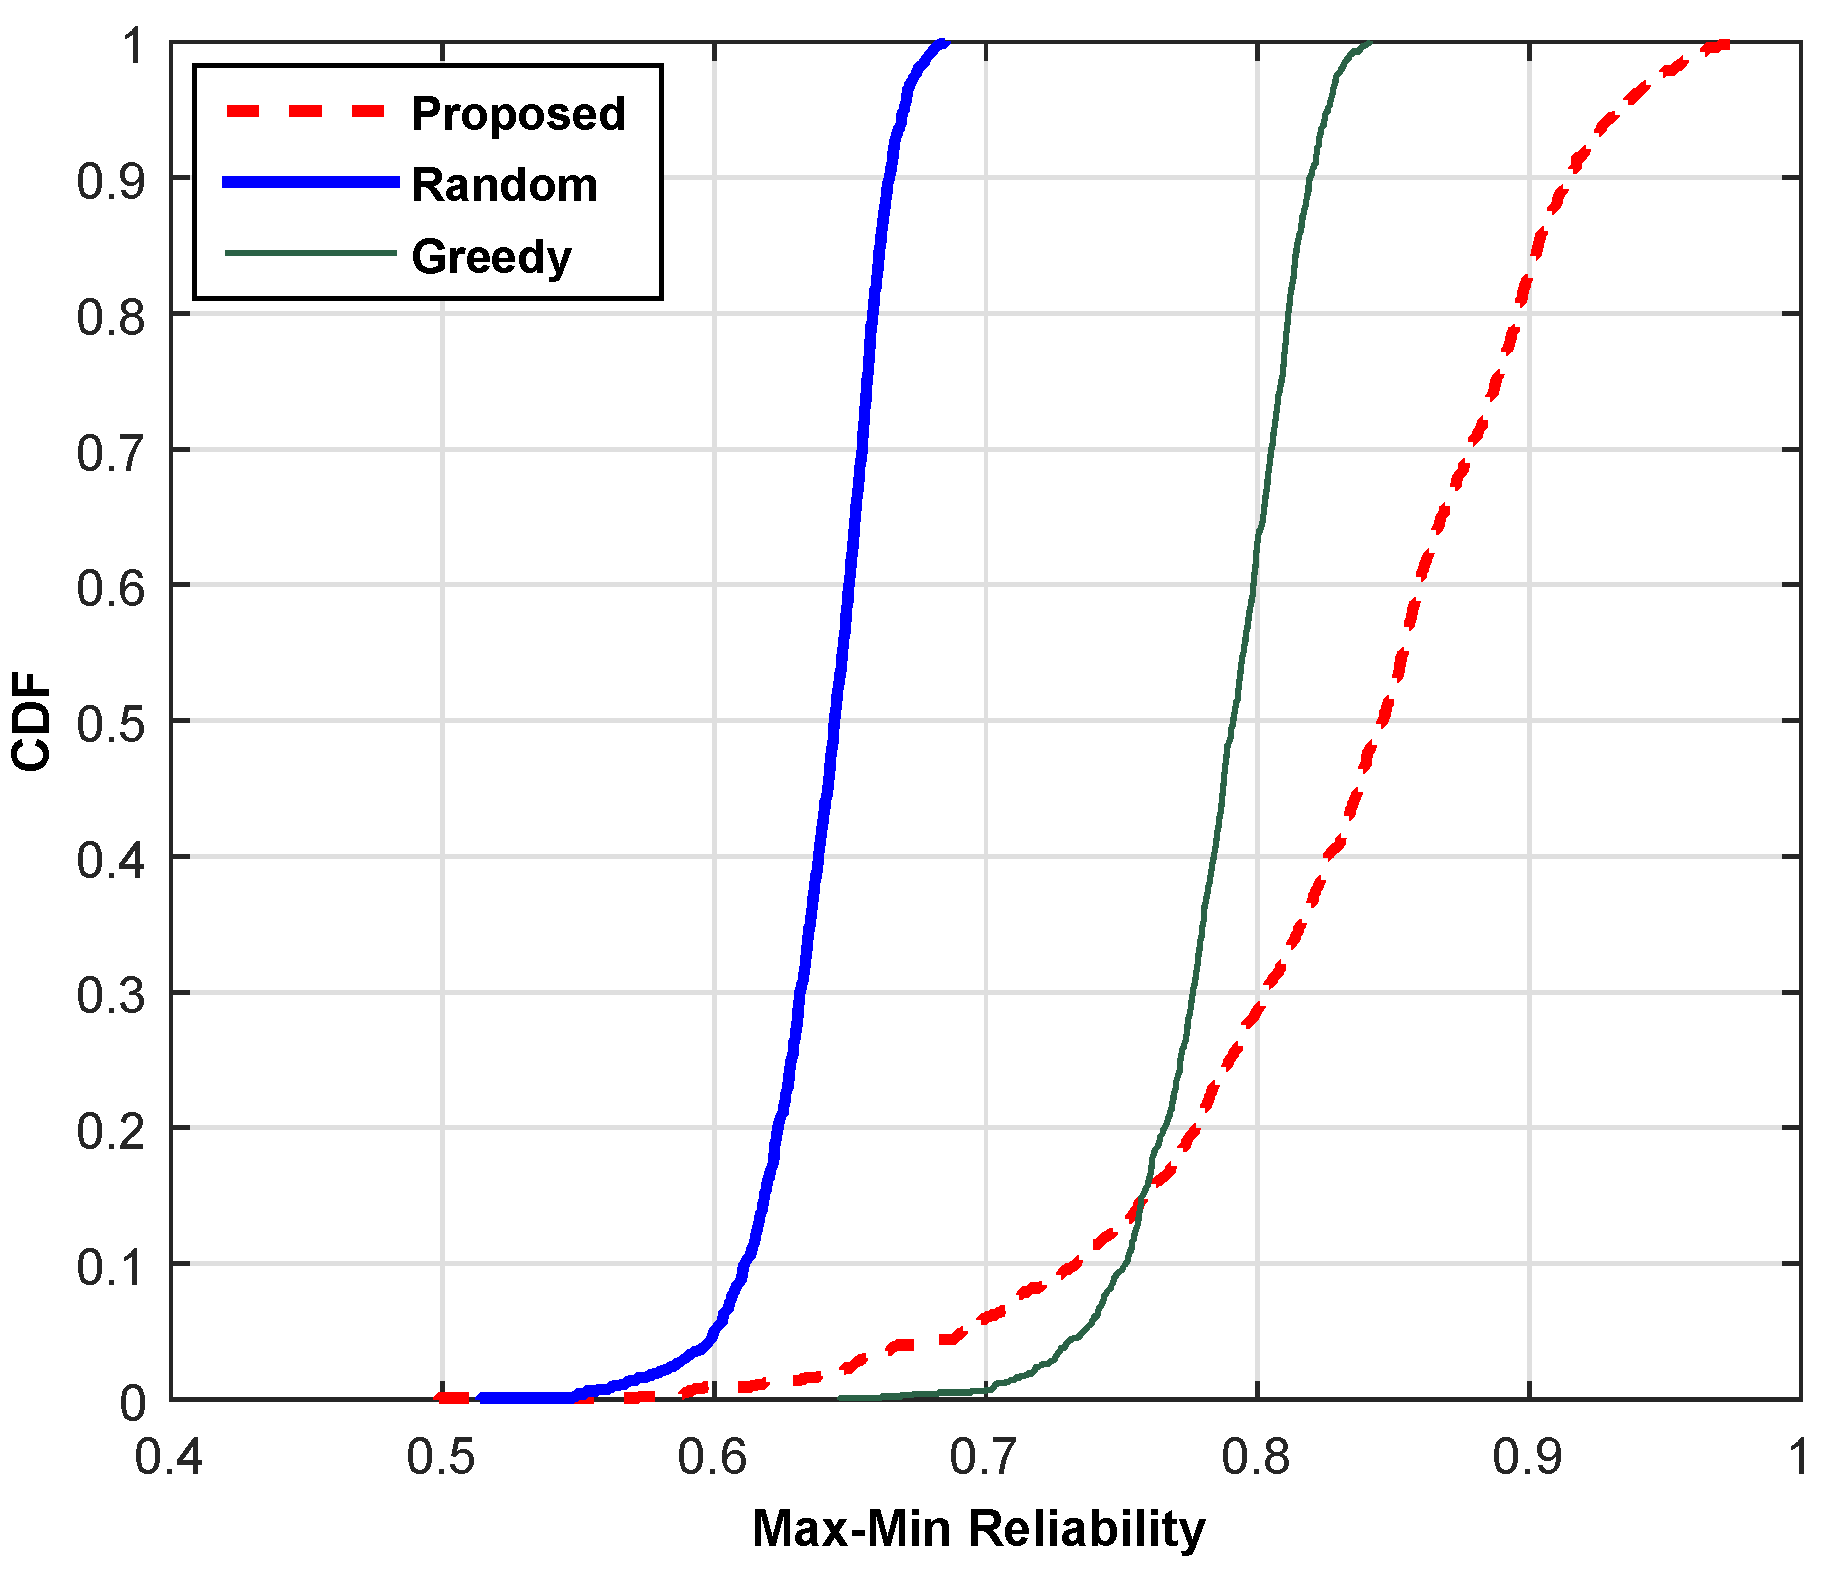
5.2. Comparison with Existing Schemes
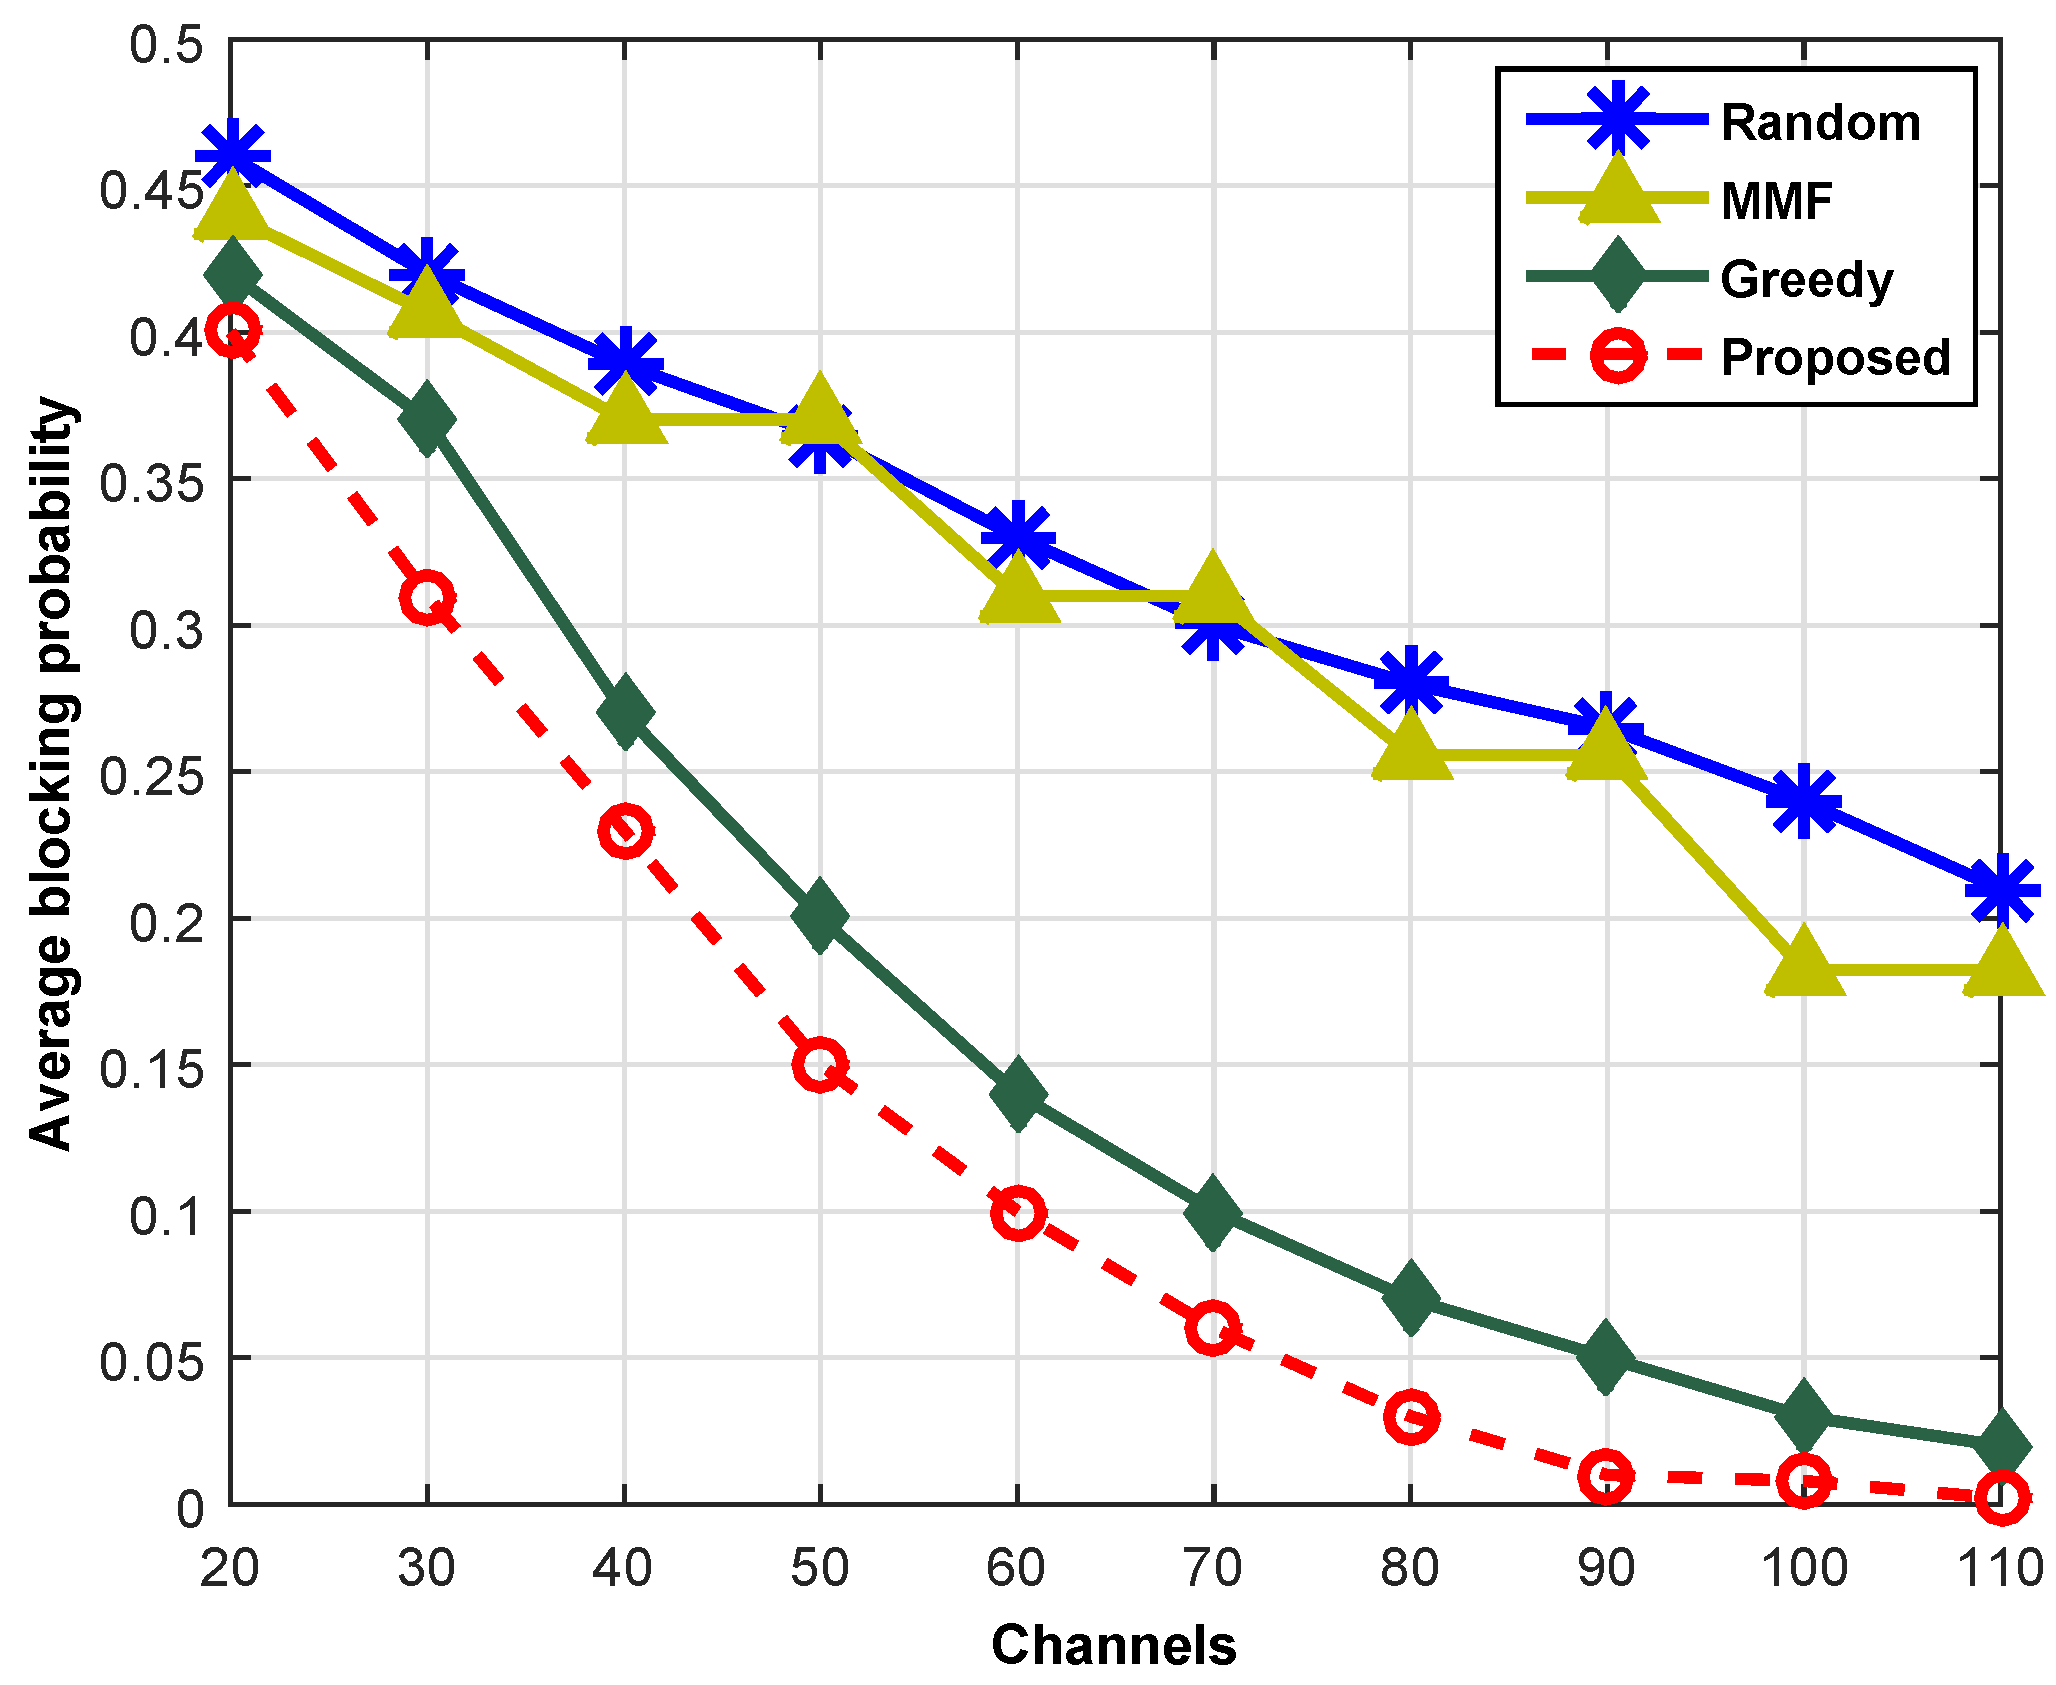
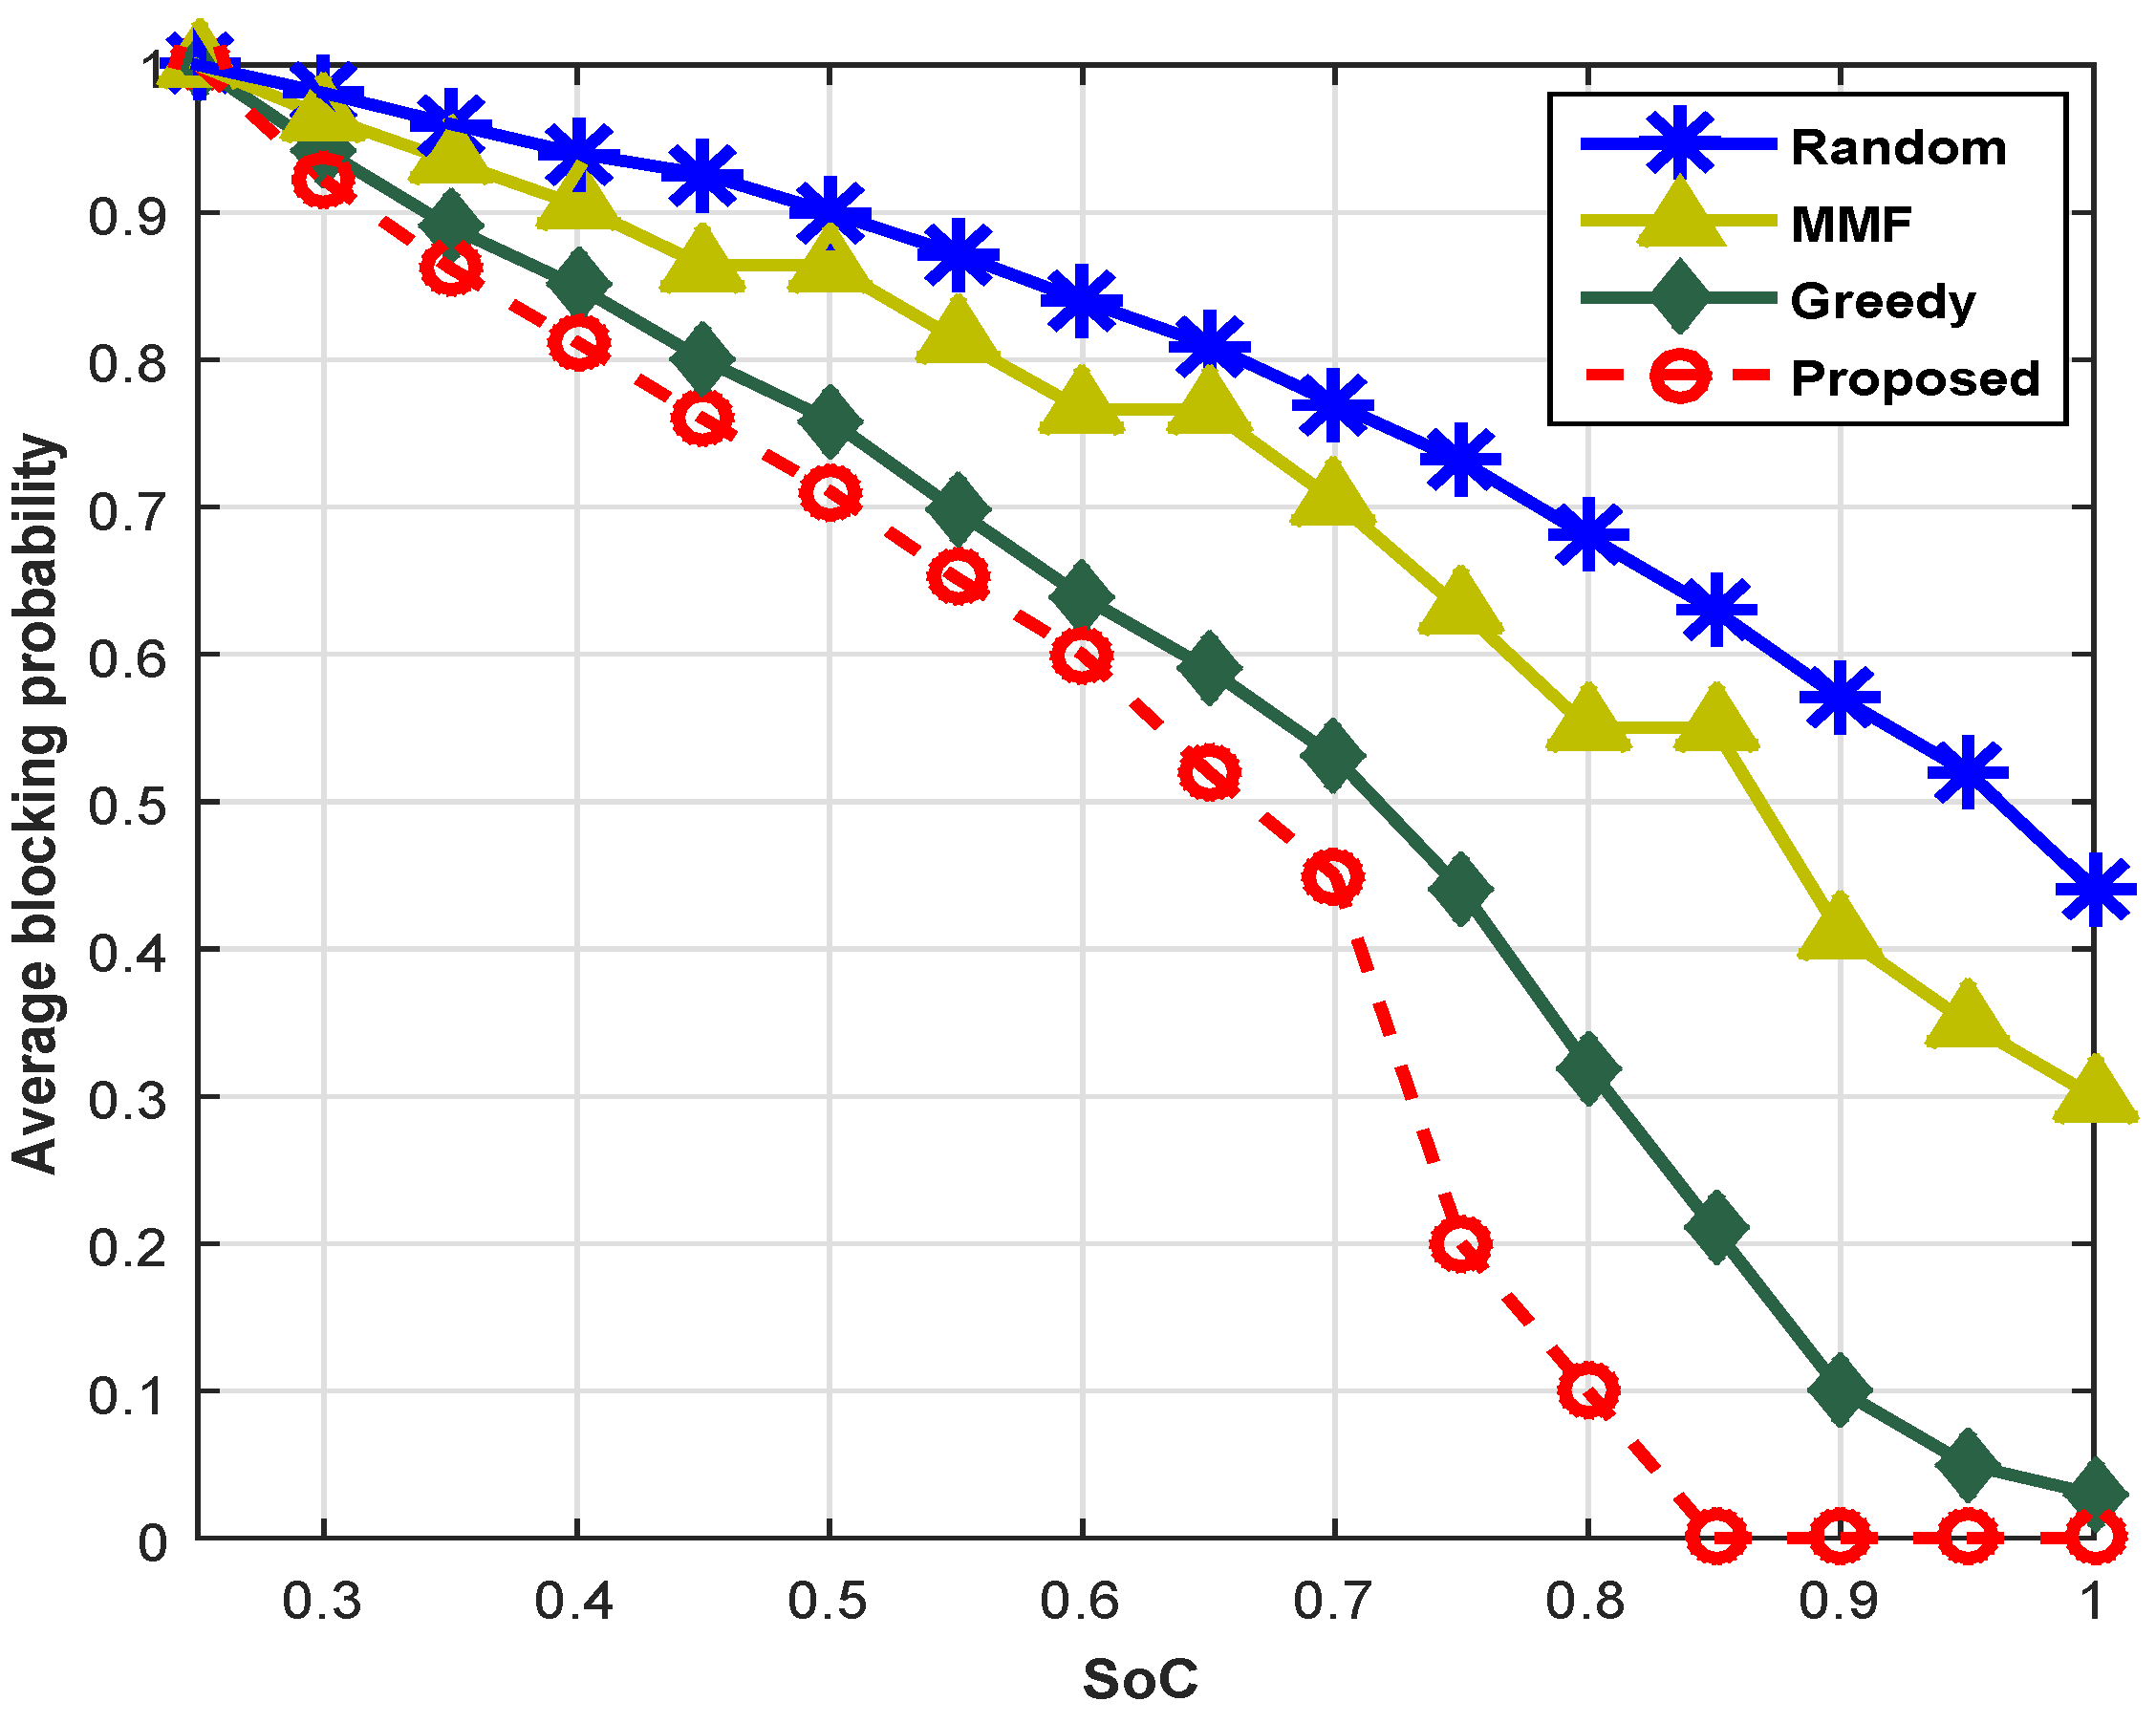
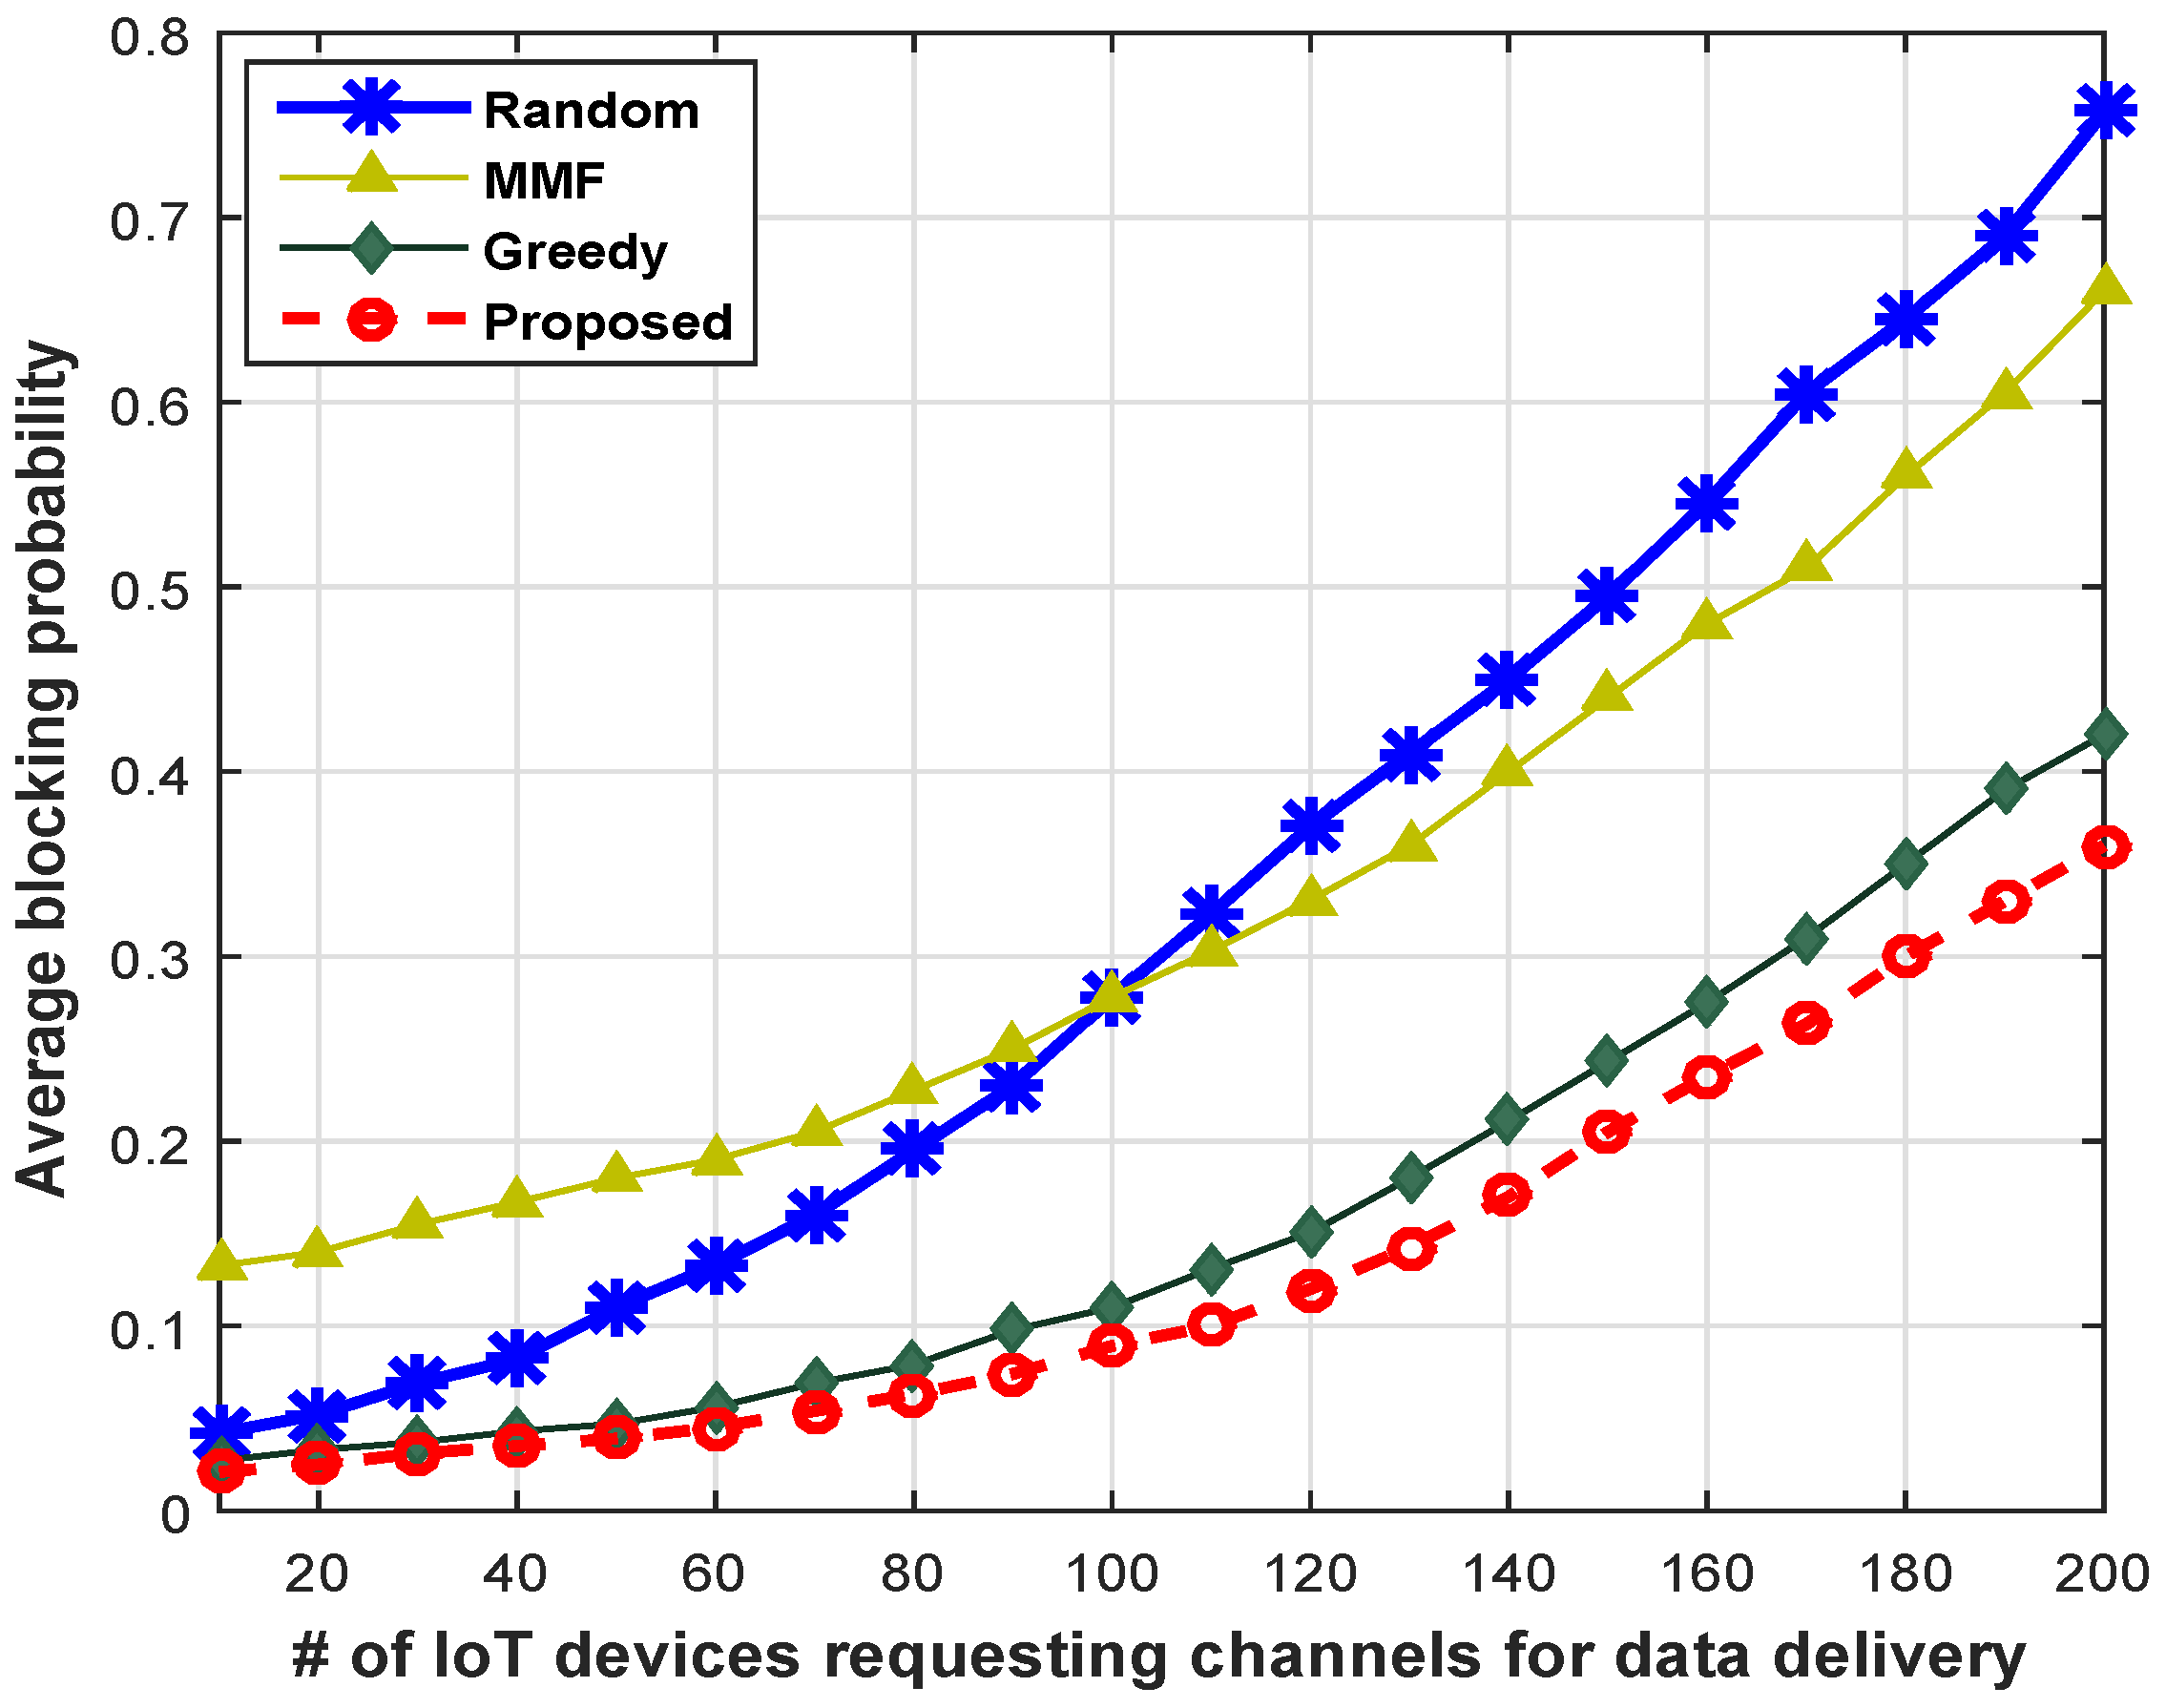
5.3. Comparison Based on Blocking Probability
6. Conclusions
Acknowledgments
Author Contributions
Conflicts of Interest
References
- Abbas, Z.; Yoon, W. A survey on energy conserving mechanisms for the internet of things: Wireless networking aspects. Sensors 2015, 15, 24818–24847. [Google Scholar] [CrossRef] [PubMed]
- Yun, J.; Ahn, I.-Y.; Choi, S.-C.; Kim, J. TTEO (Things Talk to Each Other): Programming smart spaces based on IoT systems. Sensors 2016, 16, 467. [Google Scholar] [CrossRef] [PubMed]
- Atzori, L.; Iera, A.; Morabito, G. From “smart objects” to “social objects”: The next evolutionary step of the Internet of Things. IEEE Commun. Mag. 2014, 52, 97–105. [Google Scholar] [CrossRef]
- Li, F.; Han, Y.; Jin, C. Practical access control for sensor networks in the context of the Internet of Things. Comput. Commun. 2016, 89–90, 154–164. [Google Scholar] [CrossRef]
- Oh, D.; Kim, D.; Ro, W.W. A malicious pattern detection engine for embedded security systems in the Internet of Things. Sensors 2014, 14, 24188–24211. [Google Scholar] [CrossRef] [PubMed]
- Skouby, K.E.; Lynggaard, P. Smart home and smart city solutions enabled by 5G, IoT, AAI and CoT services. In Proceedings of the 2014 International Conference on Contemporary Computing and Informatics (IC3I), Mysore, India, 27–29 November 2014; pp. 874–878.
- Zeng, F.; Xu, J. Leasing-based performance analysis in energy harvesting cognitive radio networks. Sensors 2016, 16, 305. [Google Scholar] [CrossRef] [PubMed]
- Aslam, S.; Shahid, A.; Lee, K.G. Reliable, efficient, and power optimized control-channel selection scheme for cognitive radio networks. Math. Probl. Eng. 2013, 2013, 567581. [Google Scholar] [CrossRef]
- Zanella, A.; Bui, N.; Castellani, A.; Vangelista, L.; Zorzi, M. Internet of things for samrt city. IEEE Int. Things J. 2014, 1, 22–32. [Google Scholar] [CrossRef]
- Perera, C.; Liu, C.H.; Jayawardena, S.; Chen, M.A. Survey of industrial Internet-of-Things marketplace. IEEE Access 2015, 2, 1660–1679. [Google Scholar] [CrossRef]
- Morvaj, B.; Lugaric, L.; Krajcar, S. Demonstrating smart-buildings and smart grid features in a smart energy city, energetic. In Proceedings of the 2011 3rd International Youth Conference on Energetics (IYCE), Leiria, Portugal, 7–9 July 2011; pp. 1–8.
- McCann, R.; Le, A.T.; Traore, D. Stochastic sliding mode arbitration for energy management in smart-building systems. In Proceedings of the 2008 IAS IEEE Industry Applications Society Annual Meeting, Edmonton, AB, Canada, 5–9 October 2008; pp. 1–4.
- Gafurov, T.; Tellez, M.B.; Prodanovic, M. An integrated approach to optimization of energy supply mix in smart-buildings. In Proceedings of the 2011 2nd IEEE PES International Conference and Exhibition on Innovative Smart Grid Technologies (ISGT Europe), Manchester, UK, 5–7 December 2011; pp. 1–8.
- Huang, H.Y.; Yen, J.Y.; Chen, S.L.; Ou, F.C. Development of an intelligent energy management network for building automation. IEEE Trans. Autom. Sci. Eng. 2004, 1, 14–25. [Google Scholar] [CrossRef]
- Callaghan, V.; Clarke, G.; Colley, M.; Hagras, H. A softcomputing distributed artificial intelligence architecture for intelligent buildings. Stud. Fuzz. Soft Comput. 2001, 75, 117–145. [Google Scholar]
- Singhvi, V.; Krause, A.; Guestrin, C.; Garrett, J.H.; Matthews, H.S. Intelligent light control using sensor networks. In Proceedings of the 3rd International Conference on Embedded Networked Sensor Systems, San Diego, CA, USA, 2–4 November 2005; pp. 218–229.
- Gauger, M.; Minder, D.; Marrón, P.J.; Wacker, A.; Lachenmann, A. Prototyping sensor-actuator networks for home automation. In Proceedings of the workshop on Real-World Wireless Sensor Networks, Glasgow, UK, 1–4 April 2008; pp. 56–60.
- Sivieri, A.; Mottolaa, L.; Cugolaa, G. Building Internet of Things software with ELIoT. Comput. Commun. 2016, 89–90, 141–153. [Google Scholar] [CrossRef]
- Liu, C.H.; Fan, J.; Branch, J.W.; Leung, K.K. Towards QoI and energy-efficiency in Internet-of-Things sensory environments. IEEE Trans. Emerg. Top. Comput. 2014, 2, 473–487. [Google Scholar] [CrossRef]
- Liu, H.; Fan, J.; Hui, P.; Wu, J.; Leung, K.K. Towards QoI and energy-efficiency in participatory crowdsourcing. IEEE Trans. Veh. Technol. 2015, 64, 4684–4700. [Google Scholar] [CrossRef]
- Liu, C.H.; Leung, K.K.; Gkelias, A. A generic admission-control methodology for packet networks. IEEE Trans. Wirel. Commun. 2014, 13, 604–617. [Google Scholar] [CrossRef]
- Liu, C.H.; Yang, B.; Liu, T. Efficient naming, addressing and profile services in Internet-of-Things sensory environments. Ad Hoc Netw. 2014, 18, 86–101. [Google Scholar] [CrossRef]
- Zhang, B.; Liu, C.H.; Lu, J.; Song, Z.; Ren, Z.; Ma, J.; Wang, W. Privacy-preserving QoI-aware participant coordination for mobile crowdsourcing. Comput. Netw. 2016, 101, 29–41. [Google Scholar] [CrossRef]
- Yurur, O.; Liu, C.H.; Sheng, Z.; Leung, V.C.M.; Moreno, W.; Leung, K.K. Context-awareness for mobile sensing: A survey and future directions. IEEE Commun. Surv. Tutor. 2016, 18, 68–93. [Google Scholar] [CrossRef]
- Zhang, B.; Song, Z.; Liu, C.H.; Ma, J.; Wang, W. An event-driven QoI-aware participatory sensing framework with energy and budget constraints. ACM Trans. Intell. Syst. Technol. 2015, 6, 42. [Google Scholar] [CrossRef]
- Song, Z.; Liu, C.H.; Wu, J.; Ma, J.; Wang, W. QoI-aware multi-task-oriented dynamic participant selection with budget constraints. IEEE Trans. Veh. Technol. 2014, 63, 4618–4632. [Google Scholar] [CrossRef]
- Aslam, S.; Lee, K.G. Spectrum sharing optimization with QoS guarantee in cognitive radio networks. Comput. Electron. Eng. 2013, 39, 2053–2067. [Google Scholar] [CrossRef]
- Akyildiz, I.F.; Lee, W.; Vuran, M.C.; Mohanty, S. Next generation/dynamic spectrum access/cognitive radio wireless networks: A survey. J. Comput. Netw. 2006, 50, 2127–2159. [Google Scholar] [CrossRef]
- Subhedar, M.; Birajdar, G. Spectrum sensing techniques in cognitive radio networks: A survey. Int. J. Next-Gener. Netw. 2011, 3, 37–51. [Google Scholar] [CrossRef]
- Lee, C.H.; Wolf, W. Energy efficient techniques for cooperative spectrum sensing in cognitive radios. In Proceedings of the 5th IEEE Consumer Communications and Networking Conference, Las Vegas, NV, USA, 10–12 January 2008; pp. 968–972.
- Xing, X.; Tao, J.; Li, H.; Huo, Y.; Cheng, X.; Znati, T. Optimal spectrum sensing interval in cognitive radio networks. IEEE Trans. Parallel Distrib. Syst. 2013, 25, 2408–2417. [Google Scholar] [CrossRef]
- Liu, Q.; Wang, X.; Cui, Y. Scheduling of sequential periodic sensing for cognitive radios. In Proceedings of the 2013 IEEE INFOCOM, Turin, Italy, 14–19 April 2013; pp. 2256–2264.
- Song, Q.; Ning, Z.; Huang, Y.; Guo, L.; Lu, X. Joint power control and spectrum access in cognitive radio networks. J. Netw. Comput. Appl. 2014, 41, 379–388. [Google Scholar] [CrossRef]
- Aslam, S.; Lee, K.G. Fair efficient and power optimized spectrum sharing scheme for cognitive radios. EURASIP J. Wirel. Commun. Netw. 2011. [Google Scholar] [CrossRef]
- Aslam, S.; Lee, K.G. CSPA: Channel selection and parameter adaptation scheme based on genetic algorithm for cognitive radio ad hoc networks. EURASIP J. Wirel. Commun. Netw. 2012, 2012, 1–15. [Google Scholar] [CrossRef]
- Si, P.; Ji, H.; Yu, F.R.; Leung, V.C.M. Optimal cooperative internetwork spectrum sharing for cognitive radio systems with spectrum pooling. IEEE Veh. Technol. 2010, 9, 1760–1768. [Google Scholar]
- Zou, C.; Jin, T.; Chigan, C.; Tian, Z. QoS-aware distributed spectrum sharing for heterogeneous wireless cognitive networks. Comput. Netw. 2008, 52, 864–878. [Google Scholar] [CrossRef]
- Liu, Y.; Cuthbert, L.; Yang, X.; Wang, Y. QoS-aware resource allocation for multimedia users in a multi-cell spectrum sharing radio network. In Proceedings of the 7th ACM workshop on Performance Monitoring and Measurement of Heterogeneous Wireless and Wired Networks, Paphos, Cyprus Island, 21–25 October 2012; pp. 45–52.
- Joshi, G.P.; Nam, S.Y.; Kim, S.W. Cognitive radio wireless sensor networks: Applications, challenges and research trends. Sensors 2013, 13, 11196–11228. [Google Scholar] [CrossRef] [PubMed]
- Aslam, S.; Shahid, A.; Lee, K.G. Joint sensor-node selection and channel allocation scheme for cognitive radio sensor networks. J. Int. Technol. 2013, 14, 453–466. [Google Scholar]
- Oto, M.C. Energy efficient packet size optimization for cognitive radio sensor networks. IEEE Trans. Wirel. Commun. 2012, 11, 1544–1553. [Google Scholar] [CrossRef]
- Han, J.A.; Jeon, W.S.; Jeong, D.G. Energy-efficient channel management scheme for cognitive radio sensor networks. IEEE Trans. Veh. Technol. 2011, 60, 1905–1910. [Google Scholar] [CrossRef]
- Bicen, A.O.; Akan, O.B. Reliability and congestion control in cognitive radio sensor networks. J. Ad Hoc Netw. 2011, 9, 1154–1164. [Google Scholar] [CrossRef]
- Lia, X.; Wangb, D.; McNaira, J.; Chenc, J. Dynamic spectrum access with packet size adaptation and residual energy balancing for energy-constrained cognitive radio sensor network. J. Netw. Comput. Appl. 2014, 41, 157–166. [Google Scholar] [CrossRef]
- Shah, G.A.; Gungor, V.C.; Akan, O.B. A Cross-layer design for QoS support in cognitive radio sensor networks for smart grid. In Proceedings of the 2012 IEEE International Conference on Communications (ICC), Ottawa, ON, Canada, 10–15 June 2012; pp. 1398–1402.
- Foschini, G.J.; Salz, J. Digital communications over fading radio channels. Bell Syst. Tech. J. 1983, 62, 429–456. [Google Scholar] [CrossRef]
- Tony, Y.C.; Farley, V.; Ye, N. QoS requirements of network applications on the internet. J. Inf. Knowl. Manag. Syst. 2004, 4, 55–76. [Google Scholar]
- Ge, Y.; Chen, M.; Sun, Y.; Li, Z.; Wang, Y.; Dutkiewicz, E. QoS provisioning wireless multimedia transmission over cognitive radio networks. Multi. Tools Appl. 2013, 67, 213–219. [Google Scholar] [CrossRef]
- Kennedy, J.; Eberhart, R.C.; Shi, Y.S. Swarm Intelligence; Morgan Kaufmann Publishers: San Francisco, CA, USA, 2001. [Google Scholar]
- Kennedy, J.; Eberhart, R.C. Particle swarm optimization. Encycl. Mach. Lear. 2011. [Google Scholar] [CrossRef]
- Shi, Y.; Eberhart, R. A modified particle swarms optimizer. In Proceedings of the 1998 IEEE International Conference on Evolutionary Computation Proceedings and IEEE World Congress on Computational Intelligence, Anchorage, AK, USA, 4–9 May 1998; pp. 69–73.


| Symbols | Meaning |
|---|---|
| Objective function | |
| N | Available channels |
| C | Traffic classes |
| Q | Spectrum-sensors |
| I | IoT devices |
| M | Mobile users |
| c | Subscript of class |
| u | Subscript of the SU belongs to the cth class |
| j | Subscript of the swarm particle |
| k | Subscript of channels |
| NM | Network monitor |
| HSV | History status vector of a channel |
| SU | CR-based mobile user, IoT device or NM |
| T | Total history slots |
| Transmission power of SU | |
| Z | Partitions of HSV |
| ω | Weights for partitions of HSV |
| E | Energy of the PU signal used for spectrum sensing |
| V | Velocity of the swarm particle |
| S | Position of the swarm particles |
| Pb | Global best of the swarm particles |
| Lower limit of data rate requirement | |
| Upper limit of BER tolerance | |
| Lower limit of the channel stability requirement | |
| Data rate of the kth channel | |
| BER of the kth channel | |
| Represents SUs of the cth class | |
| Stability index of the kth channel | |
| Stability index of the kth channel |
| Classes | Minimal QoS Requirement | ||
|---|---|---|---|
| Data Rate (Kbps) | Bit Error Rate | Stability Index | |
| () | () | () | |
| Video | 90 | 5 | 0.5 |
| Voice | 9.6 | 10 | 0.75 |
| Web | 30.5 | 12 | 0.3 |
| Ivideo | 90 | 8 | 0.3 |
| Ismoke, ICO | 5 | 10 | 0.8 |
| NM | 60 | 10 | 0.85 |
| Parameters | Values |
|---|---|
| Power (P) | 35 dBm |
| Noise variance () | 0.1∼0.65 |
| Channels | 100 |
| PU activity | 0.0∼0.6 |
| Population size | 12 |
| PSO acceleration coefficients | 2 |
| PSO inertia weight | 0.72 |
| [−100, 100] | |
| Sensing interval | 0.1 ms |
| Modulation scheme | MQAM |
| Constellation size | 4 |
| History slots | 30 |
| History partitions | 3 |
| Weights [] | [0.6, 0.25 0.15] |
| Low Traffic | High Traffic | ||
|---|---|---|---|
| Class | Members | Class | Members |
| Video | 2 | Video | 5 |
| Voice | 4 | Voice | 5 |
| Web | 4 | Web | 10 |
| Ivideo | 5 | IVideo | 10 |
| Ismoke, ICO | 4 | ISmoke, ICO | 5 |
| NM | 1 | ICo | 5 |
| Schemes | Traffic Classes of Mobile Users, IoT and NM | |||||||
|---|---|---|---|---|---|---|---|---|
| Voice | Web | Ivideo | NM | |||||
| Low | High | Low | High | Low | High | Low | High | |
| Random | 0.2267 | 0.4760 | 0.2848 | 0.5510 | 0.3058 | 0.6251 | 0.0258 | 0.3989 |
| Greedy | 0.0834 | 0.1828 | 0.0935 | 0.2124 | 0.1060 | 0.2456 | 0.0098 | 0.1684 |
| Proposed | 0.0561 | 0.1124 | 0.0688 | 0.1396 | 0.0756 | 0.1567 | 0.0018 | 0.0995 |
© 2016 by the authors; licensee MDPI, Basel, Switzerland. This article is an open access article distributed under the terms and conditions of the Creative Commons Attribution (CC-BY) license (http://creativecommons.org/licenses/by/4.0/).
Share and Cite
Aslam, S.; Hasan, N.U.; Shahid, A.; Jang, J.W.; Lee, K.-G. Device Centric Throughput and QoS Optimization for IoTsin a Smart Building Using CRN-Techniques. Sensors 2016, 16, 1647. https://doi.org/10.3390/s16101647
Aslam S, Hasan NU, Shahid A, Jang JW, Lee K-G. Device Centric Throughput and QoS Optimization for IoTsin a Smart Building Using CRN-Techniques. Sensors. 2016; 16(10):1647. https://doi.org/10.3390/s16101647
Chicago/Turabian StyleAslam, Saleem, Najam Ul Hasan, Adnan Shahid, Ju Wook Jang, and Kyung-Geun Lee. 2016. "Device Centric Throughput and QoS Optimization for IoTsin a Smart Building Using CRN-Techniques" Sensors 16, no. 10: 1647. https://doi.org/10.3390/s16101647
APA StyleAslam, S., Hasan, N. U., Shahid, A., Jang, J. W., & Lee, K.-G. (2016). Device Centric Throughput and QoS Optimization for IoTsin a Smart Building Using CRN-Techniques. Sensors, 16(10), 1647. https://doi.org/10.3390/s16101647