An application of the sensor in the milling process was carried out to verify its dynamic performance in the actual machining operation.
3.2.1. Measuring Range Estimation
To ensure the milling accuracy, the deflection of the bearing table under the workpiece has to be addressed [
17]. In order to keep the sensor center platform within modest displacement, the fixed dynamometer requires a limit in its measuring range. When the deformation of the center platform is considered, its own shape change must be taken into account. When an AISI1045 steel workpiece of 88 mm × 88 mm × 15 mm is placed on the sensor, with the force applied point chosen at the vertex of the corner of the workpiece, the maximal deformation of the sensor center table is obtained. In static FEM (Finite Element Method) simulation, when 800 N of
FX is imposed, the
X,
Y, and
Z directional displacements are not more than 1.09 × 10
−2 mm, 8.29 × 10
−3 mm, and 6.98 × 10
−3 mm; loaded with 400 N of
FZ, the maximal deformations in the
Z,
X, and
Y directions are 2.00 × 10
−2 mm, 1.36 × 10
−3 mm, and 1.36 × 10
−3 mm. Therefore, according to sensor symmetry, the measuring range of the developed dynamometer is set as from −800 N to 800 N for
FX, from −800 N to 800 N for
FY, and from −400 N to 400 N for
FZ. Based on the measuring range, vertical milling was selected in the following milling test.
3.2.2. Natural Frequency Identification
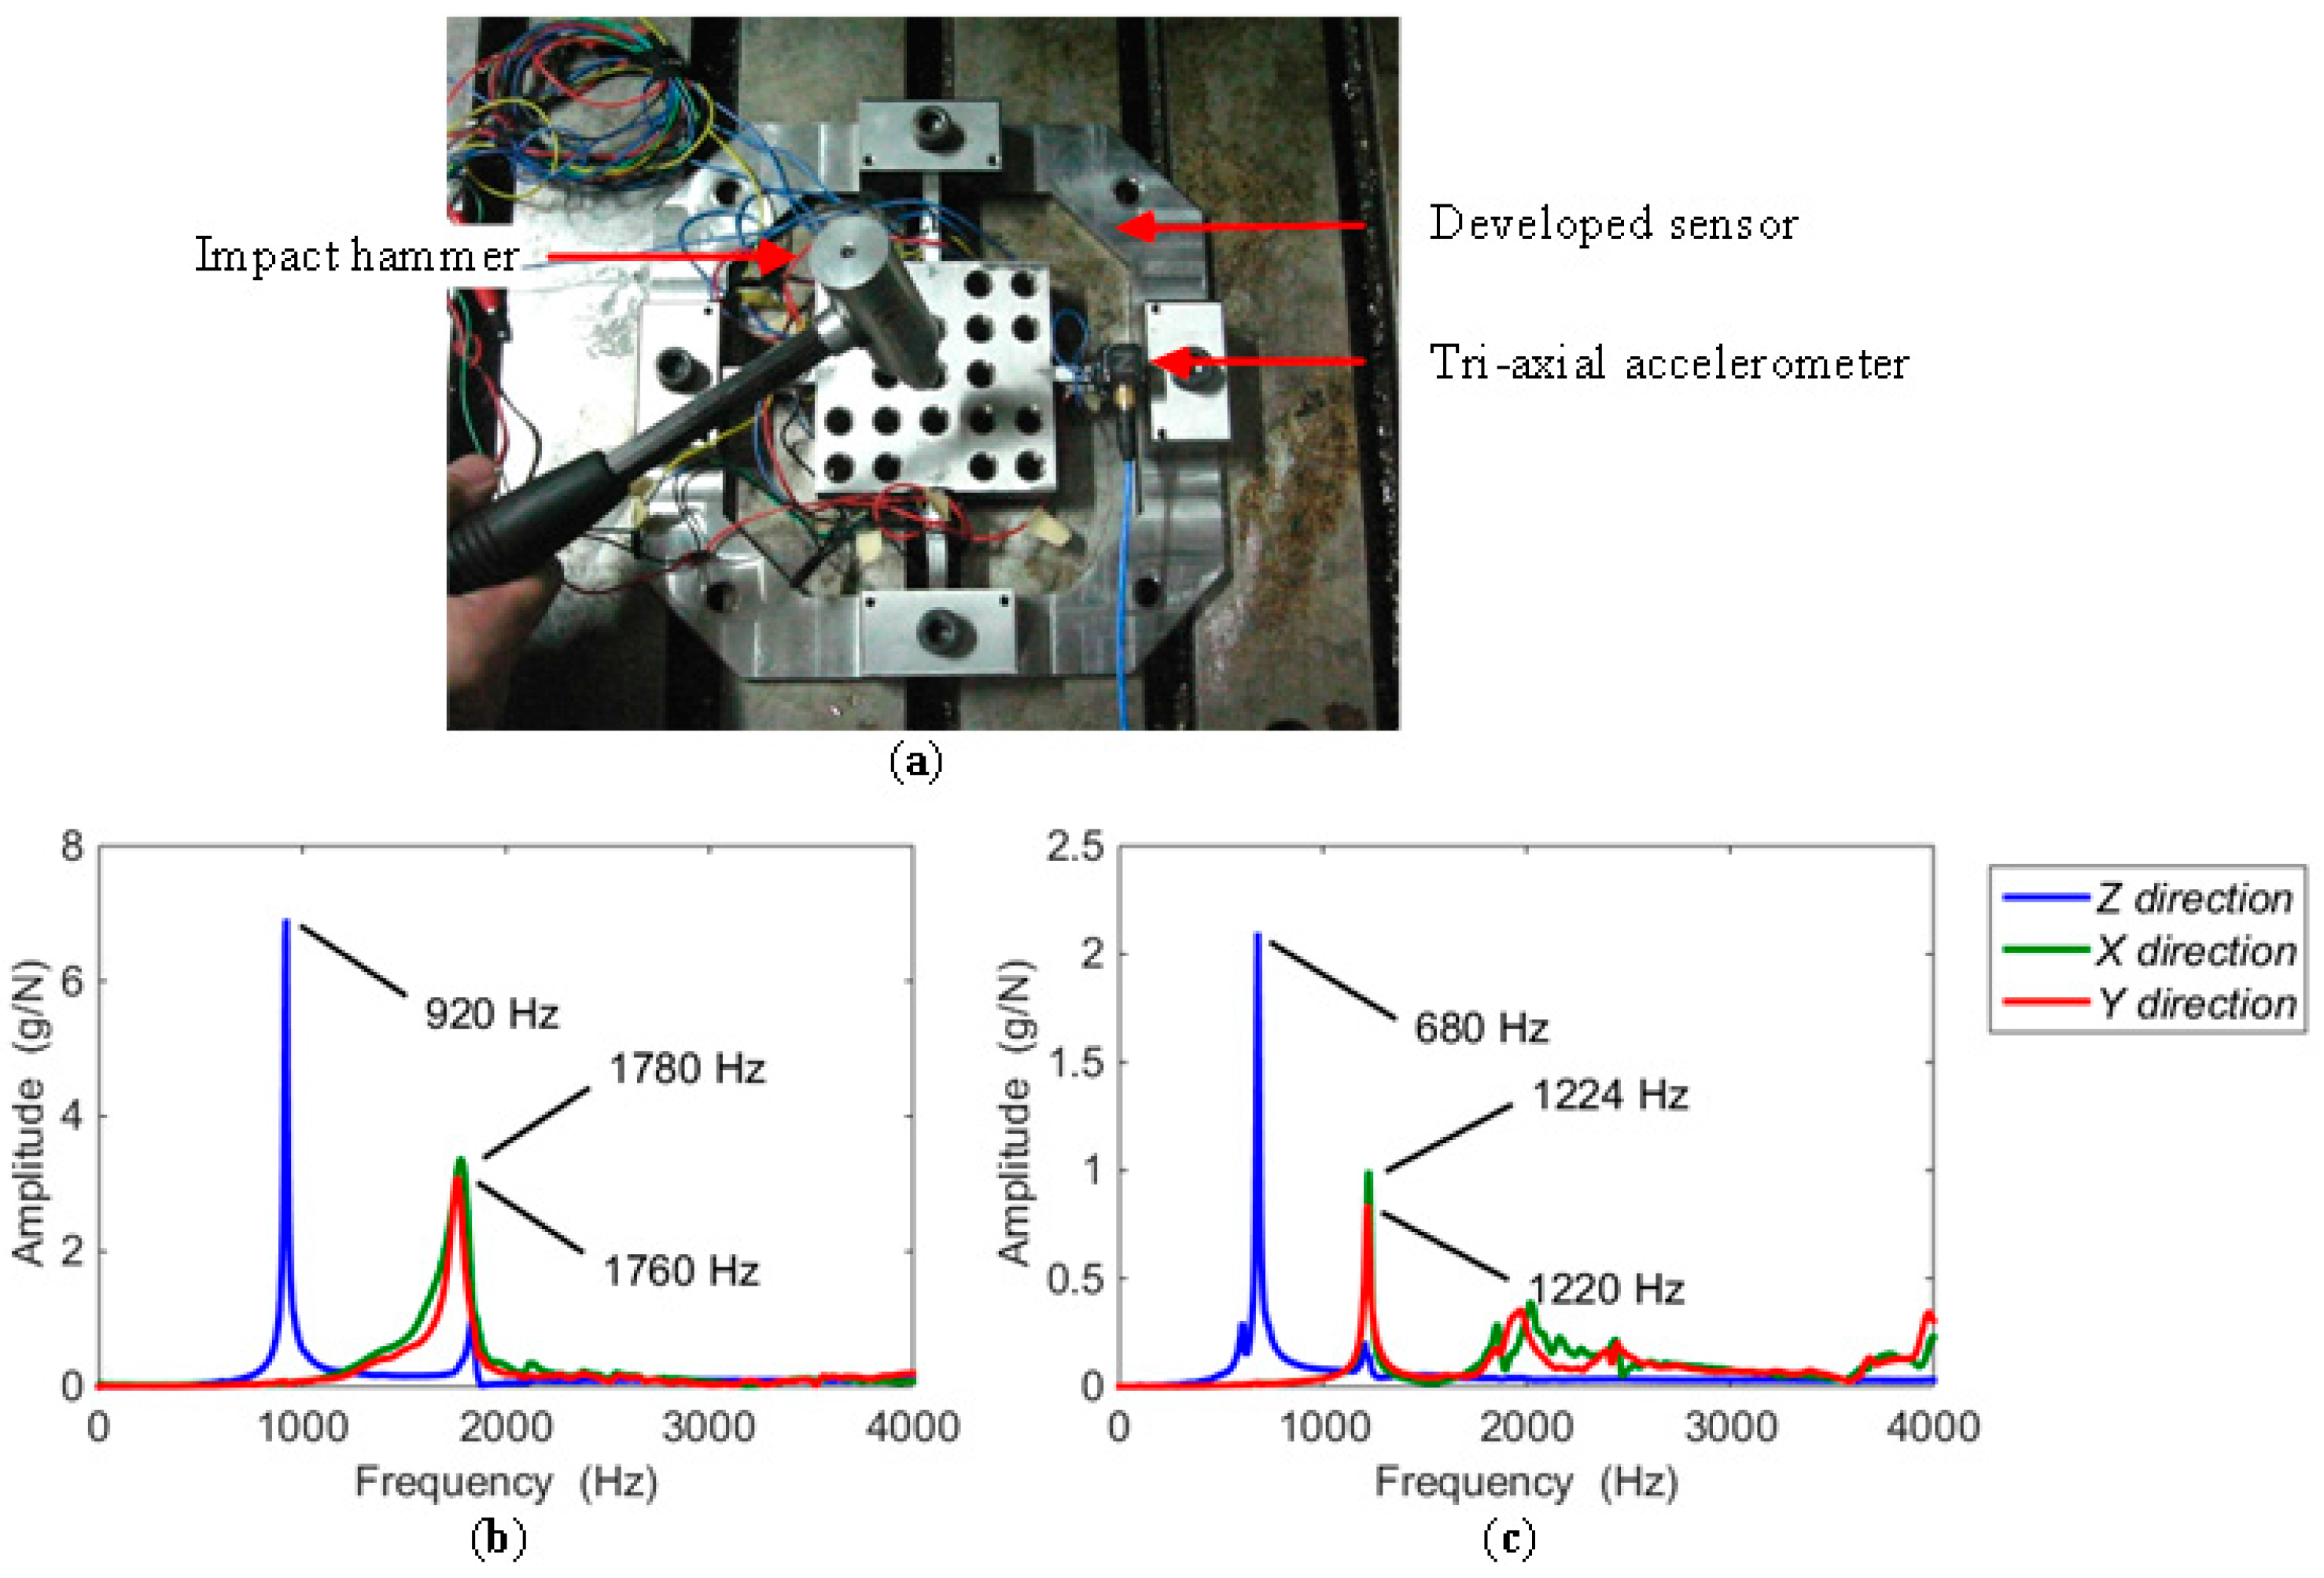
In a milling experiment, the testing frequency is caused by the edge of the tool cutting into the workpiece. The identification of natural frequency must be achieved before the milling experiment. With the dynamometer mounted on the milling table, the measurement of natural frequencies was performed via hammer impact testing. As shown in
Figure 11a, with a tri-axial accelerometer (type 95663) attached on the beam, the sensor was tapped by the impact hammer (type 086D05) at a chosen exciting point, and in one direction at a time. The signals of force and acceleration separately derived from the impact hammer and accelerometer were both collected in a SIEMENS mobile LMS SCADAS305 data acquisition cabinet, and processed by the software of LMS Test Lab. The natural frequencies of the sensor in the
X,
Y, and
Z directions are 1780 Hz, 1760 Hz, and 920 Hz, as depicted in
Figure 11b. To complete the following milling test, when a workpiece of 88 mm × 88 mm × 15 mm made by AISI1045 steel was fastened by four M10 hexagonal screws onto the center platform, the natural frequencies were also measured. The results are plotted in
Figure 11c, in which the abscissa values corresponding to the curve peaks in the
X,
Y, and
Z directions are 1224 Hz, 1220 Hz, and 680 Hz, respectively. To avoid exciting vibration affecting the precision of the sensor, it is suggested that the lowest natural frequency of the sensor should be at least four times larger than the exciting frequency [
18]. Thus, in a milling test, supposing a cutter with one flute is used, the highest spindle speed has to be lower than 680 Hz/4 = 170 Hz = 10,200 rpm. When a milling tool with three cutting edges is selected in an experiment, the spindle speed does not exceed 680/4/3 ≈ 56.67 Hz = 3400 rpm. Due to the gaps retained on the sensor beams, though the natural frequency of the dynamometer is enough for milling experiment, it is still inadequate for actual application. The stiffness enhancement still requires further research.
3.2.3. Dynamic Milling Test
Dynamic milling testing was carried out by peripheral milling on AISI1045 steel workpieces, with three-edge solid carbide end milling cutters (manufactured by AHNO Tool, Suzhou, China), whose diameters are 16 mm. The experiments were operated in a BCH850 three-axes CNC milling machine under dry cutting conditions. Cooling time was necessary during the experiment to minimize the temperature variation and restrain the corresponding error caused to the sensor output. As plotted in
Figure 12b–d, seven pairs of milling positions (M1–M7) were chosen to machine step shapes via up-milling with the feeding direction along the negative
X axis. In each group, two different places were involved to assess the influence of the cutting positions, are distinguished by suffixes A and B designated in their names (e.g., M1A and M1B in group M1). In testing groups M1–M5, a milling cutter with helix angle of 15° was used, and machining parameters were set as follows: radial cutting depth (
ae) of 2 mm, axial depth (
ap) of 1.5 mm, and feed rate (
fz) of 1/12 mm per tooth. Spindle speeds (n) of 600 rpm, 2000 rpm, 3000 rpm, 1000 rpm, and 2500 rpm, respectively, were tested at positions M1–M5. To validate the positional influence under larger values of
FZ, a milling tool with helix angle of 45° was employed in experimental groups M6 and M7. Machining parameters were configured as cutting depth (
ae) of 1 mm and feed rate (
fz) of 0.15 mm per tooth. In M6 and M7, axial depths (
ap) were separately selected as 10 mm and 6 mm, and spindle speeds (
n) were chosen as 500 rpm and 1500 rpm, respectively. TI PGA308 chips were used to amplify the sensor output signals within 0–5 V, and the waveforms were detected by an oscilloscope, Tektronix MSO 4104, configured with a sampling rate of 10 KHz. As shown in
Figure 12a, the sensor was placed on a Kistler 9265B dynamometer, which was employed as a reference of standard force value. Since the length of the sensor pedestal is longer than the width of the standard dynamometer, both of their natural frequencies are reduced, and additional vibration was brought into the output signals. Hence, a program of 600 Hz low-pass pre-filter was introduced before data processing.
The recorded waveforms in the time domain obtained at M1B–M7B are plotted in
Figure 13, and the corresponding Fourier transformations of
FX are depicted on the right side. Because of the similarity, the data for subgroup A and Fourier transformations of
FY and
FZ are all skipped in the graph. The milling periods are clearly demonstrated both from the peak repetition in the time domain and the component distributions in the frequency domain.
In order to compare the measured results between different milling positions, the data in the same pair with an equal amount of time (
TS) are extracted from the measured force values in the stable milling state, as the example of shrinking views for M2 shown in
Figure 14. Based on the selected data, the peak to peak amplitudes of each force component (
FX,
FY, and
FZ) gained from every spindle cycle are averaged. The computational method is expressed in Equation (10), and the solved results are filled in
Table 5.
where
N represents the number of the spindle cycles involved in the period of
TS;
Fj(i, c)P-P denotes the peak to peak amplitude derived in the
c-th spindle cycle from the position of M1–M7; and
Fj(
i)
P-P is the average value of peak to peak force amplitude separately obtained in M1–M7.
In
Table 5, the measured forces derived from the static decoupling matrix (Equation (8)) are compared with the benchmarks obtained from the standard dynamometer. The coefficient is the quotient obtained by measured value dividing its reference. The ratios are 1.36% ± 4.51%, 1.33% ± 2.34%, and 1.51% ± 5.99%, respectively, in the
X,
Y, and
Z directions, which proves the validity of the measured data compared with the output signals derived from the standard dynamometer.
Based on
Table 5, the output variations in different milling groups are expressed via fractional errors, and subgroup A is taken as the reference. The calculation formula is given in Equation (11), and the results are tabulated in
Table 6.
where
Ej(
i)
P-P represents the output deviation between the two average peak to peak force values derived in each pair.
As illustrated in
Table 6, roughly compared by subtraction, the maximal deviation between tested and standard force variation is 6.61%, which appears in the
Z direction. Due to the lowest stiffness being along the
Z axis, it is most easily affected by the additional vibration caused by the sensor installation, as mentioned above. Although the pre-filter has been used, the force amplitude is still impacted, which also makes the
FZ coefficient deviation listed in
Table 5 larger than the other two ratios derived from
FX and
FY. Moreover, though a cooling period has been taken, due to the different distances between strain gauges and milling positions, the influence of temperature changing was not completely eliminated by the measuring circuit. Considering these issues, the deviations of the measured forces are acceptable in the range of the center platform for a monitoring system applied in the milling process.


