3.1. Description of Database, Performance Measurement, and Experimental Setup
There exist open databases which can be used for body-based recognition such as human identity or gender recognition. However, they include only visible light images [
25,
26,
27] or thermal images [
28] in the database. Therefore, these databases cannot be used in our research because the dataset including both the visible light and thermal images captured simultaneously is necessary. Although there exists other open database including both visible light and thermal images for pedestrian detection [
29], it is difficult to obtain the ground-truth gender information from the images of database because people were captured at very far distance from the cameras. In addition, the number of people in this database is too small (less than 40 persons) to be used for training and testing of gender classification in our research.
In previous research by Nguyen et al., a database of 103 persons, including images of 66 males and 37 females, was used in their experiments [
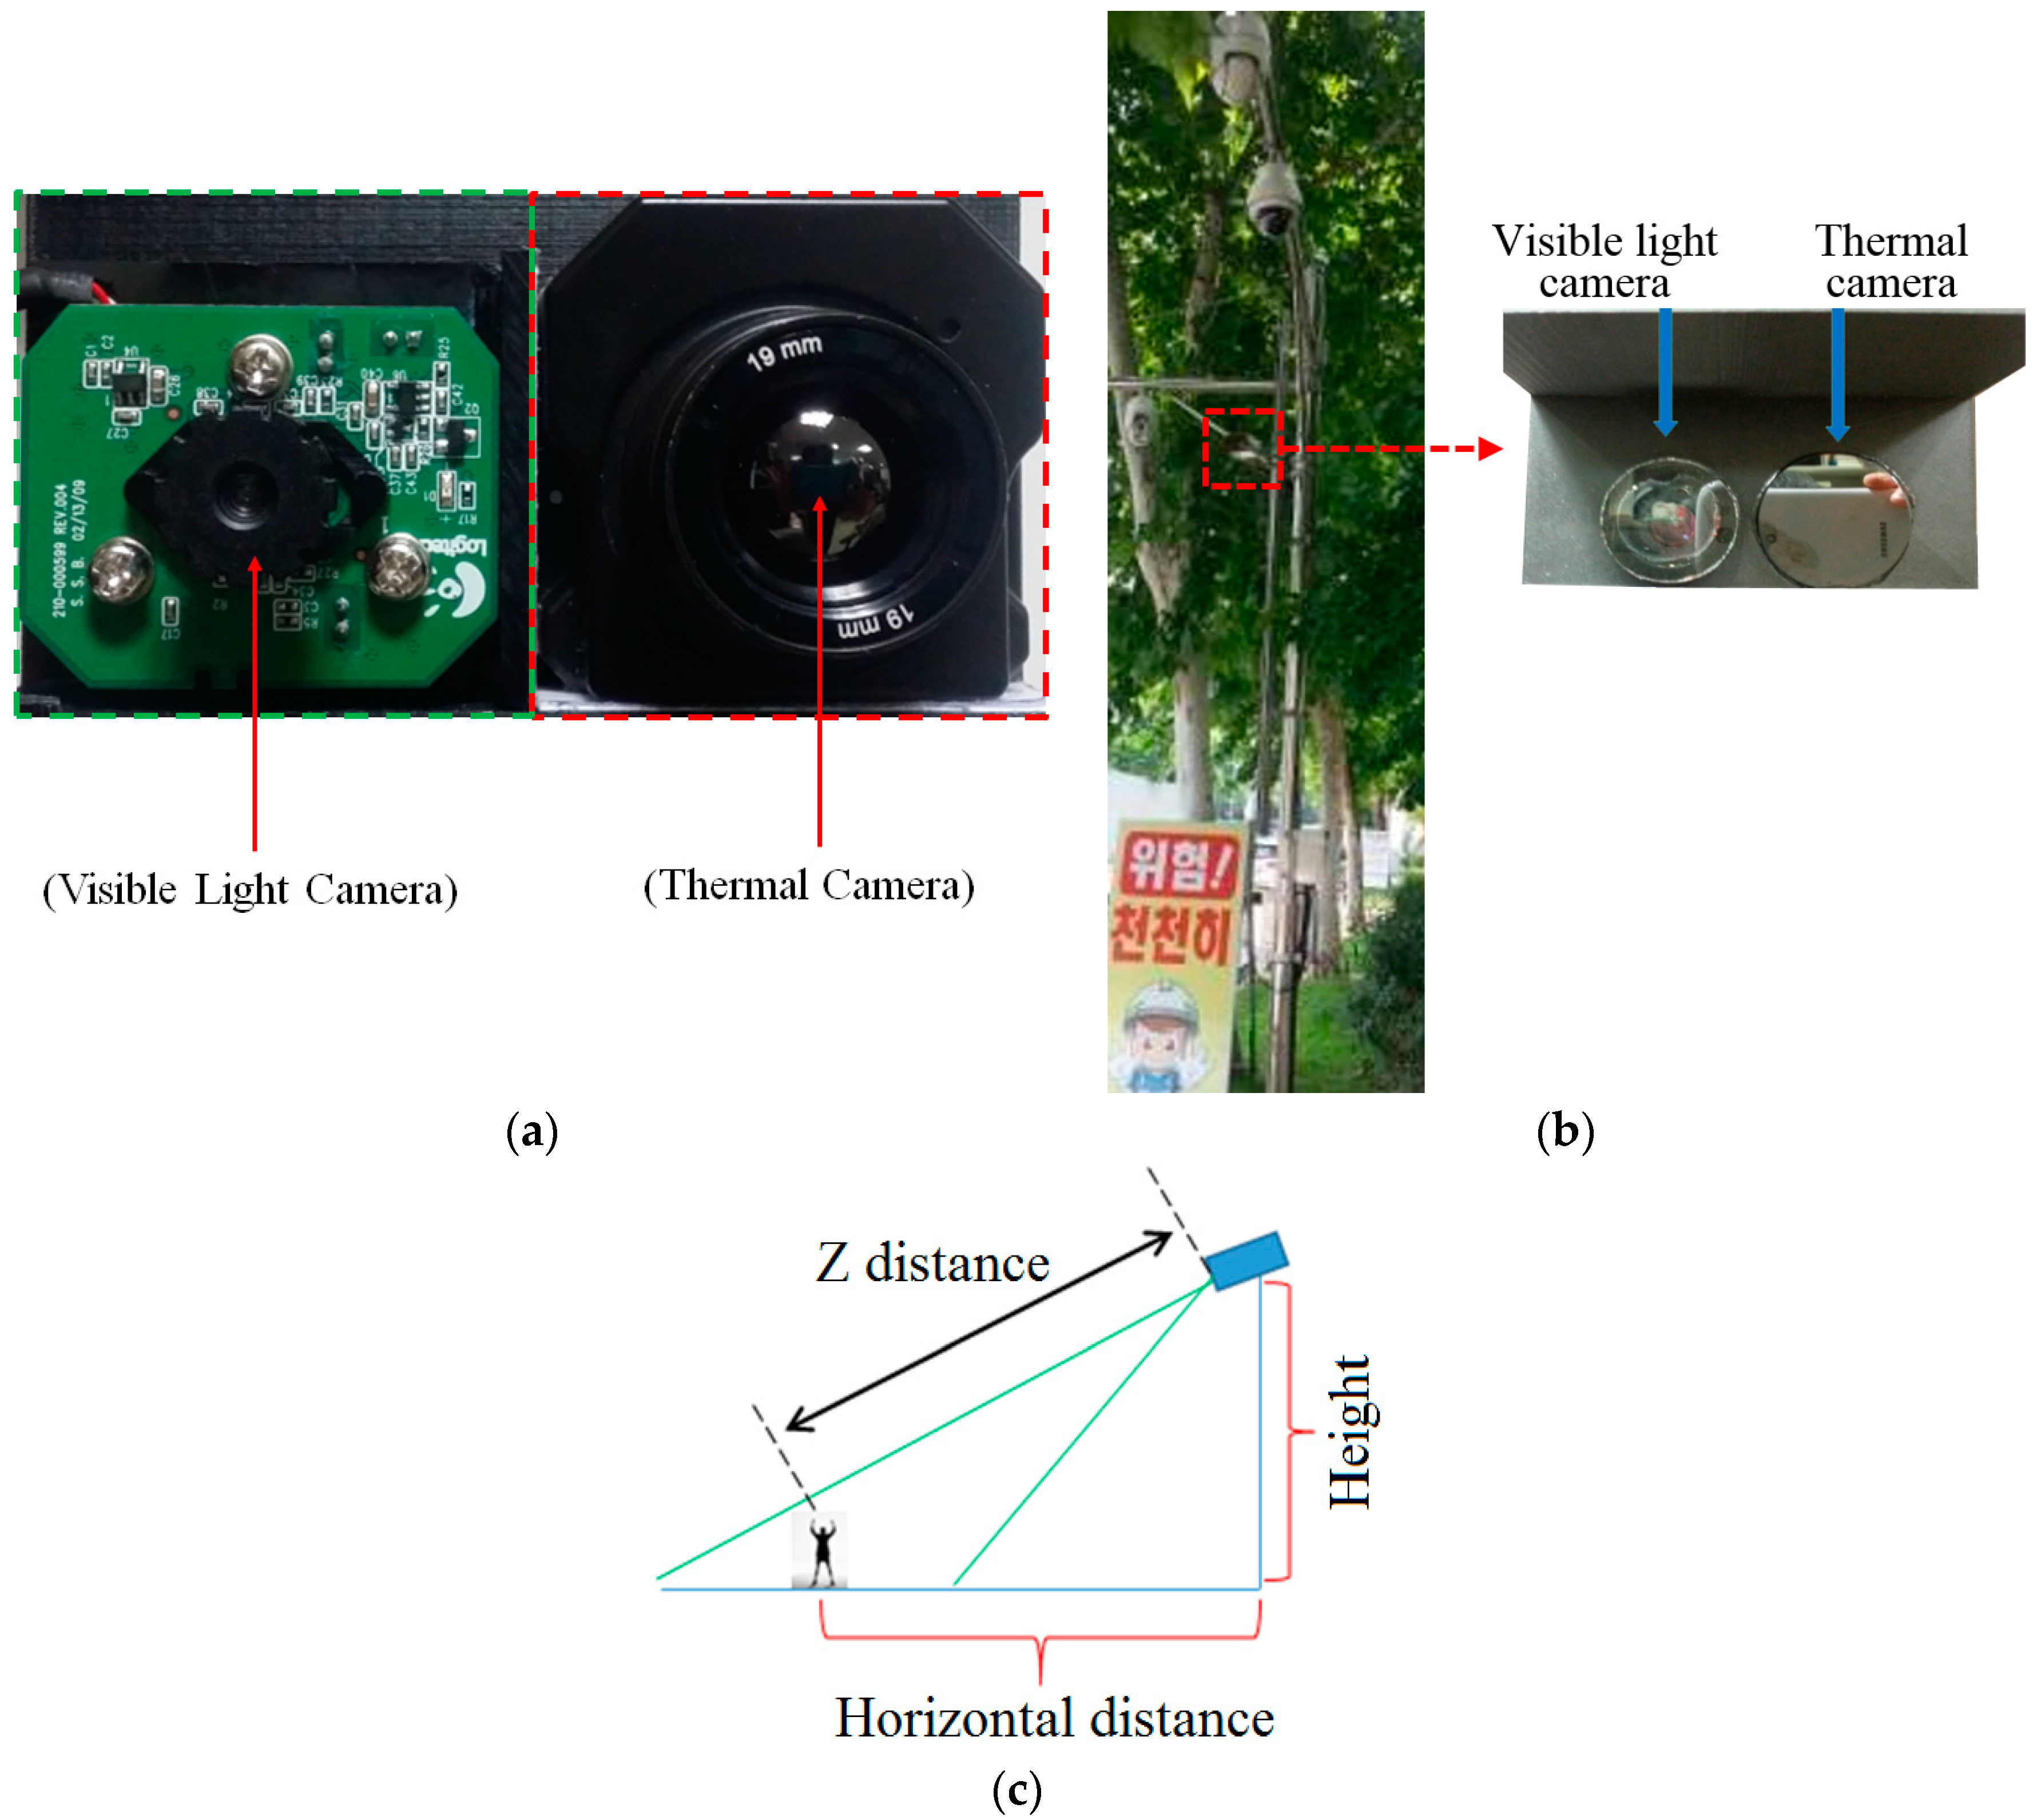
16]. Because there is no open database to be used for the evaluation of our method and in order to test the system with a larger database, we collected a new database of 412 persons with different body-view of subjects such as front, back, and side views. Similar to research by Nguyen et al., we placed the cameras (visible light and thermal cameras) near to each other to create a dual-camera set up, as shown in
Figure 5a, and placed it at a height of roughly 6 m. This set up is used as a simulation of a normal surveillance system.
Figure 5b shows the example of setup of our system in actual surveillance environments. In our experiments, we used a webcam camera (C600, Logitech, Lausanne, Switzerland) [
30] for capturing visible light images, and a Tau2 camera (FLIR systems, Wilsonville, OR, USA) [
31] for capturing thermal images. The visible light camera captures images with a size of 800 × 600 pixels. The thermal camera captures images with a size of 640 × 480 pixels. We prevent rain from entering the visible light and thermal cameras by attaching a glass cover (conventional transparent glass and germanium glass transparent to medium-wavelength infra-red (MWIR) and long-wavelength infra-red (LWIR) light [
32] for the visible light and thermal cameras, respectively) to the front of each camera, as shown in the right image of
Figure 5b.
In our research, we aim at the gender recognition in surveillance system (not retail domain). Gender recognition in surveillance system has a lot of advantages. One of them is that it can enhance the accuracy of face recognition by pre-classification based on gender in 1-to-N matching of face recognition. For example, if the face recognition system should match the input face with 1000 faces (criminal suspicious faces or faces of missing children) in the databases (where the numbers of male are 500) and the gender of people of the input image is classified as male in advance by our system, the face recognition system can match the input face only with 500 male faces (not 1000 faces), which can highly increase the matching speed and accuracies. In addition, the gender information can be helpful for intelligent surveillance system to determine the criminal suspicious situation. For example, in case that a female is persistently traced by a male in alley at night (where there is not other people), it can be determined as criminal suspicious situation. By notifying this situation to the nearest police station, criminal can be prevented. In addition, in some public areas, knowing gender can help the manager create restricted male and female areas [
4].
Therefore, in our research, we aim at the gender recognition in surveillance system (not retail domain), and its necessity is increased in intelligent surveillance system. In case that the camera is installed at 3 m in surveillance system, pedestrian can easily break the camera. Therefore, the camera is usually installed at a height of roughly 6 meters or higher in conventional surveillance system. Based on
Figure 5c, the height of our camera system and horizontal distance (between the camera system and user) are respectively about 6 m and 11 m. Therefore, Z distance between the camera system and user is about 12.5 m when our dataset was collected.
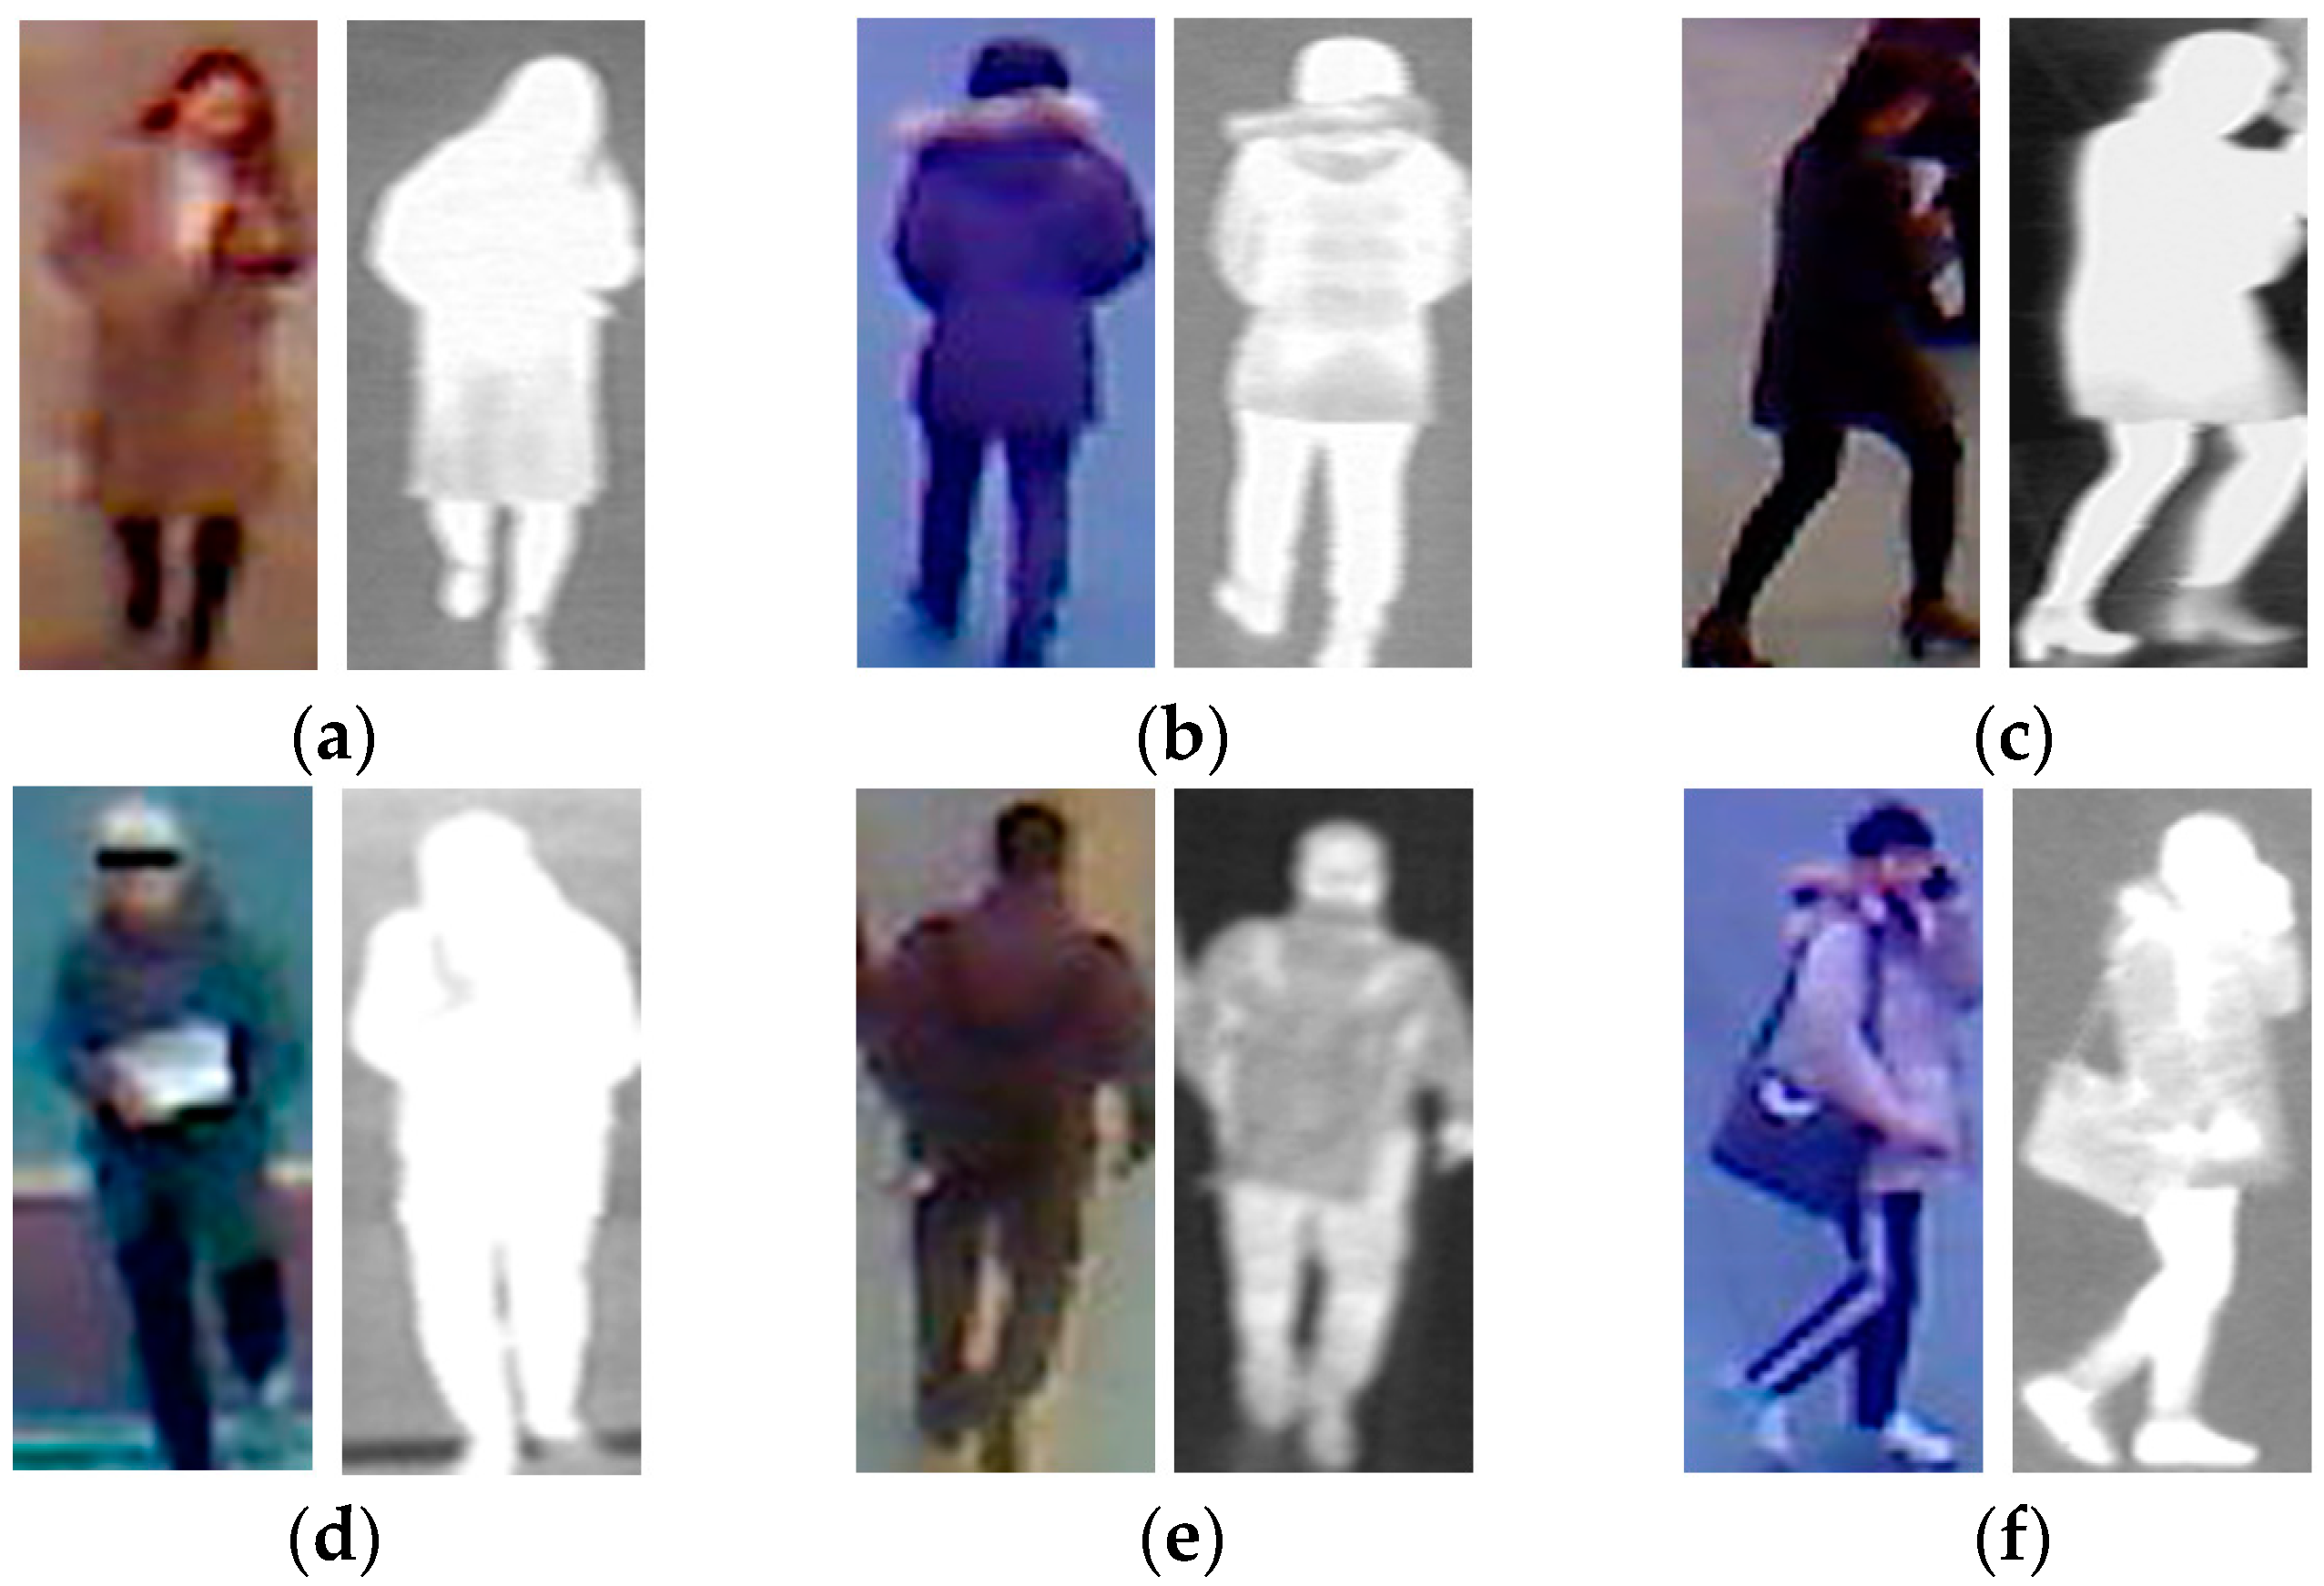
For each person, 10 images were respectively captured by visible light and thermal cameras to simulate the variation of body shape. Therefore, although some images are captured for the same person, they are still different, because of the capturing conditions, body-pose etc. In total, we collected a database including 8240 images (4120 visible light images and 4120 corresponding thermal images). Among the 412 subjects, there were 254 males and 158 females. Using a larger number of persons, we can measure the more correct recognition accuracy using our proposed method, as compared to previous research by Nguyen et al. [
16]. In
Table 2, we present a description of the collected database used in our experiments. For visualization purposes, we also show some example images of human bodies in our collected database in
Figure 6. As shown in
Figure 6, our database contains images of the human body with large variations in body-view (front, back, and side view), background, clothes, and accessories, etc. In addition, we make our all database (used in our research) [
33] available for others to use in their own evaluations, from which comparisons with our method on same database can be done.
To measure the recognition performance of our proposed system, we randomly divided the collected database in
Table 2 into learning and testing sub-databases five times to perform a five-fold cross-validation method. Consequently, we obtained five learning sub-databases, each sub-database contain images of 204 males and 127 females; and the five testing sub-databases, each sub-database contains images of 50 males and 31 females. Using the learning sub-databases, we learn the parameters of the SVM kernel that best classifies the male and female classes. With the learnt parameters and the SVM kernel, we evaluate the recognition performance using testing sub-databases.
Table 3 shows a detailed description of the learning and testing sub-databases in our experiments.
For the recognition problem, the equal error rate (EER) is normally used to measure the recognition accuracy of the recognition systems. The EER indicates errors for which the false acceptance rate (FAR) is equal to the false rejection rate (FRR). In our problem of gender recognition, we have two classes: male and female. If we define male as “class 1” (genuine class) and female as “class 2” (importer class), then the FAR is the error by which an image of a female is falsely recognized as a male image. Conversely, the FRR indicates the error by which an image of a male is falsely recognized as a female image. By definition, systems with a small value of EER are systems with high recognition performance; whereas systems with the larger values of EER indicate systems with poor recognition performance. In our experiments, EER is measured using five learning and testing sub-databases, and the final EER of the system is measured as the average of the five results from five learning and testing sub-databases.
3.2. Gender Recognition Using Our Proposed Method
To compare the recognition accuracy of our proposed method with that of the previous method by Nguyen et al. [
16], we first perform experiments using the method of Nguyen et al., using our collected database in
Table 2 and
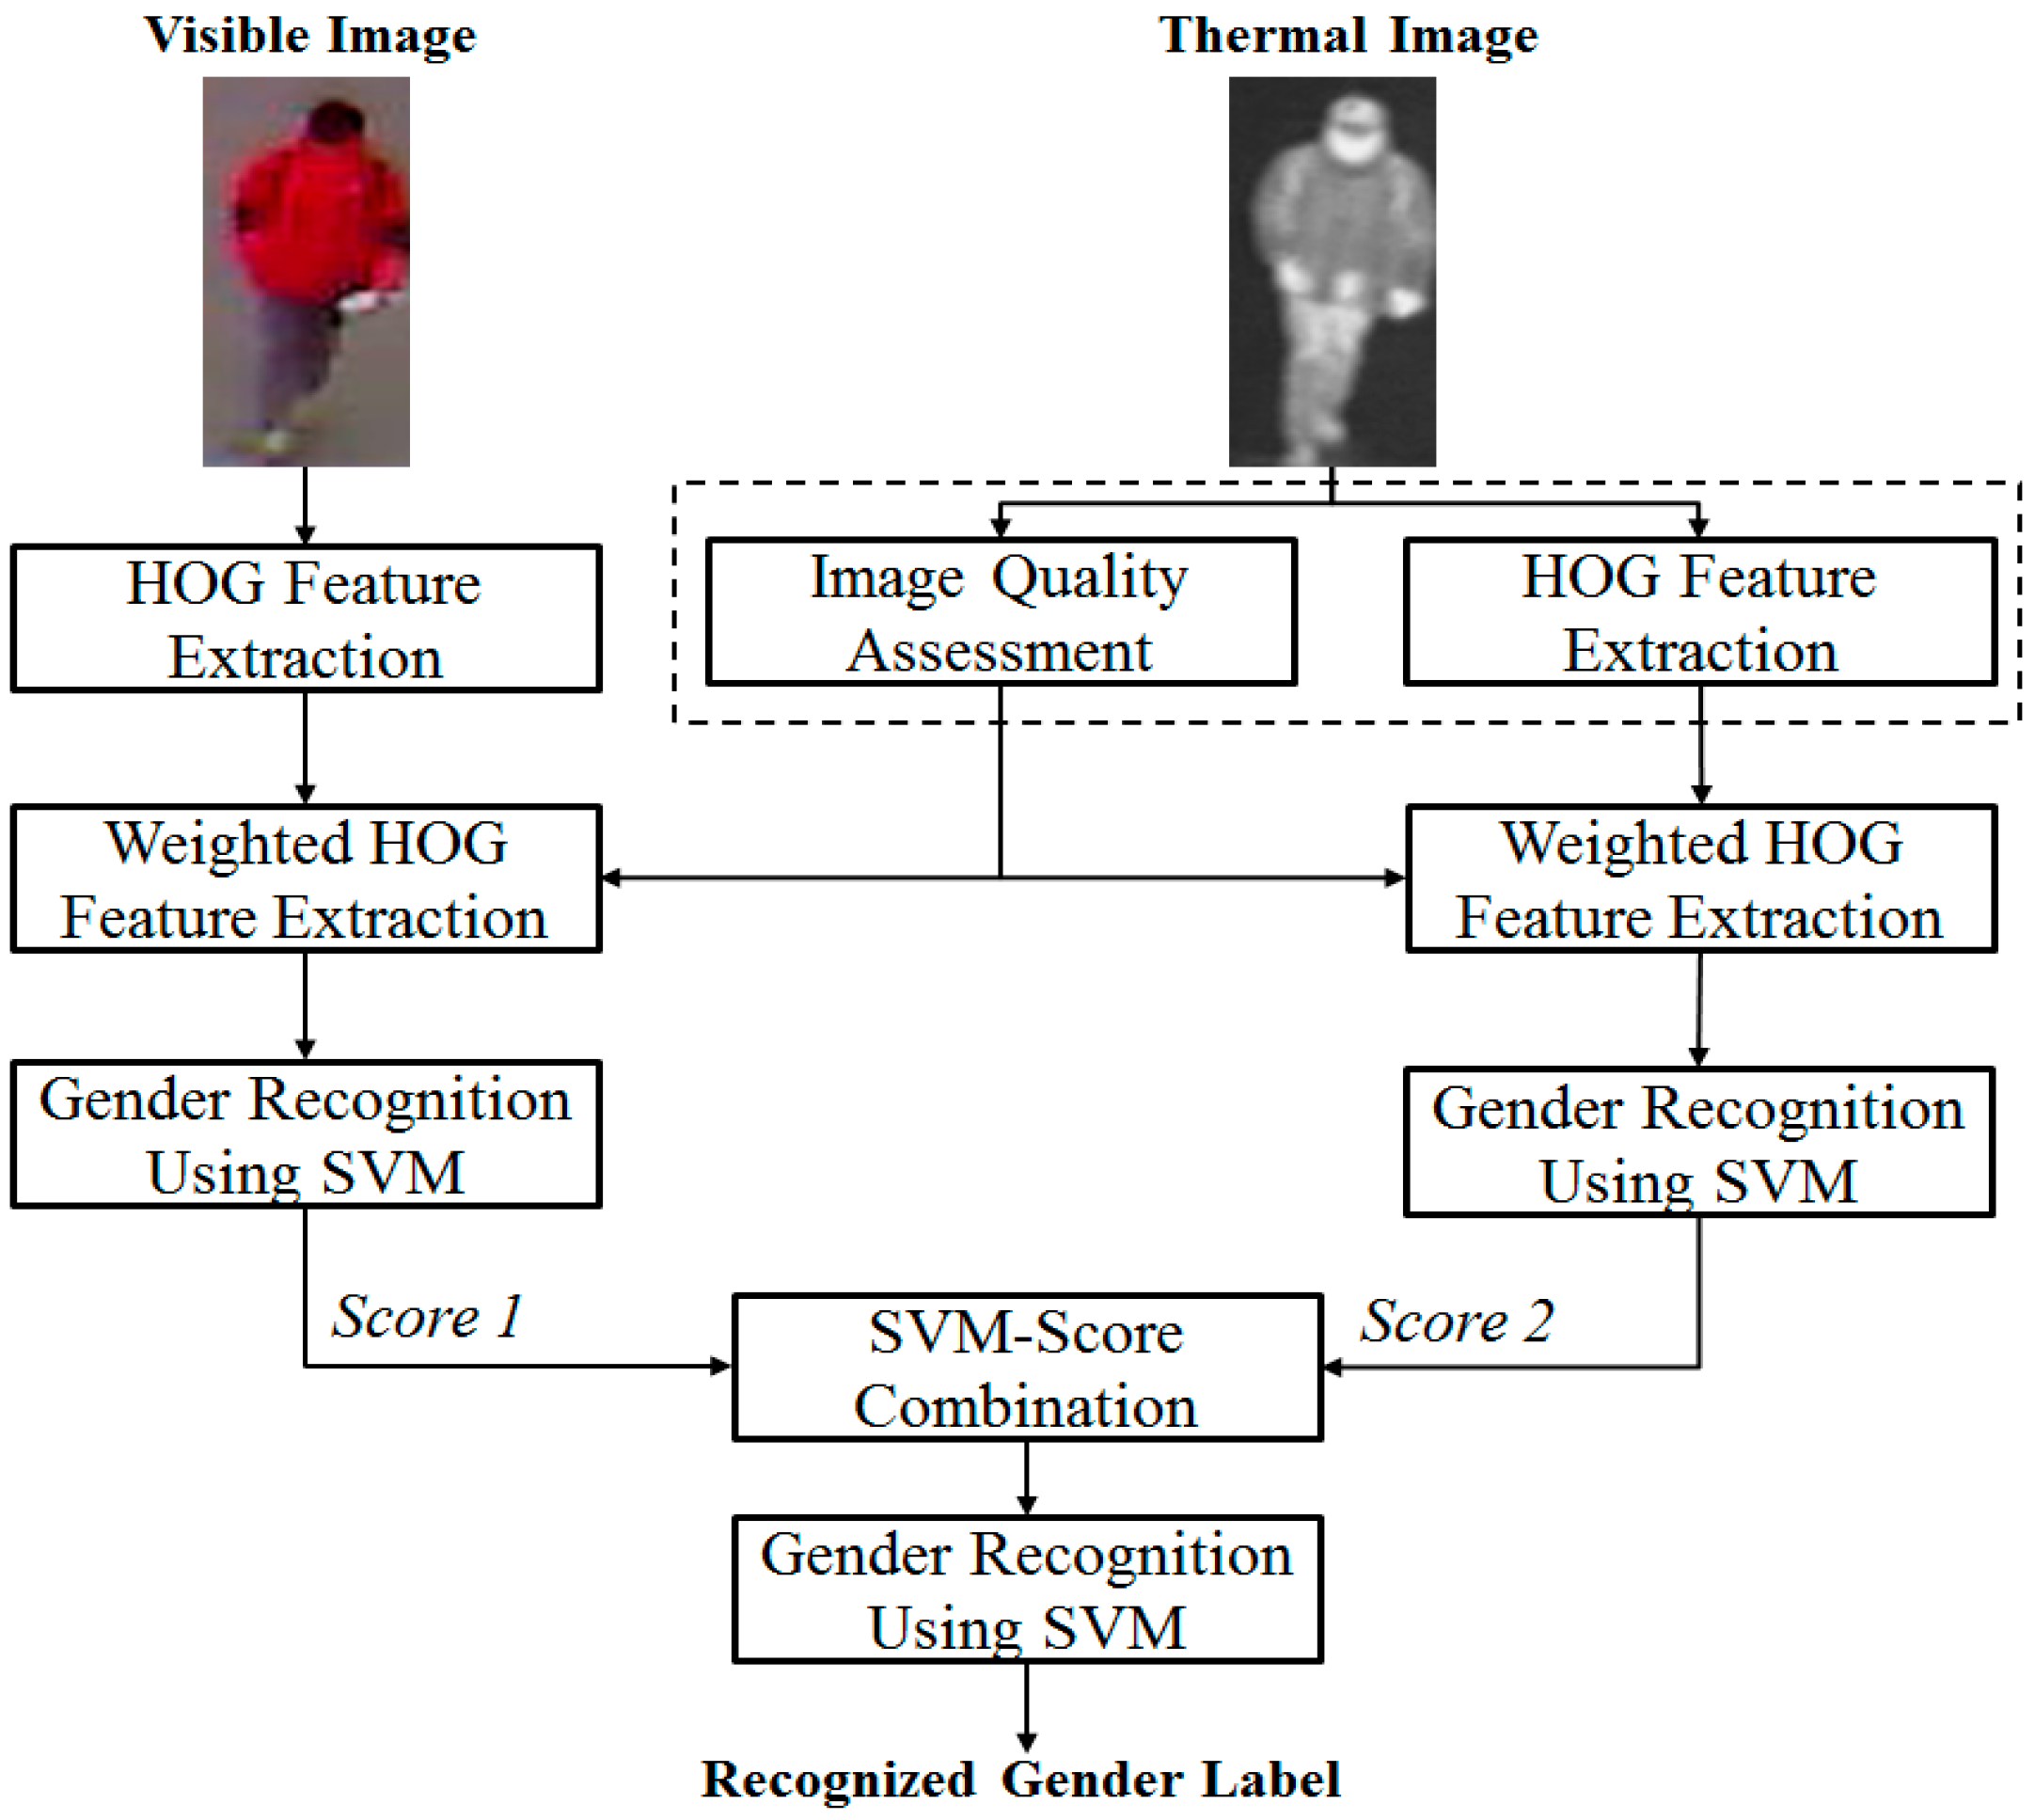
Table 3. The previous method by Nguyen et al., directly uses the HOG feature extracted from the visible light and thermal images for gender recognition using the SVM, without considering the quality measurement of local regions of input images. Therefore, their method corresponds to our proposed method by removing the quality measurement method in
Figure 1. Similar to experiments in their paper, we measured the recognition accuracies of systems using both feature-level fusion and score-level fusion methods using two kinds of SVM kernels, i.e., the linear kernel and the RBF kernel. The details of our experimental results are shown in
Table 4 and
Table 5. In
Table 4, we show the recognition results of systems that only use a single kind of image (only visible light images or only thermal images) in the recognition task. Similar to this table but for combining the visible light and thermal images,
Table 5 shows the recognition results of feature-level fusion and score-level fusion methods. In
Table 4,
Table 5,
Table 6,
Table 7,
Table 8,
Table 9 and
Table 10, the GAR implies the genuine acceptance rate and it is calculated as (100-FRR)(%). In these tables, FAR and GAR at the EER point are shown in bold type.
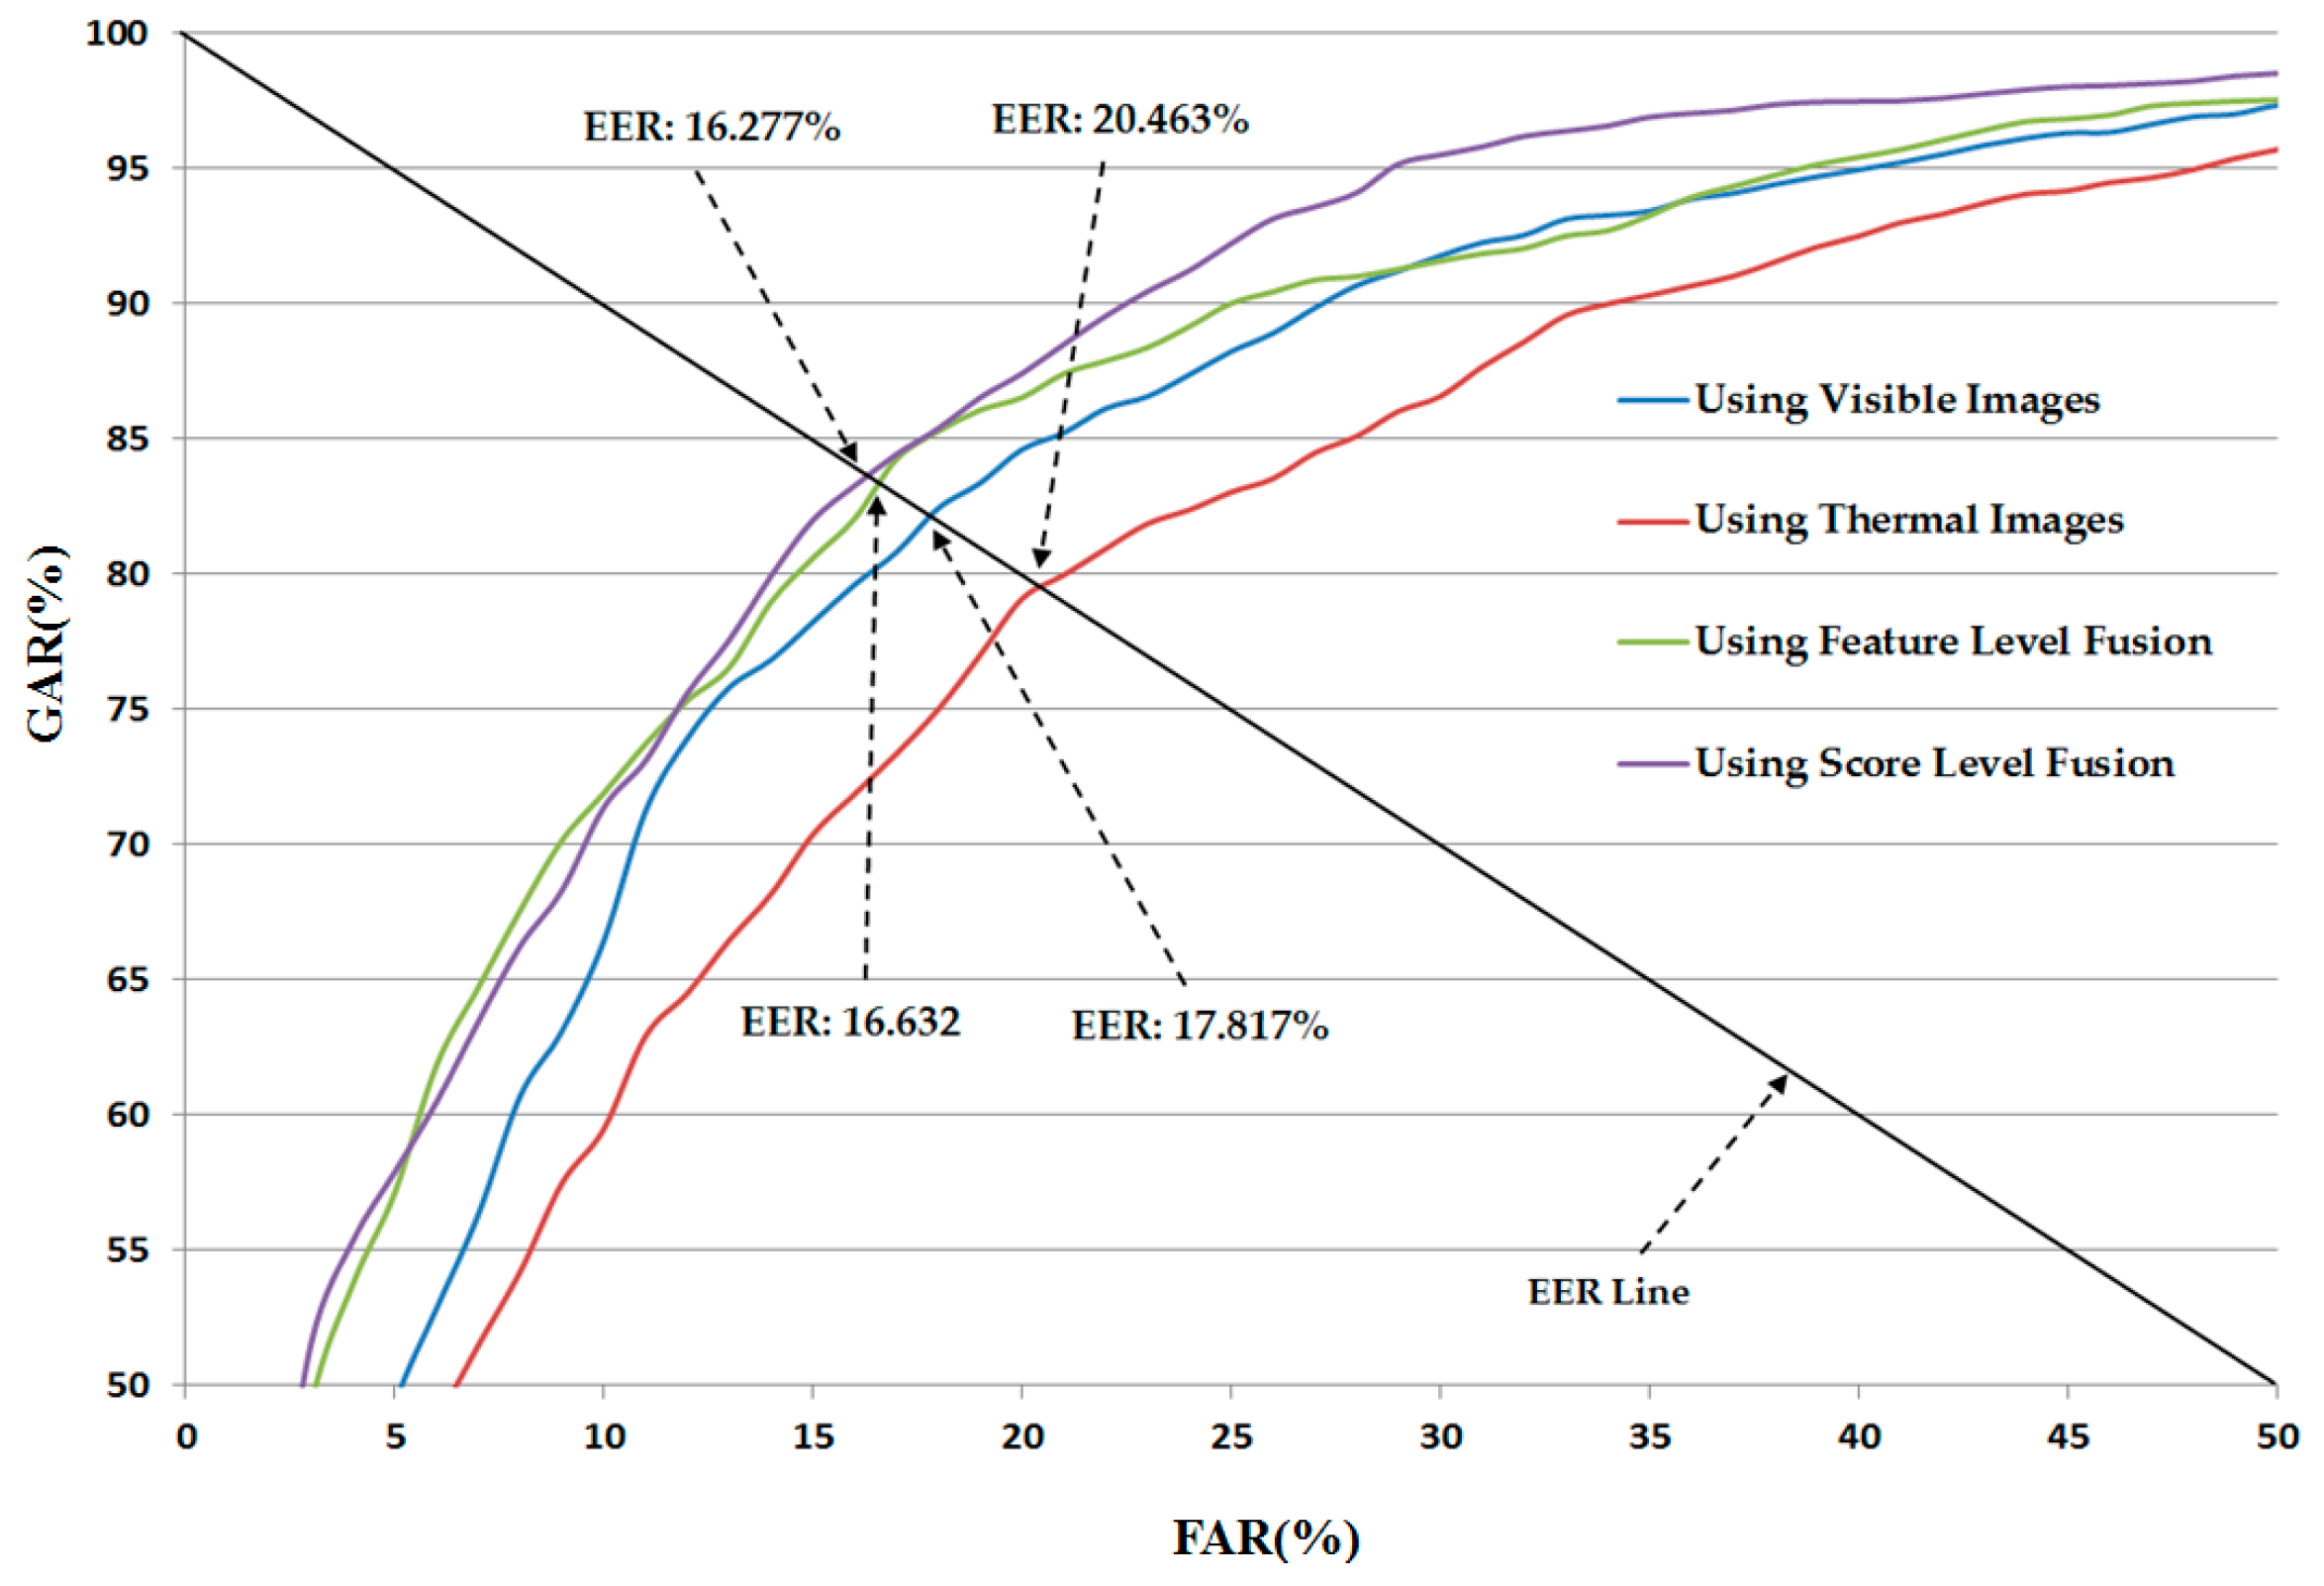
In
Figure 7, we show the average receiver operating curve (ROC curve) of the previous recognition system using our collected database. In detail, the best recognition accuracy was obtained with an EER of 16.277% using the score-level fusion method and RBF kernel in both layers of the SVM classifier. This result is much smaller than the recognition accuracy when we use only visible light images (17.817%) or only thermal images (20.463%), or the feature-level fusion method (16.632%). As shown in
Table 4 to
Table 5 and
Figure 7, we confirm that the combination of visible light and thermal images can help enhance the recognition accuracy of the recognition system. In addition, the RBF kernel is superior to the linear kernel for the recognition problem. However, the recognition accuracy is slightly worse than the previous results reported by Nguyen et al. [
16]. These results are caused by the differences of the databases. In previous research, Nguyen et al., used a database of 103 persons, which is much smaller than the 412 persons of our database. Using a larger database, our experiment can reflect more correct recognition accuracies.
As explained in
Section 2, we proposed the use of two quality measurement methods of image regions for wHOG feature formation, including the MEAN map and the STD map. To evaluate the efficency of each quality measurement method (the MEAN map and the STD map), we measure the recognition accuracies of the recognition system using each individual quality measurement method (Method 1 for use with the MEAN map and Method 2 for use with the STD map as the quality assessment of image regions for both visible light and thermal images) in our next experiments.
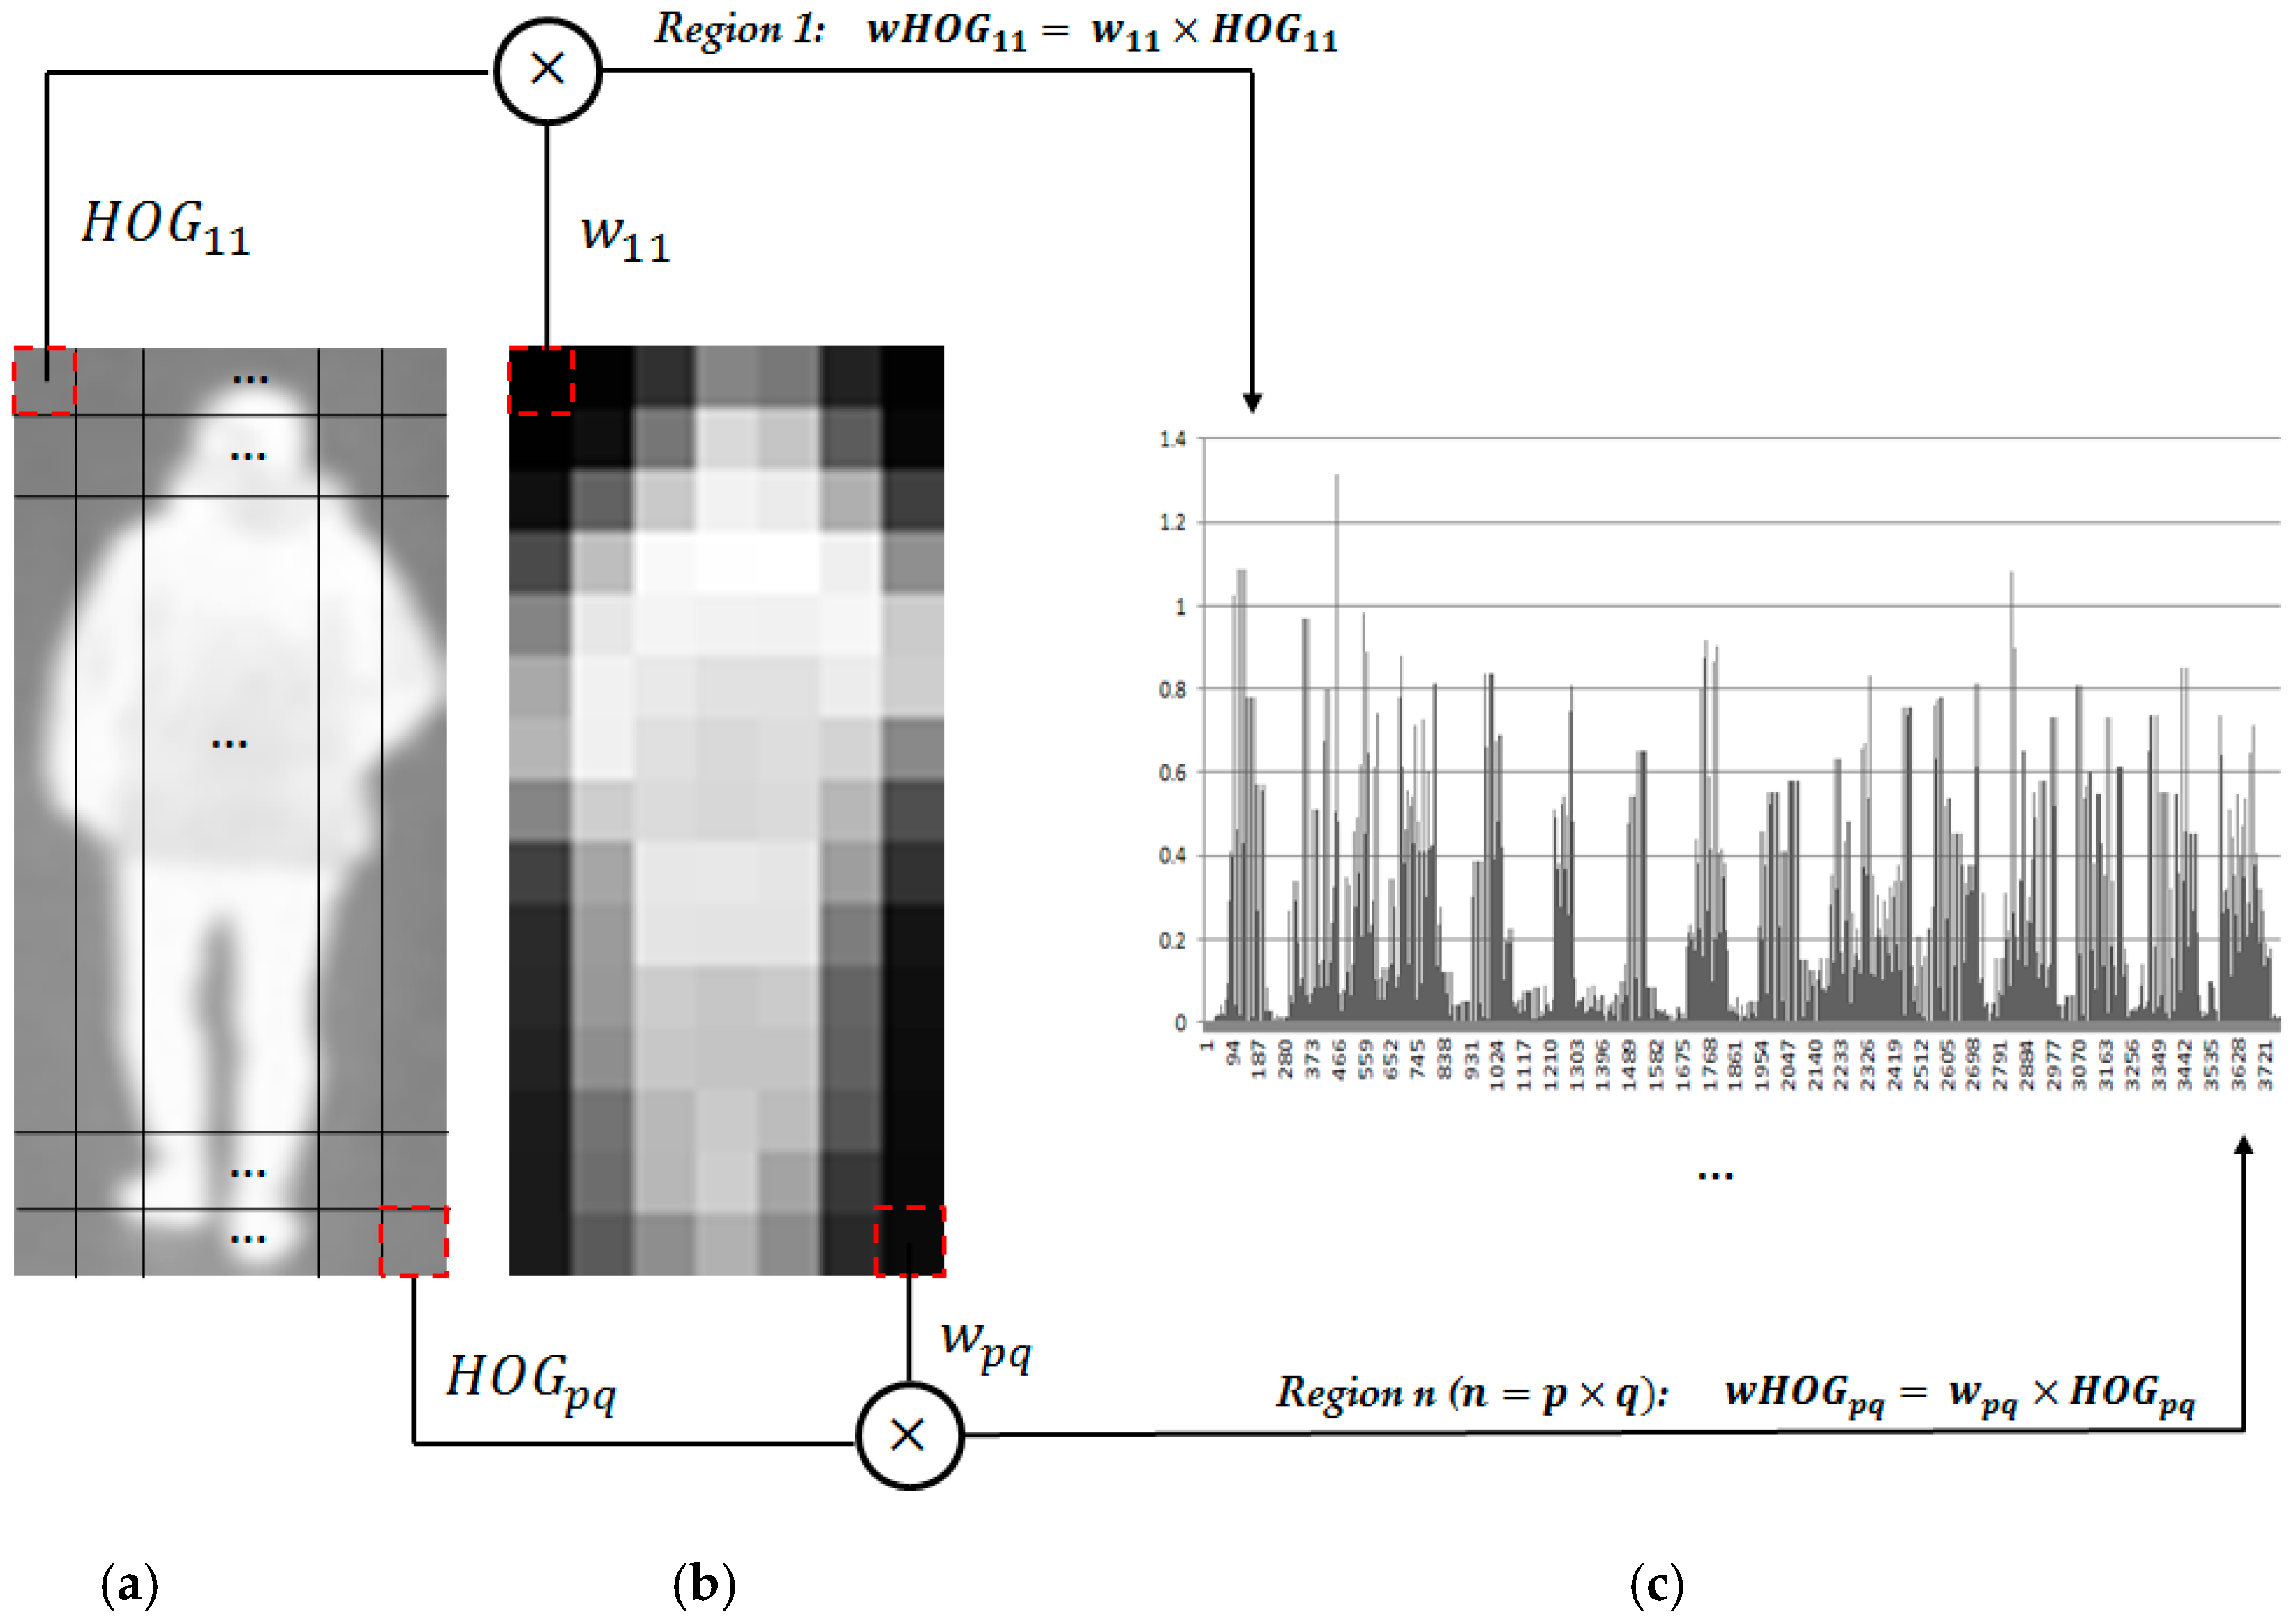
In the second experiment, we use the MEAN map as the quality measurement of image regions for both visible light and thermal images (Method 1). Using Equations (4) and (5), we extract the wHOG feature for gender recognition by combining the HOG feature and the MEAN map of sub-blocks of the input thermal images. With the extracted weighted HOG feature, we perform gender recognition using the SVM with two kinds of SVM kernels, i.e., the linear kernel and the RBF kernel. In
Table 6, we show the recognition accuracy of the recognition system in this experiment. As shown in
Table 6, the best recognition accuracy when using only visible light images was obtained with an EER of 15.219% using the RBF kernel of the SVM; the best recognition accuracy when using only thermal images was obtained with an EER of 18.335% using the RBF kernel. Compared to recognition accuracies of the system that does not consider the quality measurement of image regions in
Table 4, we see that the recognition accuracies (EER) were reduced from 17.817% to 15.219% when using only visible light images; and from 20.463% to 18.335% when using only thermal images for the cases without and with consideration of the quality measurement of image regions, respectively. These results indicate that the MEAN map can enhance the recognition accuracies of the gender recognition system.
Similar to the second experiment for Method 1, we performed our third experiment using Method 2, which uses the STD map of the input thermal images as the quality measurement of local image regions for constructing the wHOG feature. For these experiments, the wHOG features are obtained using Equations (6) and (7) in
Section 2. The detailed experimental results are shown in
Table 7. As shown in this table, the use of STD map helps to reduce the recognition error from 17.817% (for the case without consideration of the quality measurement of the image’s local regions) to 16.669% using only visible light images for the recognition task. When using only the thermal images, the use of the STD map can also reduce the recognition error by producing an EER of 18.257% which is smaller than the error of 20.463% (in
Table 4) produced by the system that does not consider the quality measurement of local image regions, and 18.335% produced by the system that uses the MEAN map of the thermal images as its quality measurement of local image regions.
As shown in
Table 6 and
Table 7, we obtained the best recognition results of 15.219% and 18.257% using only visible light images and only thermal images for the recognition task, respectively. These EERs values are much smaller than the EERs of 17.817% and 20.463% of the system that does not consider the qualities of image regions using visible light and thermal images, respectively. These results were obtained using the MEAN map on visible light images and the STD map on thermal images and the RBF kernel of the SVM. Based on these results, we can find that the use of quality measurement for image regions can enhance the recognition accuracy of the gender recognition system. In addition, we can see that the MEAN map is more efficient for quality measurement of the image’s local regions for visible light images than the STD map; the STD map is more efficient as the quality measurement of the image’s local regions for thermal images than the MEAN map. Therefore, we propose the use of the MEAN map for quality measurement of local regions for visible light images and the STD map as the quality measurement of local regions for the thermal images.
Based on the experimental results of our second and third experiments (Methods 1 and 2), we perform our fourth experiments using our proposed gender recognition method in which the MEAN map is used as the quality measurement of local regions of visible light images and the STD map is used as the quality measurement of local regions of thermal images. Similar to the first experiment, we perform gender recognition using both feature-level fusion and score-level fusion with two kinds of SVM kernel of linear and RBF kernels. In this experiment, the wHOG features of visible light images are obtained using Equation (8) and the wHOG feature of thermal images are obtained using Equation (9) by combining the MEAN map and the STD map with the HOG features of visible light and thermal images, respectively. The detail recognition accuracies of these experiments are shown in
Table 8 and
Table 9.
Table 8 shows the experimental results when we used only visible light or only thermal images for gender recognition, whereas
Table 9 shows the recognition results by combining the visible light and thermal images.
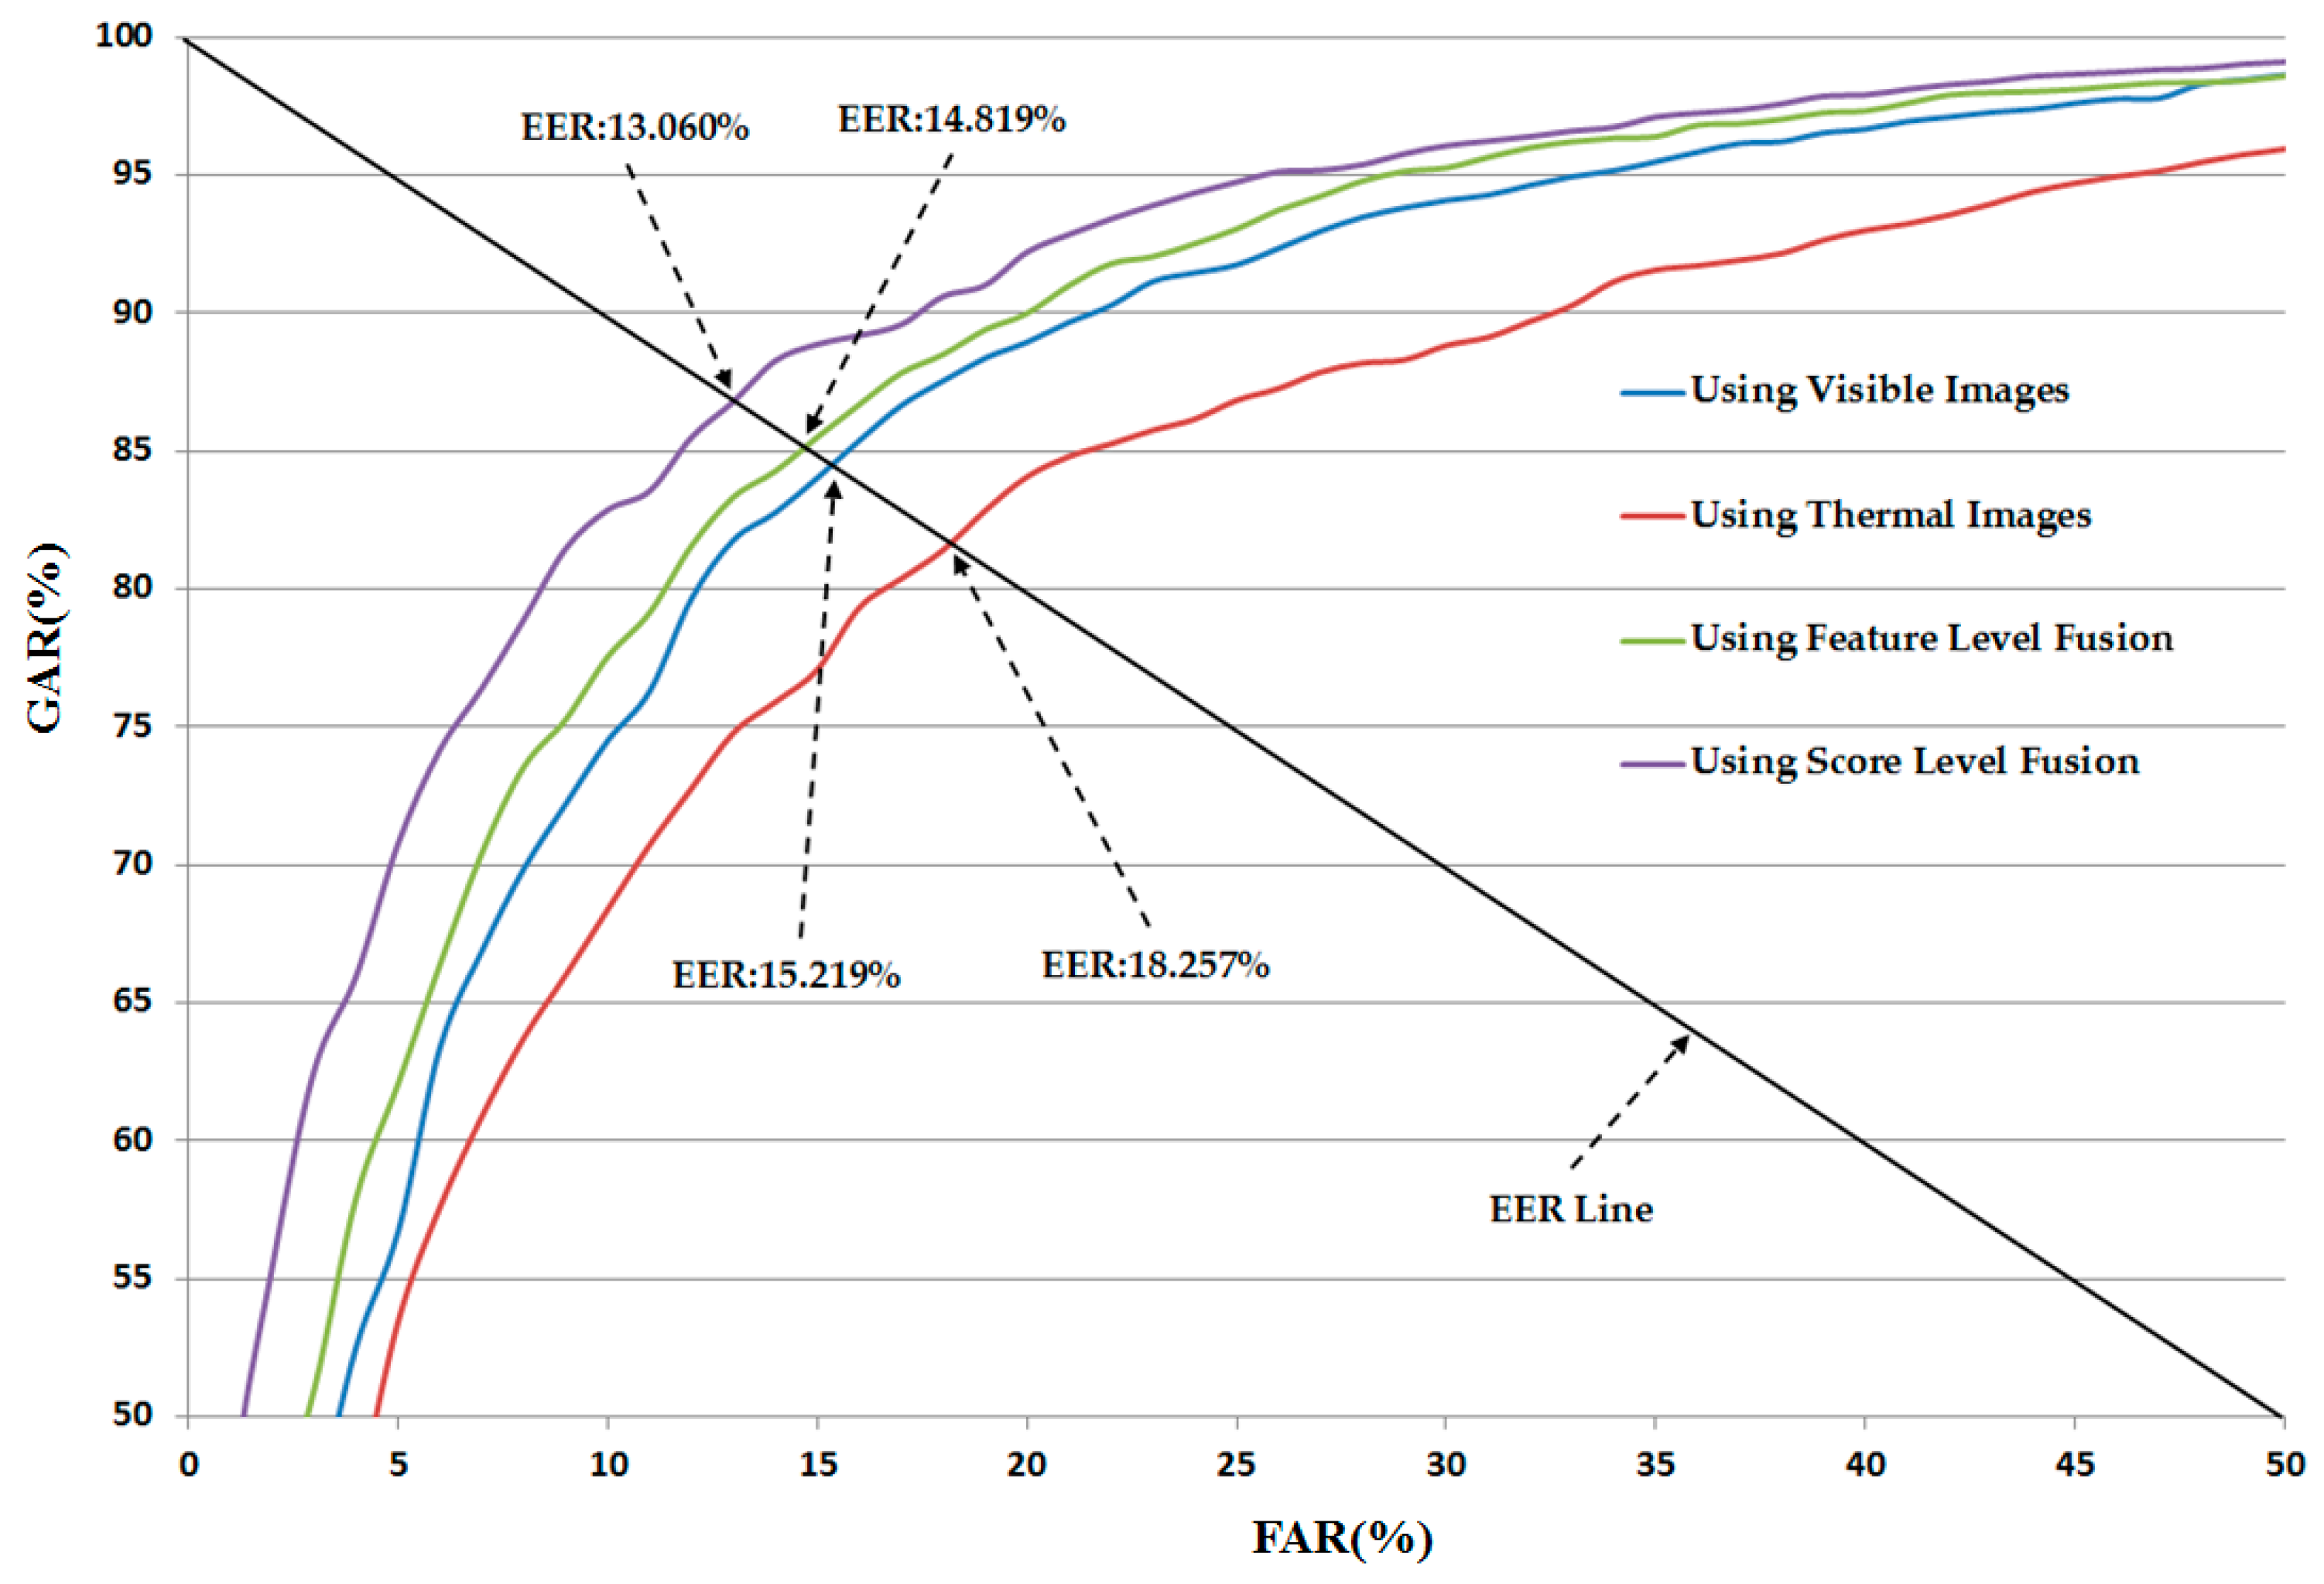
As shown in
Table 9, the feature-level fusion method produced a recognition error (EER) of 16.162% and 14.819% using the linear and RBF kernels of the SVM, respectively. These errors are much smaller than the errors of 17.892% and 16.632% of the system that does not consider the qualities of local regions of images using the linear and RBF kernels of the SVM (see
Table 5), respectively. Using score-level fusion, the best recognition accuracy was obtained with an EER of 13.060% using the the RBF kernel in both SVM layers. This result is also much smaller than that of 16.277% for the system that does not consider the quality of local regions of input images (see
Table 5). In addition, this result (an EER of 13.060%) is also the best recognition accuracy among those of the other methods in
Table 4,
Table 5,
Table 6,
Table 7,
Table 8 and
Table 9. Based on these results, we can find that the proposed method can enhance the recognition accuracy of gender recognition using visible light and thermal images of the human body.
Figure 8 shows the ROC curve of our proposed method using our collected database.
In
Table 10, we summarize the recognition results of our experiments. This table shows that our proposed method produces much better recognition accuracies, as compared to the accuracies obtained using the previous method.
Although the
Table 10 gave the difference between performances of difference configurations of our proposed system and the previous sytem, we further performed experiemnts to verify the differences statistically. For this purpose, we measured the differences of performances (recognition accuracies) of various configurations of recognition systems using the
t-test method [
34]. The
t-test method is statistical tool that is usually used to verify the difference between the mean values of two independent random variables. The details of experimental results are shown in
Table 11 and
Table 12. In
Table 11, we showed the
t-test results to verify the difference of performance of various system configurations using our proposed feature extraction method, including the system using single visible light images; system using single thermal images; system using the feature level fusion of visible light and thermal images; and the system using the score level fusion of visible light and thermal images. As shown in
Table 11, the
p-value of the system using only visible light images and the system using only thermal images was about 0.025929, which is smaller than 95% (0.05) significant level. Therefore, the null hypothesis for the
t-test, that there is no difference between the performances of system using only visible light images and system using only thermal images for gender recognition, may be rejected at the significant level of 95%. The
p-value of system using only visible light images and the system using score level fusion of visible light and thermal images was about 0.004782, which is smaller than 99% (0.01) significant level. The
p-value of system using only thermal images and the system using score level fusion of visible light and thermal images was about 0.001461, which is also smaller than 99% (0.01) significant level. Through these results, we can find that the performances of system using only visible light images or system using only thermal images are statistically different from the performance of the system using score level fusion at the significant level of 99%. In addition, the
p-value of the system using feature level fusion and the system using score level fusion was about 0.063061. This
p-value is smaller than 93% (0.07) significant level. Therefore, we can find that there is a statistical difference between the performances of system using score level fusion and the system using feature level fusion at the significant level of 93%.
In
Table 12, we showed the
t-test results to verify the difference of performance of various system configuration using our proposed method and previous method [
16]. For this purpose, we measured the
p-values of two random variables, including the performance of system using previous method [
16] and the performance of system using our proposed method. There are four different configurations were used, including system using only visible light images, system using only thermal images, system using the combination of visible light and thermal image based on feature level fusion approach, and the system using the combination of visible light and thermal images based on the score level fusion approach. As shown in this table, the
p-values between our method and previous one [
16] using only visible light image was about 0.039456. This value is smaller than 95% (0.05) significant level. Therefore, the performances of ours and previous system [
16] that use only visible light images for gender recognition are statistically different at the significant level of 95%. Similarly, we find that the performances of systems that use only thermal images for gender recognition are statistically different between ours and previous method at the significant level of 95% (
p-value of 0.025682); performances of systems that use feature level fusion of visible light and thermal images for gender recognition are statistically different between these two methods at the significant level of 99% (
p-value of 0.002941); and performances of systems that use score level fusion of visible light and thermal images for gender recognition are statistically different between these two methods at the significant level of 99% (
p-value of 0.00508).
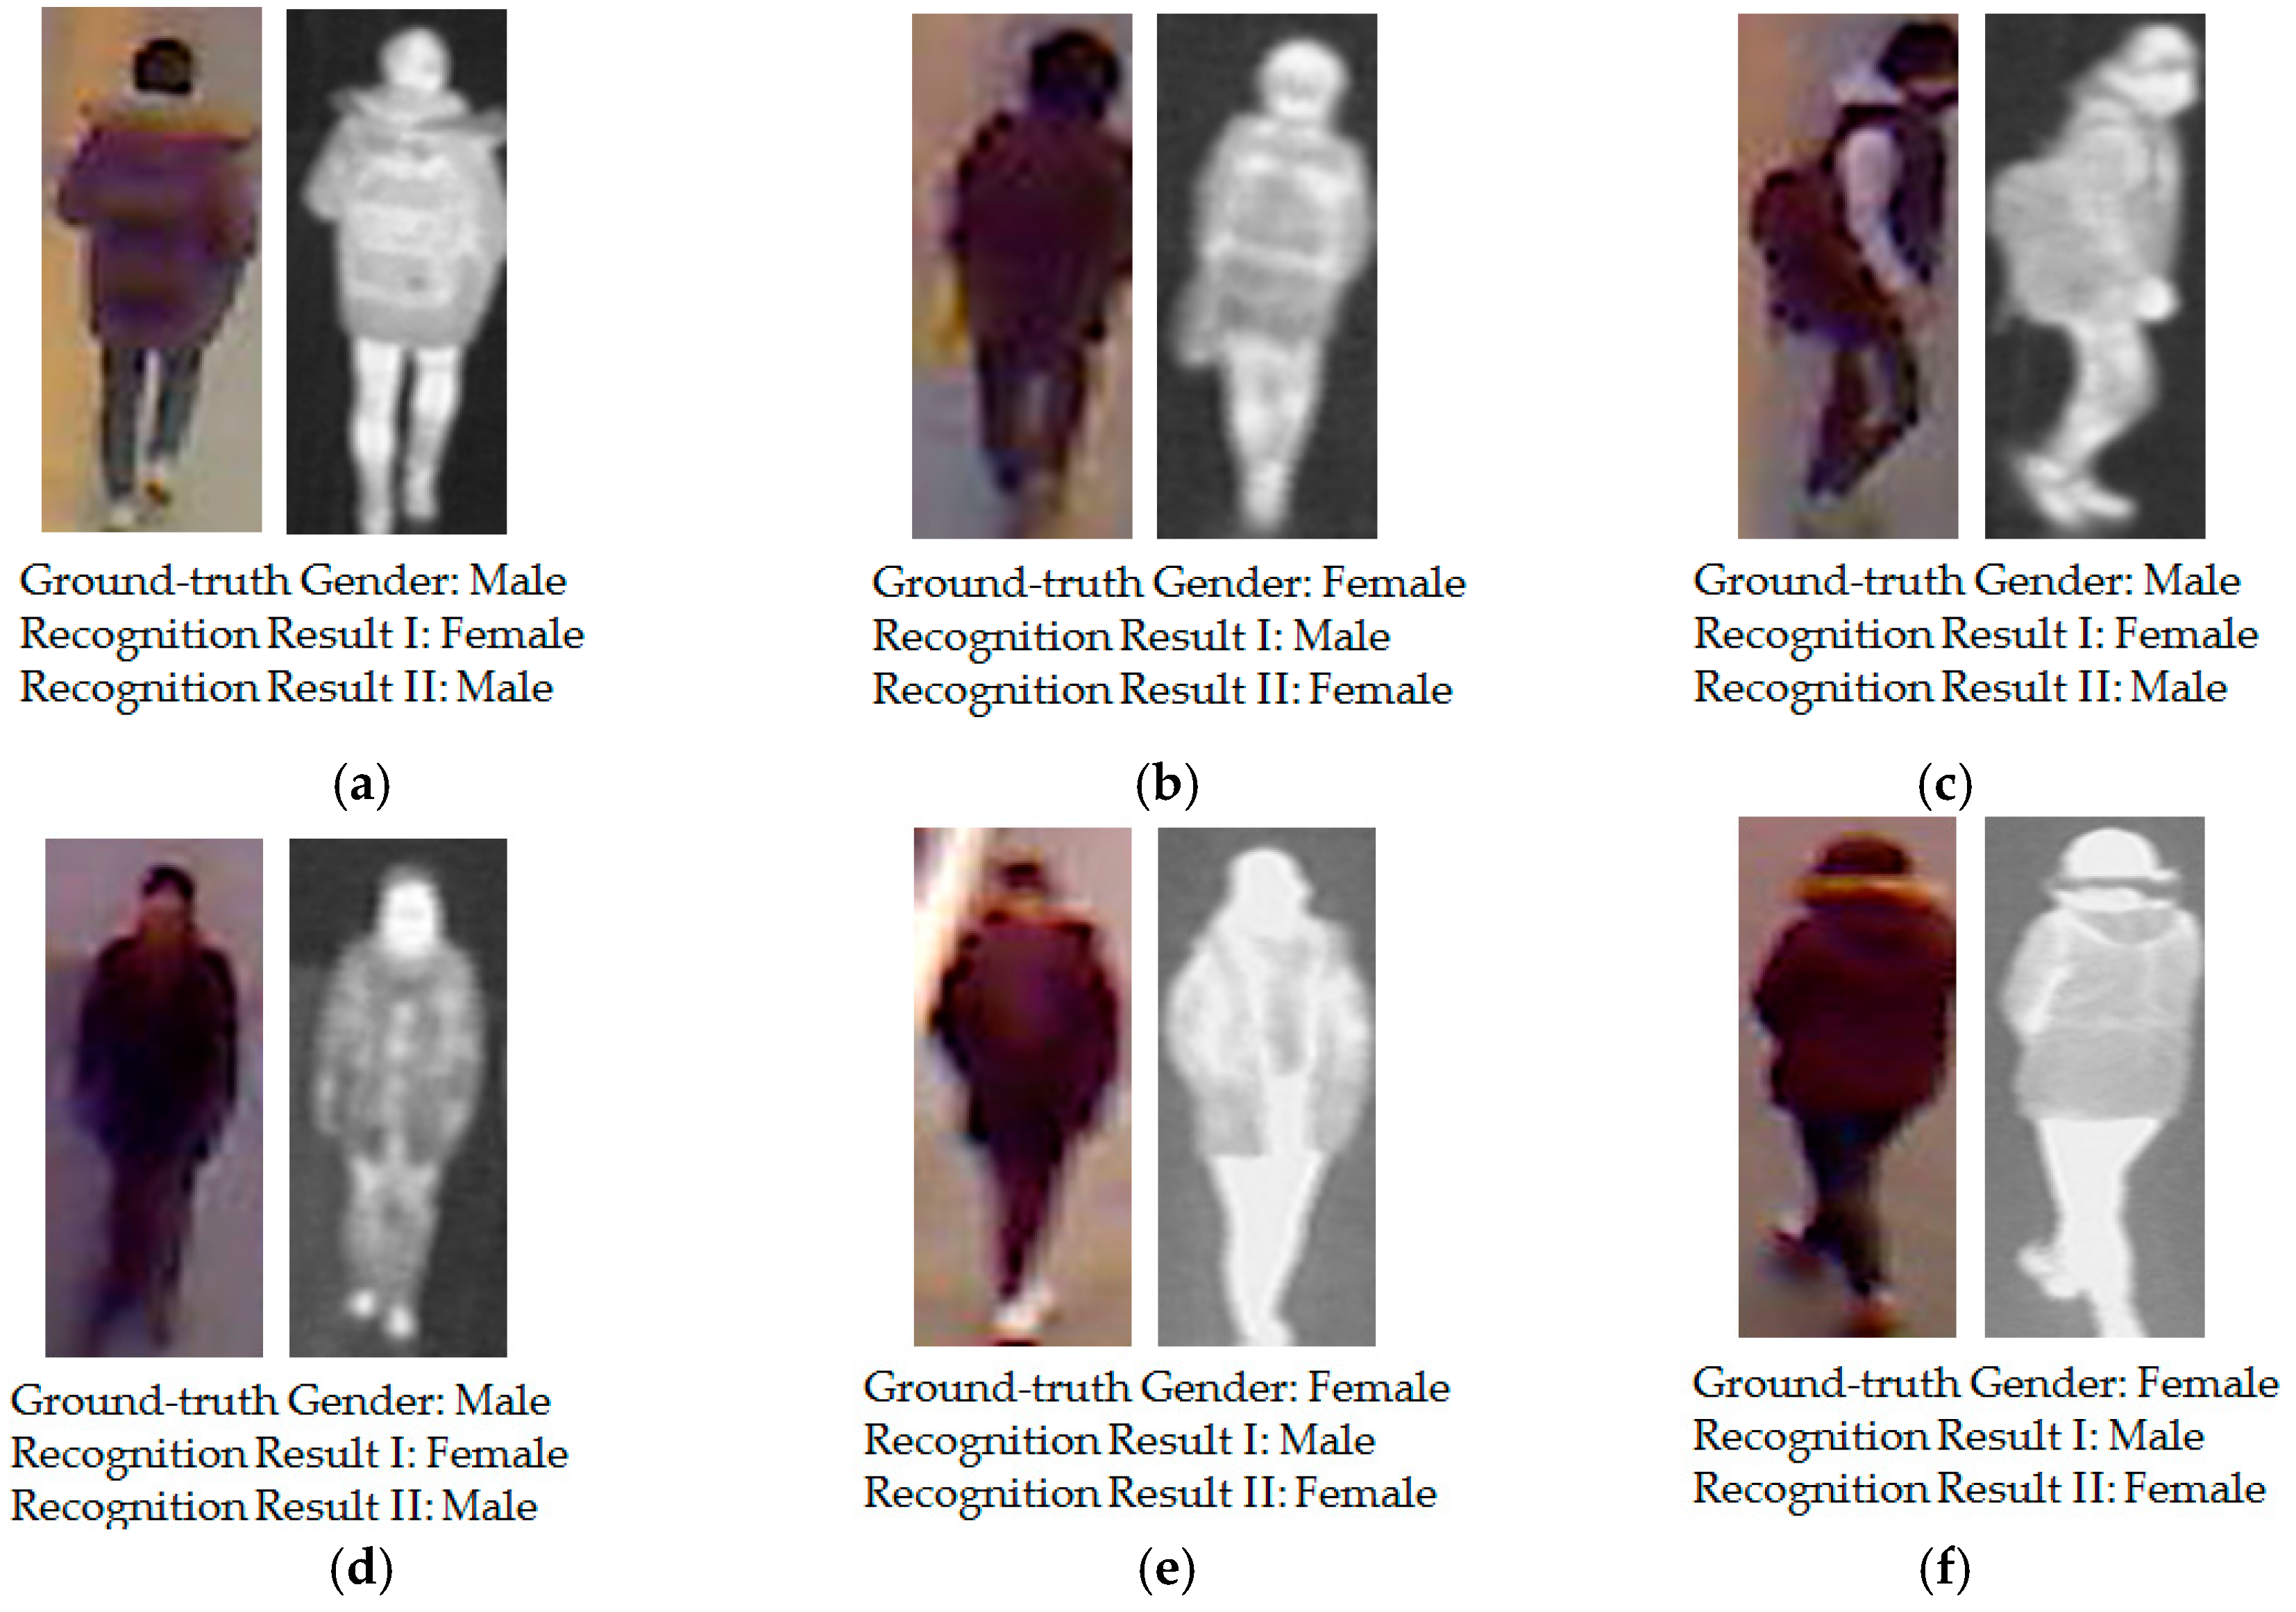
For demonstration purposes, we show some examples of recognition results of the previous recognition sytem [
16] and compare them to those of our proposed method in
Figure 9. In this figure, “Recognition Result I” indicates the recognition result when using the previous method by Nguyen et al. [
16], and “Recognition Result II” indicates the recognition result when using our proposed method. These examples show that although the privous method produced incorrect recognition results (from male to female and vice versa), the proposed methodcorrectly recognizes gender from the human in input images.
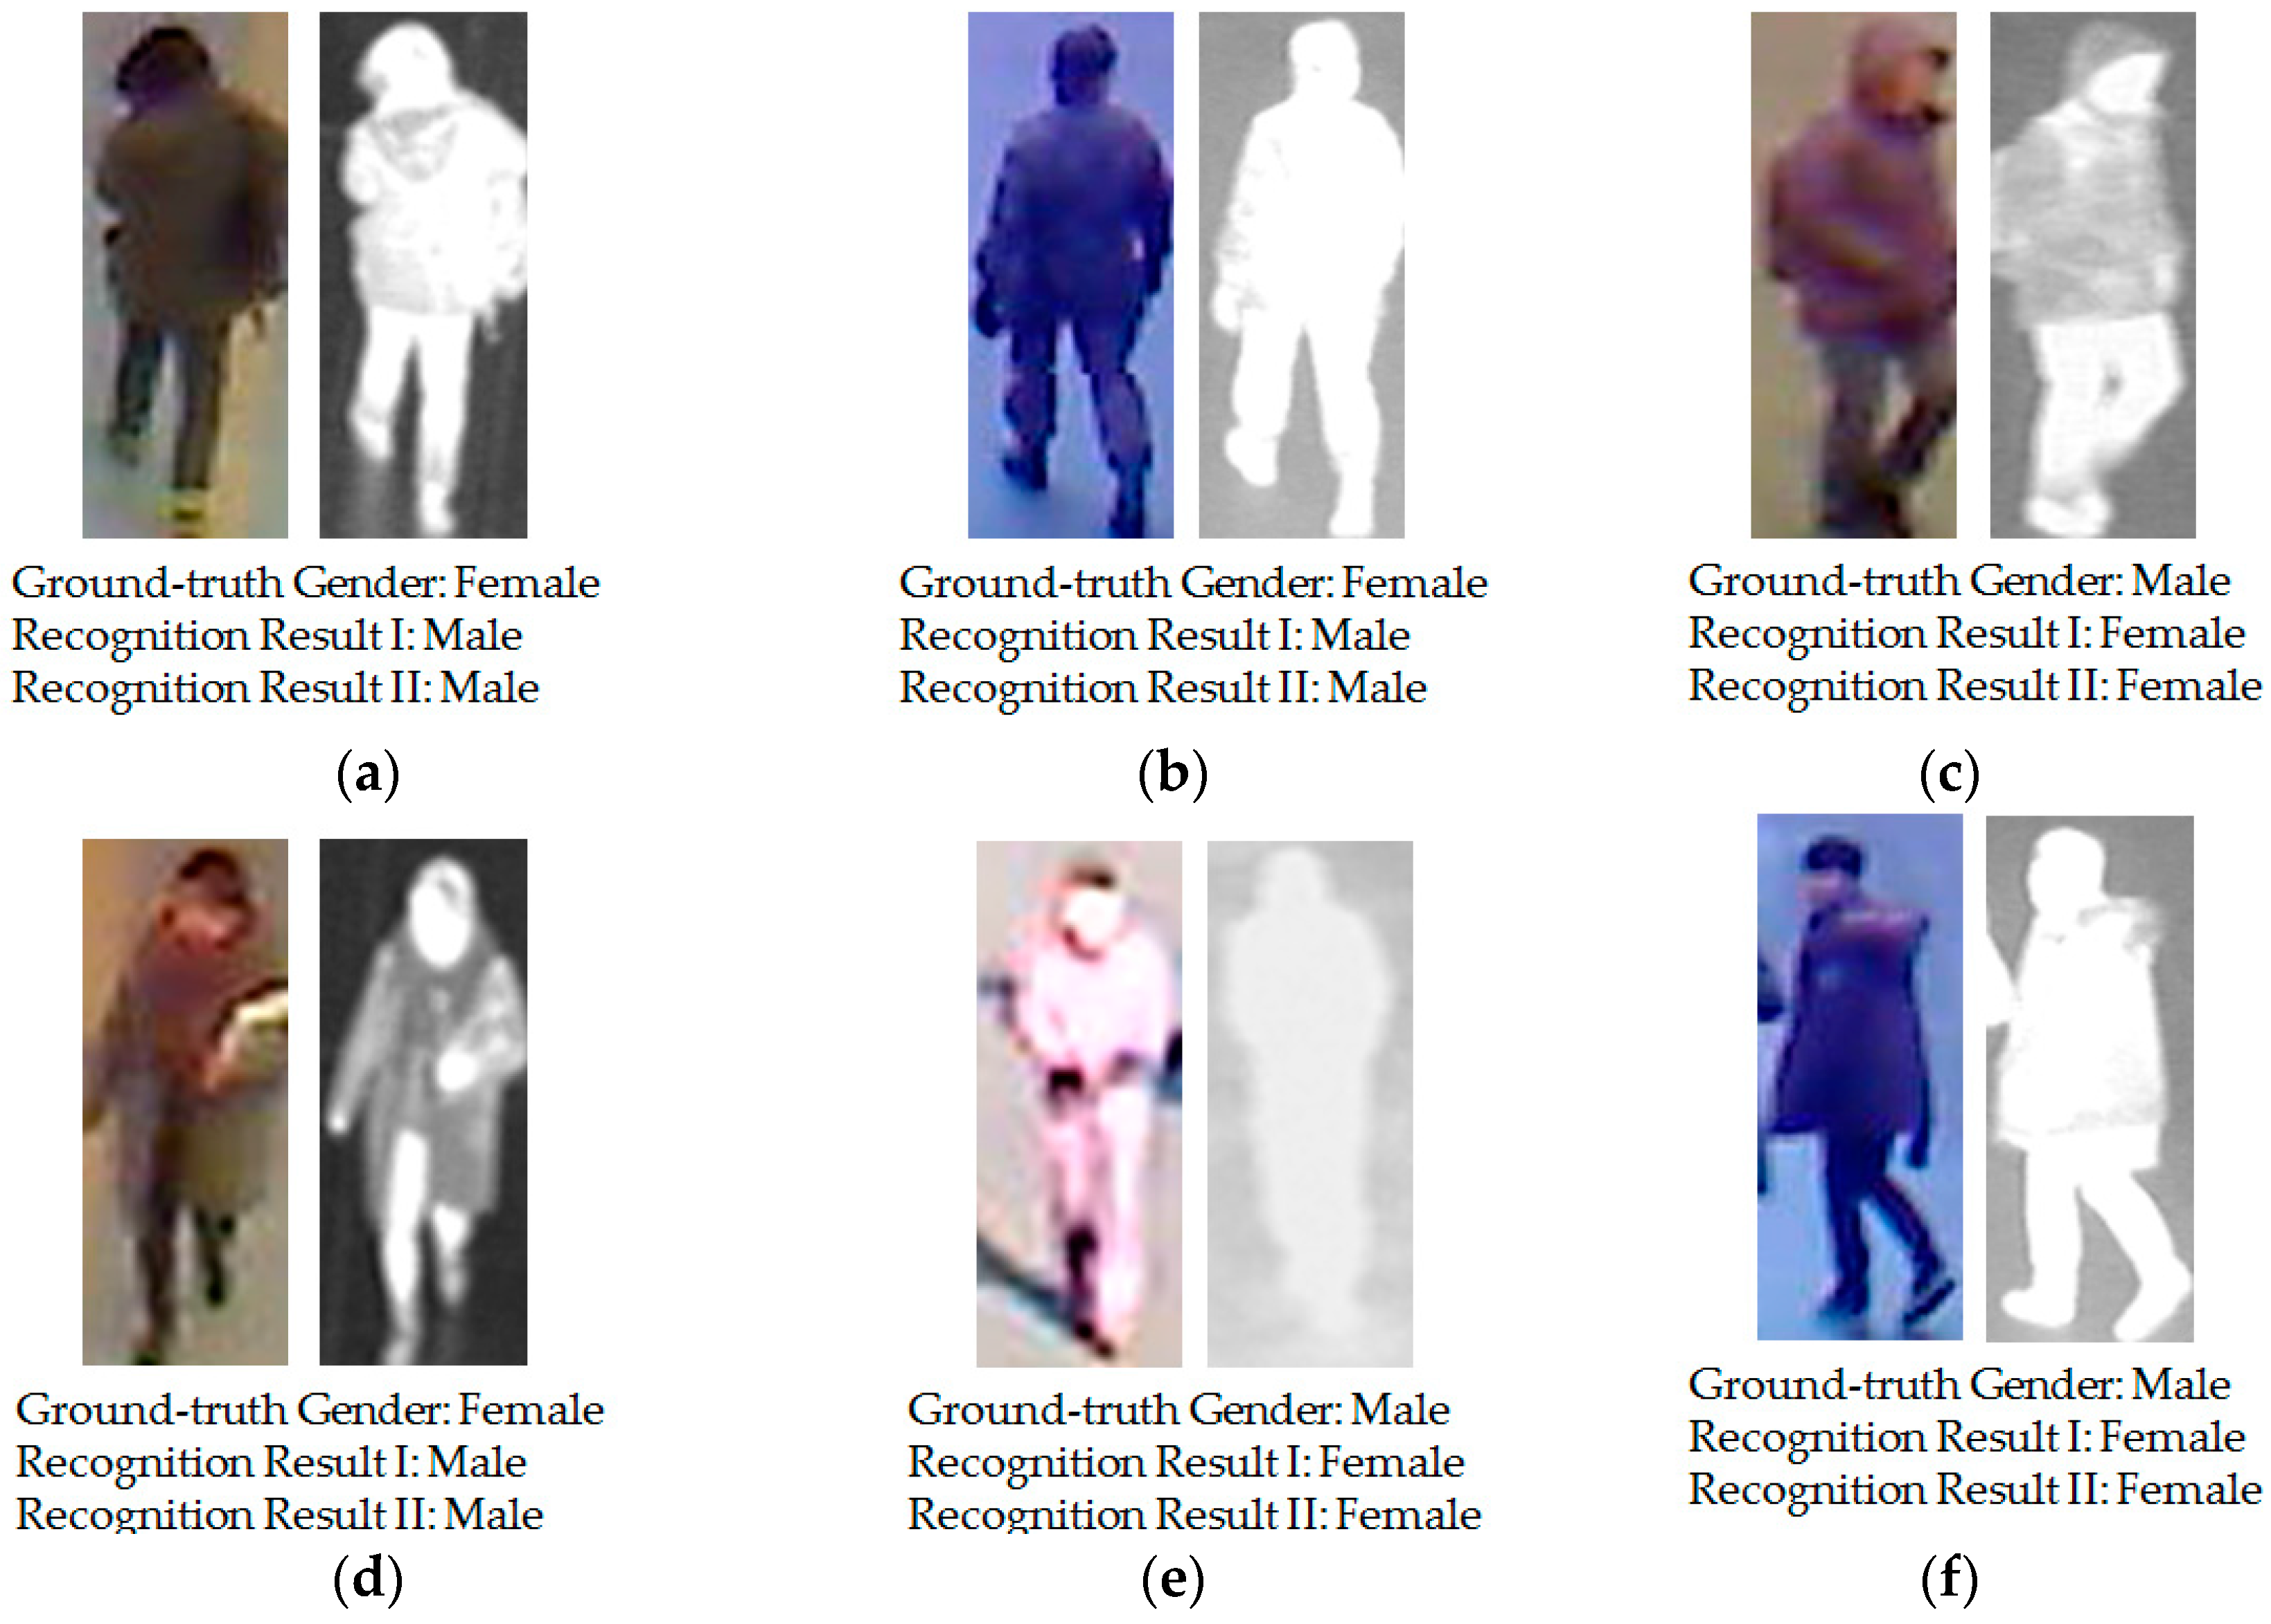
Although our proposed method was demonstrated to enhance the recognition accuracy of the recognition system, it still has errors (at roughly 13%, as shown in
Table 9 and
Table 10). In
Figure 10, we show several error cases produced by our proposed method. Similar to
Figure 9, “Recognition Result I” indicates the recognition result when using the previous method by Nguyen et al. [
16]; and “Recognition Result II” indicate the recognition result when using our proposed method. In
Figure 10a,b, it is difficult to distinguish if the persons in the two images are females, even by human perception. The person in
Figure 10b is wearing an army uniform and the person in
Figure 10a has short hair as viewed from the back. These conditions makes the recognition system produce incorrect recognition results. A similar situation occurs in
Figure 10c,d. In
Figure 10e,f, although we can recognize the gender of persons in these images using human perception, the unusual body pose (in
Figure 10f) and the poor capturing conditions (in
Figure 10e cause our proposed system to produce the incorrect recognition results. As shown in this figure, the corresponding recognition results using the previous method by Nguyen et al., are also wrong for these input image cases. These results are caused by the very large variation of images of the human body such as the variation of wearing clothes, wearing accessories, the capturing view, etc. In the future, we will continue to study these kinds of negative effects so as to enhance the recognition accuracy.
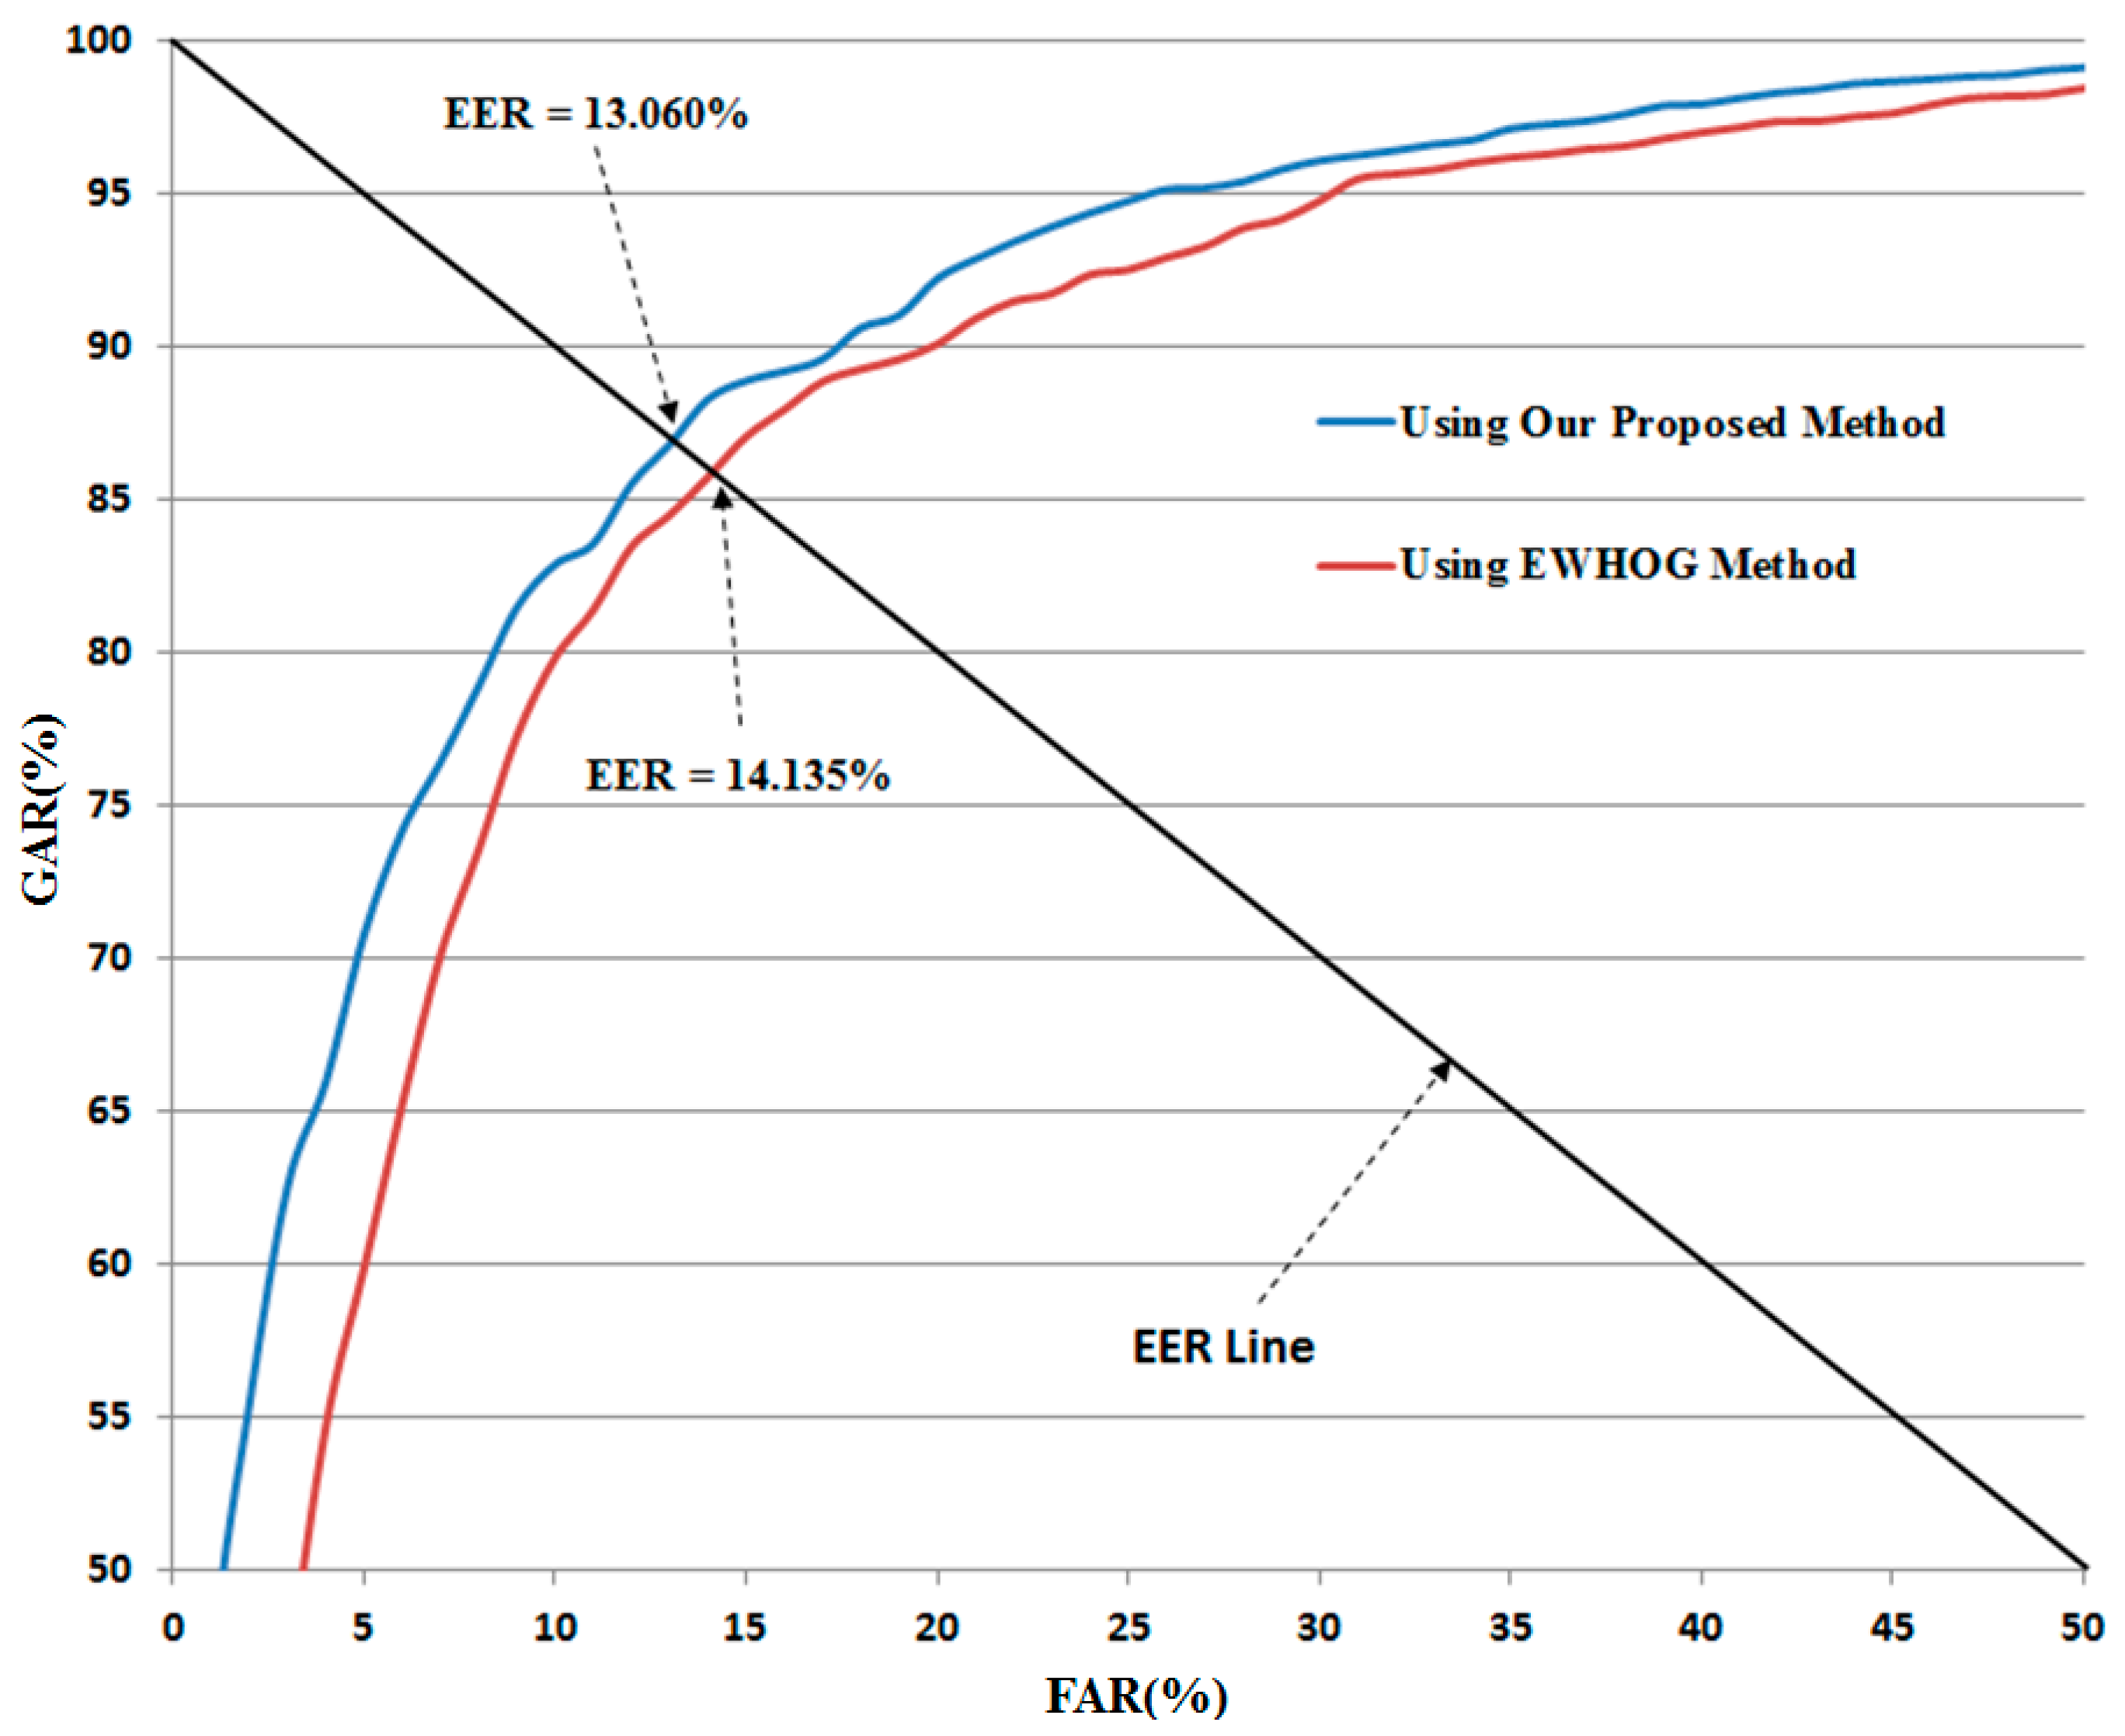
We included the comparative experiments with a similar feature extraction method, called entropy weighted histograms of oriented gradients (EWHOG) that was proposed by Liu et al. [
35]. The EWHOG is a new method that enhances the power of traditional HOG feature by measuring the amount of information contained in the blocks of image using the entropy of the HOG feature extracted in each block. The entropy reflects the degree of uncertainty of texture feature in image’s blocks. Therefore, the blocks with large variation of texture should have larger entropy values than those that have small variation (plain texture).
The detailed experimental results are shown in
Table 13. As shown in this table, the best recognition accuracies by the EWHOG method [
35] were obtained with EER of about 14.135%. In addition, the use of both visible light and thermal images showed the better recognition accuracies than the use of single visible light or single thermal image for gender recognition by the EWHOG method. Compared to recognition accuracy obtained by our method in
Table 10 and
Table 13, we can see that our method outperforms the EWHOG method by producing the lower error than the EWHOG method (13.060% vs. 14.135%).
In
Figure 11, we show the ROC curve of recognition system using our method and the EWHOG method, which shows that the recognition accuracy by our method is higher than that by the EWHOG method.
As a next experiment, we measured the processing time of our proposed method. For this purpose, we used a desktop computer with an Intel Core i7 CPU (3.5 GHz, Intel Corp., Santa Clara, CA, USA) with 8 GB of RAM memory. The recognition program was written using the C++ programming language. The detailed experimental results are shown in
Table 14. In conclusion, our proposed method can execute at the speed of 36.14 frames per second (1000/27.6679). In order to run our algorithm on the camera system having very low processor or on the server to process dozen of streams in parallel, the processing speed by our method should be enhanced. However, as shown in
Table 14, most processing time was taken at the stage of human body detection (this is not main part of our research because our research is mainly focused on gender recognition).
As future works, we would research about the method of enhancing the processing speed of human body detection, by which our gender recognition method can be operated on the camera system having very low processor or on the server to process dozen of streams in parallel.
We performed additional experiments to measure the recognition accuracies of our system with and without applying the PCA. The detailed experimental results were shown in
Table 15. As shown in these experimental results, the use of PCA helped enhancing the recognition accuracy about 2% compared to the case of without applying the PCA using our proposed method (13.060% vs. 15.072%).
In addition, the use of PCA can also help reducing the redundant features. Originally, we extracted a feature vector of 3780 components (a feature vector in 3780-dimensional space) for a visible light or thermal image using our proposed weighted-HOG method. Consequently, the recognition system must process a vector in 7560-dimensional space (3780 × 2) for a combination of visible light and thermal images using the feature level fusion approach; or processes two vectors in 3780-dimensional space separately using the score level fusion approach. Processing with high dimensional feature vector not only increases processing time of recognition system, but also requires more memory for storing feature vector. Therefore, the PCA is deserved in our proposed method.
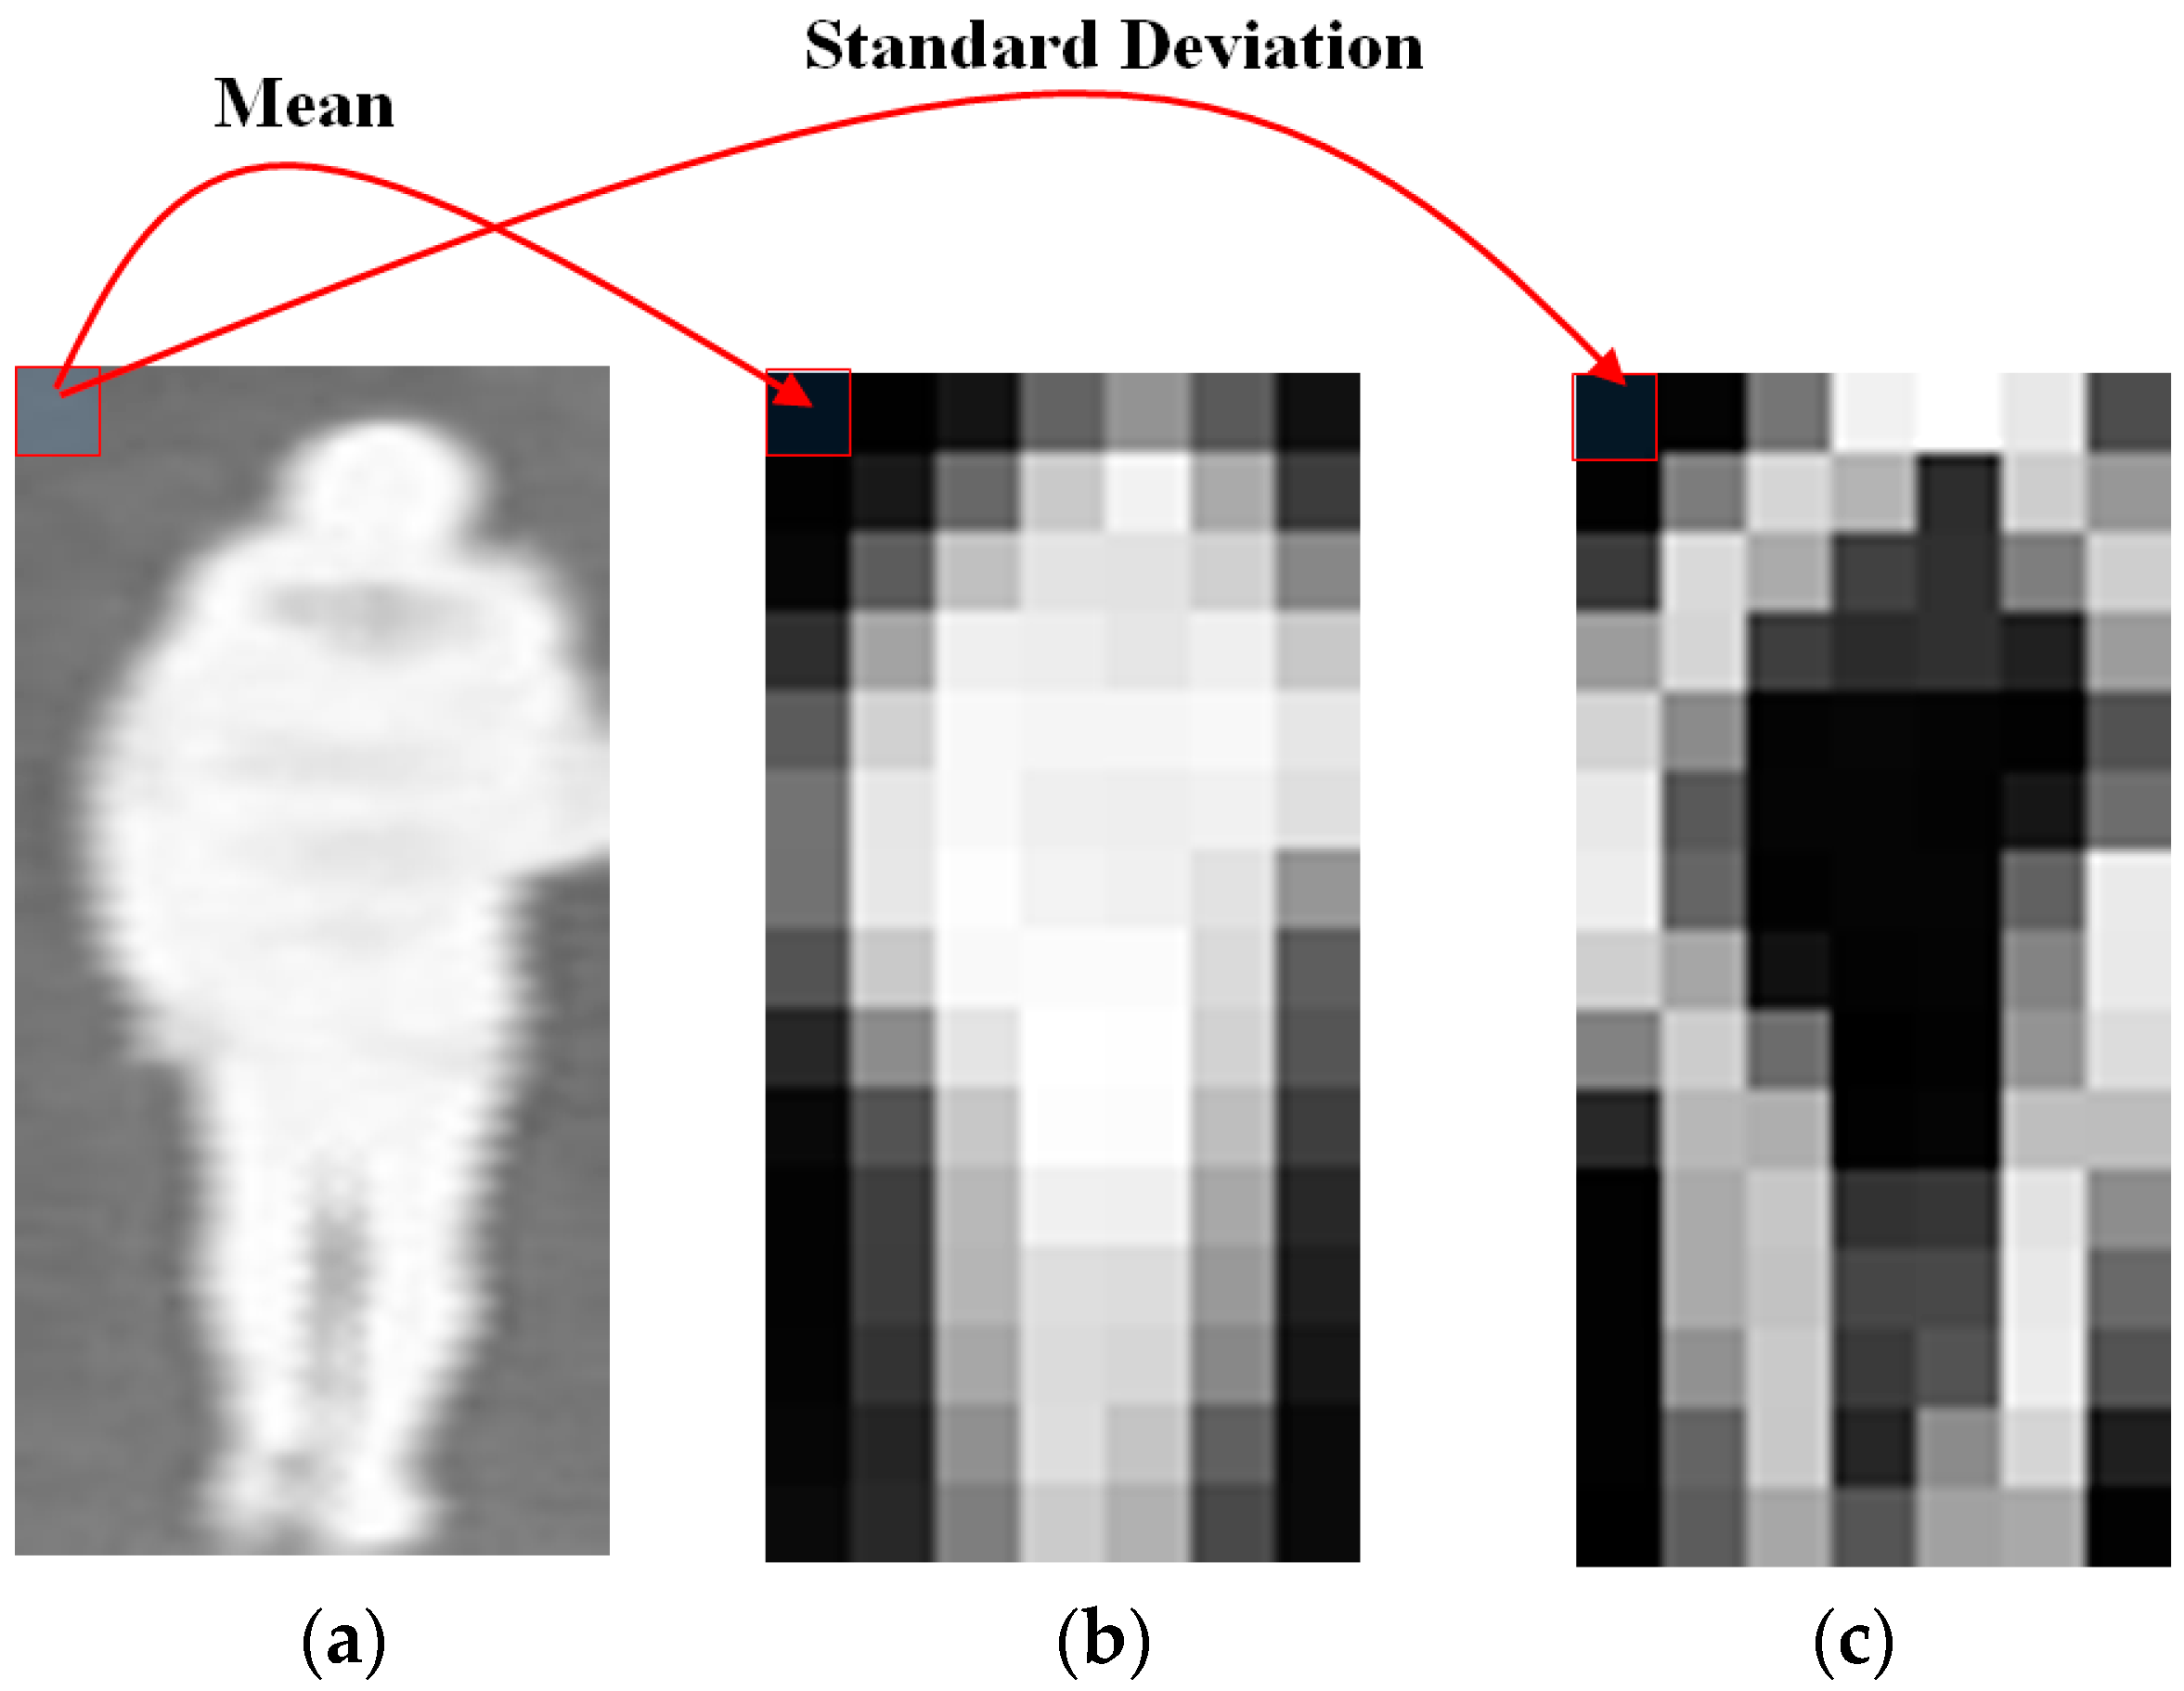
The thermal image has a special characteristic that the appearance of objects on the thermal image is only dependent on the object’s temperature. While the temperature of human body is normally a constant of about 37°, the temperature of background is strongly dependent on the environment temperature and normally lower than that of human body’s temperature. Consequently, the background regions appear darker (lower pixel value) than those of human body regions in the thermal image as shown in
Figure 6,
Figure 9 and
Figure 10. Based on this characteristic, although the background regions can have very complex structure or uneven intensity, they are displayed darker than the body regions in thermal image, and the corresponding mean values of sub-blocks of background are lower than those of human body. Therefore, we use the mean value of sub-blocks of thermal image to evaluate the amount of body-based gender information contained in the corresponding block in the visible light image with an assumption that the misalignment of visible light and thermal image of human body is small. Using this method, we can assign low weight values to background regions even though they contain very complex structure or uneven intensity.
The background regions appear darker than those of human body regions in the thermal image, and the difference among pixel values inside human body is not large in the thermal image as shown in
Figure 6,
Figure 9 and
Figure 10. Therefore, the sub-blocks from the boundary between human body and background usually show higher standard deviation than those from background and inside of human body in the thermal image. Based on this characteristic, we use the standard deviation as the quality assessment of blocks of thermal image. Using the standard deviation measurement, the background blocks and the blocks which belong to inner part of human body have small weight values, while the blocks which belong to the boundary of human body have larger weight values even though the background regions contain very complex structure or uneven intensity. Consequently, we can obtain the body-based gender information from the shape of human body in the thermal images.


