1. Introduction
Pressure vessels are widely used in many fields, such as chemical plants, power stations, etc. In many cases, pressure vessels are safety critical because they contain flammable, explosive, virulent, or corrosive materials. Accidents due to explosion and leakage of the contents will lead to serious consequences, and high pressure is one of the most identified causes leading to these kinds of accidents. Therefore, it becomes critically important to measure the pressure of these vessels in an accurate and convenient manner.
It is very common that the pressure is measured by pressure gauges where it is able to directly touch the materials contained. However, it is not always applicable or cost-effective to mount such pressure gauges. For example, sometimes it will require the upgrade of a lot of old equipment, or the installation of gauges will change the integrity of the vessel, which may lead to other safety issues. There is another approach to measure the pressure—non-invasive approaches [
1]. There are several proposed methods of this approach, such as the strain gauge method [
2], the capacitor method [
3], and the ultrasonic method [
4,
5,
6,
7]. These methods can solve some problems, but there is still room for improvement in terms of the accuracy. In [
2], Hoffmann discusses that the accuracy of the strain gauge method is heavily affected by the environment—particularly the temperature and humidity. In [
3], it was stated that the capacitor method is only applicable to small-diameter pressure vessels, and its accuracy is sensitive to the type of medium inside the pressure vessel and the environment.
The ultrasonic method is more promising and has attracted more interest since it was proposed, because it has been identified that the ultrasound wave can carry much richer pressure-related information. Guers et al. [
1,
5] established the relationship between the amplitude of an ultrasonic wave propagated inside the vessel and the vessel pressure, and used the reflected ultrasonic signal from the fluid–vessel interface to measure the pressure. However, it is greatly influenced by the type of medium inside the vessel. Zhang et al. [
4] found that the travel-time changes of surface waves changed linearly with the pressure, and applied the surface waves to the pressure measurement of thin-walled vessels. However, the propagation of the surface wave is severely affected by the roughness condition of the vessel wall. Ling et al. [
6] applied L
CR (the Critically Refracted Longitudinal) wave and Rayleigh wave simultaneously to reduce the temperature effect, but the system is complicated because it needs at least four ultrasonic probes. Bi et al. [
7] achieved higher sensitivity than the L
CR wave and Rayleigh wave by employing the reflected longitudinal waves and temperature compensation. In all these methods above, the difference of waves’ travel-time under different pressure is considered to be small in both the reflected longitudinal waves and the L
CR wave, and this limits the accuracy of pressure measurements.
Meanwhile, temperature is another major factor which will affect the ultrasonic properties [
8,
9,
10]. Thus, in order to increase the capability of interference mitigation and to improve the accuracy of measurement, we proposed a non-invasive method of measuring pressure by taking account of L
CR and the multiple reflected longitudinal waves. The rest of the paper is structured as follows: in
Section 2, we explain the acoustoelastic effect of the ultrasonic wave, its application in pressure measurement, and propose a multi-waves fusion algorithm used in our proposed measurement method; in
Section 3, we describe the design of a new pressure sensor based on our method and the prototype measurement system; in
Section 4, we discuss our experiment and analyze its results; finally, in
Section 5, we summarize the conclusions that can be drawn from this paper.
4. Results Analysis
In the experiments, the receiving probe receives the L
CR Wave and a series of reflected longitudinal waves. Waves which are detected with high SNR are considered in the construction of the measurement models. In our experiments (shown in
Figure 2), the L
CR wave, Lre-1st wave, Lre-2nd wave, Lre-3rd wave, Lre-4th wave, Lre-5th wave, Lre-6th wave, and Lre-7th waves are qualified and therefore selected.
4.1. Change in Travel-Time with Temperature and Pressure
Considering the influence of temperature on the travel-time of waves, we controlled the temperature of the pressure vessel ranging from 20.2 °C to 30.2 °C with an interval of 1 °C in the experiments. The first experiment is to establish the relationship between travel-time change and temperature at zero pressure. The data collected from the experiments are shown in
Figure 5.
The lines in different colors are the fitting results using linear regression corresponding to different waves. Most of the data points are close to the corresponding line. Additionally, the R2 of all the regression results are above 0.98. It can be concluded that the travel-time change was linearly proportional to the temperature for the LCR wave and the reflected longitudinal waves.
Once we can determine the relationship between travel-time change (
,
are pressure and temperature change respectively) and temperature
, we also need to understand the relationship between
and
.
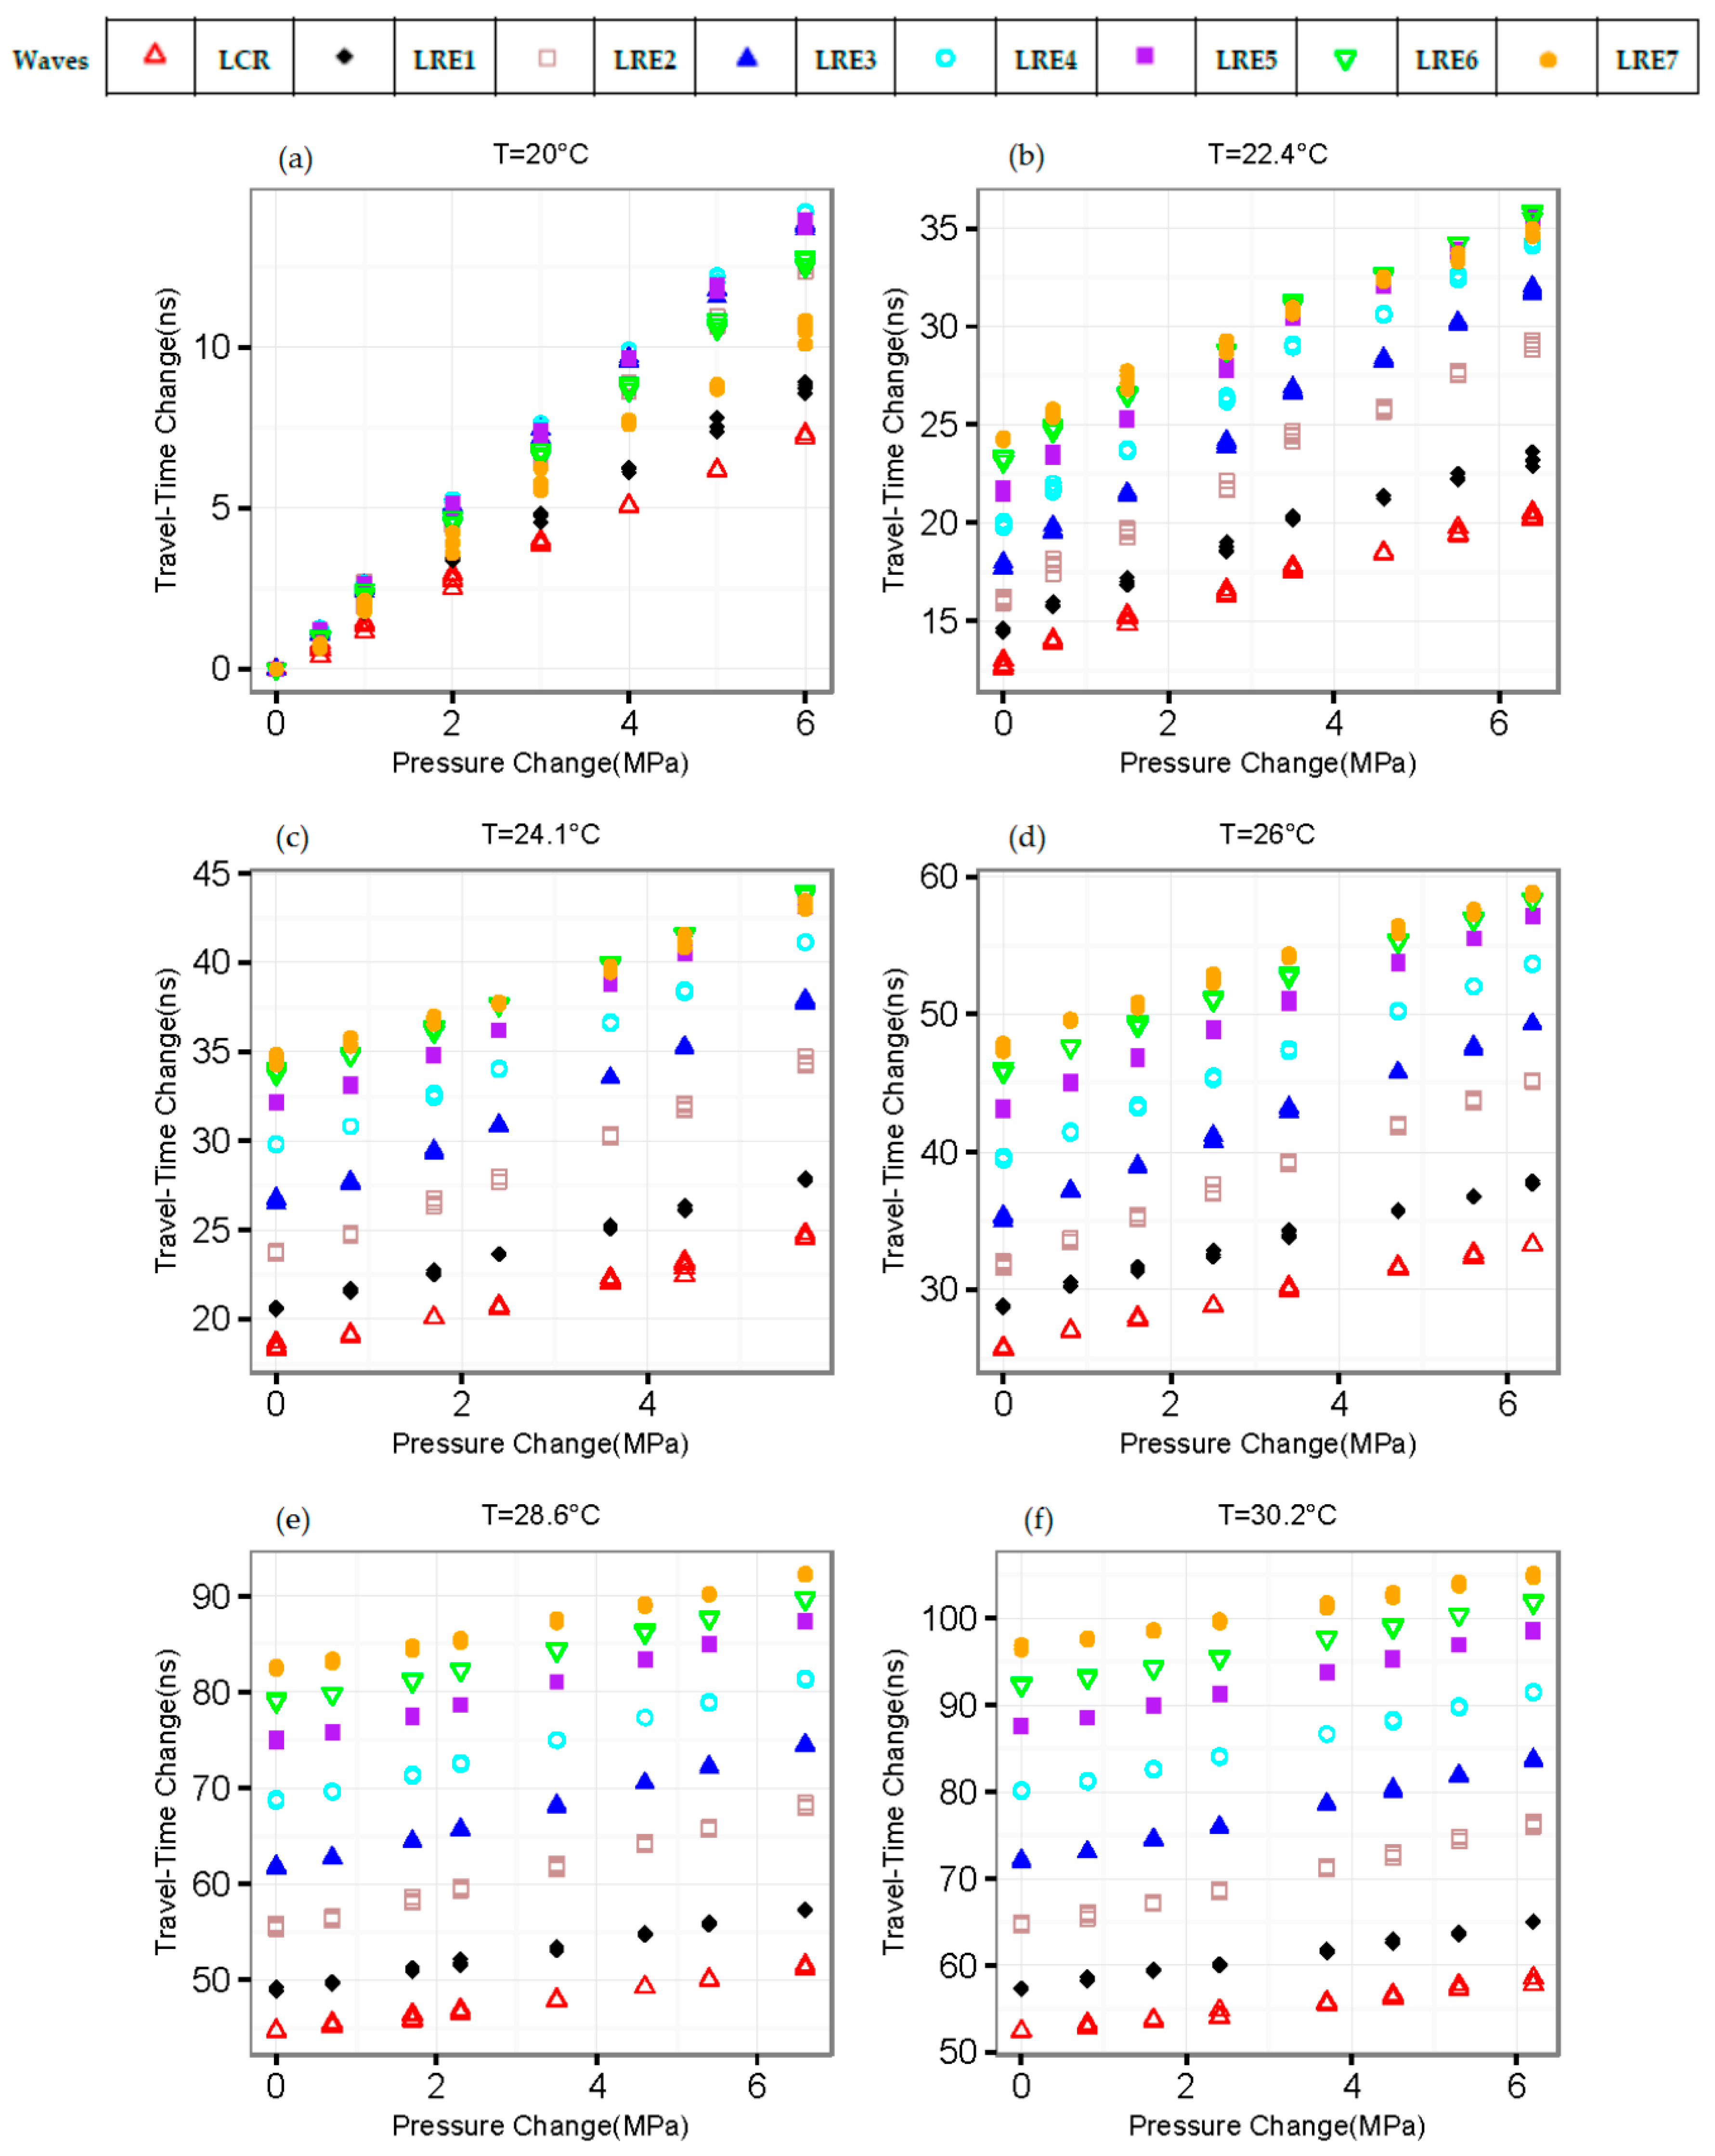
Figure 6 shows the data collected from our experiments. In the past research, linear regression analysis was applied to develop the relationship between travel-time change and pressure [
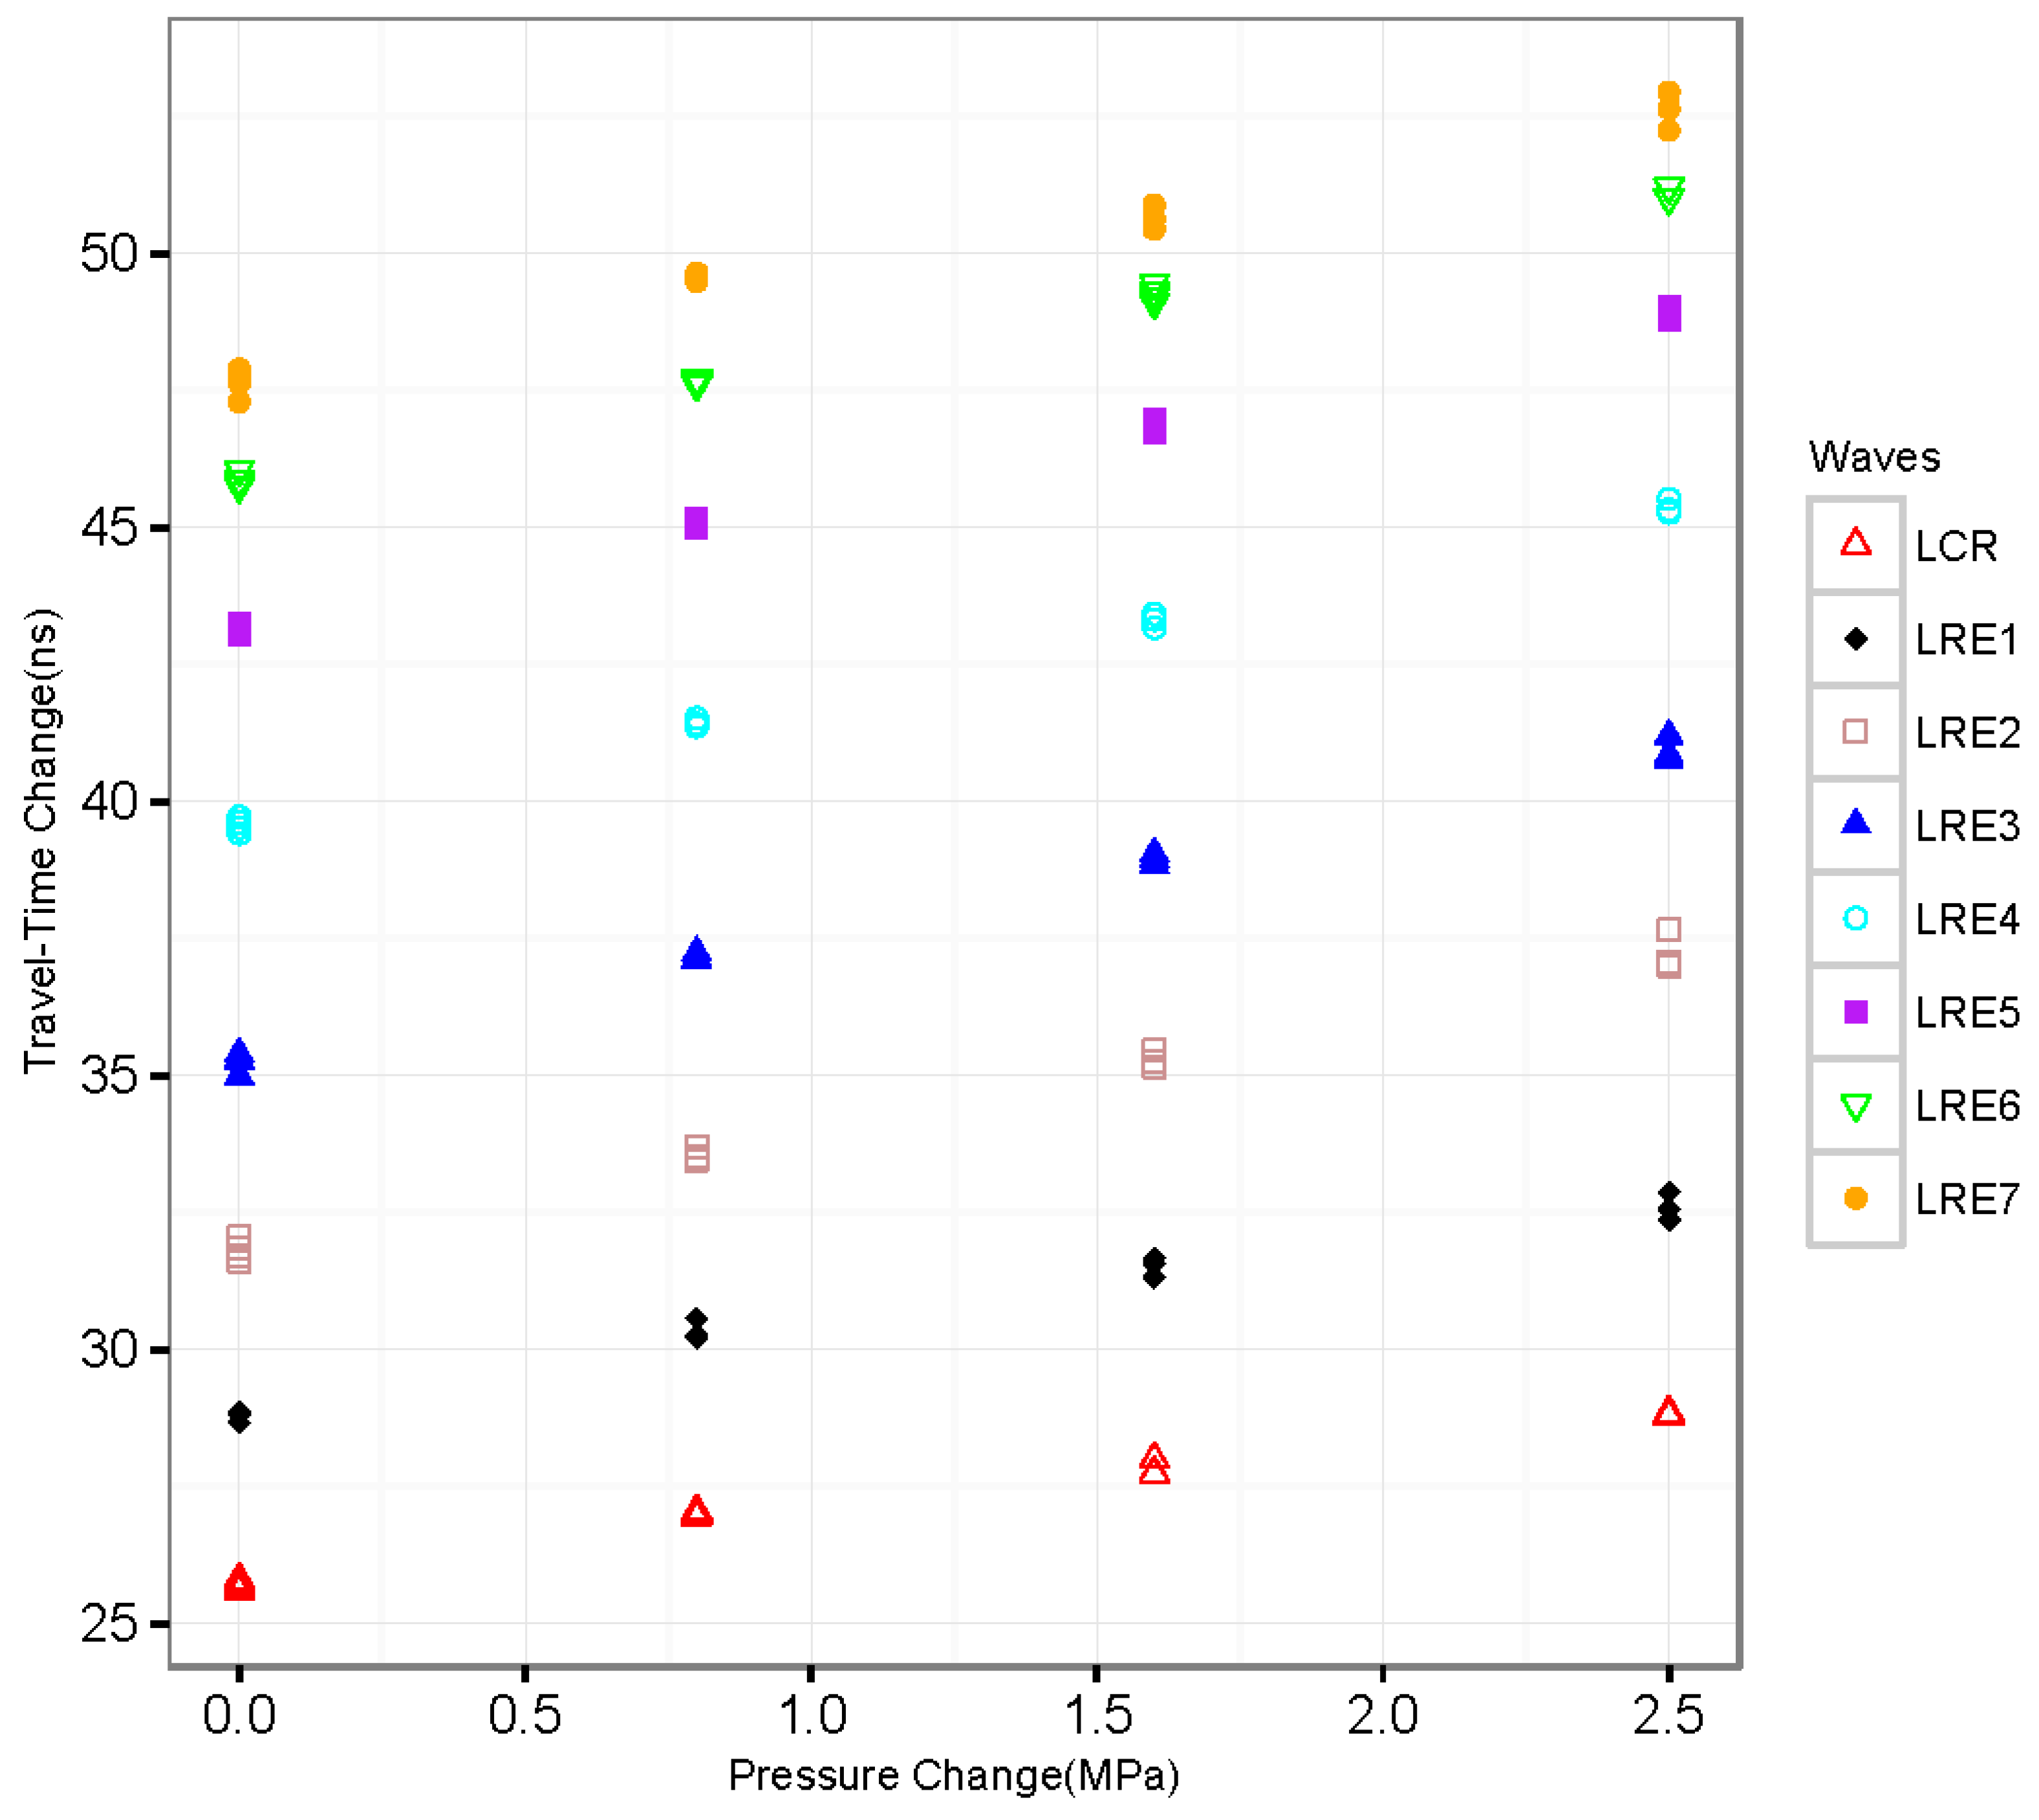
6]. However, the relationship between travel-time change and pressure is not perfectly linear—especially in the low-pressure zone, as shown in
Figure 7. The nonlinearity might be caused by the existence of residual stress.
4.2. Measurement Models Based on Different Waves
Based on experimental data and the relationships we have identified, the pressure measurement models can be established [
16].
The pressure measurement model based on the L
CR wave with temperature compensation (Model_LCR_T) can be described as Equation (5a); From
Figure 6a, we can see that Lre-4th has the highest sensitivity of travel-time change with pressure. The pressure measurement model based on the Lre-4th wave with temperature compensation (Model_LRE4_T) can be described as Equation (5b); the pressure measurement model based on multiple waves (Model_Linear) can be described as Equation (5c), where coefficients
,
, and
are listed in
Table 2; the pressure measurement model based on multiple waves with temperature compensation (Model_Linear_T) can be described as Equation (5d), where coefficients
,
,
, and
are listed in
Table 3.
Considering the nonlinearity between travel-time change and pressure in the low-pressure zone, the nonlinear model (Model_Quadratic) is proposed (which can be described as Equation (5e)), where coefficients
,
,
, and
are listed in
Table 4. The nonlinear model with temperature compensation (Model_Quadratic_T) can be described as Equation (5f), where coefficients
,
,
, and E4 are listed in
Table 5.
4.3. Experimental Results for Pressure Measurement
In
Table 6, we compared the coefficient of determination (R
2), the adjusted R
2, and the root-mean-square error (
RMSE) of different models.
In order to evaluate the accuracy of pressure measurement models, we analyzed the test data set from the experiment in which the temperature ranges from 20 to 30.2 °C and the pressure ranges from 0 to 6.6 MPa.
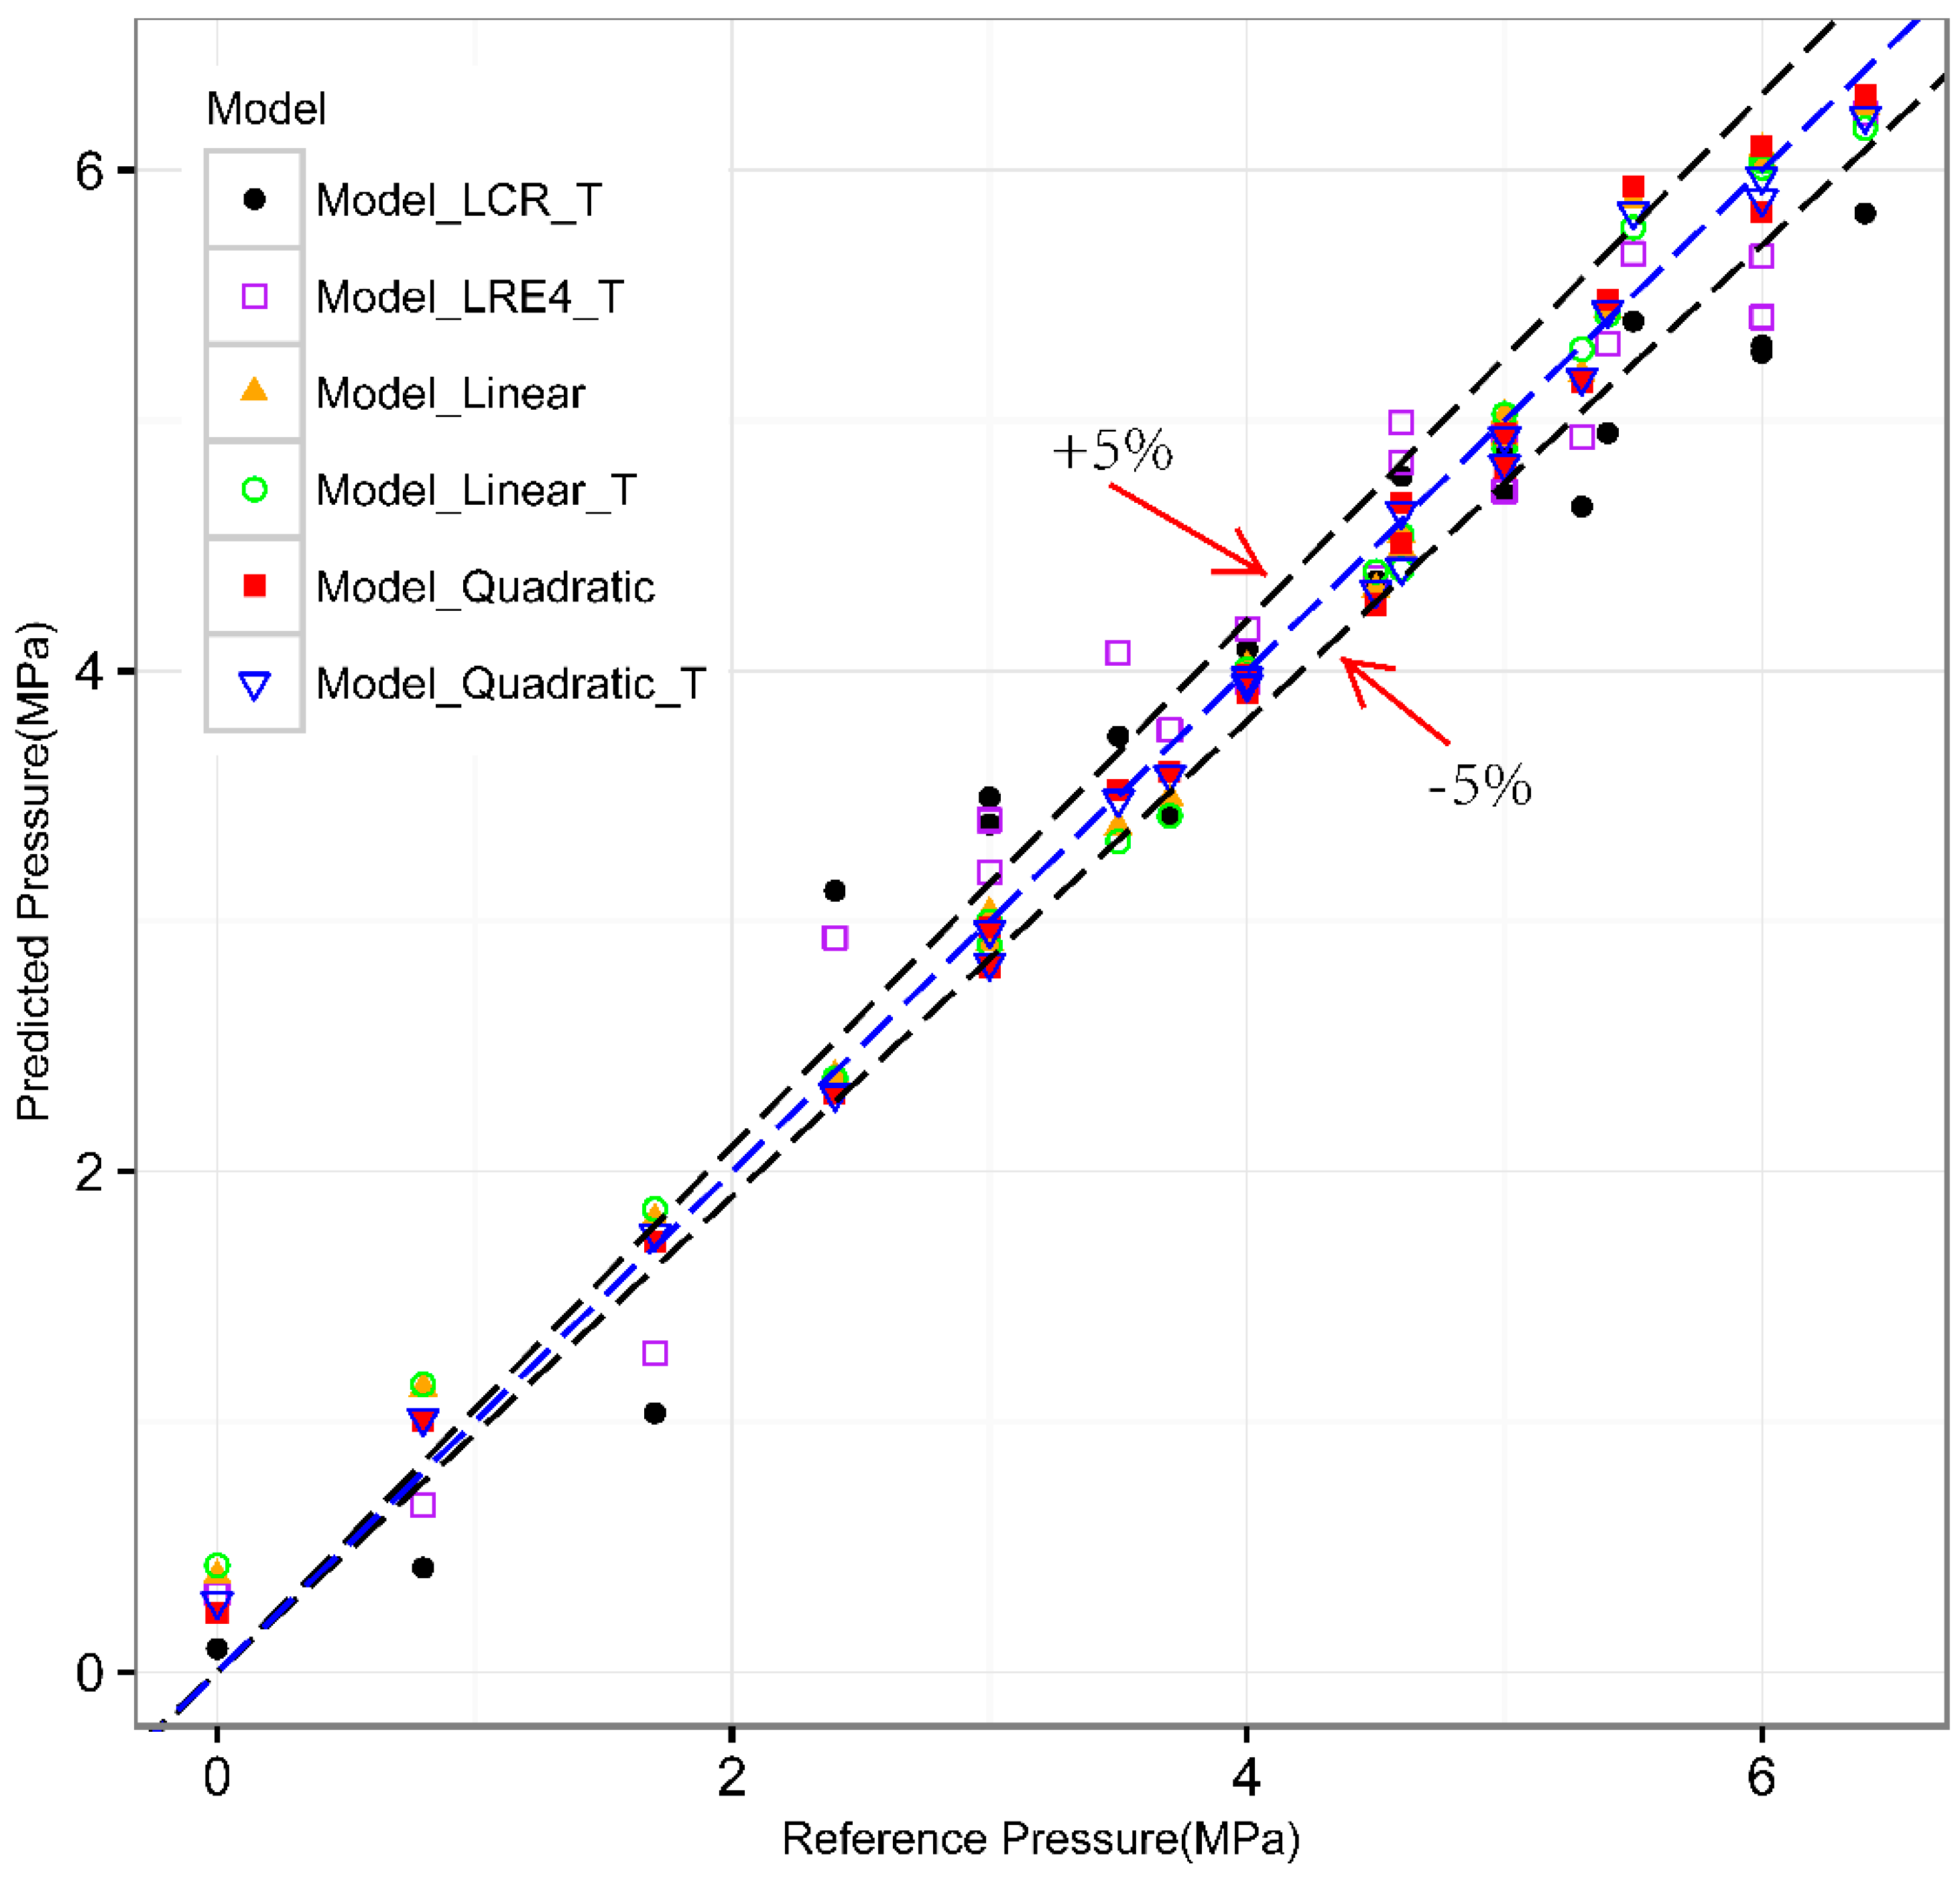
Figure 8 shows the predicted pressure and the reference pressure (measured by the pressure gauge). The area between the dashed lines tagged with +5% and −5% has relative error less than 5%. The middle line indicates where the predicted pressure equals the reference pressure. From the analysis of these experiments, it is reasonable to believe that the first two models (Model_LCR_T and Model_LRE4_T) have a lower accuracy than the last four models (Model_Linear, Model_Linear_T, Model_Quadratic, and Model_Quadratic_T). And the mean relative error (MRE) (excluding data whose pressure equals zero) of the last four models is 4.3188%, 4.5328%, 3.7793%, 3.6925%, respectively.
The results show that models based on multiple waves (Model_Linear, Model_Linear_T, Model_Quadratic, and Model_Quadratic_T) are more accurate than models based on single wave (Model_LCR_T and Model_LRE4_T). The nonlinear models with quadratic terms (Model_Quadratic and Model_Quadratic_T) work better than linear models based on multiple waves (Model_Linear, Model_Linear_T). Models without temperature compensation (Model_Linear and Model_Quadratic) can achieve same-level accuracy as models with temperature compensation (Model_Linear_T and Model_Quadratic_T).
5. Conclusions
In this paper, a new mechanism of pressure measurement based on ultrasonic waves is proposed. A prototype of the ultrasonic sensor is developed and tested in a series of experiments; we can conclude that it is suitable to measure the pressure inside cylindrical pressure vessels by measuring the travel time of various longitudinal waves. In the experiments, we identified that the change in travel time of the critically refracted longitudinal wave (LCR wave) and the reflected longitudinal waves vary linearly with the pressure. By applying a data fusion algorithm, the measurement models of selected waves—including LCR wave and several reflected longitudinal waves—are established. Through experiments at several temperatures, we can conclude that the measurement models which take multiple waves into account will achieve higher accuracy than models using a single wave because the models of multiple waves can significantly mitigate the interference of temperature. In addition, we also found in our experiments that the model with quadratic terms would be more accurate.
To acquire the accurate travel-time change of various waves, not only a new mechanism of measurement but also a set of adequate devices are essential; for example, an analog circuit based on TDC is important in the pressure sensor.


