
High-Resolution Time-Frequency Spectrum-Based Lung Function Test from a Smartphone Microphone

 and
and 
Abstract
:1. Introduction
2. Materials and Methods
2.1. Subjects
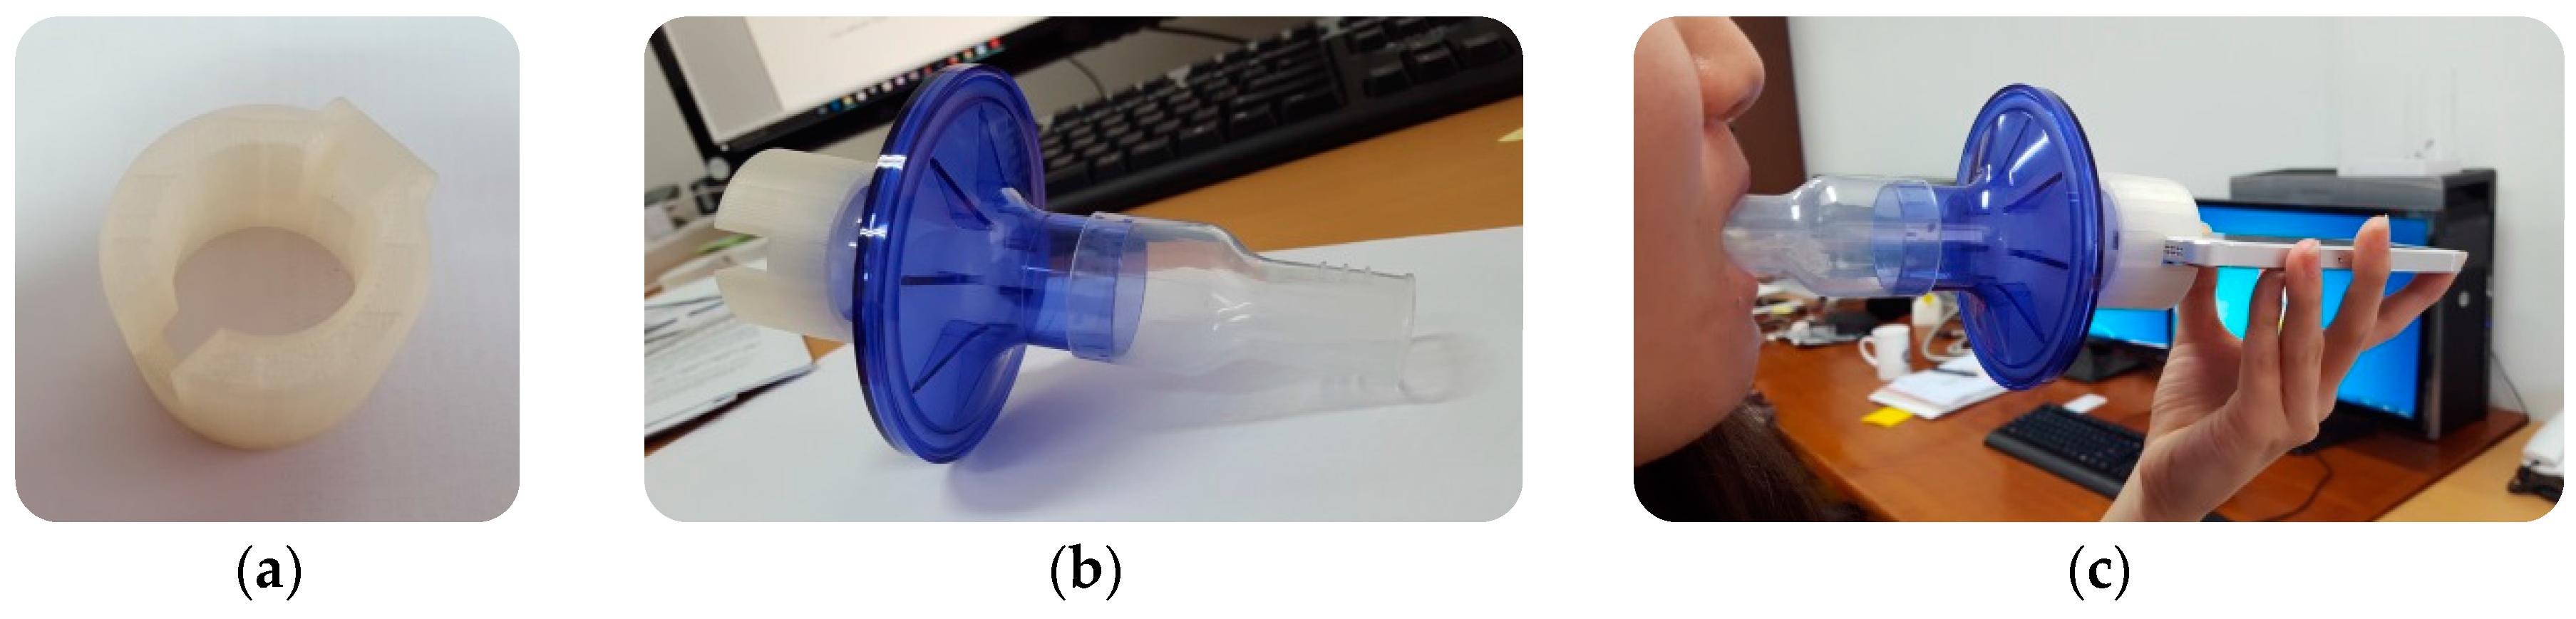
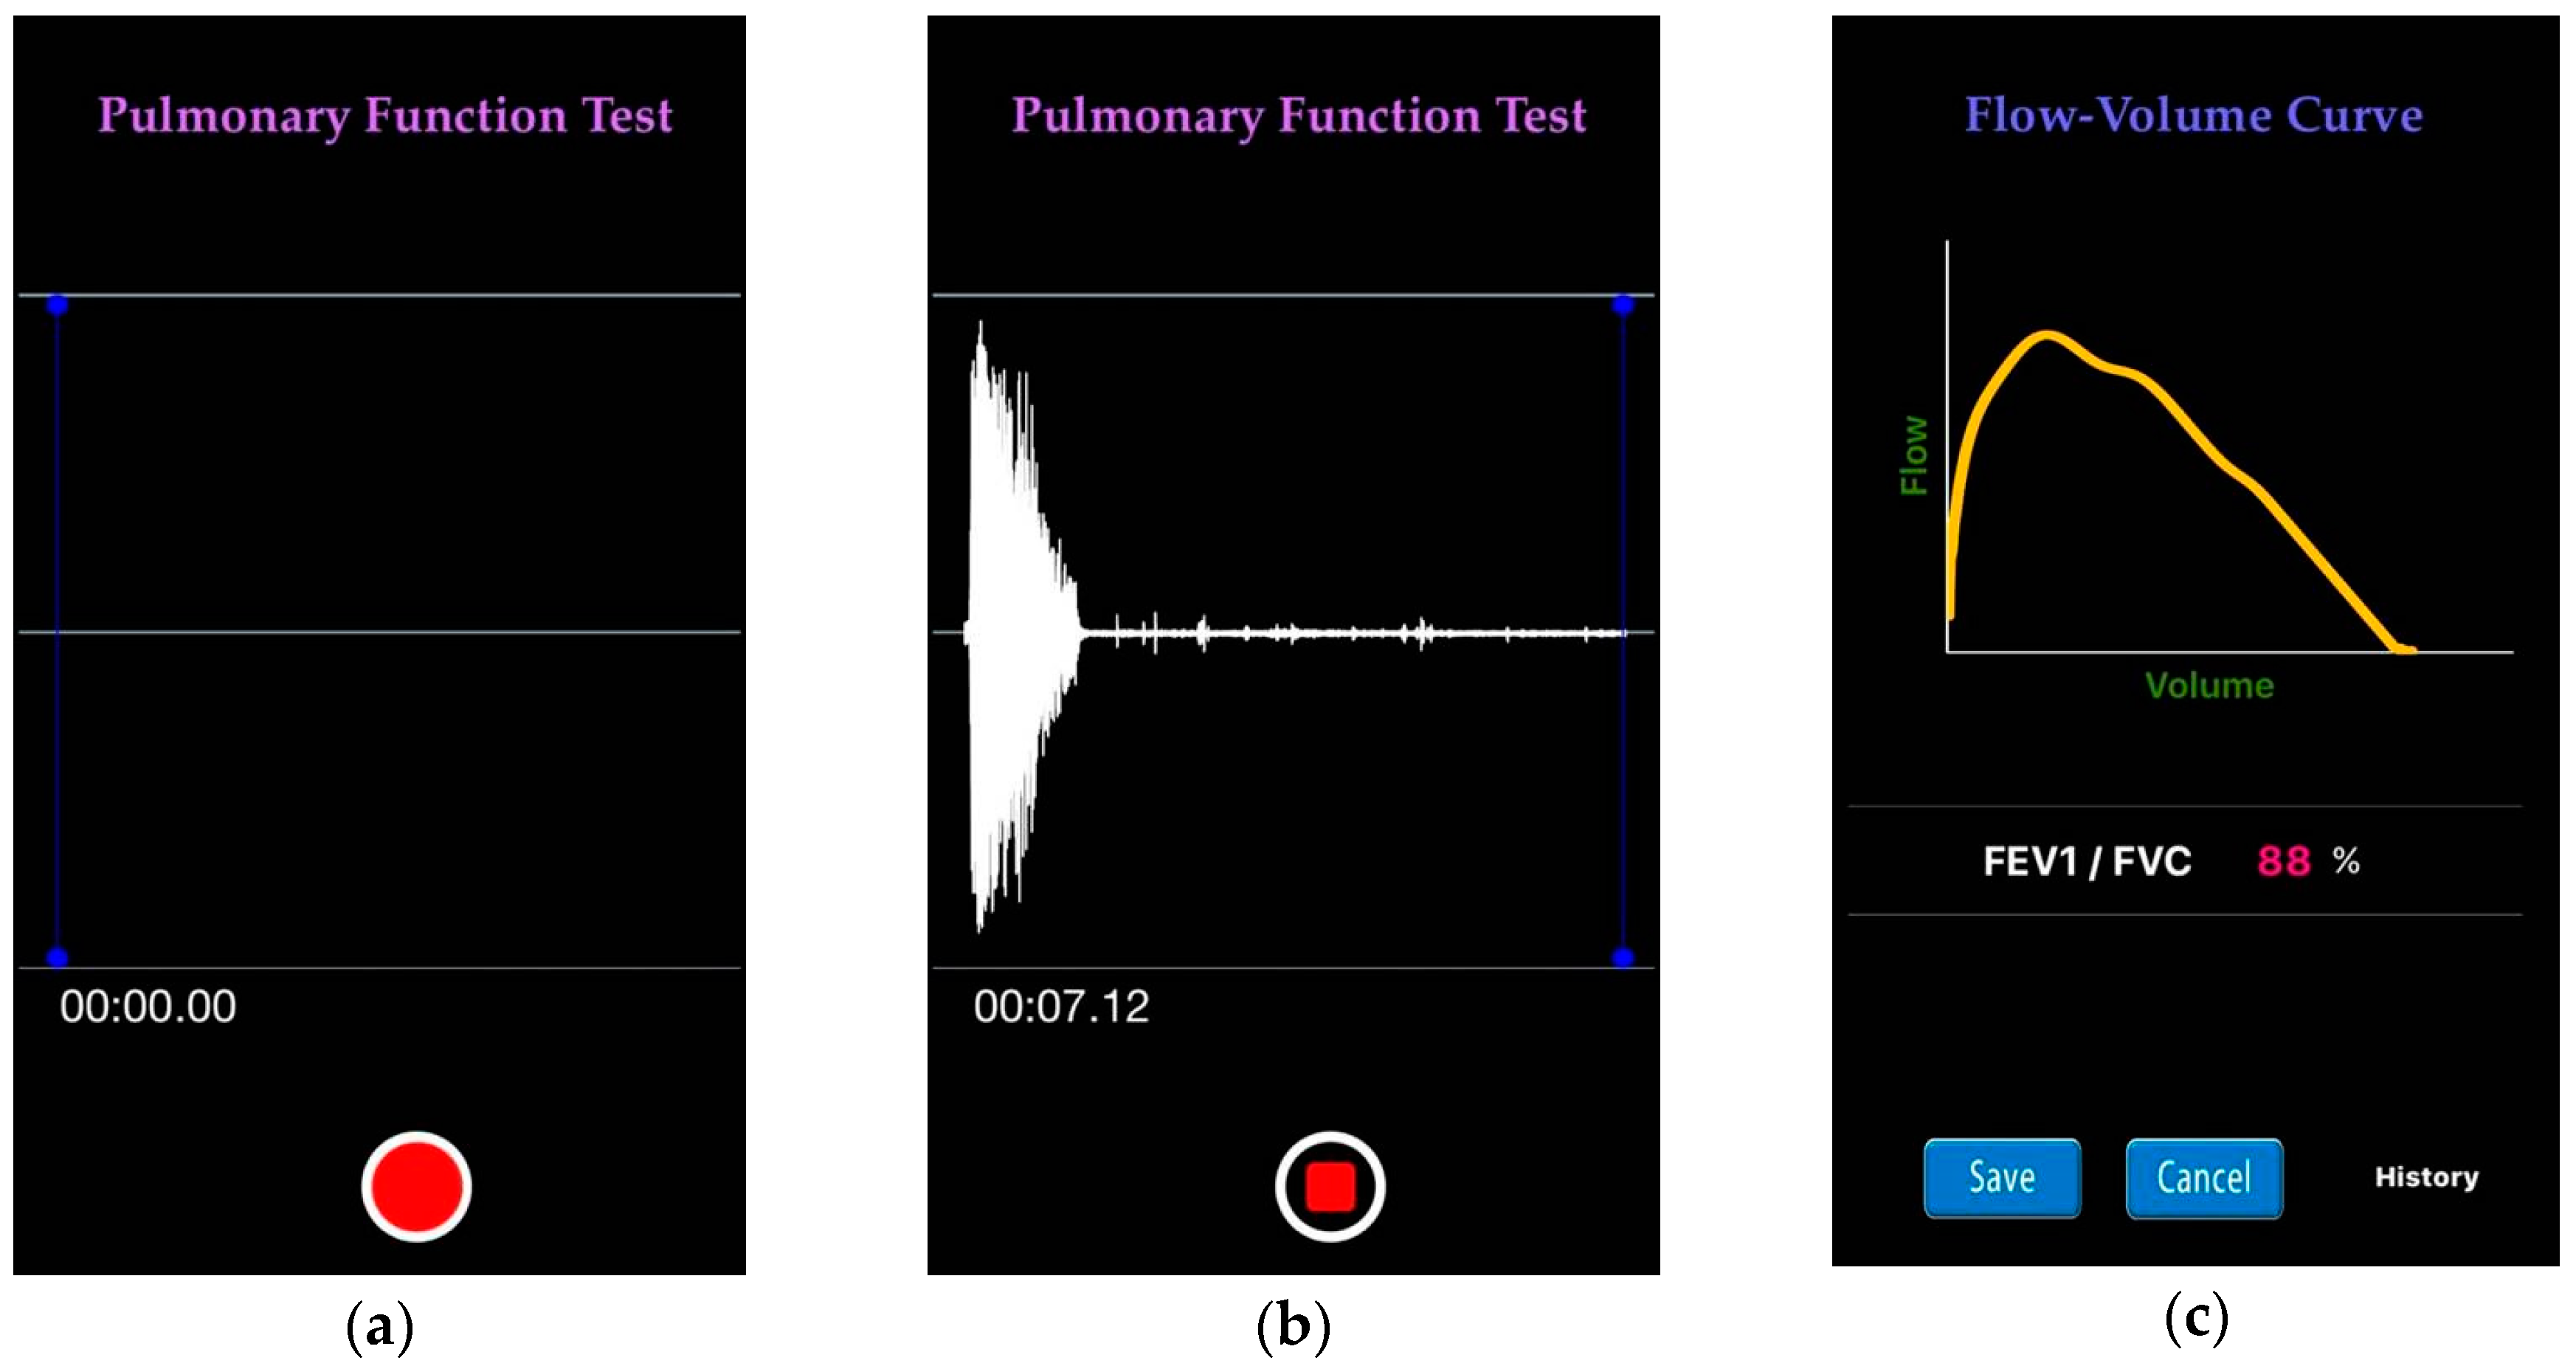
2.2. Data Collection and Preprocessing
- Do not smoke during the hour before the test;
- Do not drink alcohol during the four hours before the test;
- Do not eat a large meal during the two hours before the test;
- Please wear loose clothing;
- Do not perform vigorous exercise within 30 min of the test; and
- If on puffer (inhaler) medication, you may be asked to refrain from taking it for a few hours before the test.
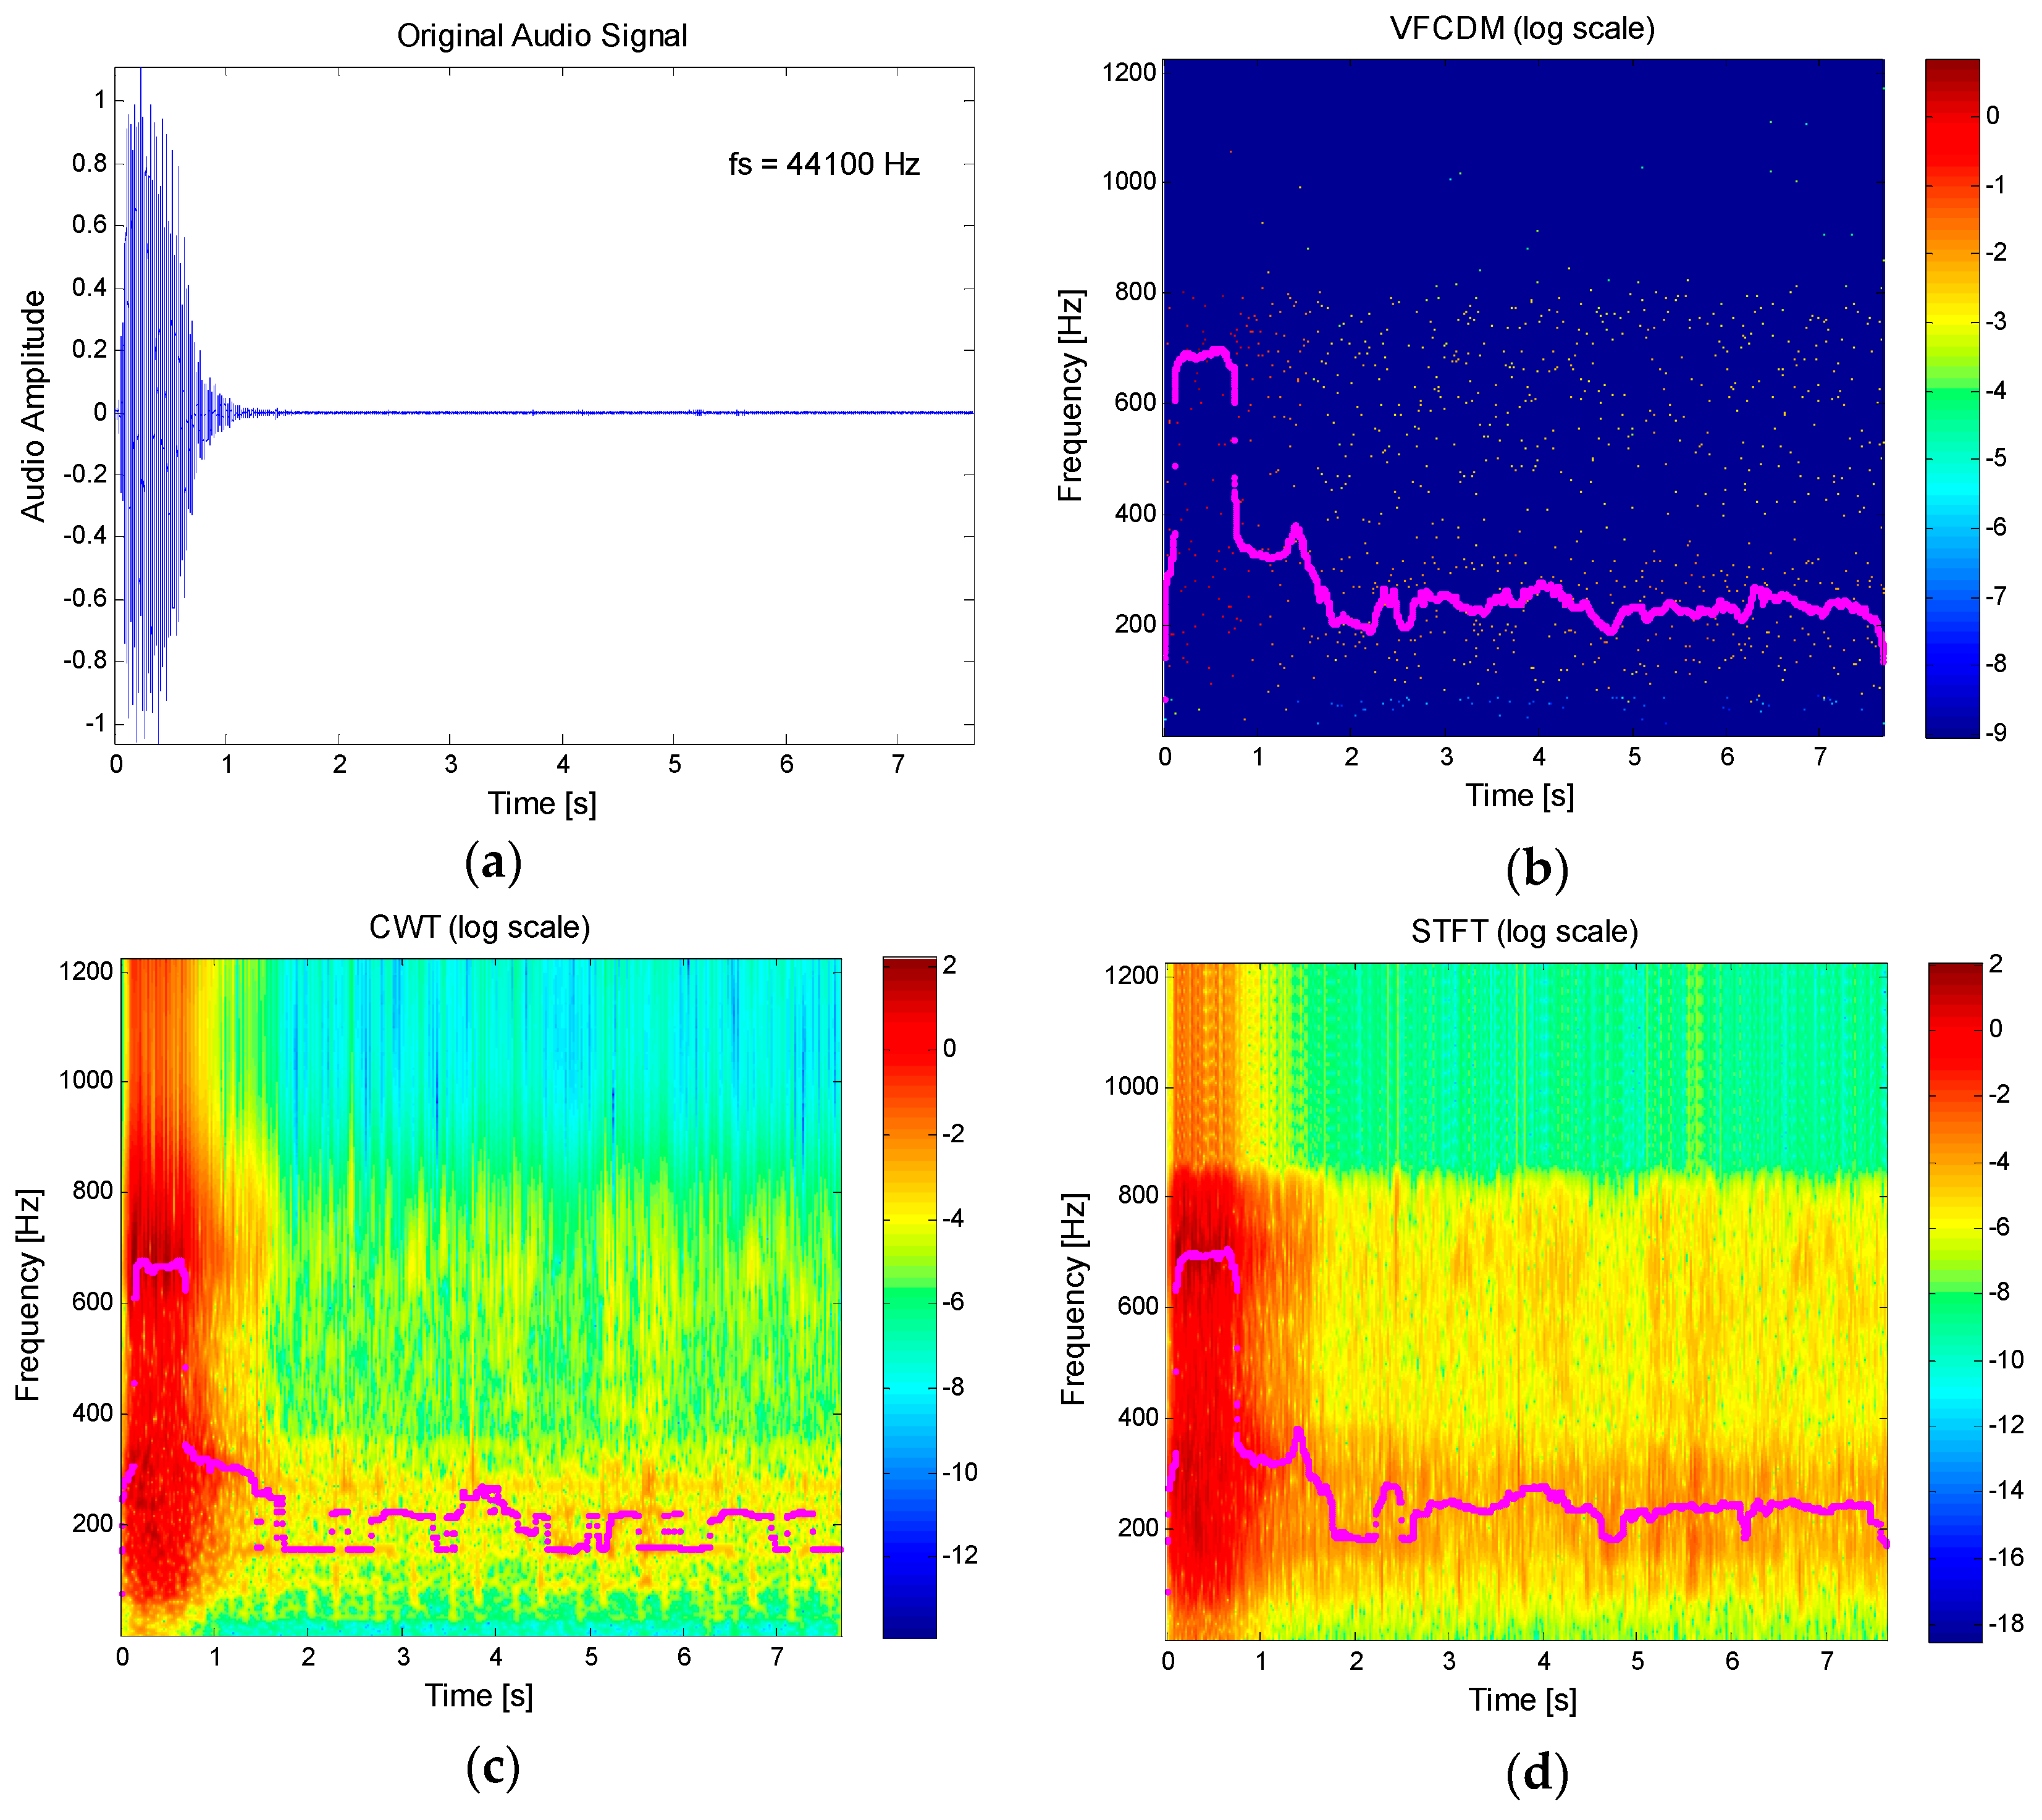
2.3. Resonance Frequency Estimation Using High Resolution Time-Frequency Spectrum
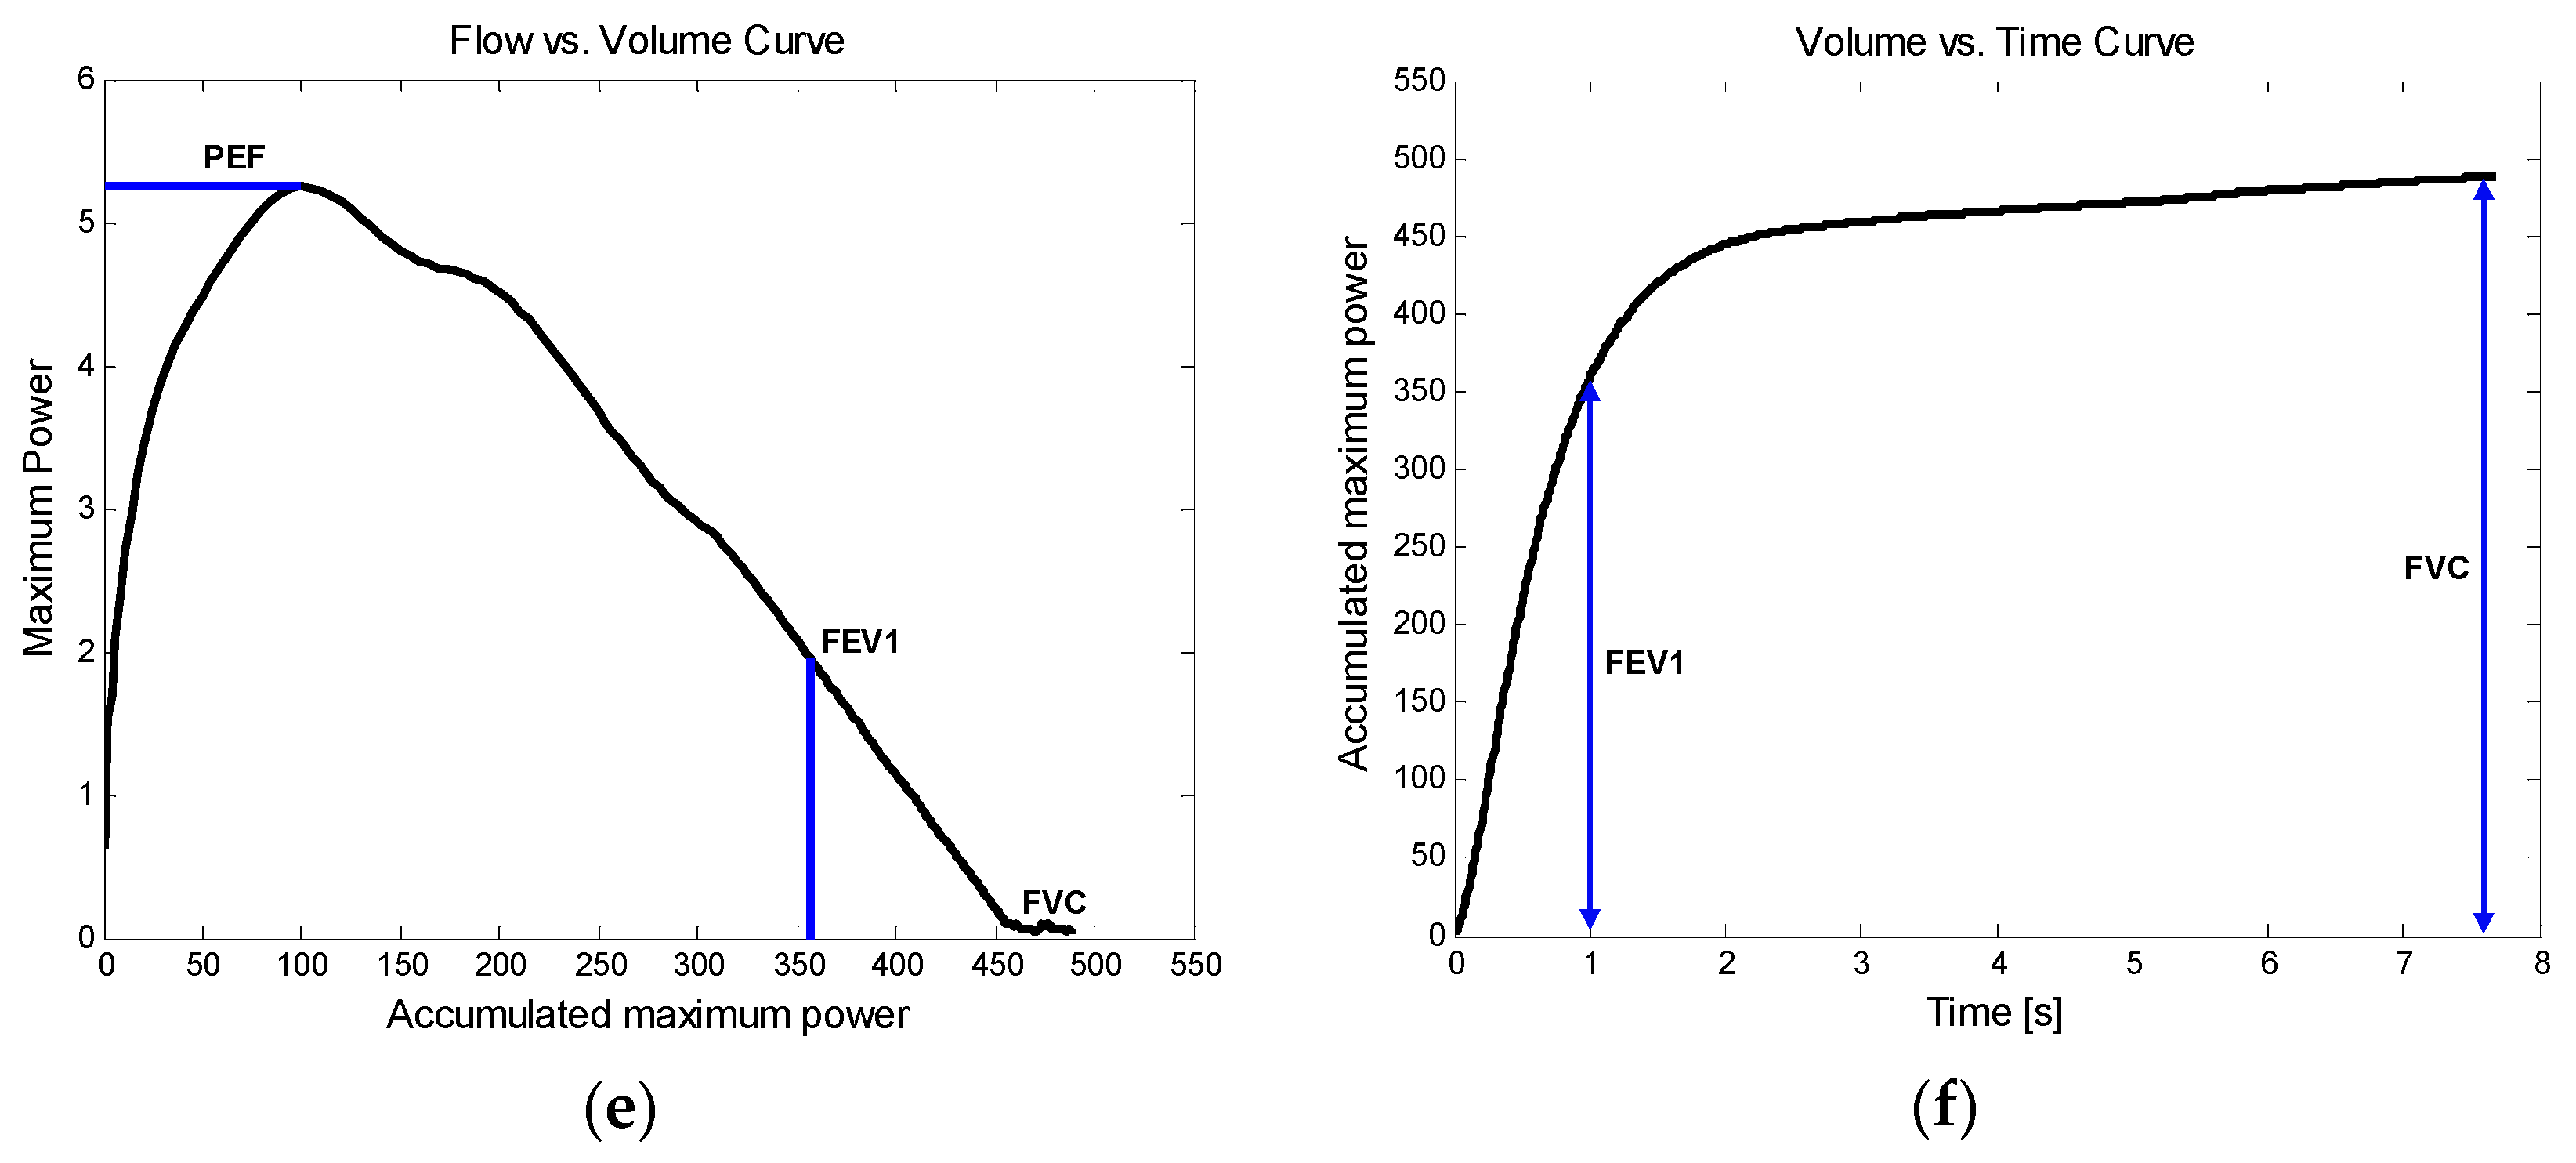
2.4. Instantaneous Power and Performance Evaluation
3. Results
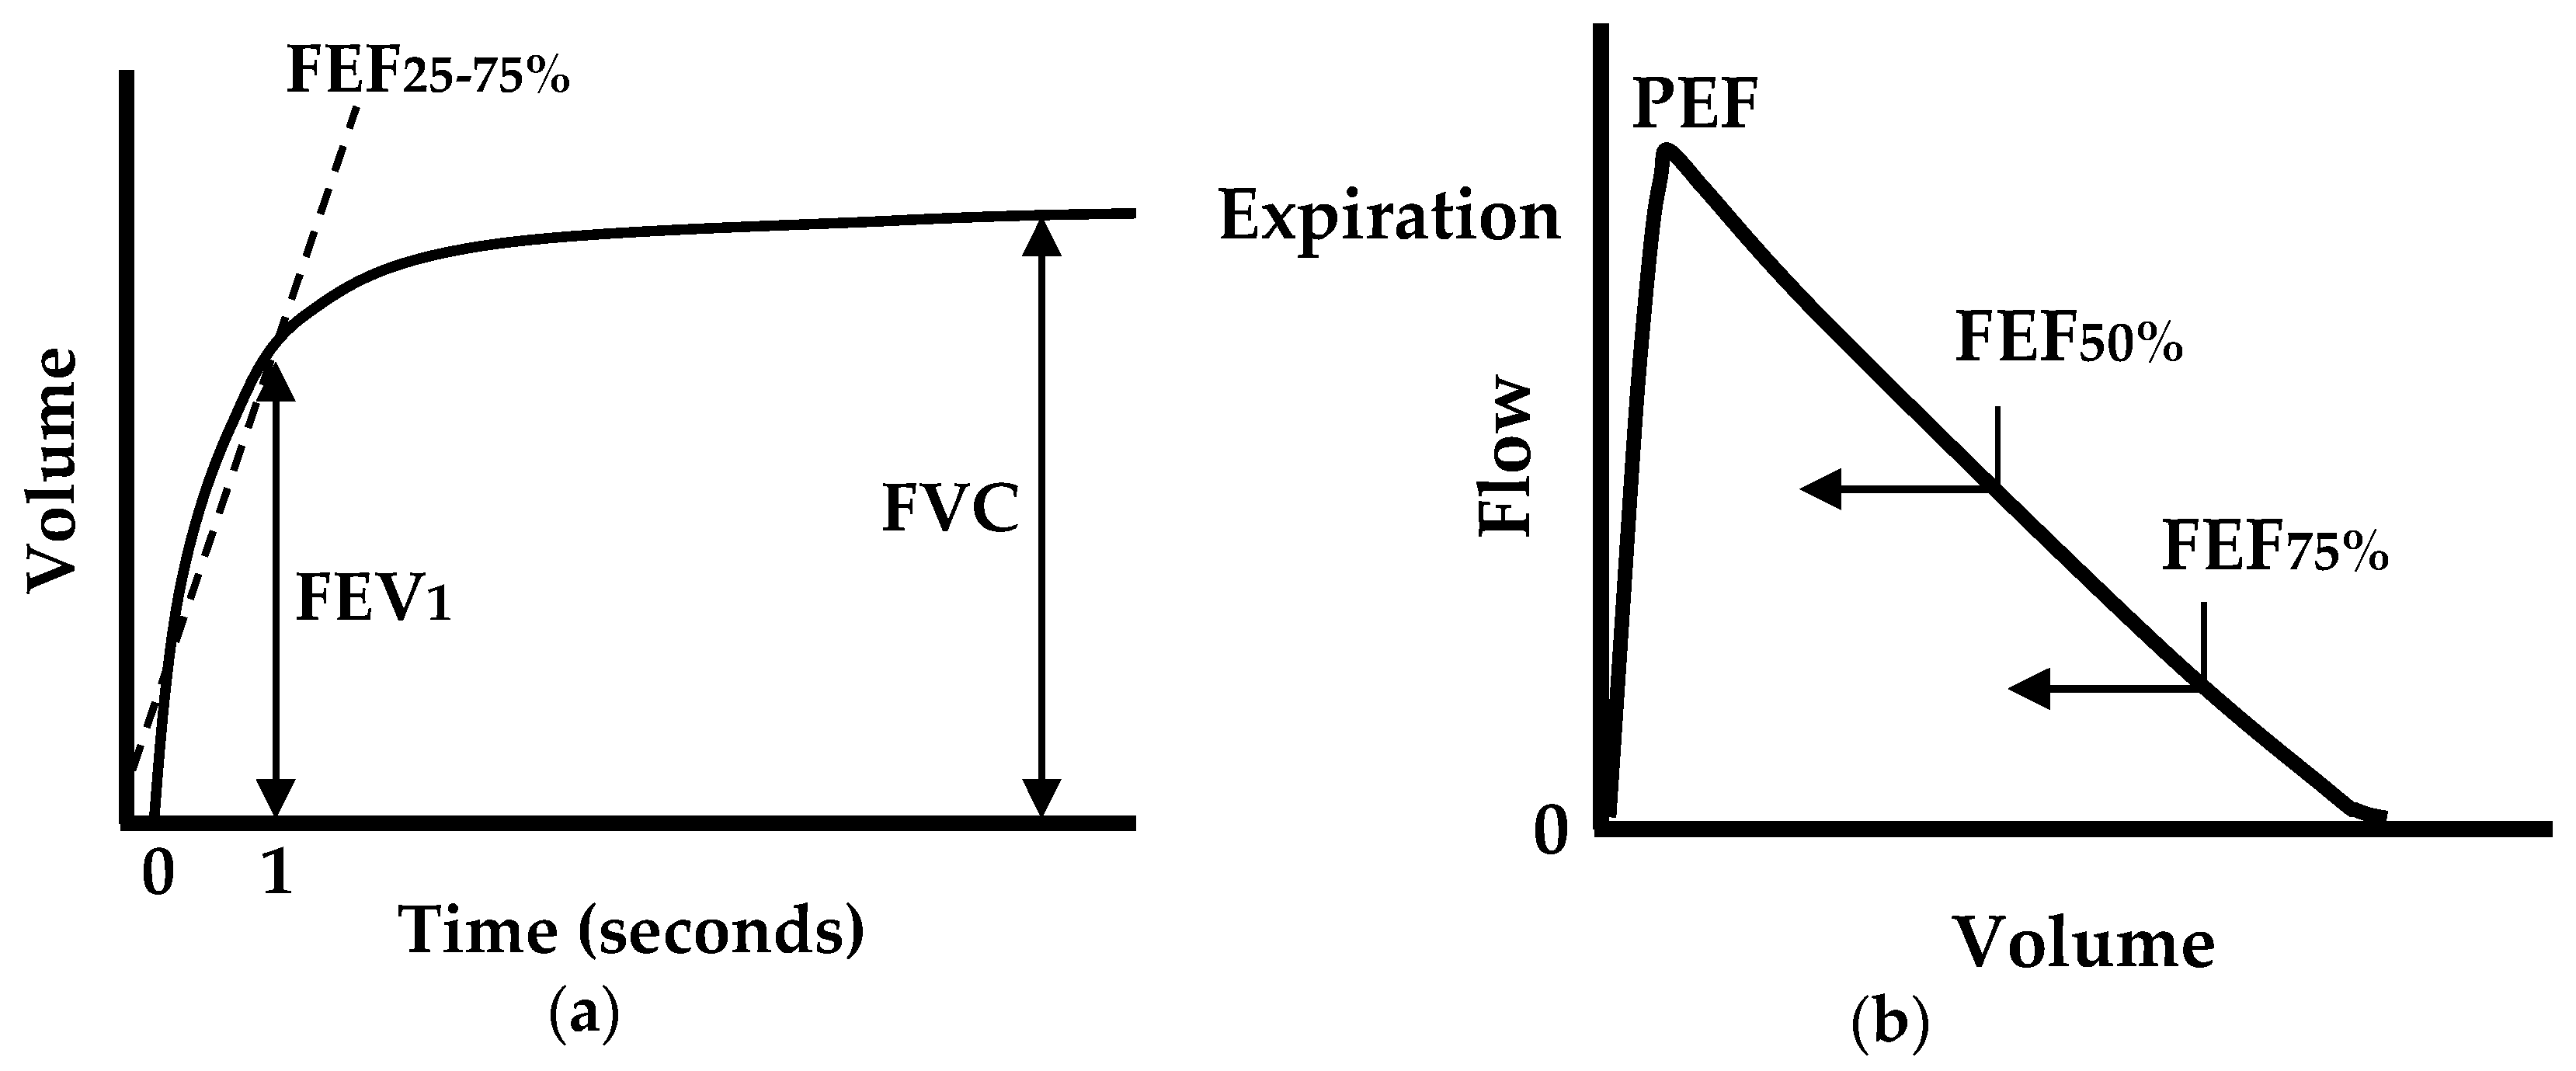
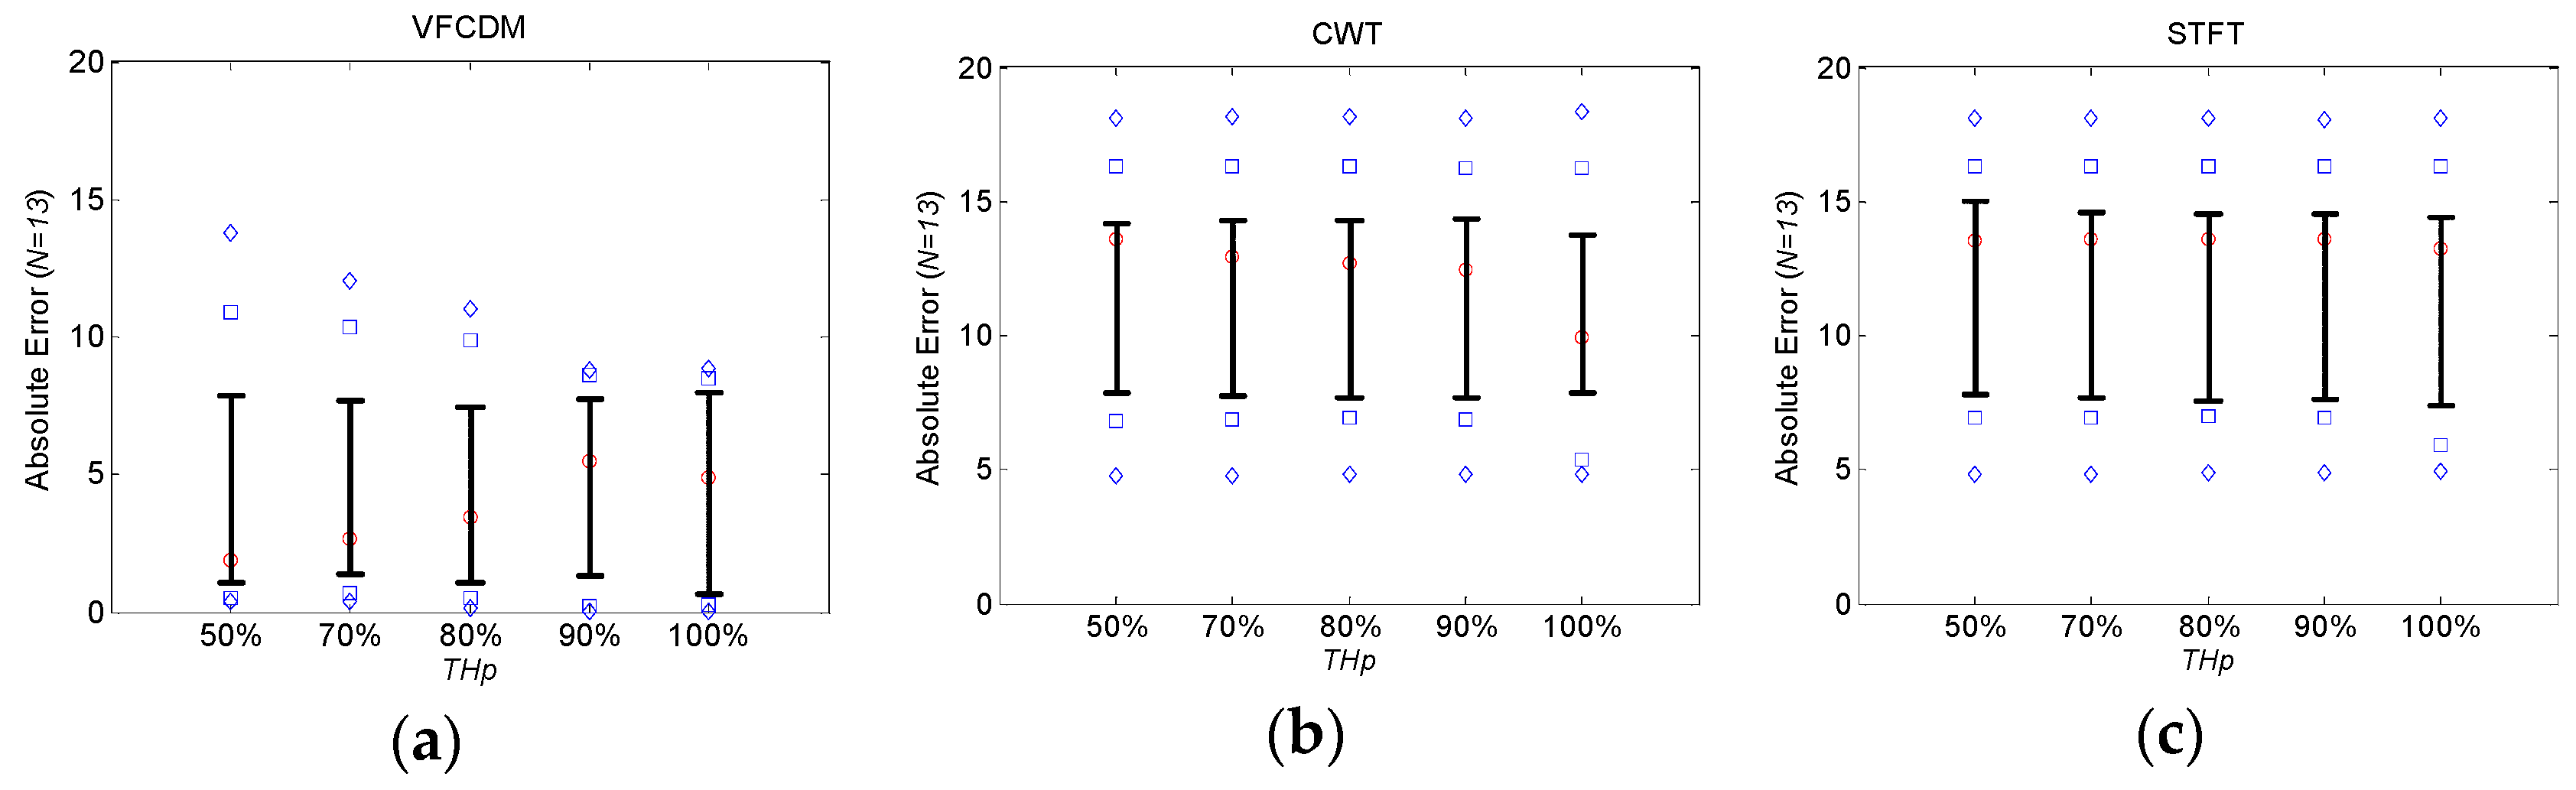
3.1. Estimation of FEV1/FVC Ratio
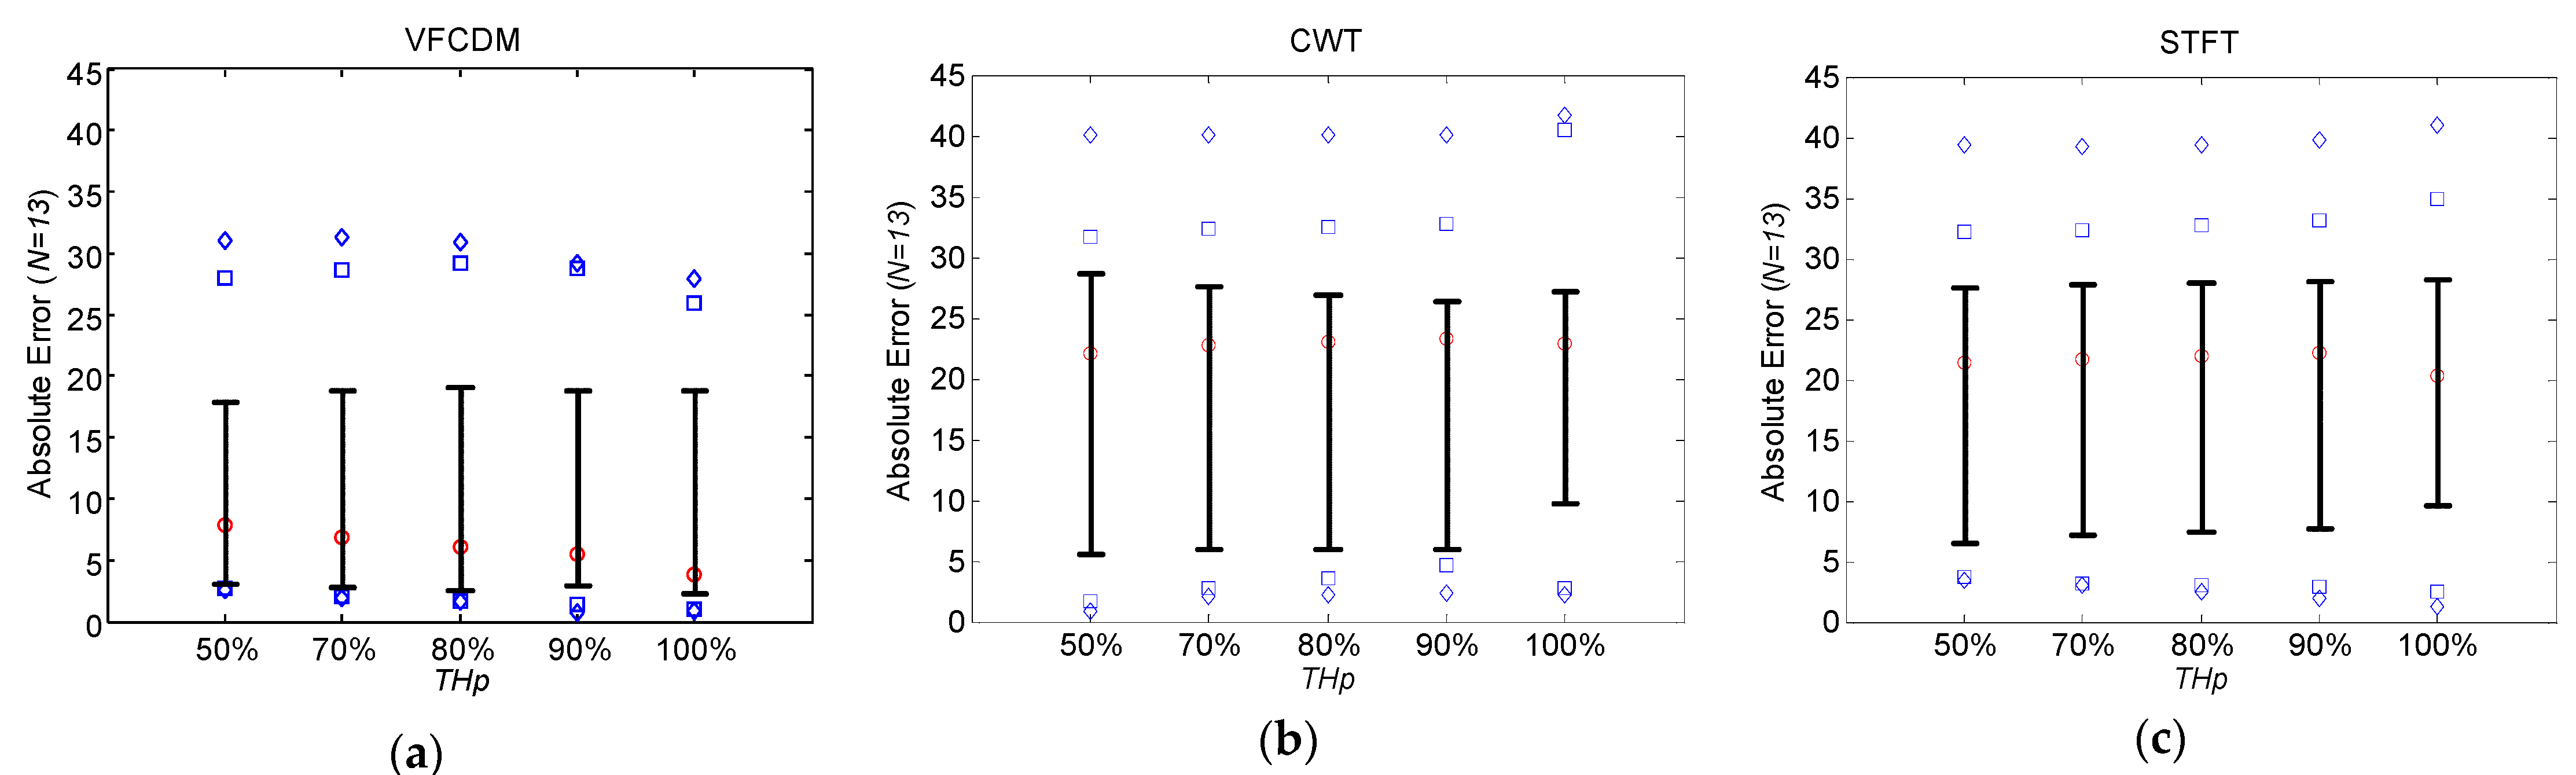
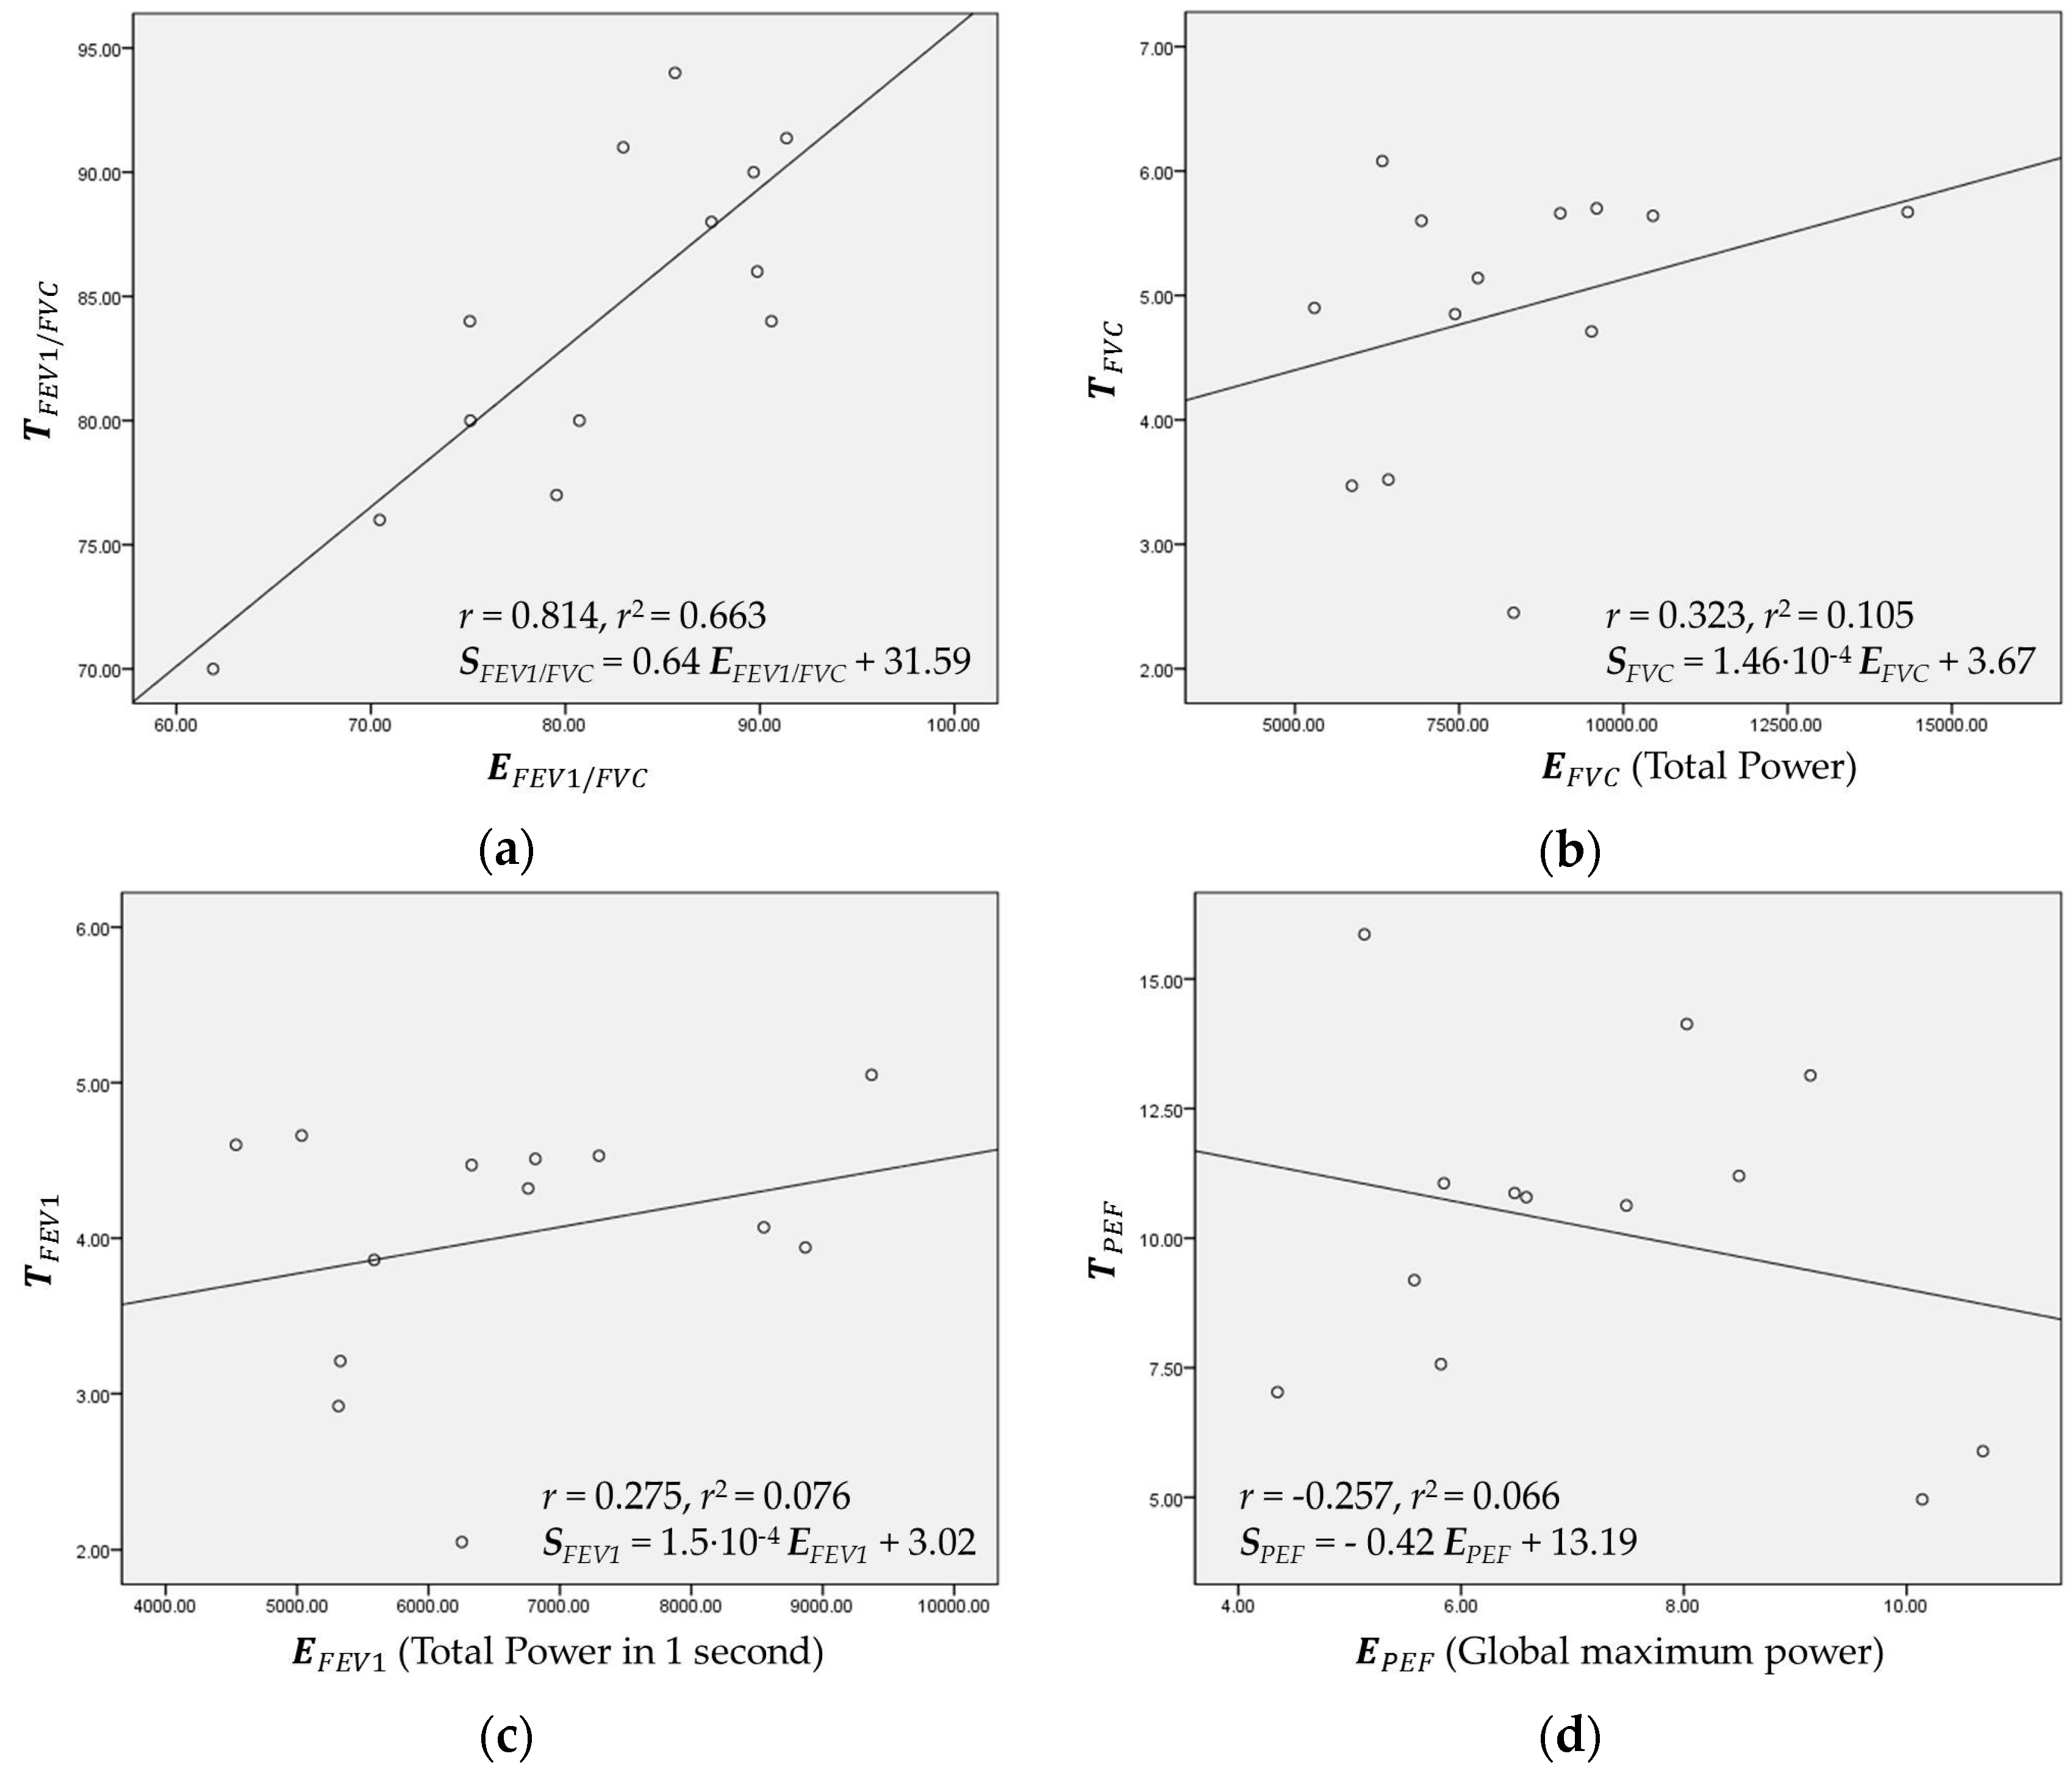
3.2. Regression and Estimation of FVC, FEV1, and PEF
4. Discussion
5. Conclusions
Acknowledgments
Author Contributions
Conflicts of Interest
Abbreviations
| PFT | Pulmonary function test |
| FVC | Forced vital capacity |
| FEV1 | Forced expiratory volume in 1 s |
| FEV1/FVC | Forced expiratory volume in 1 s/forced vital capacity |
| PEF | peak expiratory flow |
| ATS | American Thoracic Society |
| BTS | British Thoracic Society |
| ECCS | European Community for Coal and Steel |
| ERS | European Respiratory Society |
| GOLD | Global Initiative for Chronic Obstructive Lung Disease |
| LLN | Lower limit of normal |
| NICE | National Institute for Health and Clinical Excellence |
| VFCDM | Variable frequency complex demodulation method |
| CWT | Continuous wavelet transform |
| RMSE | Root mean squared error |
| STFT | short time Fourier transform |
| SPWV | Smoothed pseudo Wigner-Ville |
| COPD | Chronic obstructive pulmonary disease |
References
- Delzell, J.E., Jr. Common lung conditions: Environmental pollutants and lung disease. FP Essent. 2013, 409, 32–42. [Google Scholar] [PubMed]
- Gualano, R.C.; Vlahos, R.; Anderson, G.P. What is the contribution of respiratory viruses and lung proteases to airway remodelling in asthma and chronic obstructive pulmonary disease? Pulm. Pharmacol. Therap. 2006, 19, 18–23. [Google Scholar] [CrossRef] [PubMed]
- Petty, T.L. Benefits of and barriers to the widespread use of spirometry. Curr. Opin. Pulm. Med. 2005, 11, 115–120. [Google Scholar] [CrossRef] [PubMed]
- Dombkowski, K.J.; Hassan, F.; Wasilevich, E.A.; Clark, S.J. Spirometry use among pediatric primary care physicians. Pediatrics 2010, 126, 682–687. [Google Scholar] [CrossRef] [PubMed]
- Kaminsky, D.A.; Marcy, T.W.; Bachand, M.; Irvin, C.G. Knowledge and use of office spirometry for the detection of chronic obstructive pulmonary disease by primary care physicians. Respir. Care 2005, 50, 1639–1648. [Google Scholar] [CrossRef] [PubMed]
- Pierce, R.; Johns, D. Spirometry: The Measurement and Interpretation of Ventilatory Function in Clinical Practice; Originally commissioned by The Thoracic Society of Australia and New Zealand, First published; 1995; Available online: https://goo.gl/Sv5MQr (accessed on 15 August 2016).
- Pierce, R. Spirometry: An essential clinical measurement. Aust. Fam. Phys. 2005, 34, 535–539. [Google Scholar]
- Miller, M.R.; Hankinson, J.; Brusasco, V.; Burgos, F.; Casaburi, R.; Coates, A.; Crapo, R.; Enright, P.; Van Der Grinten, C.; Gustafsson, P. Standardisation of spirometry. Eur. Respir. J. 2005, 26, 319–338. [Google Scholar] [CrossRef] [PubMed]
- Koch, G. Standardization of lung function testing in infants, children and adolescents. Bull. Eur. Physiopathol. Respir. 1983, 19, 15–24. [Google Scholar]
- American Thoracic Society. Lung function testing: Selection of reference values and interpretative strategies. Am. Rev. Respir. Dis. 1991, 144, 1202–1218. [Google Scholar]
- Quanjer, P.H.; Tammeling, G.J.; Cotes, J.E.; Pedersen, O.F.; Peslin, R.; Yernault, J.C. Lung volumes and forced ventilatory flows. Eur. Respir. J. 1993, 6 (Suppl. S16), 5–40. [Google Scholar] [CrossRef] [PubMed]
- Ferguson, G.T.; Enright, P.L.; Buist, A.S.; Higgins, M.W. Office spirometry for lung health assessment in adults: A consensus statement from the national lung health education program. Chest 2000, 117, 1146–1161. [Google Scholar] [CrossRef] [PubMed]
- American Thoracic Society. Standards for the diagnosis and care of patients with chronic obstructive pulmonary disease (COPD) and asthma. Am. Rev. Respir. Dis. 1987, 136, 225–244. [Google Scholar]
- The COPD Guidelines Group of the Standards of Care Committee of the BTS. BTS guidelines for the management of chronic obstructive pulmonary disease. Thorax 1997, 52 (Suppl. S5), S1–S28. [Google Scholar]
- Swanney, M.P.; Ruppel, G.; Enright, P.L.; Pedersen, O.F.; Crapo, R.O.; Miller, M.R.; Jensen, R.L.; Falaschetti, E.; Schouten, J.P.; Hankinson, J.L.; et al. Using the lower limit of normal for the fev1/fvc ratio reduces the misclassification of airway obstruction. Thorax 2008, 63, 1046–1051. [Google Scholar] [CrossRef] [PubMed]
- Celli, B.R.; MacNee, W.; Force, A.E.T. Standards for the diagnosis and treatment of patients with copd: A summary of the ats/ers position paper. Eur. Respir. J. 2004, 23, 932–946. [Google Scholar] [CrossRef] [PubMed]
- Sevick, M.A.; Trauth, J.M.; Ling, B.S.; Anderson, R.T.; Piatt, G.A.; Kilbourne, A.M.; Goodman, R.M. Patients with complex chronic diseases: Perspectives on supporting self-management. J. Gen. Internal Med. 2007, 22, 438–444. [Google Scholar] [CrossRef] [PubMed]
- Seemungal, T.A.; Donaldson, G.C.; Bhowmik, A.; Jeffries, D.J.; Wedzicha, J.A. Time course and recovery of exacerbations in patients with chronic obstructive pulmonary disease. Am. J. Respir. Crit. Care Med. 2000, 161, 1608–1613. [Google Scholar] [CrossRef] [PubMed]
- Lindgren, B.R.; Finkelstein, S.M.; Prasad, B.; Dutta, P.; Killoren, T.; Scherber, J.; Edin Stibbe, C.L.; Snyder, M.; Hertz, M.I. Determination of reliability and validity in home monitoring data of pulmonary function tests following lung transplantation. Res. Nurs. Health 1997, 20, 539–550. [Google Scholar] [CrossRef]
- Otulana, B.A.; Higenbottam, T.; Ferrari, L.; Scott, J.; Igboaka, G.; Wallwork, J. The use of home spirometry in detecting acute lung rejection and infection following heart-lung transplantation. Chest J. 1990, 97, 353–357. [Google Scholar] [CrossRef]
- Bjortuft, O.; Johansen, B.; Boe, J.; Foerster, A.; Holter, E.; Geiran, O. Daily home spirometry facilitates early detection of rejection in single lung transplant recipients with emphysema. Eur. Respir. J. 1993, 6, 705–708. [Google Scholar] [PubMed]
- Pelkonen, A.S.; Nikander, K.; Turpeinen, M. Reproducibility of home spirometry in children with newly diagnosed asthma. Pediatr. Pulmonol. 2000, 29, 34–38. [Google Scholar] [CrossRef]
- Morlion, B.; Knoop, C.; Paiva, M.; Estenne, M. Internet-based home monitoring of pulmonary function after lung transplantation. Am. J. Respir. Crit. Care Med. 2002, 165, 694–697. [Google Scholar] [CrossRef] [PubMed]
- Larson, E.C.; Goel, M.; Boriello, G.; Heltshe, S.; Rosenfeld, M.; Patel, S.N. Spirosmart: Using a microphone to measure lung function on a mobile phone. In Proceedings of the UbiComp, Pittsburgh, PA, USA, 5–8 September 2012; pp. 280–289.
- Lee, J.; McManus, D.D.; Bourrell, P.; Sornmo, L.; Chon, K.H. Atrial flutter and atrial tachycardia detection using bayesian approach with high resolution time-frequency spectrum from ecg recordings. Biomed. Signal Process. 2013, 8, 992–999. [Google Scholar] [CrossRef]
- Wang, H.; Siu, K.; Ju, K.; Chon, K.H. A high resolution approach to estimating time-frequency spectra and their amplitudes. Ann. Biomed. Eng. 2006, 34, 326–338. [Google Scholar] [CrossRef] [PubMed]
- Chon, K.H.; Dash, S.; Ju, K. Estimation of respiratory rate from photoplethysmogram data using time-frequency spectral estimation. IEEE Trans. Bio-Med. Eng. 2009, 56, 2054–2063. [Google Scholar] [CrossRef] [PubMed]
- Selvaraj, N.; Shelley, K.H.; Silverman, D.G.; Stachenfeld, N.; Galante, N.; Florian, J.P.; Mendelson, Y.; Chon, K. A novel approach using time-frequency analysis of pulse-oximeter data to detect progressive hypovolemia in spontaneously breathing healthy subjects. IEEE Trans. Bio-Med. Eng. 2011, 58, 2272–2279. [Google Scholar] [CrossRef] [PubMed]
- Miller, M.R.; Crapo, R.; Hankinson, J.; Brusasco, V.; Burgos, F.; Casaburi, R.; Coates, A.; Enright, P.; van der Grinten, C.M.; Gustafsson, P. General considerations for lung function testing. Eur. Respir. J. 2005, 26, 153–161. [Google Scholar] [CrossRef] [PubMed]
- Larson, E.C.; Saba, E.; Kaiser, S.; Goel, M.; Patel, S.N. Pulmonary Monitoring Using Smartphones. Available online: http://lyle.smu.edu/~eclarson/teaching/ubicomp/papers/PulmonarySmartphones.pdf (accessed on 29 January 2016).
- Goel, M.; Saba, E.; Stiber, M.; Whitmire, E.; Fromm, J.; Larson, E.C.; Borriello, G.; Patel, S.N. Spirocall: Measuring lung function over a phone call. In Proceedings of the 2016 CHI Conference on Human Factors in Computing Systems, San Jose, CA, USA, 7–12 May 2016; pp. 5675–5685.
- Sato, H.; Ohara, M.; Watanabe, K.; Sato, H. Application of the vortex whistle to the spirometer. Trans. Soc. Instrum. Control Eng. 1999, 35, 840–845. [Google Scholar] [CrossRef]
- Kristiansen, U.; Amielh, M. Measurements on a little known sound source-the vortex whistle. 2016. [Google Scholar]
- Crapo, R.O.; Morris, A.H.; Gardner, R.M. Reference spirometric values using techniques and equipment that meet ats recommendations 1–3. Am. Rev. Respir. Dis. 1981, 123, 659–664. [Google Scholar] [PubMed]
- Morris, J.F.; Koski, A.; Johnson, L.C. Spirometric standards for healthy nonsmoking adults 1–3. Am. Rev. Respir. Dis. 1971, 103, 57–67. [Google Scholar] [CrossRef] [PubMed]
- Polgar, G.; Promadhat, V. Standard values in pulmonary function testing in children. Phila.: WB Saunders Go 1971, 179, 87–212. [Google Scholar]
- Polgar, G.; Varuni, P. Pulmonary Function Testing in Children: Techniques and Standards; Saunders Limited.: Condell Park, Australia, 1971. [Google Scholar]


| Organization | Year | Criterion/Reference |
|---|---|---|
| ECCS | 1983 | FEV1/FVC < LLN [9] |
| ATS | 1987 | FEV1/FVC < 0.75 [13] |
| ATS | 1991 | FEV1/FVC < LLN [10] |
| ECCS/ERS | 1993 | FEV1/FVC < LLN [11] |
| BTS | 1997 | FEV1/FVC < 0.70 and FEV1 < 80% predicted [14] |
| NLHEP | 2000 | FEV1/FVC < LLN and FEV1 < LLN [12] |
| NICE | 2004 | FEV1/FVC < 0.75 and FEV1 < 80% predicted [15] |
| ATS/ERS | 2004 | FEV1/FVC < 0.70 post-bronchodilator [16] |
| GOLD | 2007 | FEV1/FVC < 0.75 post-bronchodilator [15] |
| Subjects | Healthy | Patient | Total |
|---|---|---|---|
| (n = 13) | (n = 13) | (n = 26) | |
| Gender (n) | Male 10 | Male 10 | Male 20 |
| Female 3 | Female 3 | Female 6 | |
| Age (years) | 30.85 ± 7.74 | 71.92 ± 10.49 | 51.35 ± 22.85 |
| Height (cm) | 170.23 ± 9.18 | 163.00 ± 6.30 | 166.58 ± 8.51 |
| Weight (kg) | 68.15 ± 16.01 | 61.00 ± 10.54 | 64.58 ± 13.77 |
| FVC (Liters) | 4.89 ± 1.09 | 2.64 ± 0.82 | 3.77 ± 1.49 |
| FEV1 (Liters) | 4.02 ± 0.84 | 1.25 ± 0.52 | 2.63 ± 1.57 |
| PEF (Liter/s) | 10.62 ± 3.09 | 2.97 ± 1.06 | 6.80 ± 4.51 |
| FEV1/FVC (%) | 87.77 ± 6.61 | 48.31 ± 15.32 | 65.54 ± 21.03 |
| THP | 50% | 70% | 80% | 90% | 100% | |||||
|---|---|---|---|---|---|---|---|---|---|---|
| AE | RMSE | AE | RMSE | AE | RMSE | AE | RMSE | AE | RMSE | |
| VFCDM (N = 13) | 4.29 ± 4.44 | 6.05 | 4.44 ± 3.94 | 5.84 | 4.54 ± 3.72 | 5.78 | 4.65 ± 3.39 | 5.68 | 4.49 ± 3.38 | 5.54 |
| CWT (N = 13) | 11.76 ± 4.09 | 12.40 | 11.65 ± 4.10 | 12.30 | 11.60 ± 4.10 | 12.25 | 11.55 ± 4.10 | 12.20 | 10.77 ± 4.14 | 11.48 |
| STFT (N = 13) | 11.86 ± 4.18 | 12.52 | 11.75 ± 4.18 | 12.42 | 11.71 ± 4.19 | 12.38 | 11.67 ± 4.2 | 12.35 | 11.43 ± 4.31 | 12.16 |
| THP | 50% | 70% | 80% | 90% | 100% | |||||
|---|---|---|---|---|---|---|---|---|---|---|
| AE | RMSE | AE | RMSE | AE | RMSE | AE | RMSE | AE | RMSE | |
| VFCDM (N = 13) | 10.01 ± 10.56 | 14.26 | 10.29 ± 10.57 | 14.46 | 10.25 ± 10.63 | 14.47 | 10.17 ± 10.23 | 14.15 | 10.30 ± 10.59 | 14.48 |
| CWT (N = 13) | 18.85 ± 13.14 | 22.69 | 18.87 ± 12.79 | 22.52 | 18.85 ± 12.59 | 22.39 | 18.88 ± 12.39 | 22.32 | 20.93 ± 12.55 | 24.15 |
| STFT (N = 13) | 19.43 ± 11.95 | 22.56 | 19.37 ± 11.86 | 22.48 | 19.33 ± 11.90 | 22.47 | 19.34 ± 11.98 | 22.51 | 19.63 ± 12.14 | 22.83 |
| Healthy | #1 | #2 1 | #3 | #4 | #5 | #6 | #7 | #8 | #9 1 | #10 | #11 | #12 1 | #13 |
|---|---|---|---|---|---|---|---|---|---|---|---|---|---|
| Reference | 88 | 84 | 80 | 77 | 76 | 91 | 94 | 90 | 91 | 80 | 70 | 84 | 86 |
| VFCDM | 87.50 | 90.59 | 75.11 | 79.54 | 70.45 | 91.06 | 85.63 | 89.67 | 82.97 | 80.71 | 61.88 | 75.08 | 89.86 |
| CWT | 98.35 | 99.62 | 87.99 | 95.81 | 85.92 | 99.04 | 98.67 | 98.12 | 96.57 | 89.87 | 83.53 | 98.26 | 99.63 |
| STFT | 98.85 | 99.74 | 86.21 | 95.51 | 89.24 | 99.20 | 98.70 | 97.44 | 98.24 | 94.05 | 84.83 | 98.34 | 99.67 |
| COPD | #1 1 | #2 | #3 | #4 | #5 | #6 | #7 | #8 | #9 | #10 1 | #11 | #12 | #13 1 |
| Reference | 37 | 59 | 26 | 41 | 51 | 67 | 61 | 69 | 29 | 56 | 61 | 60 | 26 |
| VFCDM | 17.61 | 30.56 | 17.90 | 42.43 | 57.06 | 66.02 | 66.22 | 69.66 | 25.31 | 54.97 | 42.30 | 28.51 | 18.97 |
| CWT | 27.16 | 55.96 | 52.27 | 81.10 | 77.59 | 89.92 | 89.94 | 93.26 | 70.91 | 58.03 | 78.10 | 40.64 | 35.72 |
| STFT | 29.15 | 40.88 | 36.31 | 83.44 | 79.11 | 89.51 | 89.91 | 93.79 | 62.07 | 58.87 | 75.86 | 39.68 | 24.94 |
© 2016 by the authors; licensee MDPI, Basel, Switzerland. This article is an open access article distributed under the terms and conditions of the Creative Commons Attribution (CC-BY) license (http://creativecommons.org/licenses/by/4.0/).
Share and Cite
Thap, T.; Chung, H.; Jeong, C.; Hwang, K.-E.; Kim, H.-R.; Yoon, K.-H.; Lee, J. High-Resolution Time-Frequency Spectrum-Based Lung Function Test from a Smartphone Microphone. Sensors 2016, 16, 1305. https://doi.org/10.3390/s16081305
Thap T, Chung H, Jeong C, Hwang K-E, Kim H-R, Yoon K-H, Lee J. High-Resolution Time-Frequency Spectrum-Based Lung Function Test from a Smartphone Microphone. Sensors. 2016; 16(8):1305. https://doi.org/10.3390/s16081305
Chicago/Turabian StyleThap, Tharoeun, Heewon Chung, Changwon Jeong, Ki-Eun Hwang, Hak-Ryul Kim, Kwon-Ha Yoon, and Jinseok Lee. 2016. "High-Resolution Time-Frequency Spectrum-Based Lung Function Test from a Smartphone Microphone" Sensors 16, no. 8: 1305. https://doi.org/10.3390/s16081305
APA StyleThap, T., Chung, H., Jeong, C., Hwang, K.-E., Kim, H.-R., Yoon, K.-H., & Lee, J. (2016). High-Resolution Time-Frequency Spectrum-Based Lung Function Test from a Smartphone Microphone. Sensors, 16(8), 1305. https://doi.org/10.3390/s16081305