1. Introduction
The WorldView-2 (WV-2) satellite, launched in October 2009, offers eight multispectral (MS) bands of 1.84-m spatial resolution and a panchromatic (PAN) band of 0.46 m spatial resolution [
1]. The MS bands cover the spectrum from 400 nm to 1050 nm, and include four conventional visible and near-infrared MS bands: blue (B, 450–510 nm), green (G, 510–580 nm), red (R, 630–690 nm), and near-IR1 (NIR1, 770–895 nm); and four new bands: coastal (C, 400–450 nm), yellow (Y, 585–625 nm), red edge (RE, 705–745 nm), and near-IR2 (NIR2, 860–1040 nm). The PAN band has a spectral response range of 450–800 nm, which covers shorter NIR spectral range than some common PAN bands of 450–900 nm. The WV-2 images have been widely used in various fields, e.g., geological structure interpretation [
1], Antarctic land cover mapping [
2], bamboo patch mapping [
3], high density biomass estimation for wetland vegetation [
4], mapping natural vegetation on a coastal site [
5], predicting forest structural parameters [
6], and especially for the detection of urban objects. Since numerous applications need high-spatial-resolution (HSR) MS images, it is highly desirable to fuse the eight MS bands and the PAN band to produce HSR MS imagery for better monitoring the Earth’s surface.
Numerous pansharpening methods have been proposed in the last decades to produce spatially enhanced MS images by fusing the MS and PAN images. These methods are divided into two categories: the component substitution (CS) family and multi-resolution analysis (MRA) family. The CS approaches focus on the substitution of a component that is obtained by a spectral transformation of the MS bands with the PAN image. The representative CS methods are the intensity-hue-saturation [
7,
8], principal component analysis [
9], and Gram-Schmidt spectral sharpening (GS) [
10,
11] methods. The CS methods are easy to implement, and the generated fused MS images yield high spatial quality. However, the CS methods suffer from spectral distortions since the local dissimilarities between the PAN and MS channels, which are caused by different spectral response ranges, are not considered by them. The MRA-based techniques rely on the injection of the spatial details that are obtained through a multi-resolution decomposition of the PAN image into the up-sampled MS bands. Multi-resolution decomposition methods, such as “à trous” wavelet transform [
12,
13], undecimated or decimated Wavelet transform [
14,
15,
16], Laplacian pyramids [
17], Contourlet [
18,
19,
20], and Curvelet [
21], are often employed to extract spatial details of the PAN image. Although the MRA-based methods better preserve spectral information of the original MS images than the CS methods, they may cause spatial distortions, such as ringing or aliasing effects, originating shifts or blurred contours and textures [
22]. Numerous hybrid schemes combining CS and MRA-based methods are developed to maximize spatial improvement and minimize spectral distortions [
23,
24,
25,
26]. In addition, several new pansharpening methods were proposed for the fusion of WV-2 imagery, i.e., the Hyperspherical Color Sharpening (HCS) [
27] method and the improved Non-subsampled Contourlet Transform (NSCT) method [
28]. These methods were proved to be better than early CS methods, such as GS, PCA.
Several studies have performed comparisons and analyses of some widely used state-of-the-art pansharpening methods, using test images covering different regions from several sensors. Previous studies showed that a pansharpening method may give different performances for test images from different sensors [
29,
30]. A noticeable point for the WV-2 is that the spectral ranges of the PAN band overlap limited party of the spectral ranges of the C, NIR1, and NIR2 bands. This will result in relative low correlation coefficients between these bands and the PAN bands, which may lead to spectral distortions of the fused version of these bands [
31]. Regarding the wide use of the fused WV-2 images, it is urgent to evaluate the performances of different state-of-the-art pansharpening methods applied to WV-2 imagery. Some of the previous comparisons also used test images recorded by WV-2 [
30,
32,
33,
34,
35] and other sensors. In these works, the early pansharpening methods, such as GS, PANSHARP, Ehlers, modified intensity-hue-saturation (M-IHS), high pass filter (HPF), principal component analysis (PCA), and wavelet-PCA (W-PCA) methods were assessed regarding quality indexes and visual inspection, usually using one or two test images covering urban areas. However, a fusion product providing the best performance in terms of quality indexes and visual inspection may be the best choice for applications such as image interpretation, but it may be not the best choice for applications related to classification and objects identification, i.e., the extraction of buildings, vegetation, and water-bodies [
29,
36,
37]. Consequently, it is important to evaluate the widely used state-of-the-art pansharpening methods from the point of applications, such as land cover classification and object extraction. The purpose of this study was to assess the performances of the existing state-of-the-art pansharpening methods applied to WV-2 imagery, using information indices related to land cover classification and information extraction, as well as quality indexes and visual inspection. Several test images, presenting typical image scenes covering urban, suburban, and rural regions, are employed in the experiments. In addition, the newly proposed HCS, and NSCT methods, which are rarely included in previous comparisons, will be included in this work.
In this study, eight state-of-the-art algorithms, most of which have been demonstrated to outperform some other methods were assessed using both quality indices and information indices, along with visual inspection. The selected algorithms include four methods belonging to the CS family and four methods belonging to the MRA family. The four CS methods including Gram-Schmidt (GS) [
10], adaptive GS (GSA) [
38], Haze- and Ratio-based (HR) [
39], and HCS [
27] were compared. The four MRA methods include undecimated “à trous” wavelet transform (ATWT) using additive injection model [
40,
41], Generalized Laplacian pyramids (GLP) using spectral distortion minimal model (SDM) and context-based decision model (CBD) [
42,
43], and the improved NSCT method introduced in [
28]. Traditional image quality indices couple with visual inspection were adopted to assess the quality of the fused images. Four comprehensive indices, including Dimensionless Global Relative Error of Synthesis (ERGAS) [
44], Spectral Angle Mapper (SAM) [
45],
Q2
n [
46,
47], and spatial correlation coefficient (SCC) [
48] were employed to measure the spectral distortion between the fused and the original MS bands. Regarding the application purpose of the high-resolution fused images, which includes land cover classification of urban or suburban areas, bamboo and forest mapping, and so on, some widely used indexes, derived from the fusion products, were assessed to evaluate the information presentation ability of the fusion products. The employed indexes include morphological building index (MBI) [
49], normalized difference vegetation index (NDVI), and normalized difference water index (NDWI). The information presentation of a fusion product was assessed using the correlation coefficient (CC) between an index derived from the fusion product and the same index derived from the corresponding original MS image. A higher CC value implies a better information preservation ability of the fusion product.
This paper is organized as follows: the eight selected pansharpening methods are introduced in
Section 2, as well as the quality indexes; the experimental results with visual and quantitative comparisons with other outstanding fusion methods are presented in
Section 3. Discussions are presented in
Section 4, whereas the conclusions are summarized in
Section 5.
4. Discussion
Generally, the comparisons of different pansharpening methods are performed by assessing fusion products using spectral and spatial quality indexes, as well as visual inspection. However, a good performance in terms of quality indexes and visual inspection does not always result in a good choice for different application purposes. The NDVI, NDWI, and MBI index, which are widely used in applications related land cover classification, the extraction of vegetation area, buildings, and water bodies, were employed in this study to evaluate the performances of the selected pansharpening methods in terms of the information presentation ability. In this study, the performances of eight selected state-of-art pan-sharpening methods were assessed using information indices (NDVI, NDWI and MBI), along with current image quality indices (ERGAS, SAM, Q2n and SCC) and visual inspection, with six datasets from two WV-2 scenes.
4.1. General Performances of the Selected Pansharpening Methods
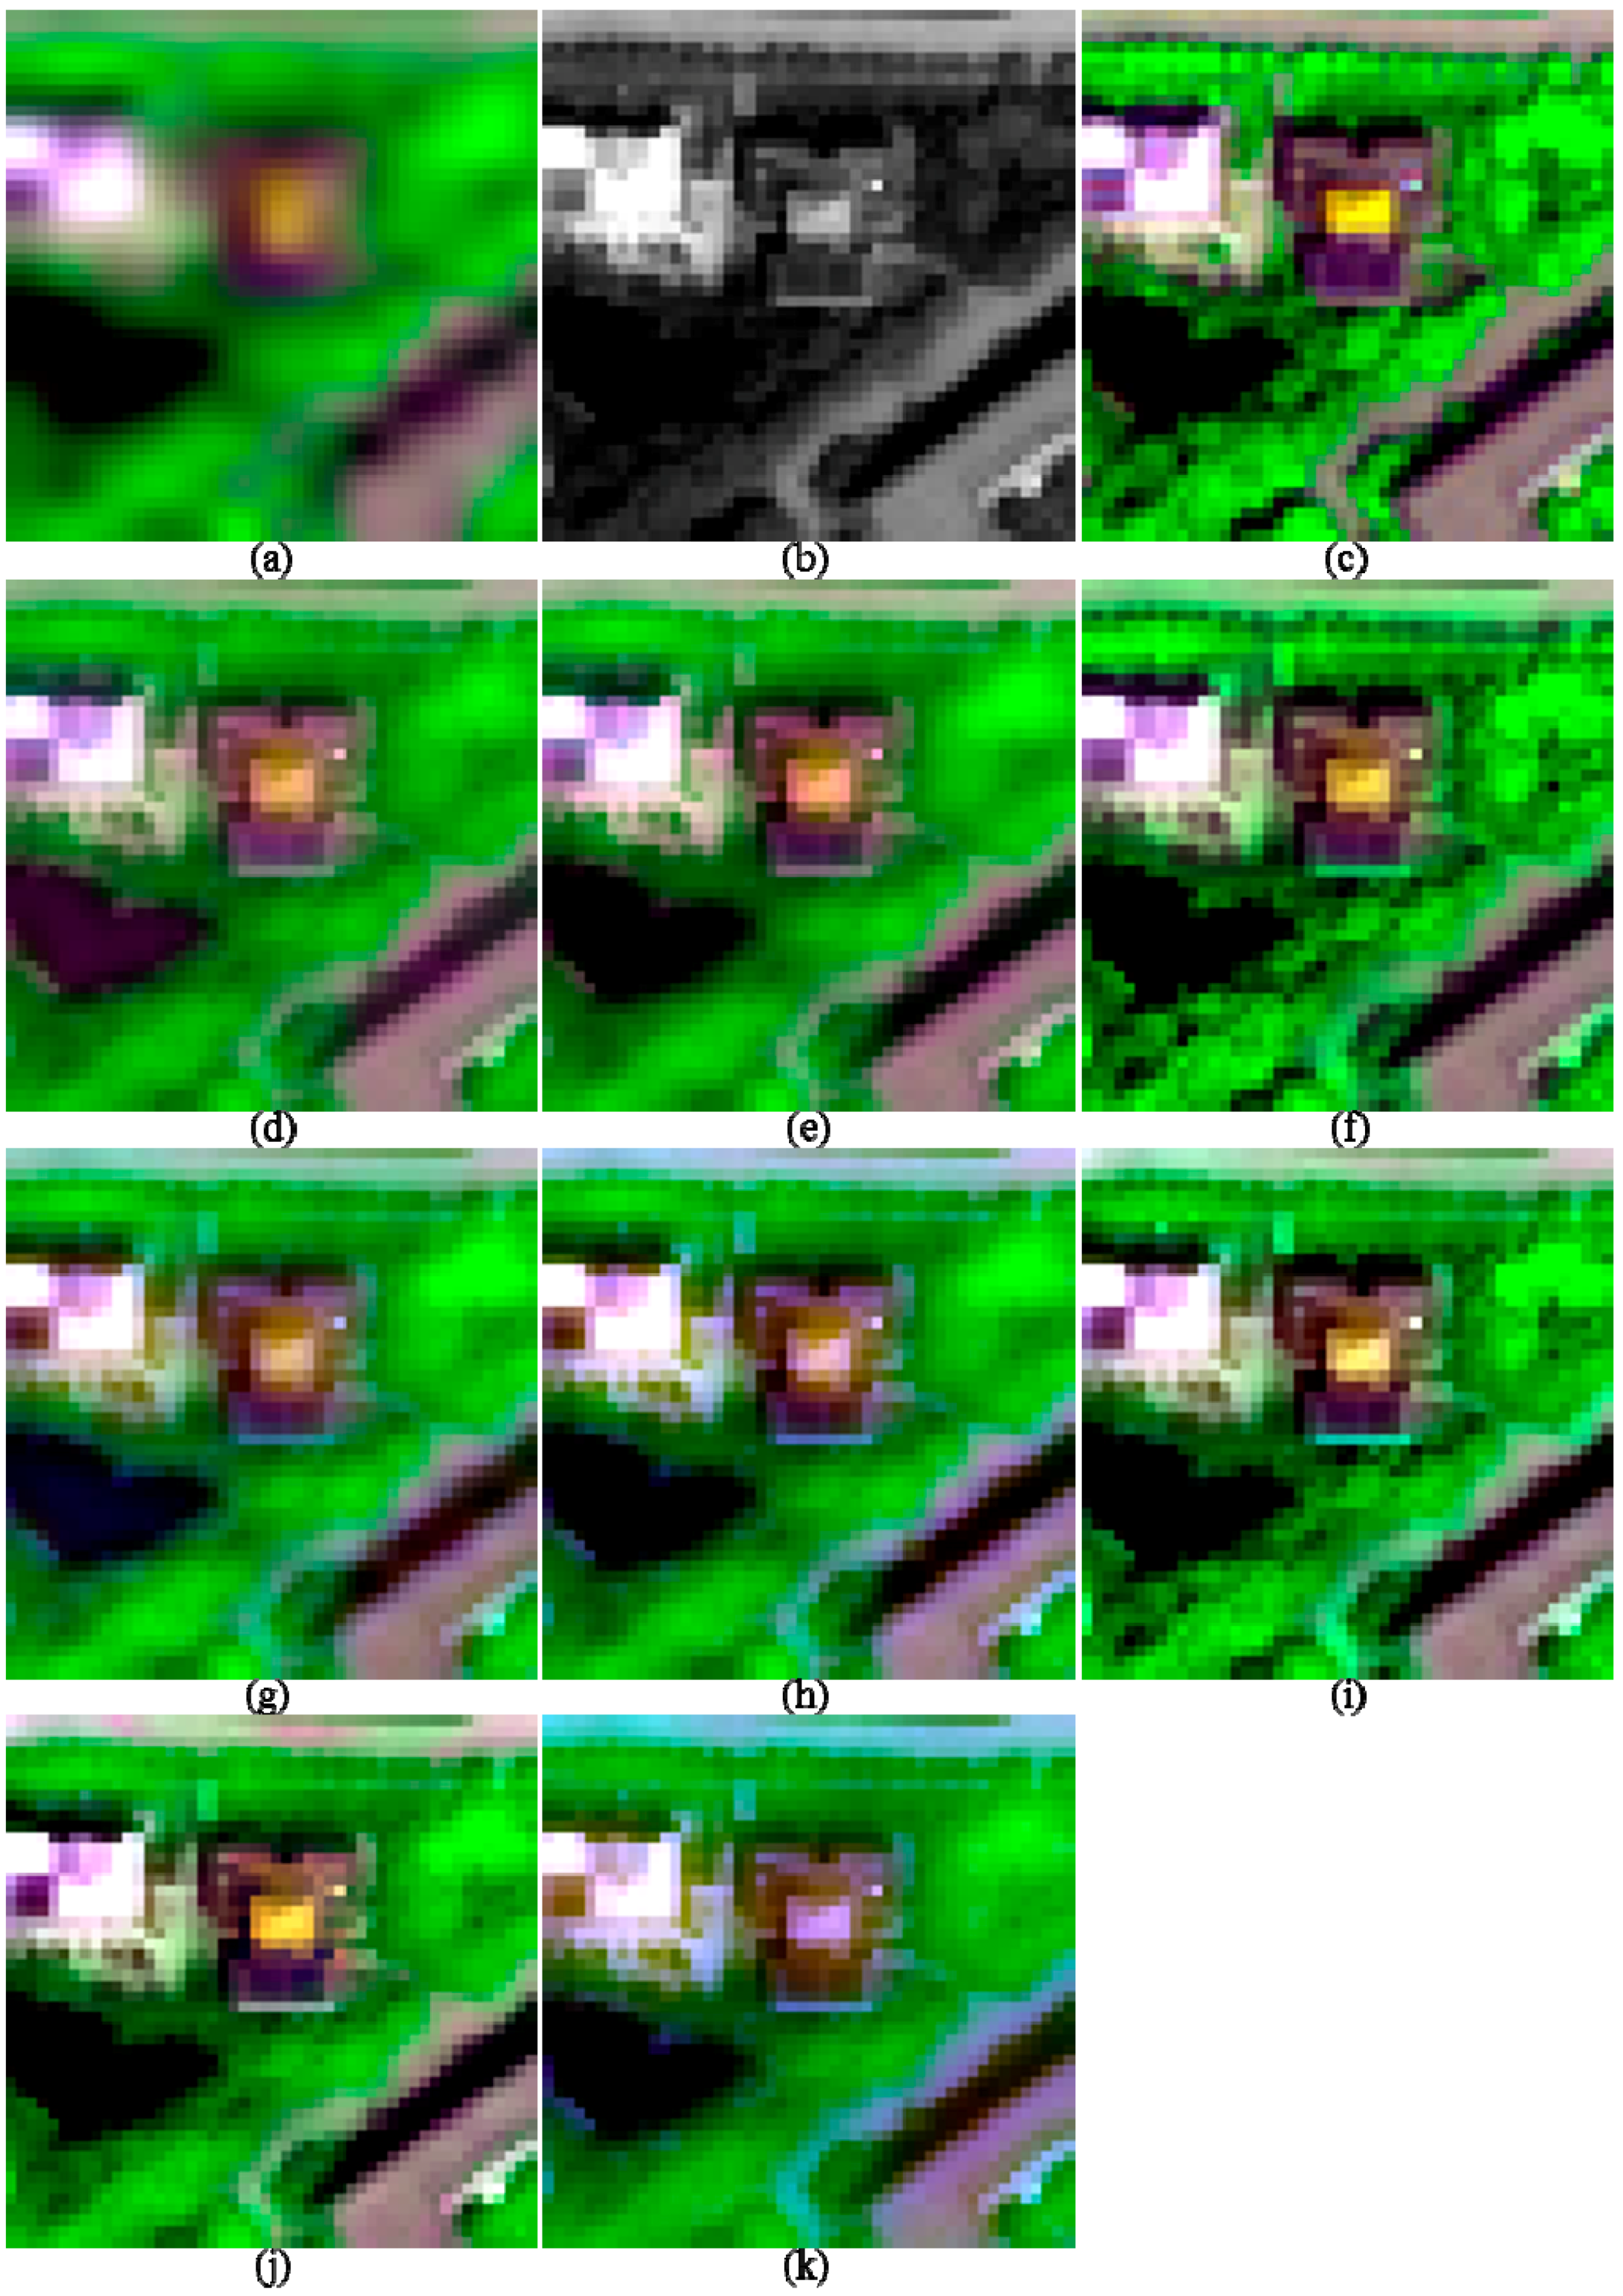
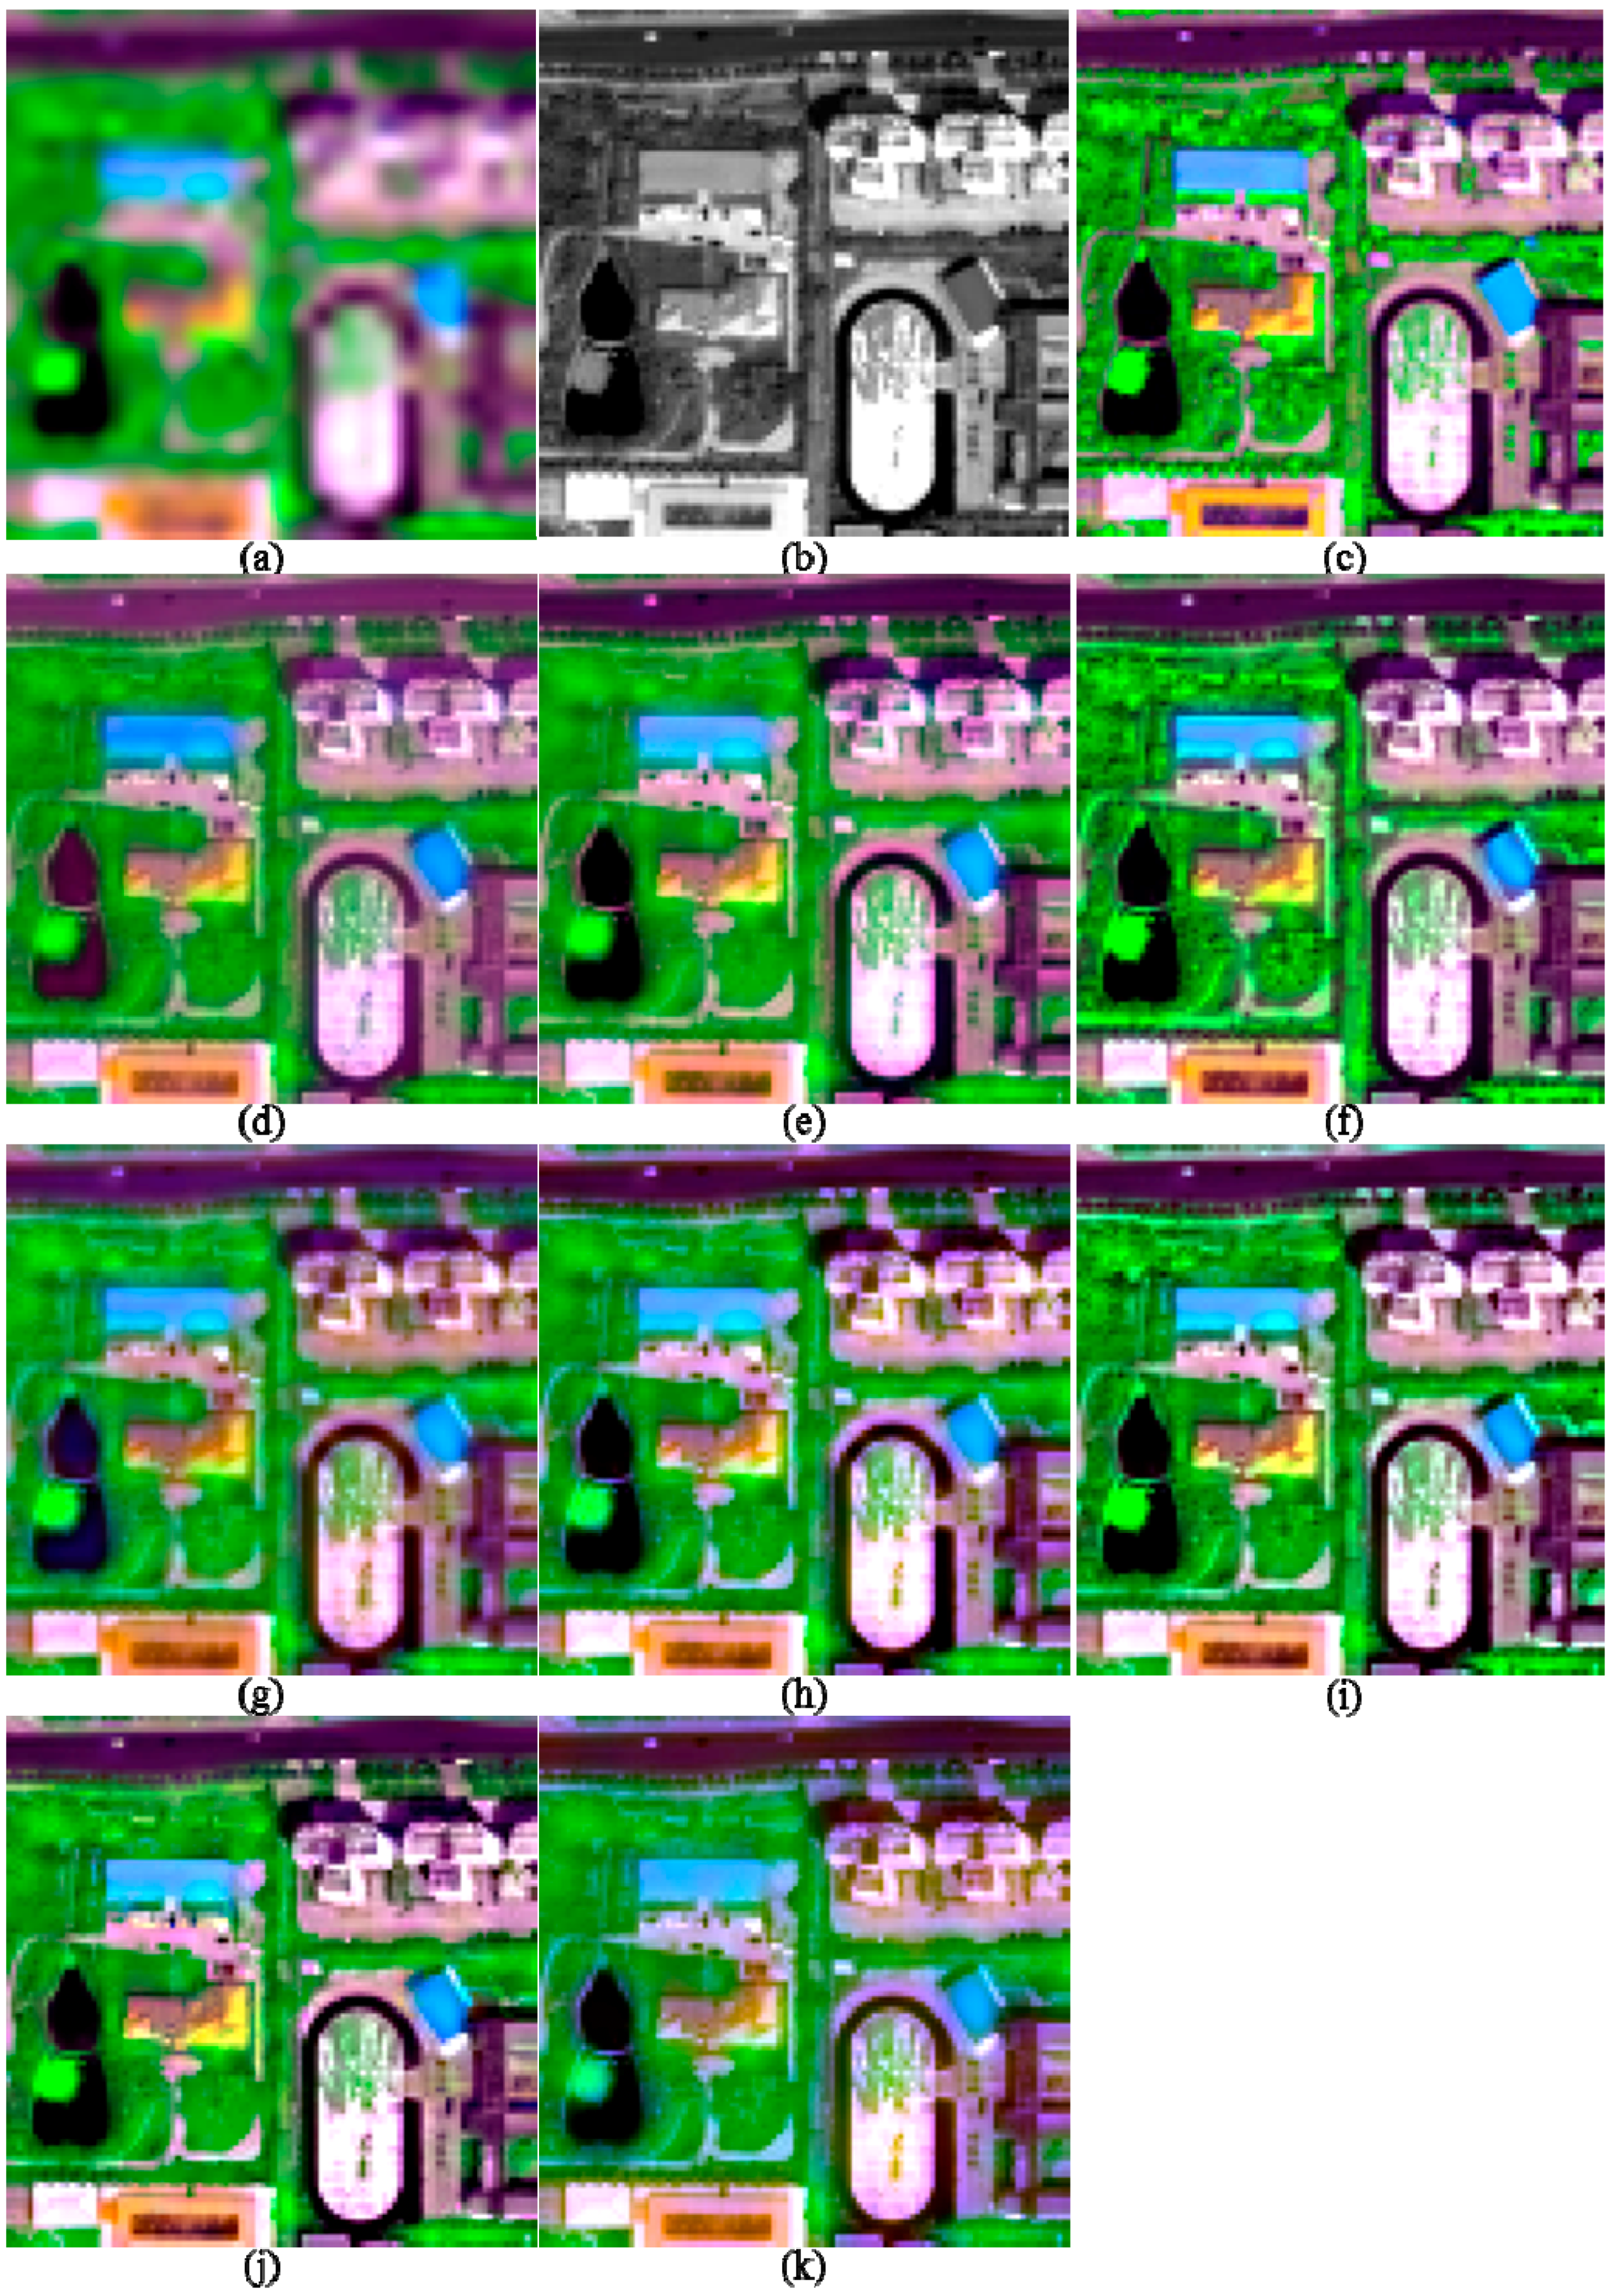
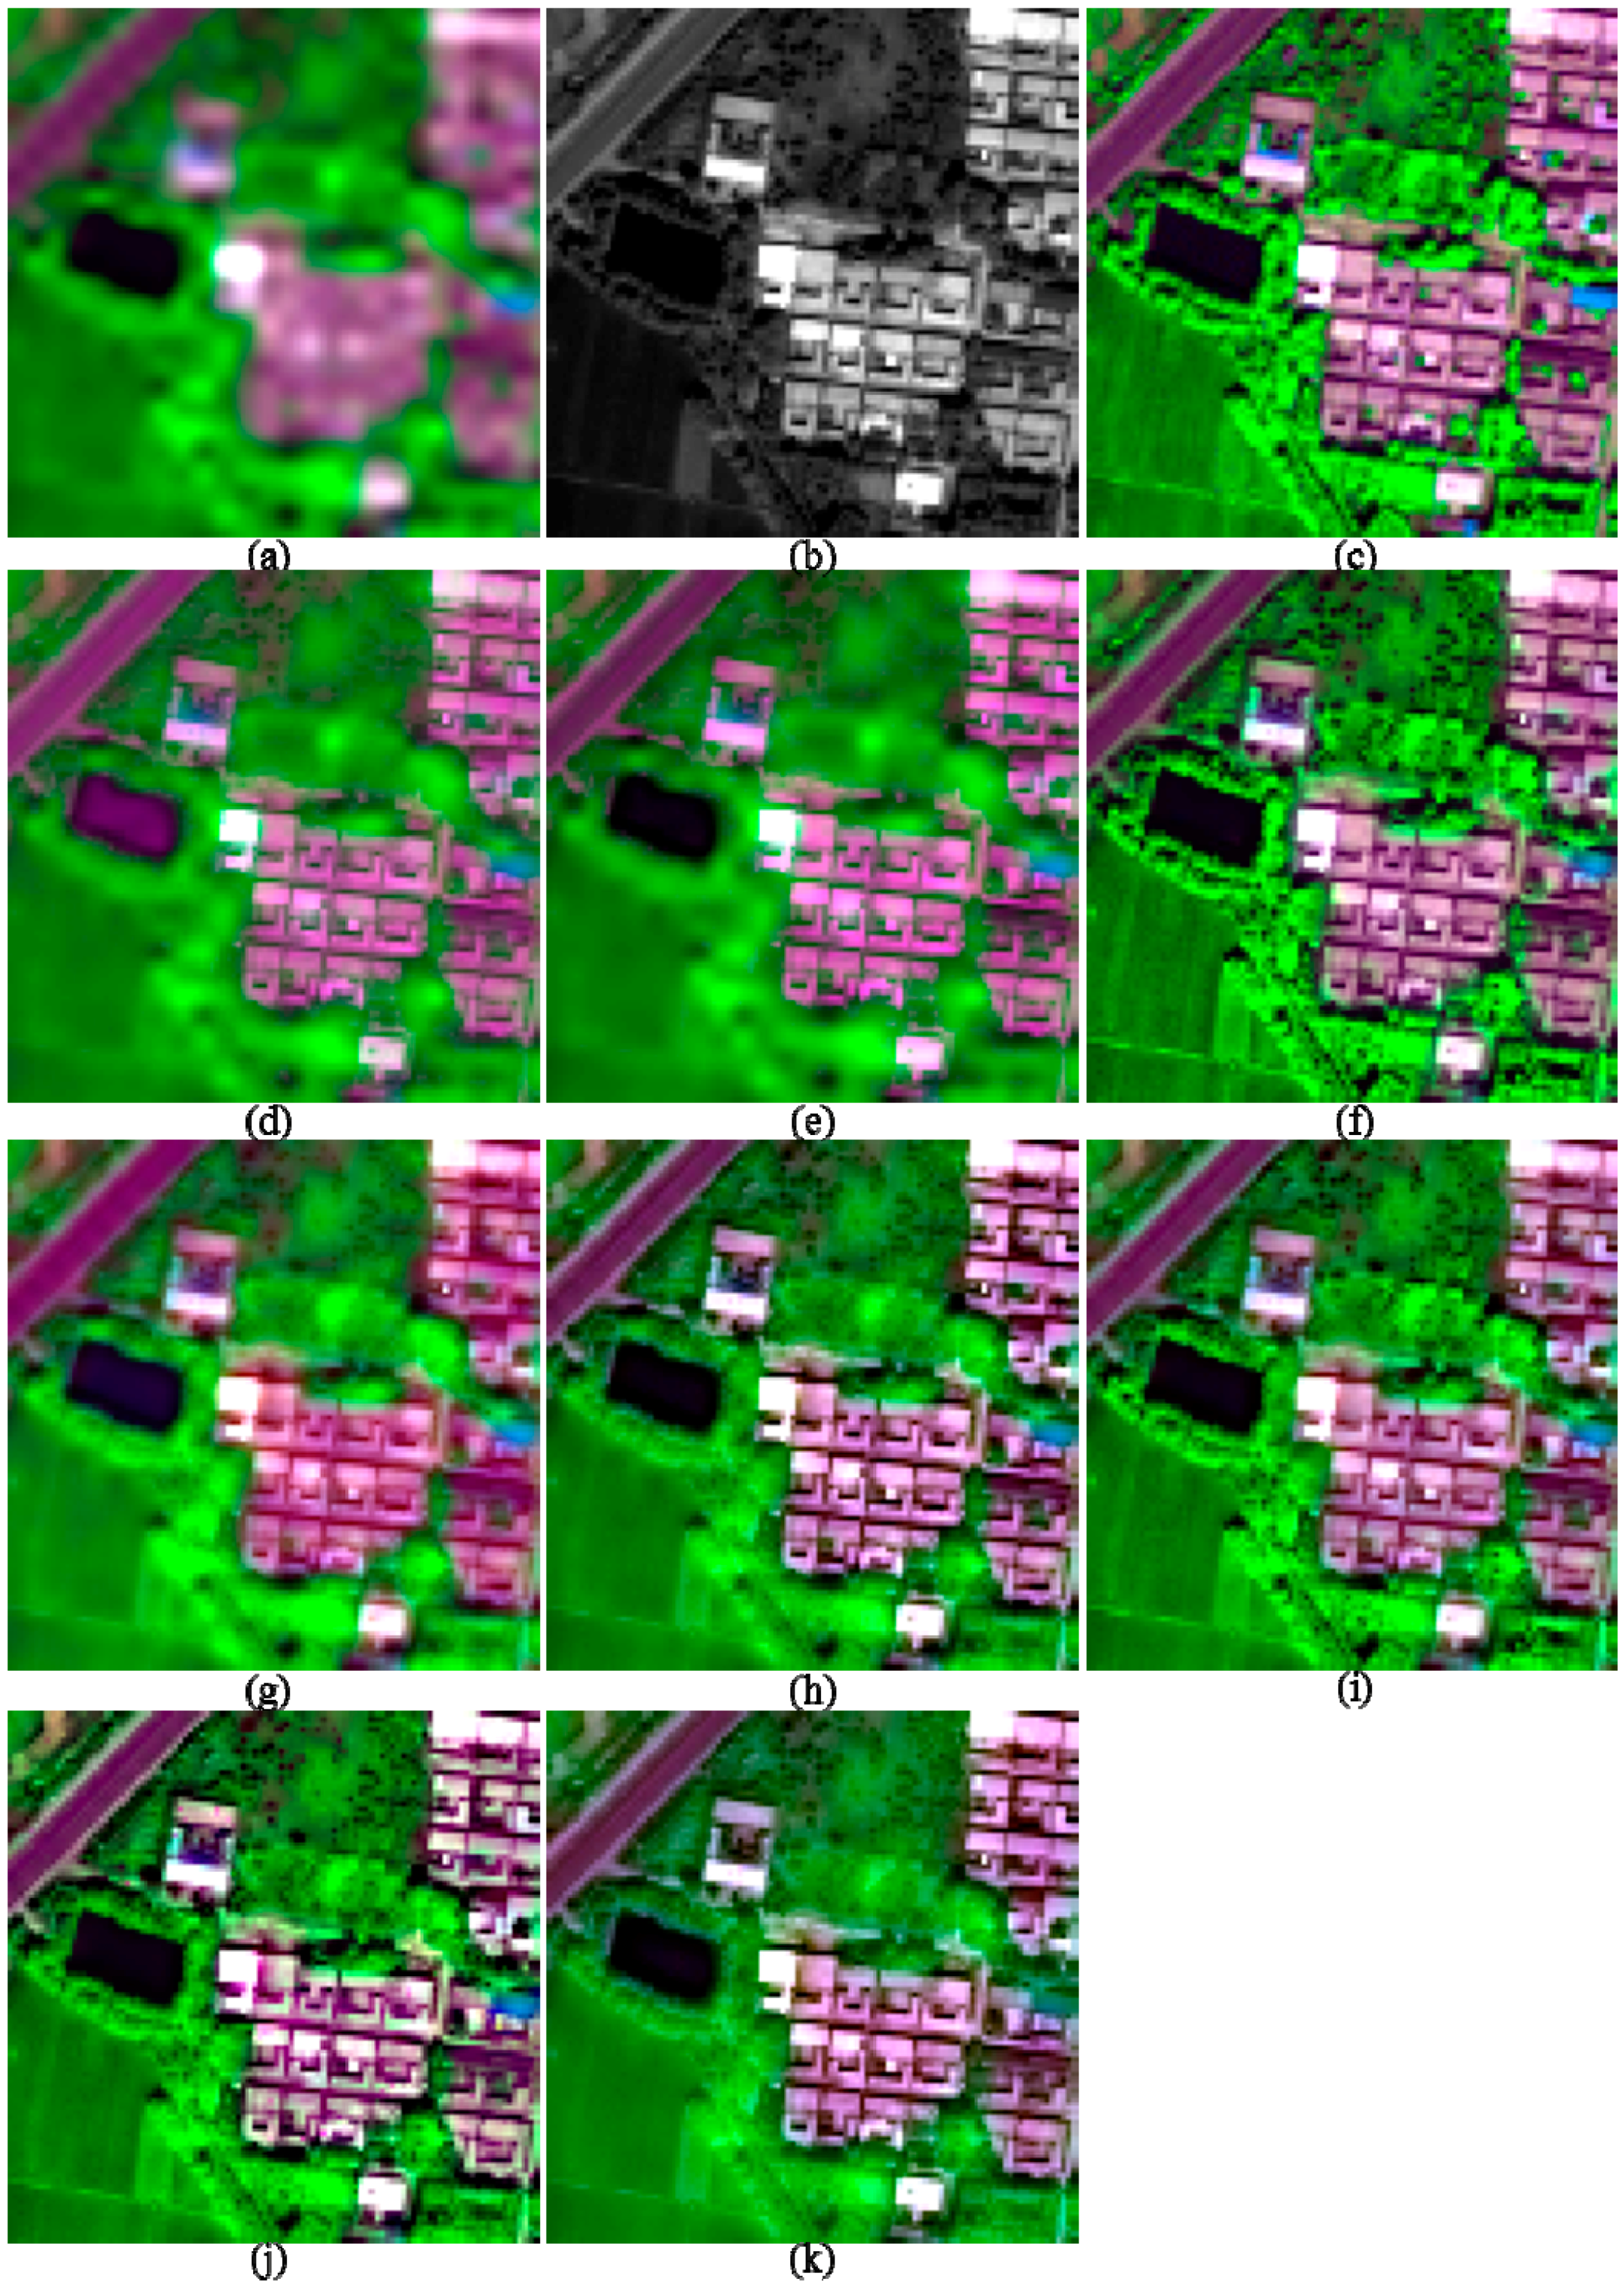
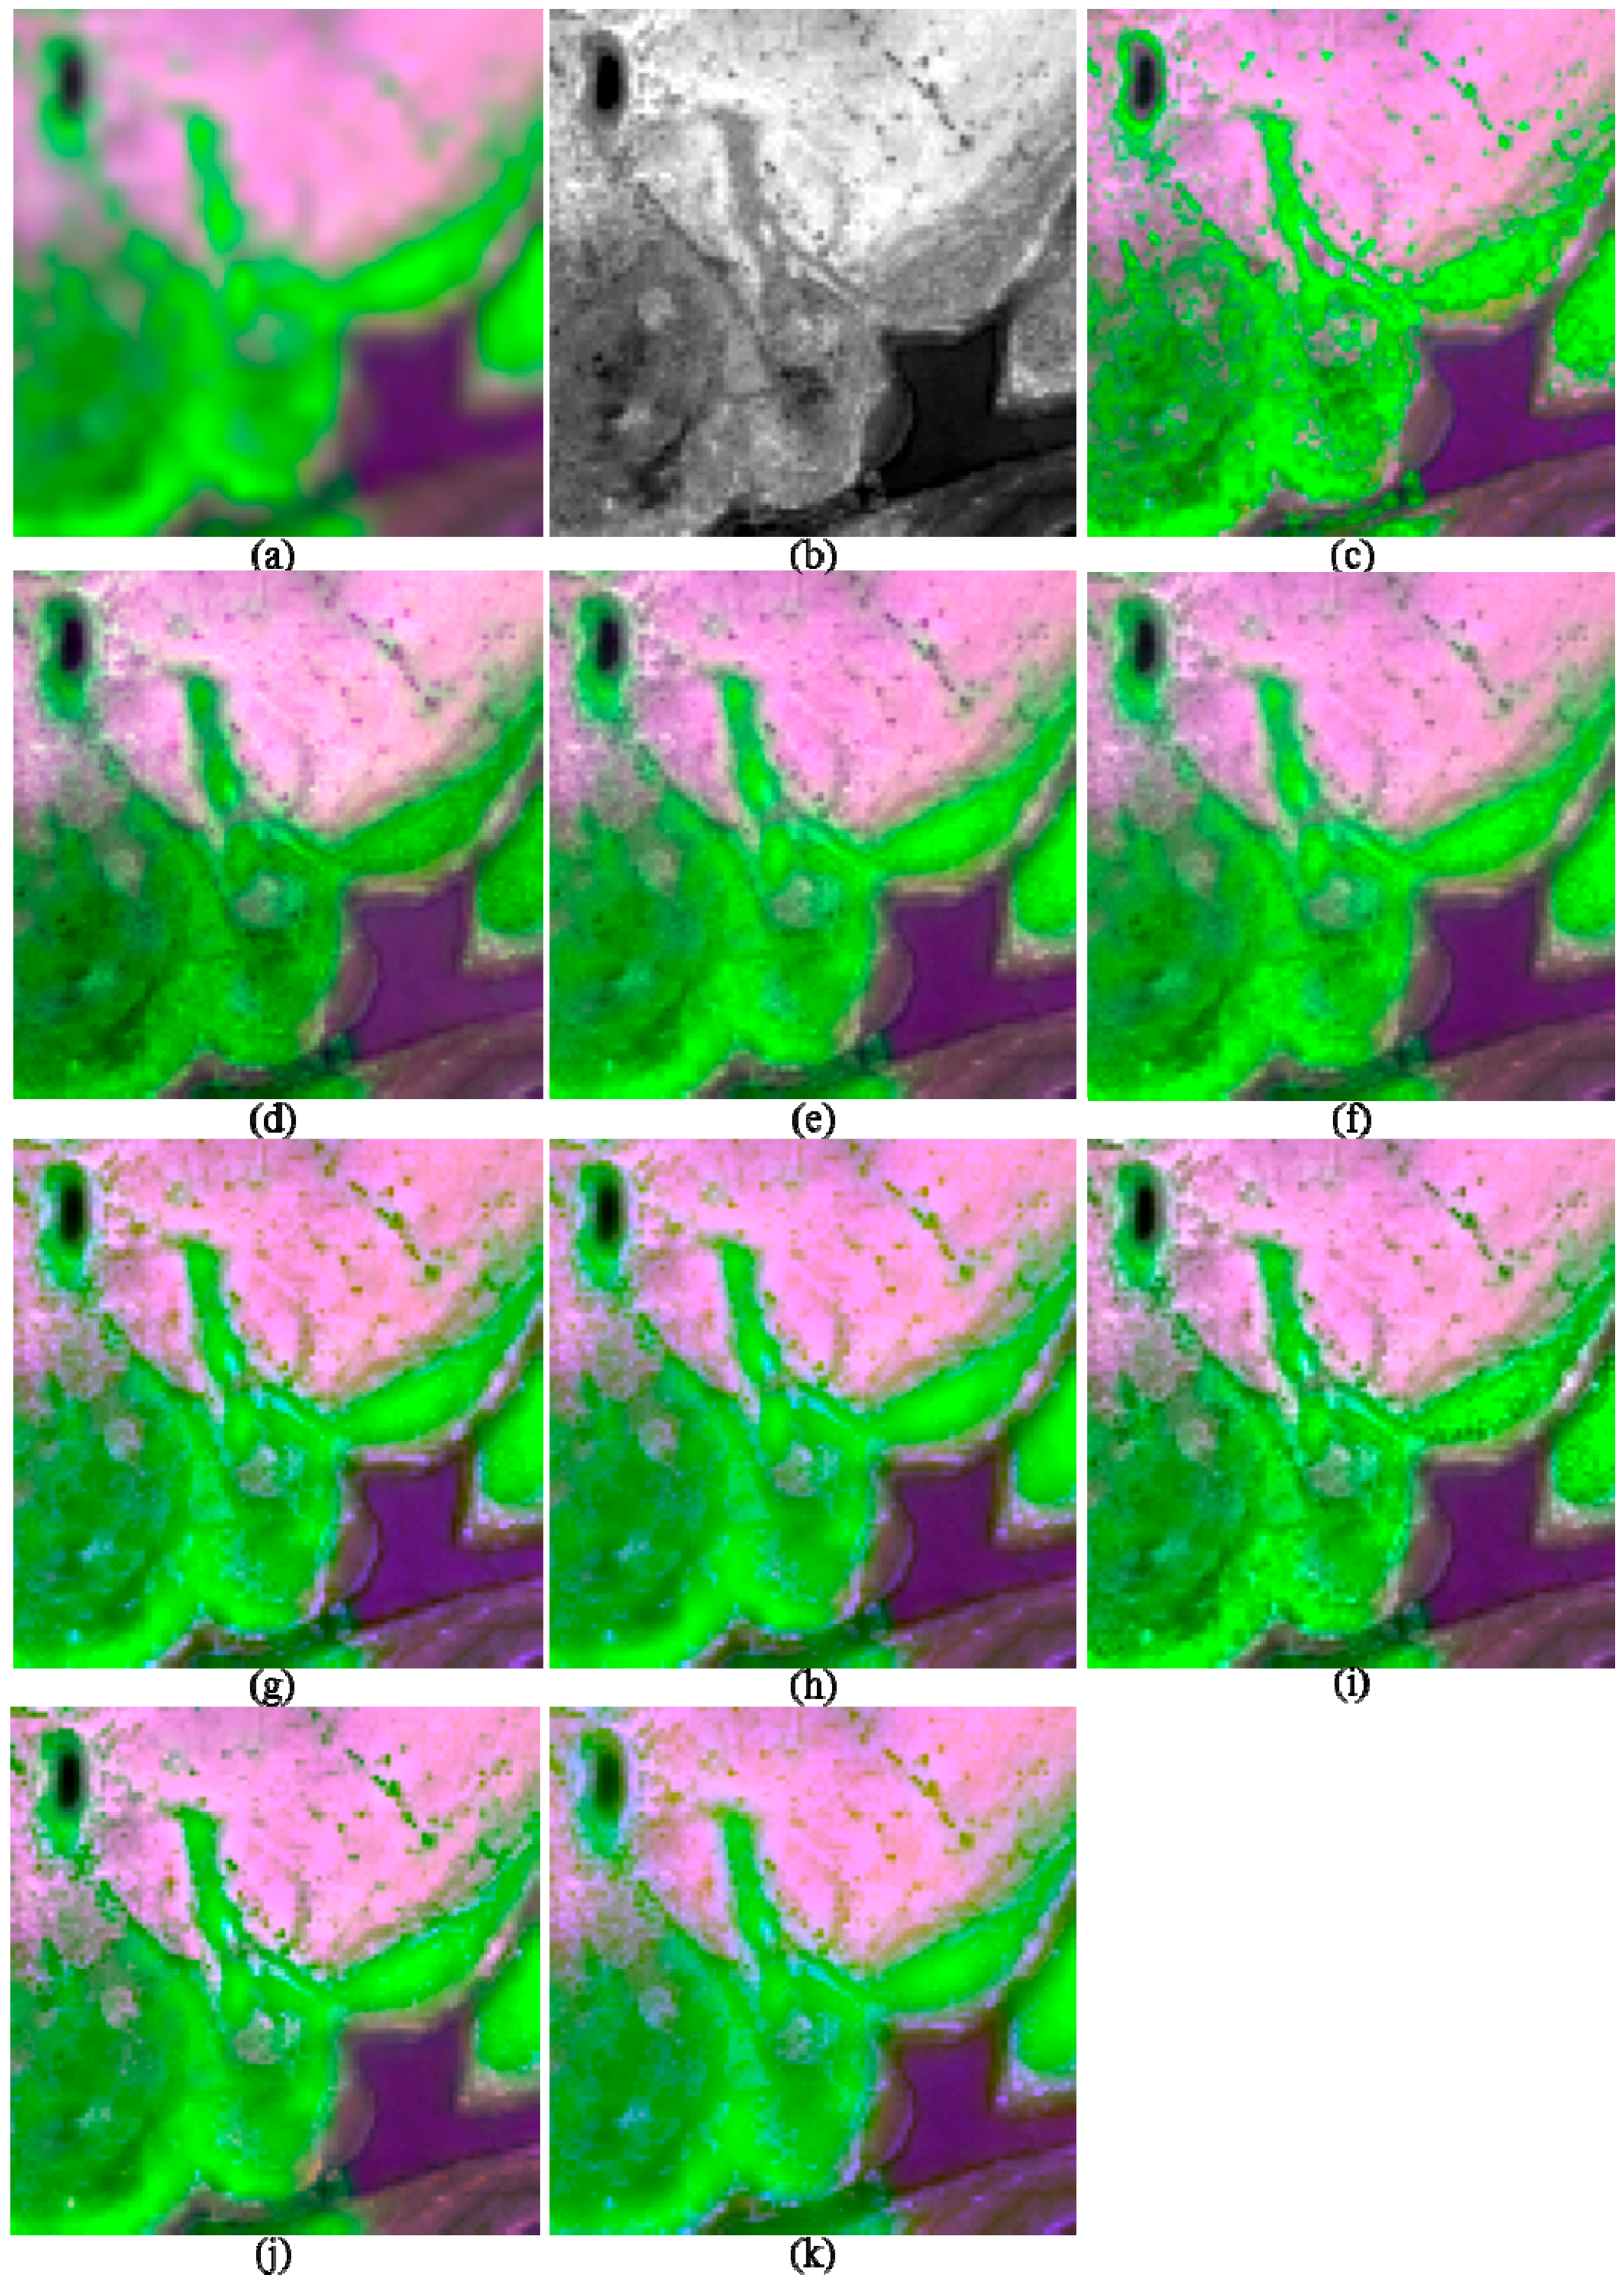
Generally, the HR, GSA, GLP_ESDM, and GLP_ECBD methods give better performances than the other methods, whereas the NSCT and HCS methods offer the poorest performances, for most of the test images, in terms of quality indexes and visual inspection. The four methods also give slightly different performances for images including different image objects. For example, the HR, GSA, GLP_ESDM methods give the best performances for the two urban images, whereas the GLP_ECBD provides the best performances for the two rural images. However, the fusion products of the four methods offer good visual quality for most images. Consequently, the HR, GSA, GLP_ESDM, and GLP_ECBD methods are good choices if the fused WV-2 images will be used for image interpretation.
The results of the assessments using the three information indices show that the rank of the selected eight fusion methods in terms of CMBI is a little similar with those in terms of Q8 and SCC. This may indicate that the assessment using only the quality indexes and visual inspection is sufficient for selecting a best fusion method for producing fused urban WV-2 images used for image interpretation and applications related to urban buildings. The order of eight methods for in terms of CNDVI is similar with that in terms of CNDWI. This is due to the fact that both CNDVI and CNDWI measure the differences between the inter-band relationships of a fused image and those of the corresponding reference MS image. In contrast, the orders of the eight methods in terms of CNDVI and CNDWI are significant different from those in terms of Q8 and SCC. This indicates that a fusion method offering the best performance for a certain image in terms of quality indexes and visual inspection does not always provide the highest CNDVI and CNDWI values. Generally, the GLP_ESDM method outperforms the other methods for I1, I2 and I5, whereas the GLP_ECBD method provides the best performances for I3, I4 and I6, in terms of CNDVI and CNDWI, as well as quality indexes and visual inspection. This indicates that the GLP_ESDM is the best choice for images with similar objects with I1, I2 and I5, whereas the GLP_ECBD is the best choice for images with similar objects with I3, I4 and I6, for producing fusion products used for applications related to vegetation or water-bodies. In addition, the fusion products show limited improvements in terms of CNDVI and CNDWI. This indicates that it is hard for the fusion products to preserve the NDVI and NDWI information obtained from the corresponding up-sampled MS images. Consequently, it is necessary to evaluate fusion products using information indices (i.e., NDVI and NDWI) if fused WV-2 images will be used for applications related to vegetation and water-bodies.
4.2. Effects for Different Spectral Ranges between the PAN and MS Bands
A noticeable point for the WV-2 is that the spectral range of the PAN band covers limited portion of the spectral ranges of the C, NIR1 and NIR2 bands. This results in relative low correlation coefficients between these bands and the PAN band. It is interesting to see the performances of the selected pansharpening methods on the two NIR bands and the C band of WV-2. In order to assess the spectral distortion of each fused band, the CC value between each fused band and the corresponding reference band was calculated for each fusion product. The CC values for the fusion products of I1, I3, I5 and I6 are shown in
Table 6. The CC values of I2 and I4 are not presented because they are similar with those of I1 and I3, respectively.
It can be seen from
Table 6 that the CC values of the two NIR bands are significantly lower than those of the other bands for all the fusion products, indicating that the fused NIR bands show more spectral distortions than the other bands. This is caused by the relative low correlation coefficients between the two NIR bands and the PAN band. This is also revealed by previous studies, the higher the correlation between the PAN band and each MS band, the better the success of fusion [
31]. Generally, the four CS methods offer higher CC values for the two NIR bands than the four MRA methods for most of the test images. This is consistent with the result of visual inspection of these fusion products. However, the two GLP-based methods, which provide good performances in terms of NDVI and NDWI information preservation, offer relative low CC values for the fused NIR1 band, due to the low CC between the PAN and the NIR1 band. This proves again that it is necessary to evaluate fusion products using information indices (i.e., NDVI and NDWI) if fused WV-2 images will be used for applications related to vegetation and water-bodies.
4.3. How to Extend the Selected Pansharpening Methods to Other HSR Satellite Images
As introduced in the previous sections, the HR, GSA, GLP_ESDM, and GLP_ECBD methods are good choices for producing fused WV-2 images used for image interpretation and applications related to urban buildings. The two GLP-based methods outperform other methods for generating fused WV-2 images used for applications related to vegetation and water-bodies. It is interesting for the readers that whether these methods give similar performances to the sensors having a similar PAN spectral range with WV-2, such as GeoEye-1, and WorldView-3/4.
Actually, the selected pansharpening methods can be categorized into two groups, according to the approaches employed to generate the synthetic PAN band , which mainly contains the low-frequency component of the original PAN band. For the first group, is generated by applying filters to the original PAN band, or by up-sampling the degraded version of the original PAN band. In contrast, for the second group, the intensity image , which can be seen as another approach for generating the synthetic PAN band , is generated using the weighted combination of the LSR MS bands. The methods belong to the first group include HR, ATWT, NSCT and the two GLP-based methods, whereas the methods belong to the second group include GS, GSA and HCS methods. For the first group, the low-frequency component of has relative low correlations with the C, NIR1 and NIR2 bands, but has relative high correlations with the other spectral bands. This result in the fact that the details of the PAN band have relative high correlations with the B, G, Y, R and RE bands, but relative low correlations with the C, NIR1 and NIR2 bands. This may result in the fact that a large amount of spatial details are injected into the B, G, Y, R and RE bands, but only a small amount of the spatial details are injected into the C, NIR1 and NIR2 bands, especial for the case the injection gains are determined considering the relationship between each MS band and the PAN band. For the second group, the low-frequency component of the intensity image is related or partly related to the C, NIR1 and NIR2 bands. This may result in the fact that the low-frequency component of the C, NIR1 and NIR2 bands may be injected into the B, G, Y, R and RE bands, and hence may lead to spectral distortions of these bands. An exception occurs for GSA, since the intensity image employed the GSA method have low CC with the C, NIR1 and NIR2 bands, due to the weights wi obtained using Equation (5) are very low for these bands.
According to the introduction about the algorithms of the selected methods, different injection gains
are employed by these methods. The GS and GSA methods use a band-dependent model considering the relationship between each MS band and the PAN band. The GSA method outperform the GS method due to the intensity image
employed the former have low CC values with the C, NIR1 and NIR2 bands. It can be seen from
Table 6 that the CC values for the B, G, Y, R, and RE bands of the GSA-fused images are significantly higher than those of the GS-fused image. The HR method uses the SDM model, which is also band-dependent. The ATWT method employs a simple additive injection model with weights for each band equal to 1, whereas the two GLP-based methods use the ESDM and ECBD models, respectively. Among these models, only the ESDM and ECBD models consider the local dissimilarity between the MS and PAN bands. According to the experimental results, the two GLP-based methods give good performances in terms of NDVI and NDWI information preservation. This may due to the fact that only the ESDM and ECBD models consider the local dissimilarity between the MS and PAN bands. It is also demonstrated by previous studies that local dissimilarity between the MS and PAN bands should be considered by pansharpening methods to reduce spectral distortions.
As a result of the above analyses about the algorithms of the selected pansharpening methods, we can obtain the following conclusions. Firstly, for the spectral bands with relative high correlations with the PAN band, the synthetized PAN band should be obtained using the original PAN band and the injection gains should considering the relationship between each MS band and the PAN band. Secondly, for the spectral bands with relative low correlations with the PAN band, further experiments should be designed to evaluate which approach is better for generating the synthetized PAN band. However, there is no doubting that local dissimilarity between the MS and PAN bands should be considered for the fusion of these bands, i.e., the NIR band, especially for the case that the fused images will be used in applications related to vegetation and water-bodies.
According to the analysis, we can conclude that the GSA, HR, GLP_ESDM, and GLP_ECBD methods can also provide good performances for similar sensors, such as GeoEye-1, WorldView-3, WorldView-4, for the cases that the fusion products will be used in image interpretation or urban buildings. Actually, it is proved by previous studies that the performances of these newly proposed methods are sensor independent [
30]. However, for the case that the fusion products will be used in applications related to vegetation or water-bodies, the GLP-ESDM and GLP_ECBD methods or other fusion methods consider local dissimilarity between the MS and PAN bands are better choices.


