Determination of Odour Interactions of Three-Component Gas Mixtures Using an Electronic Nose


Abstract
1. Introduction
- odour intensity, which would be caused by the mixture components if they were present separately (perception models),
- concentrations of mixture components and their psychophysical characteristics (psychophysical models).
2. Materials and Methods
2.1. Types of Three-Component Mixtures and Their Preparation
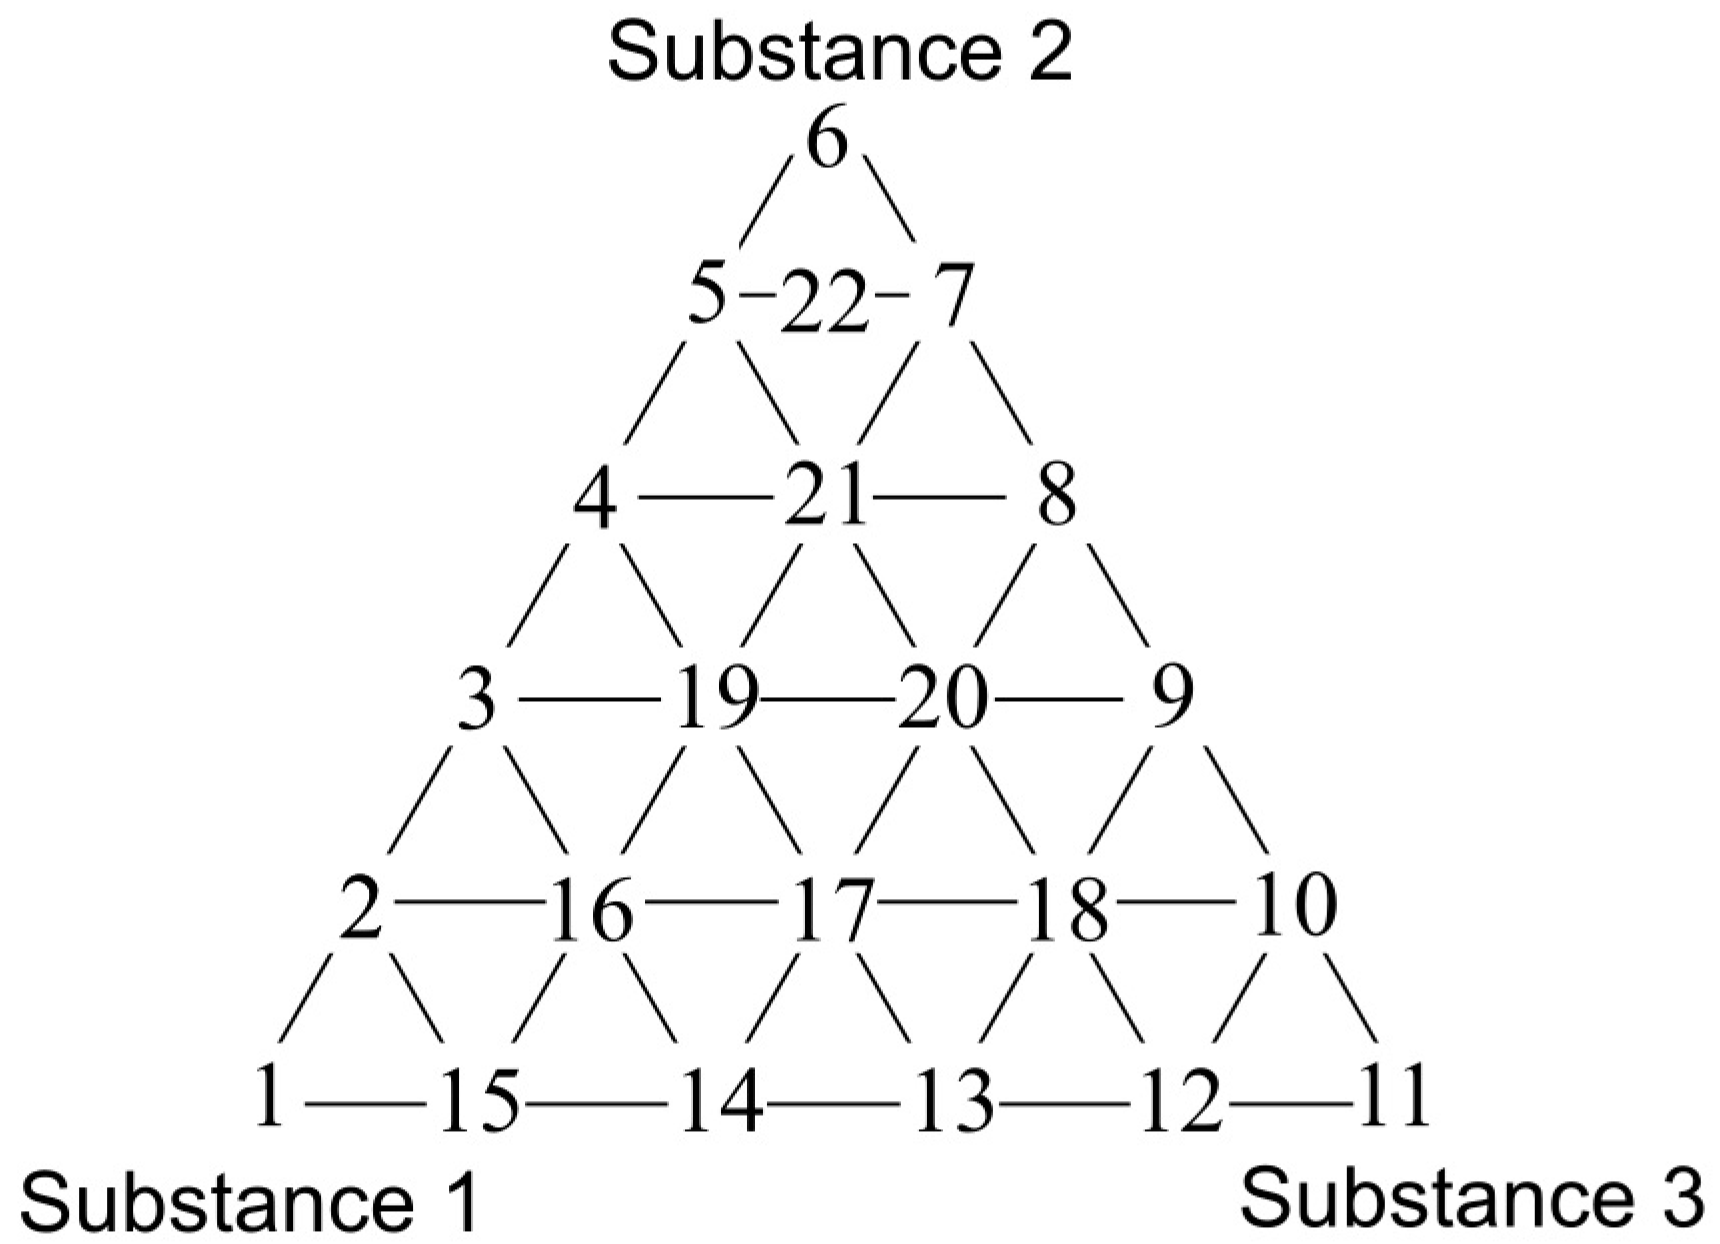
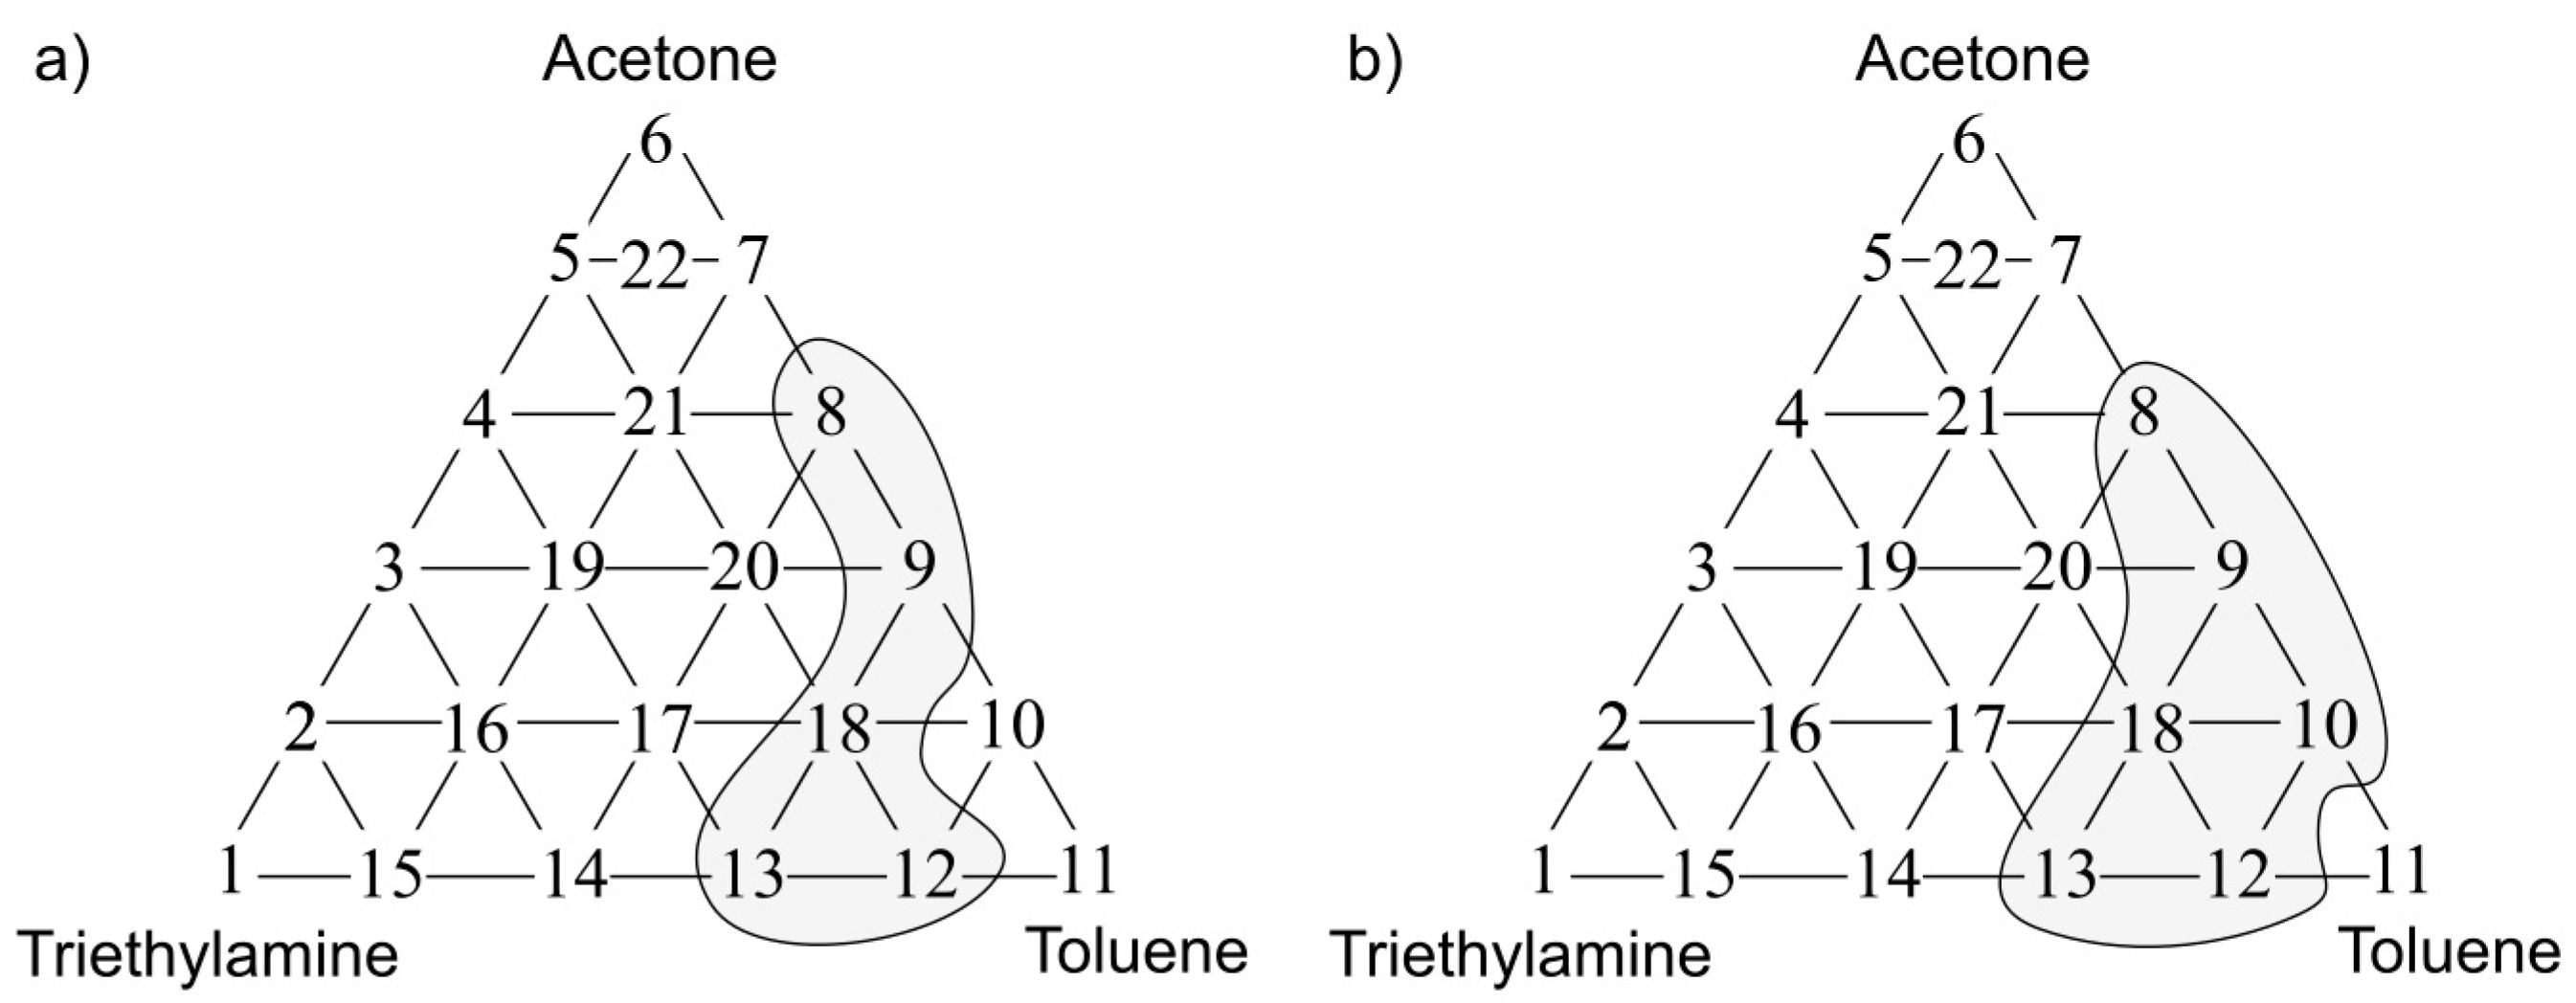
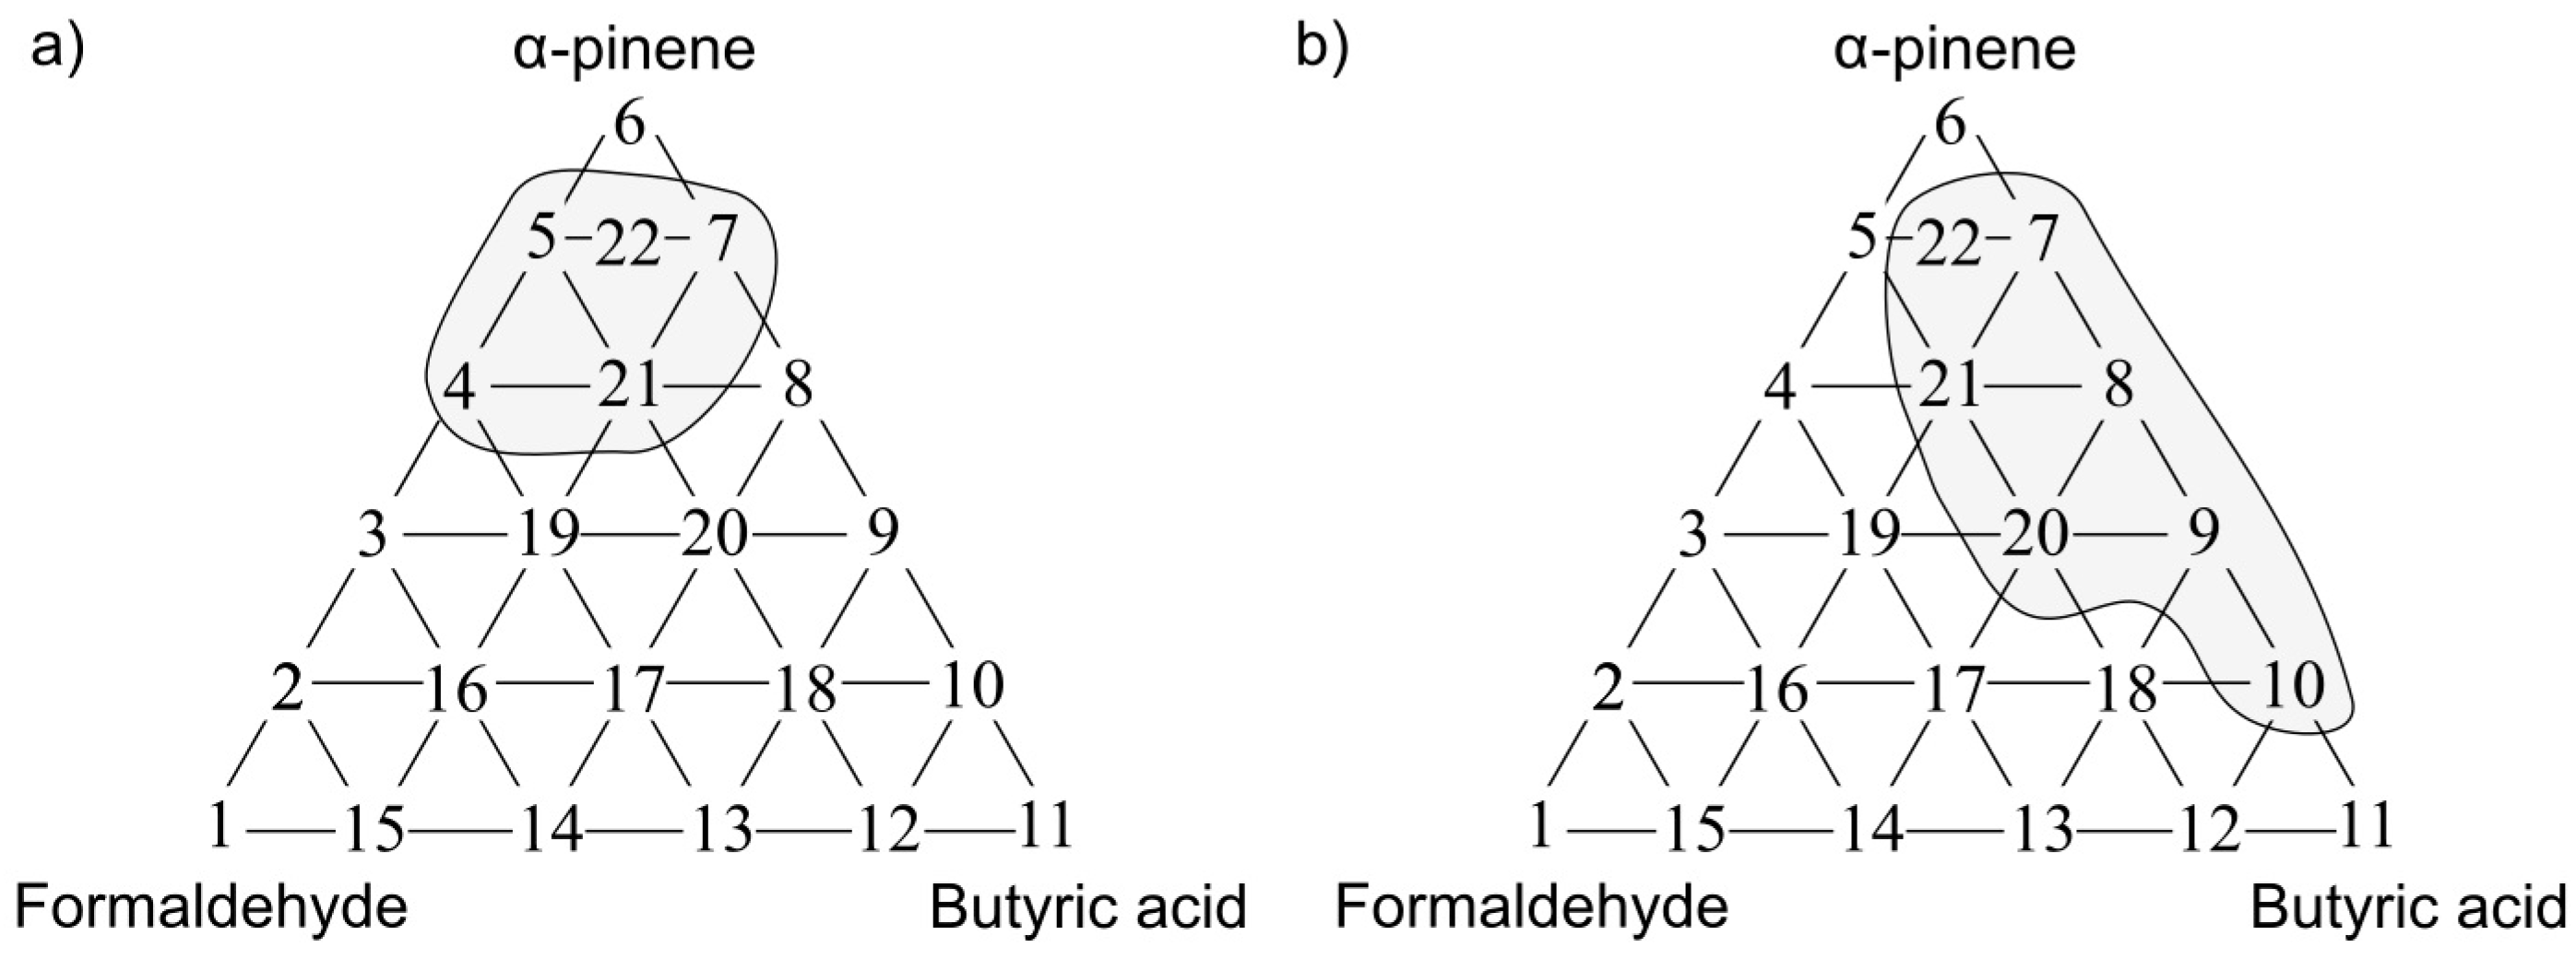
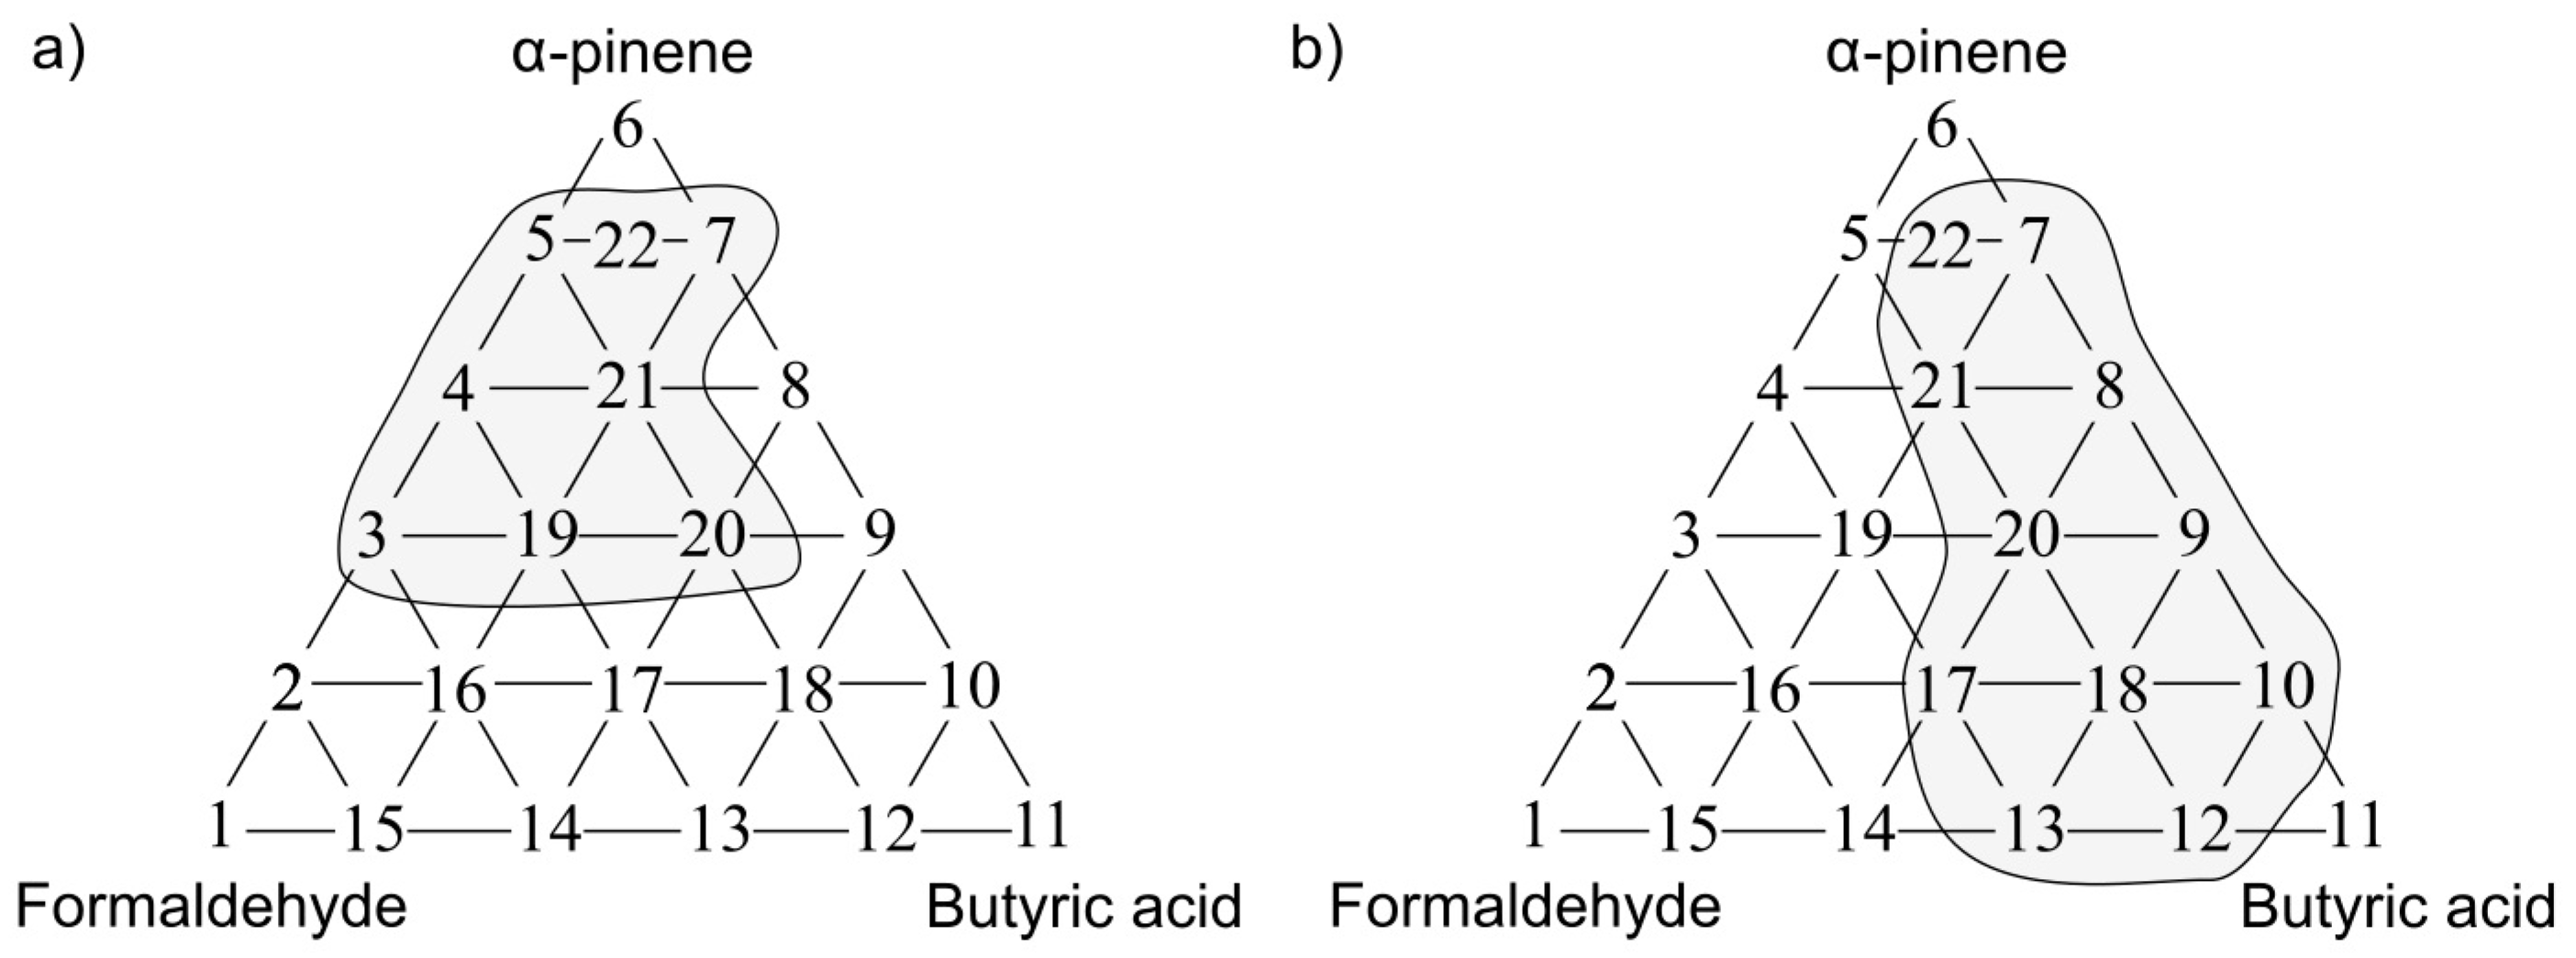
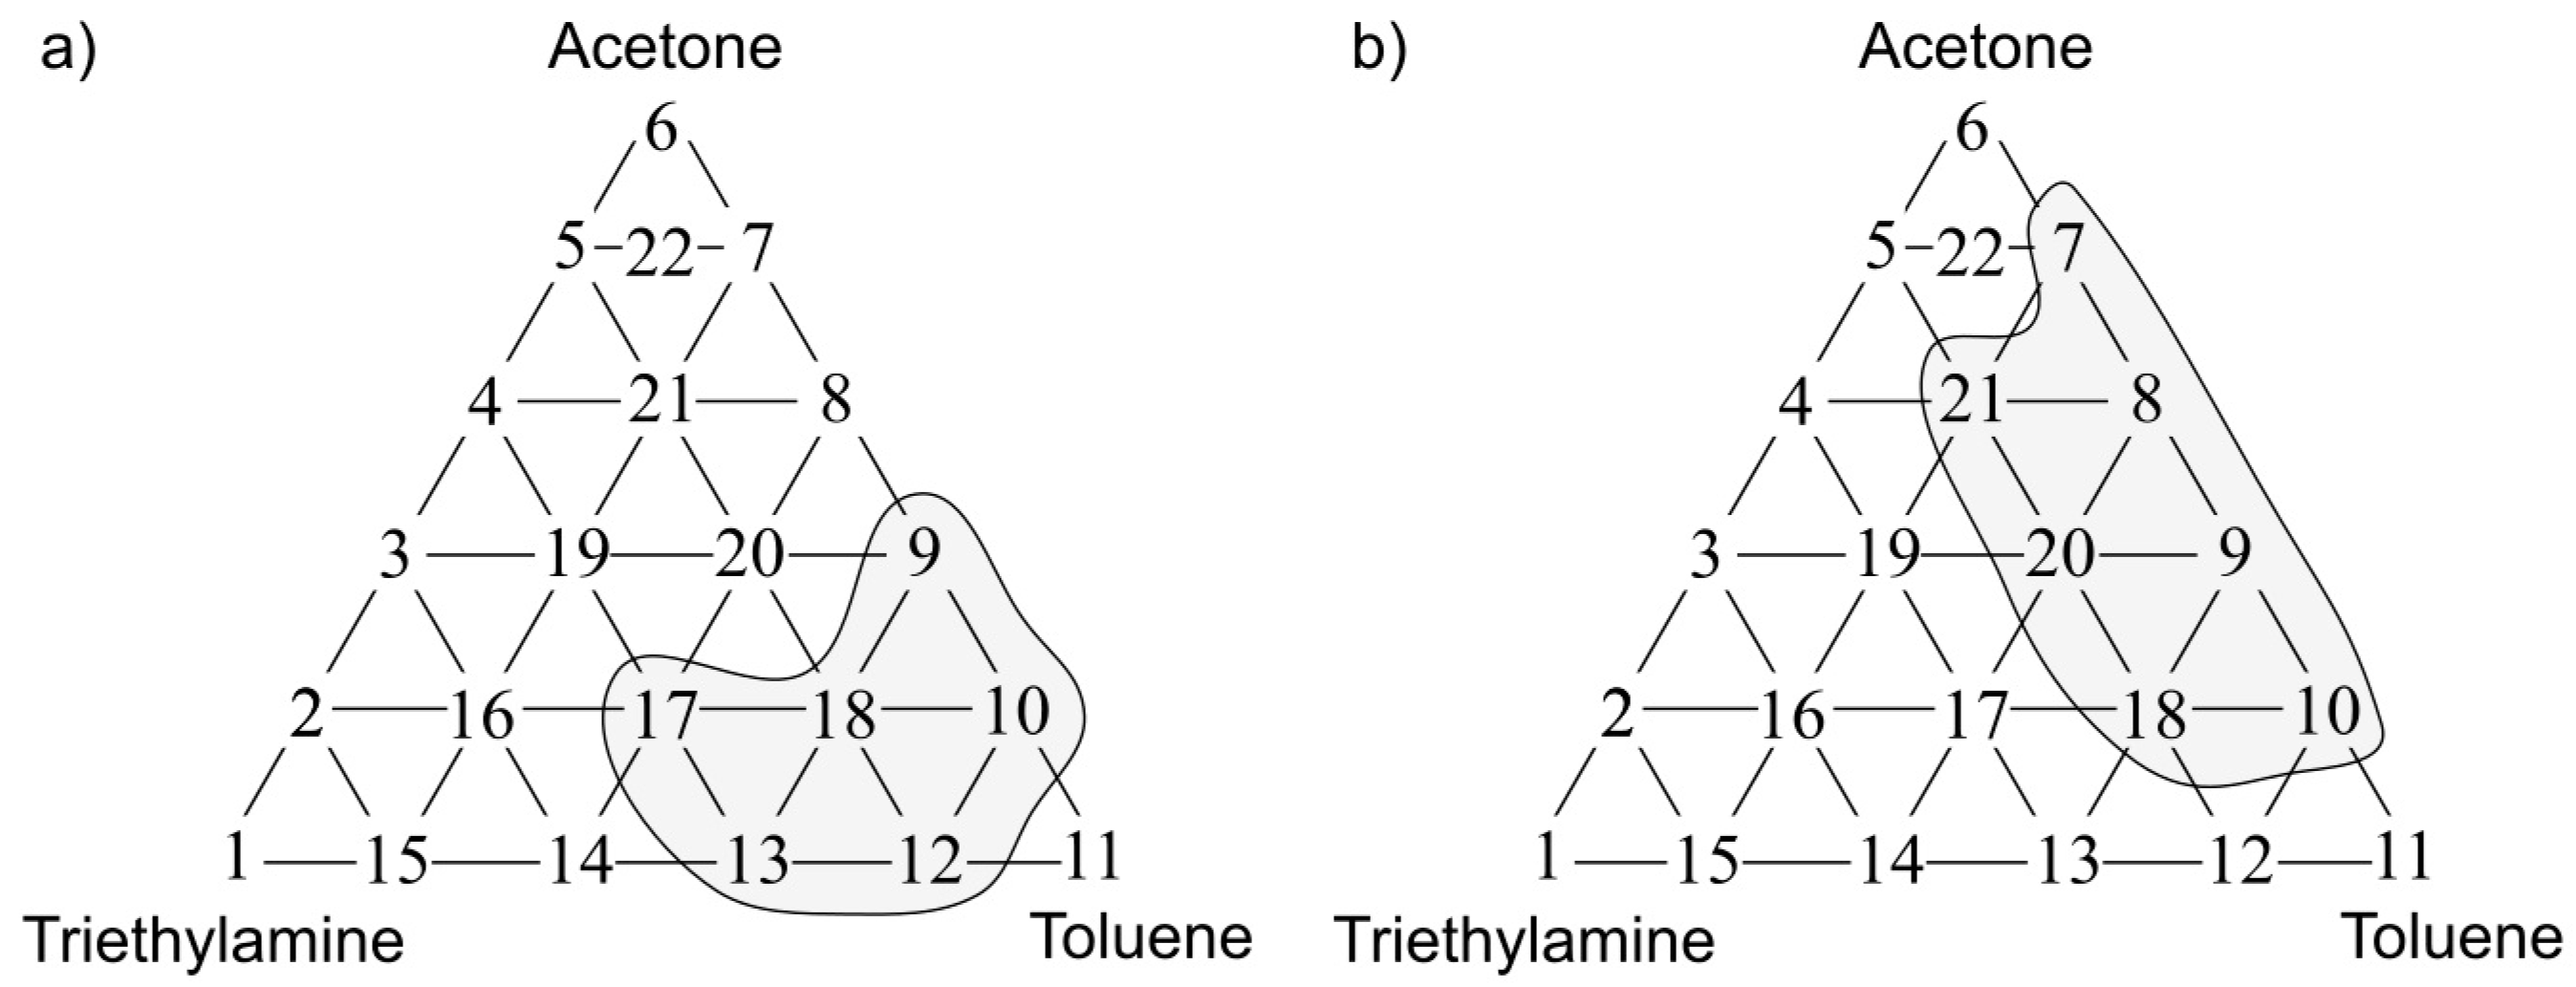
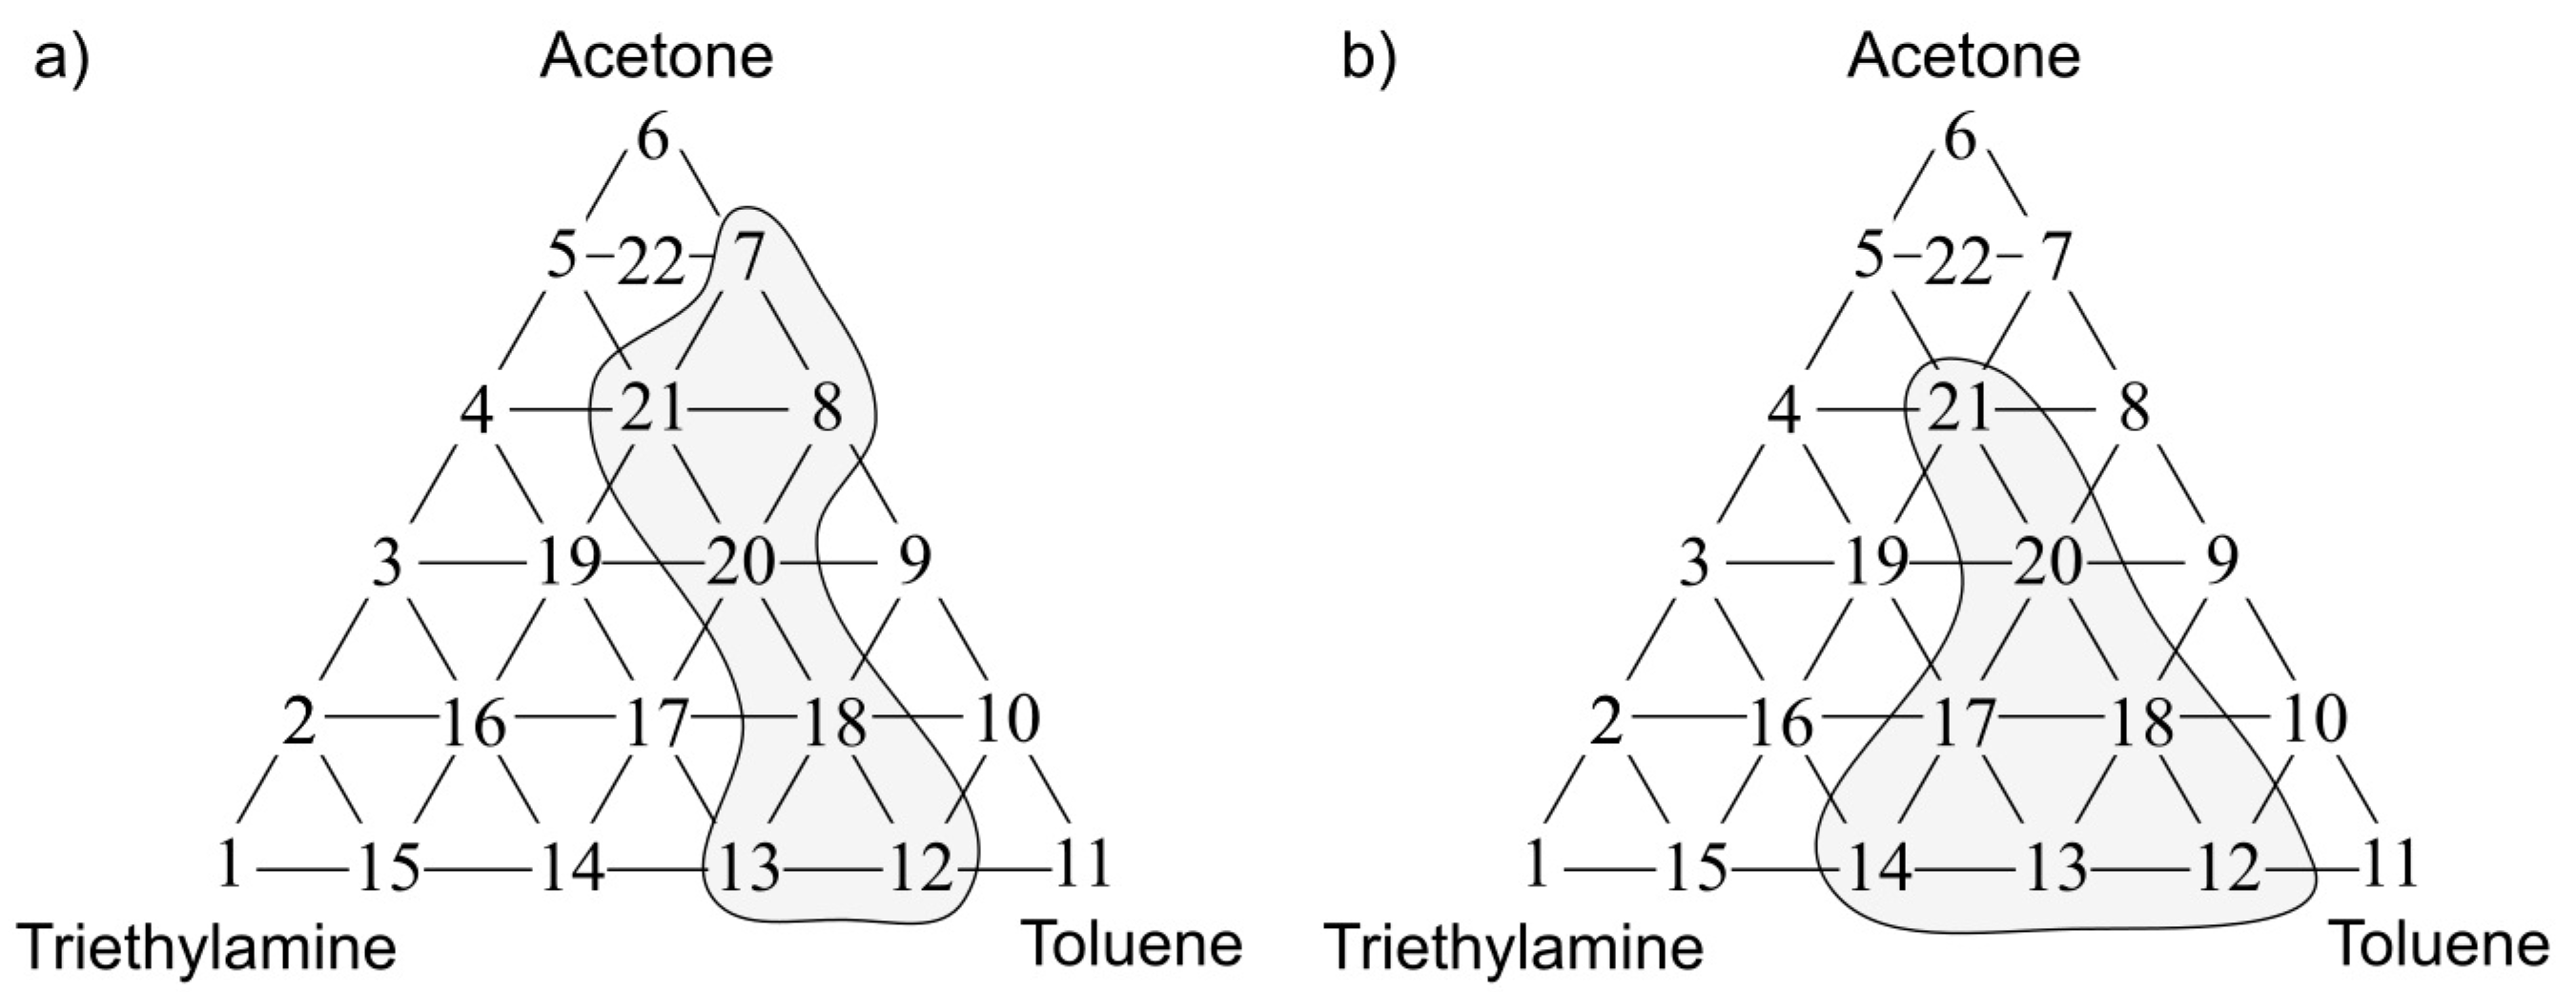
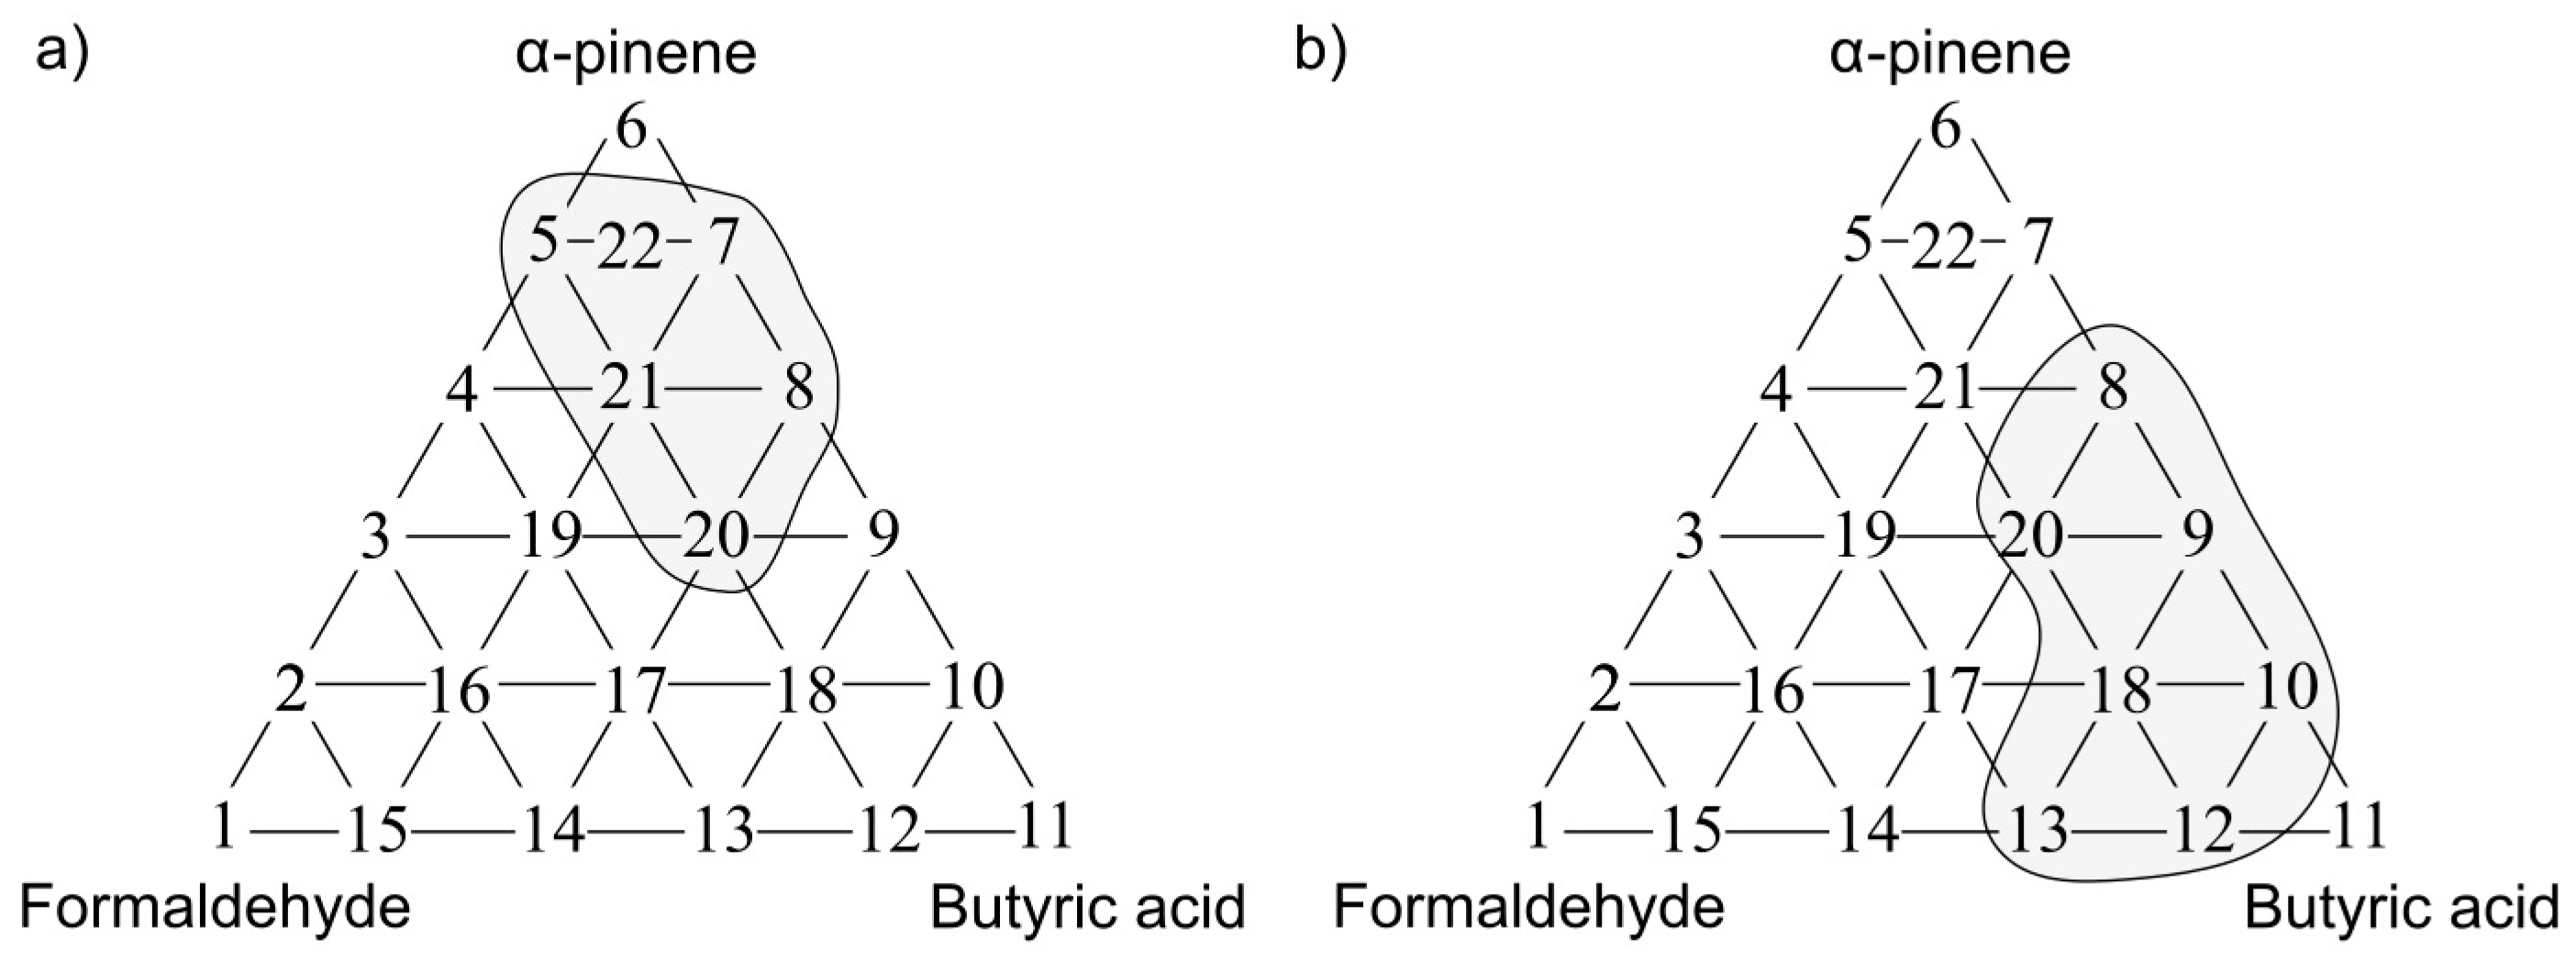
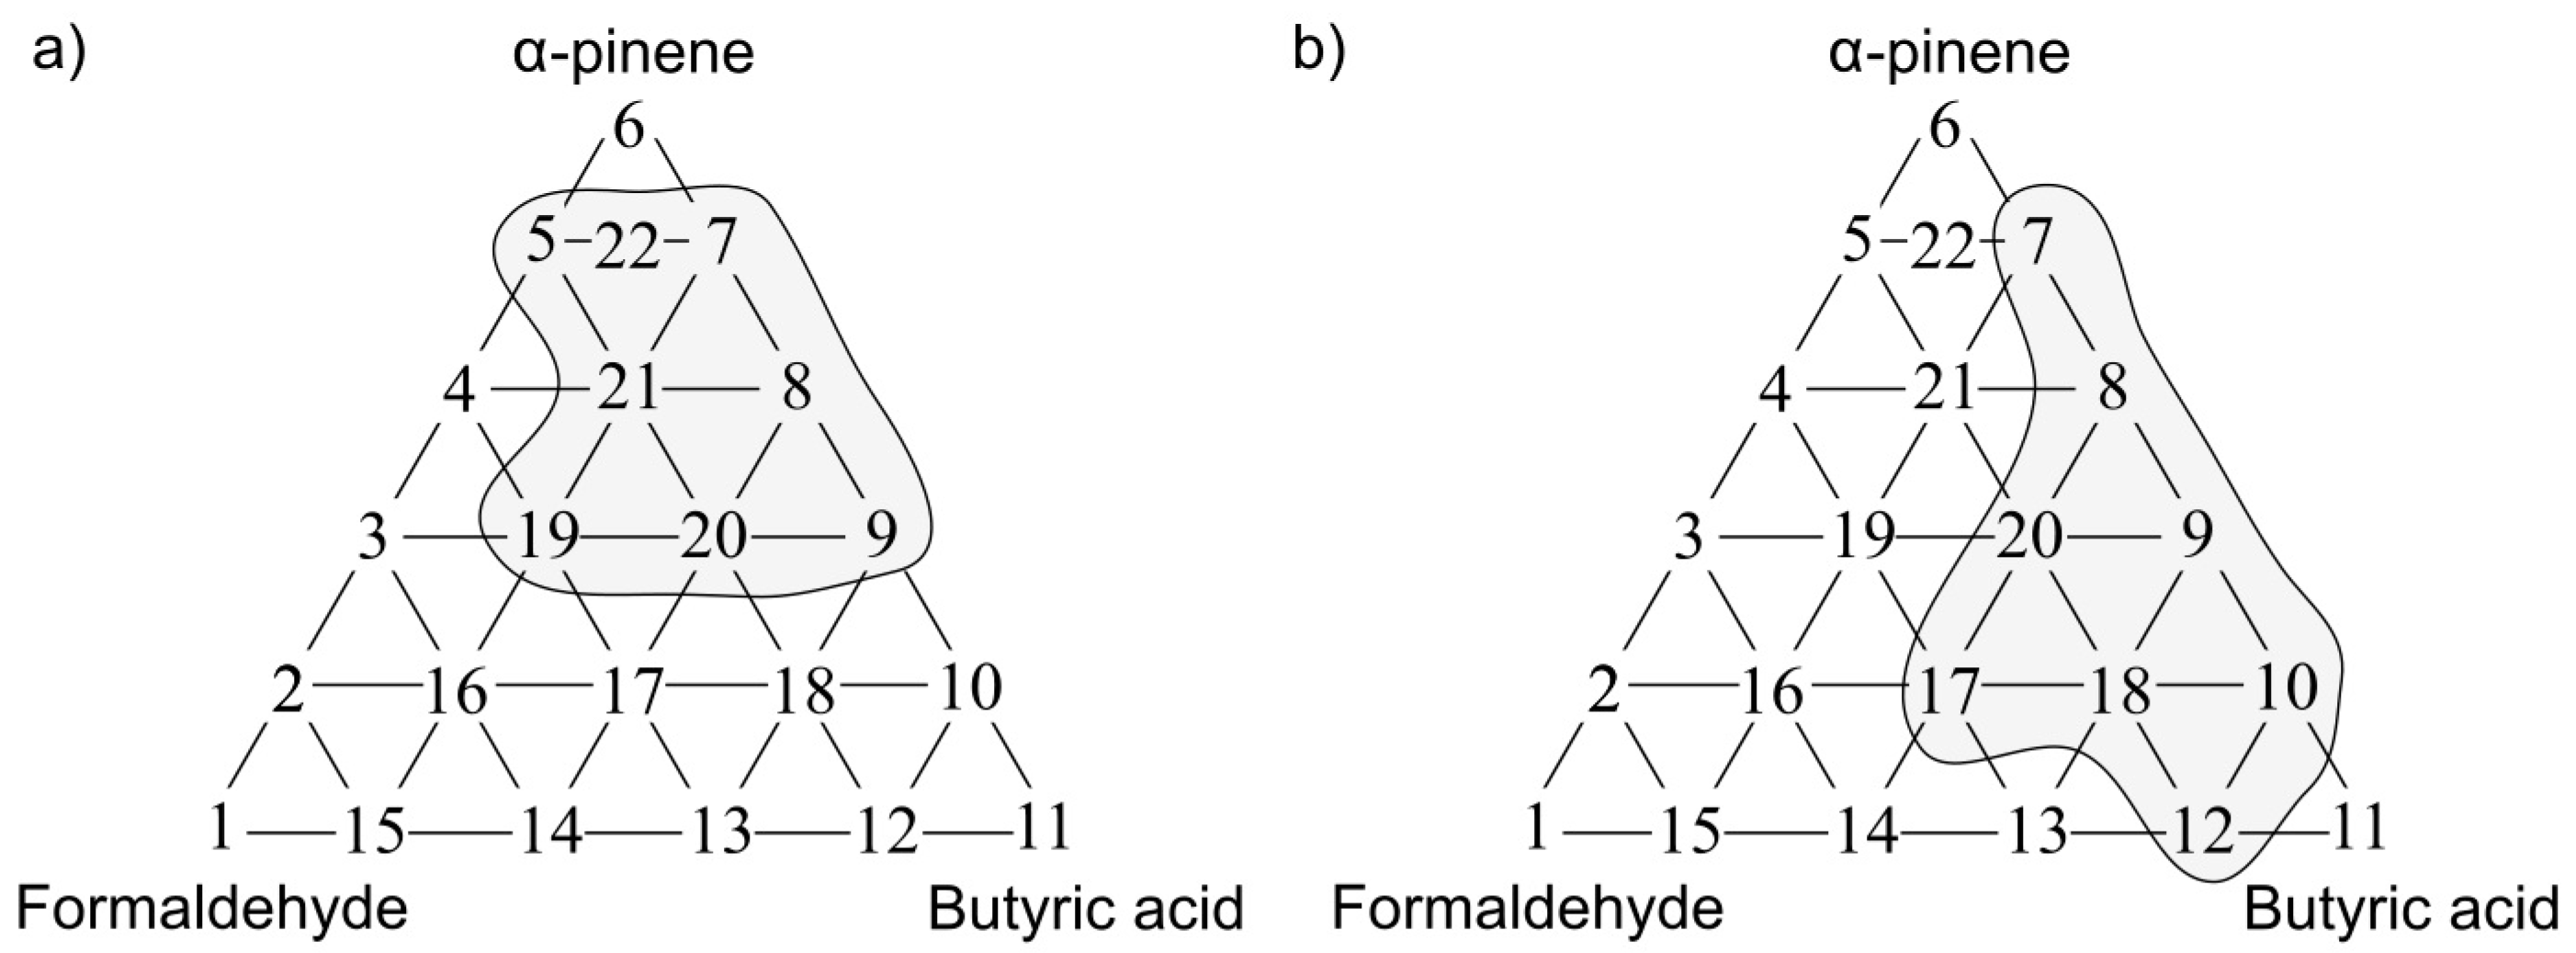
2.2. Olfactory Triangles
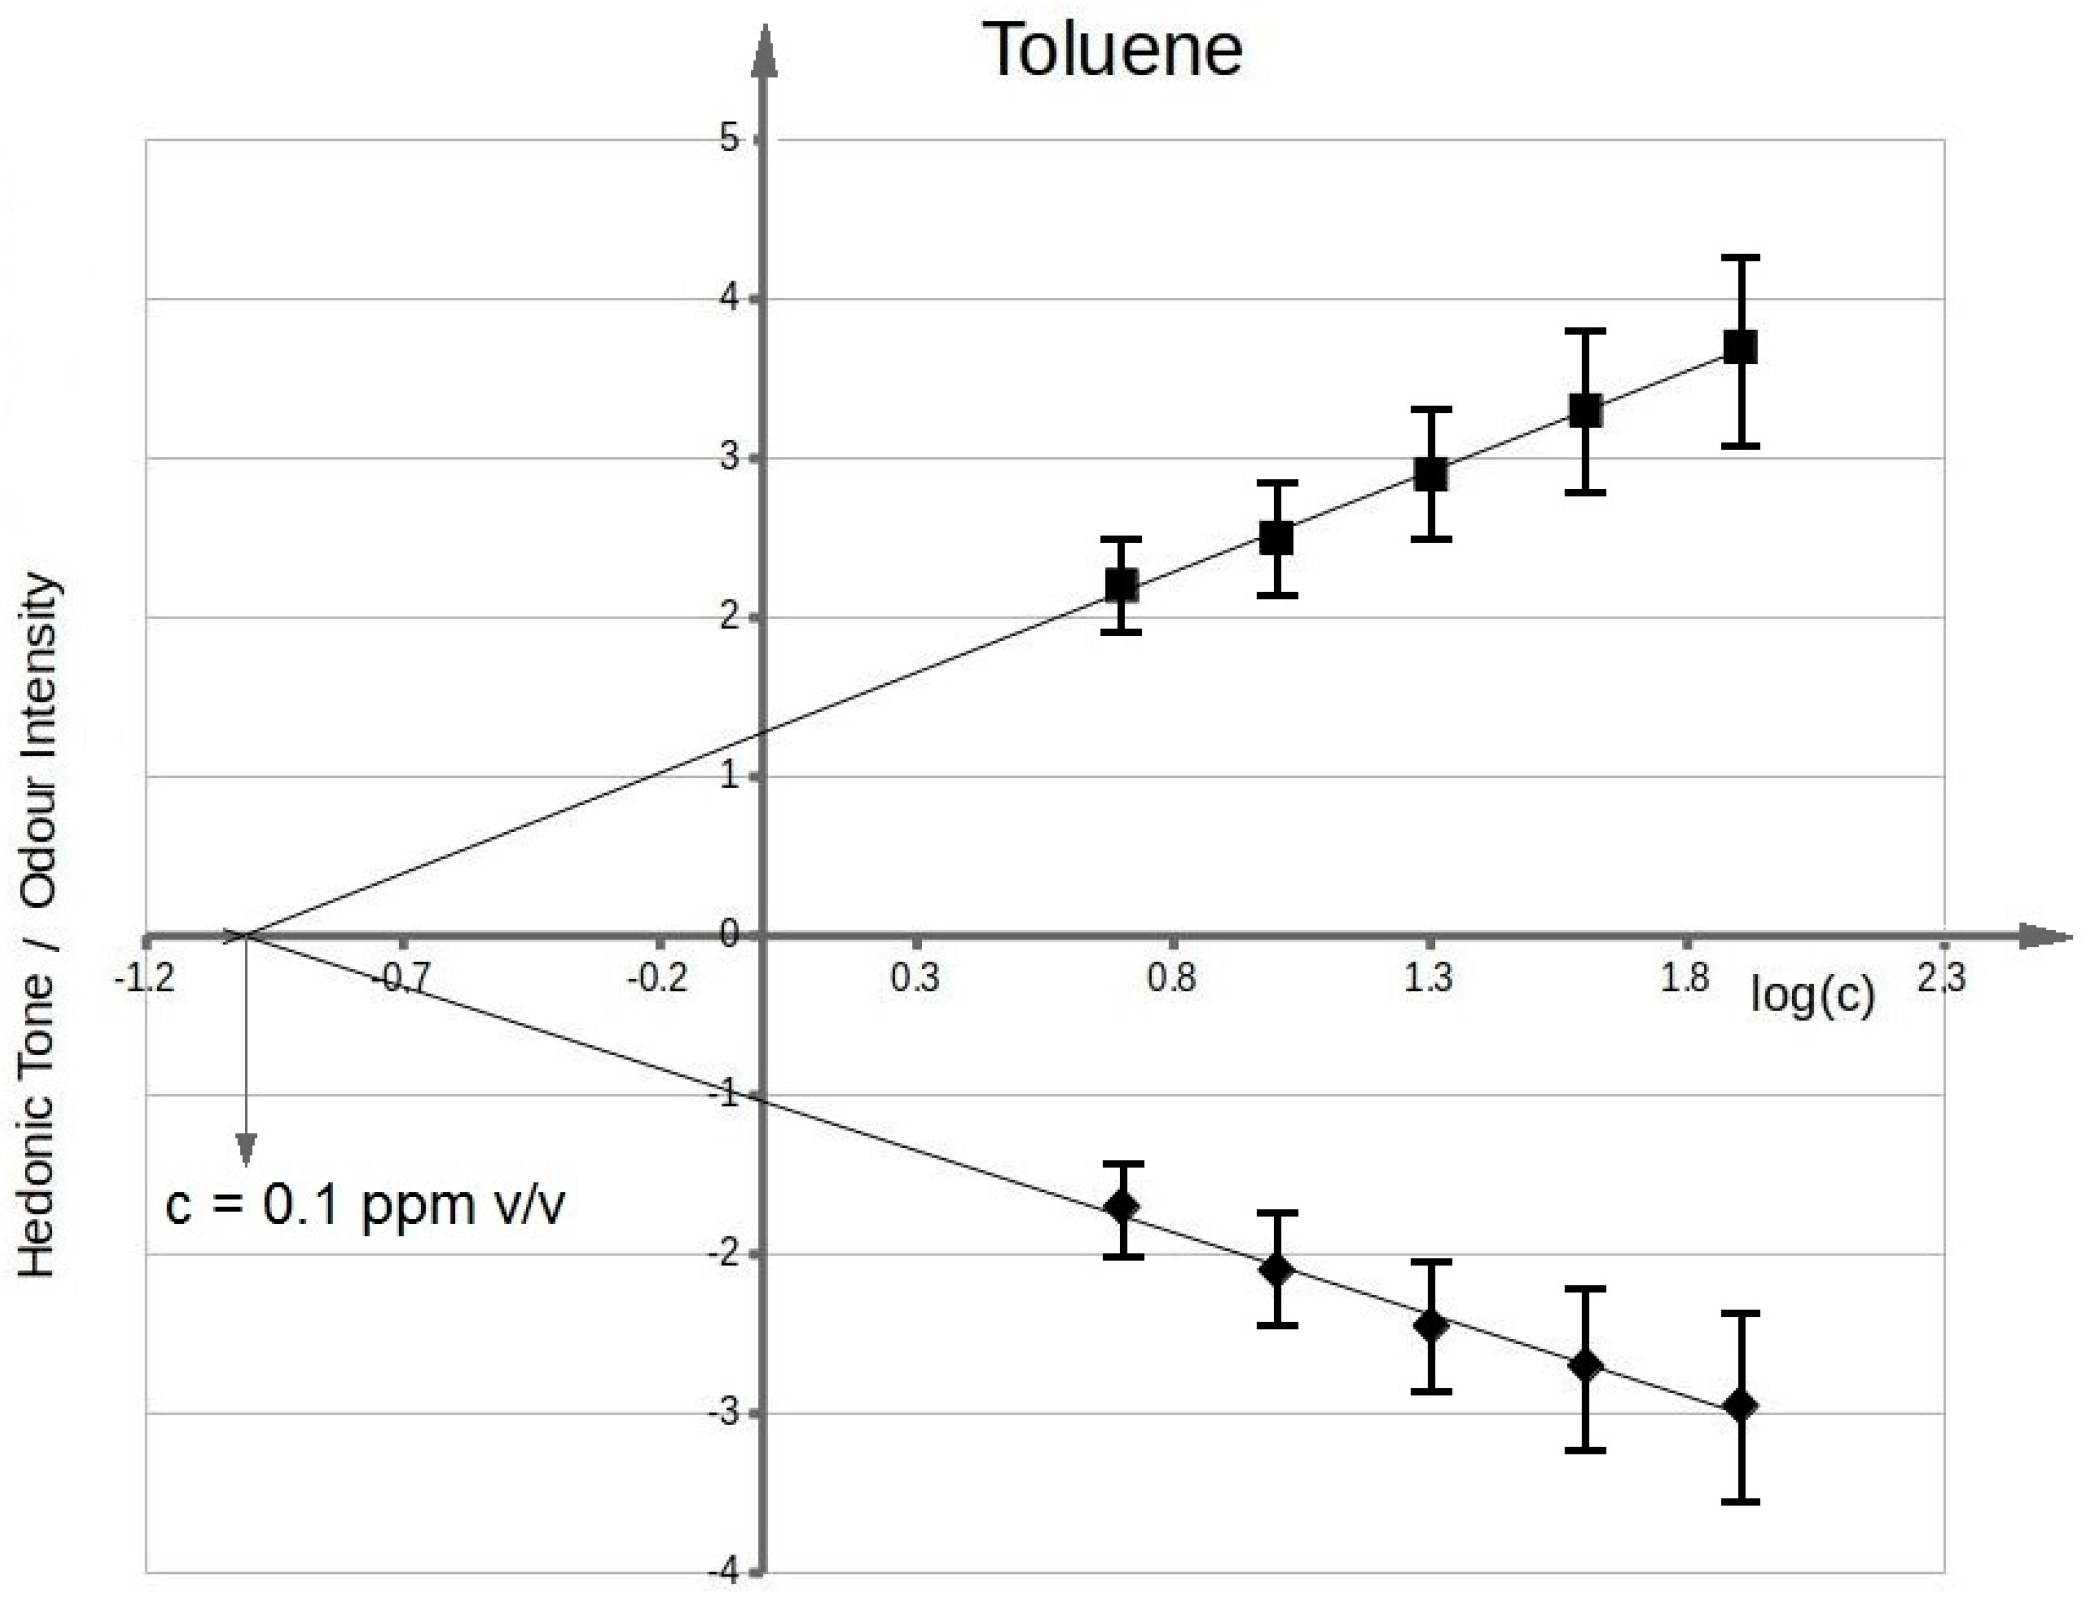
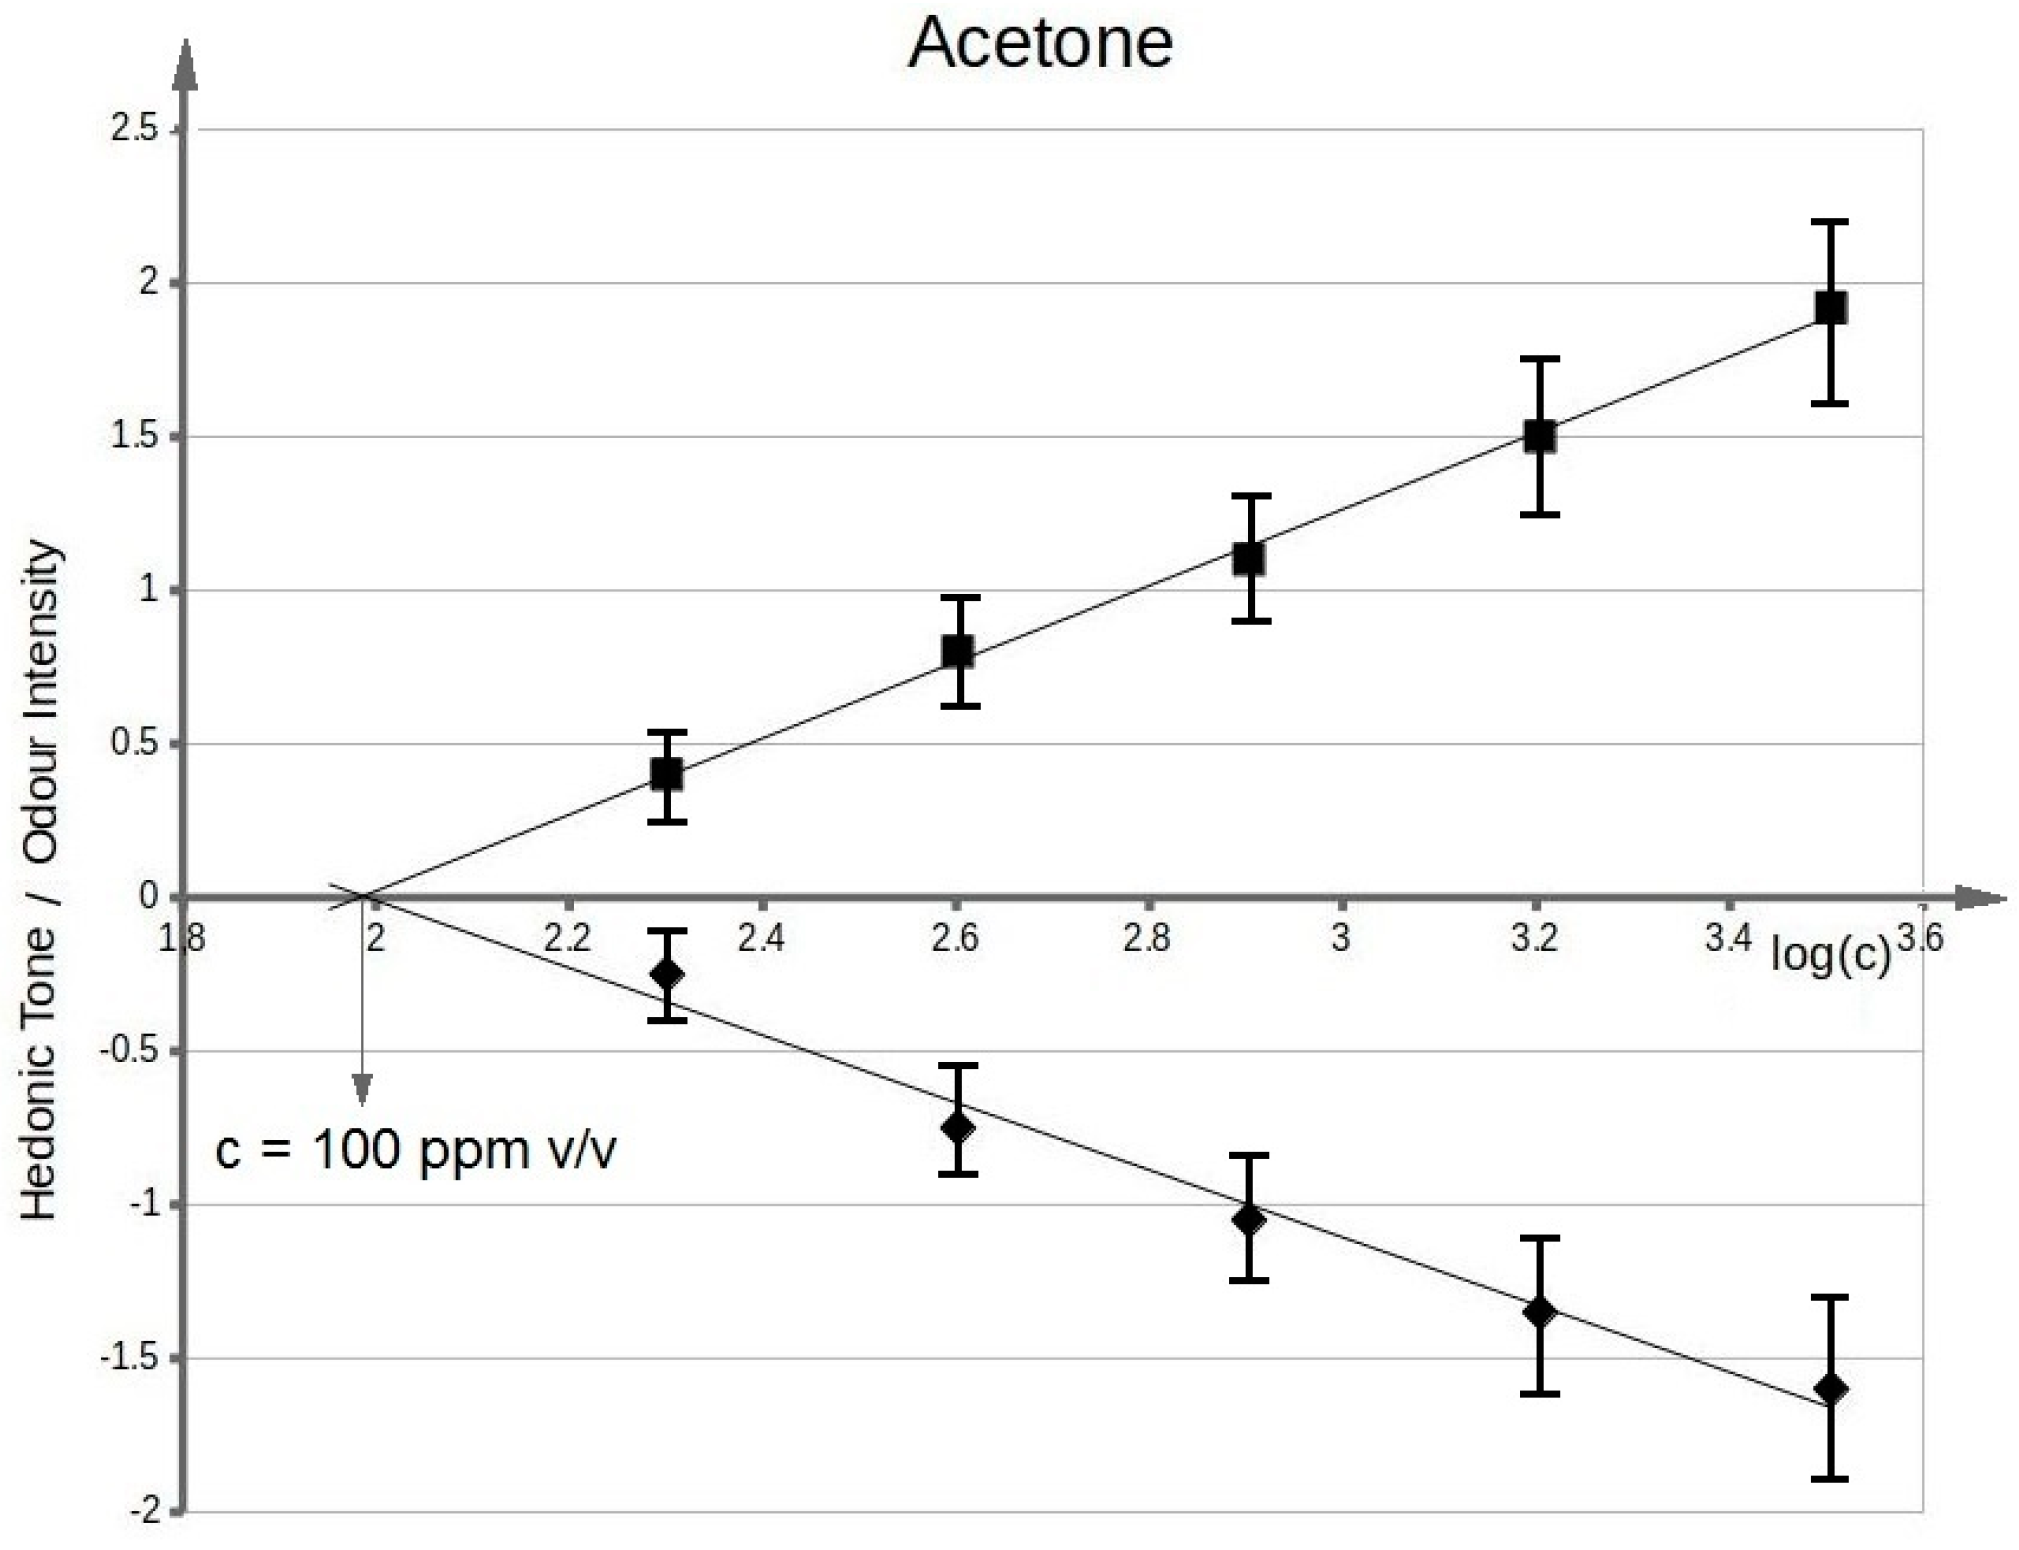
2.3. Measurement of Odour Intensity and Hedonic Tone
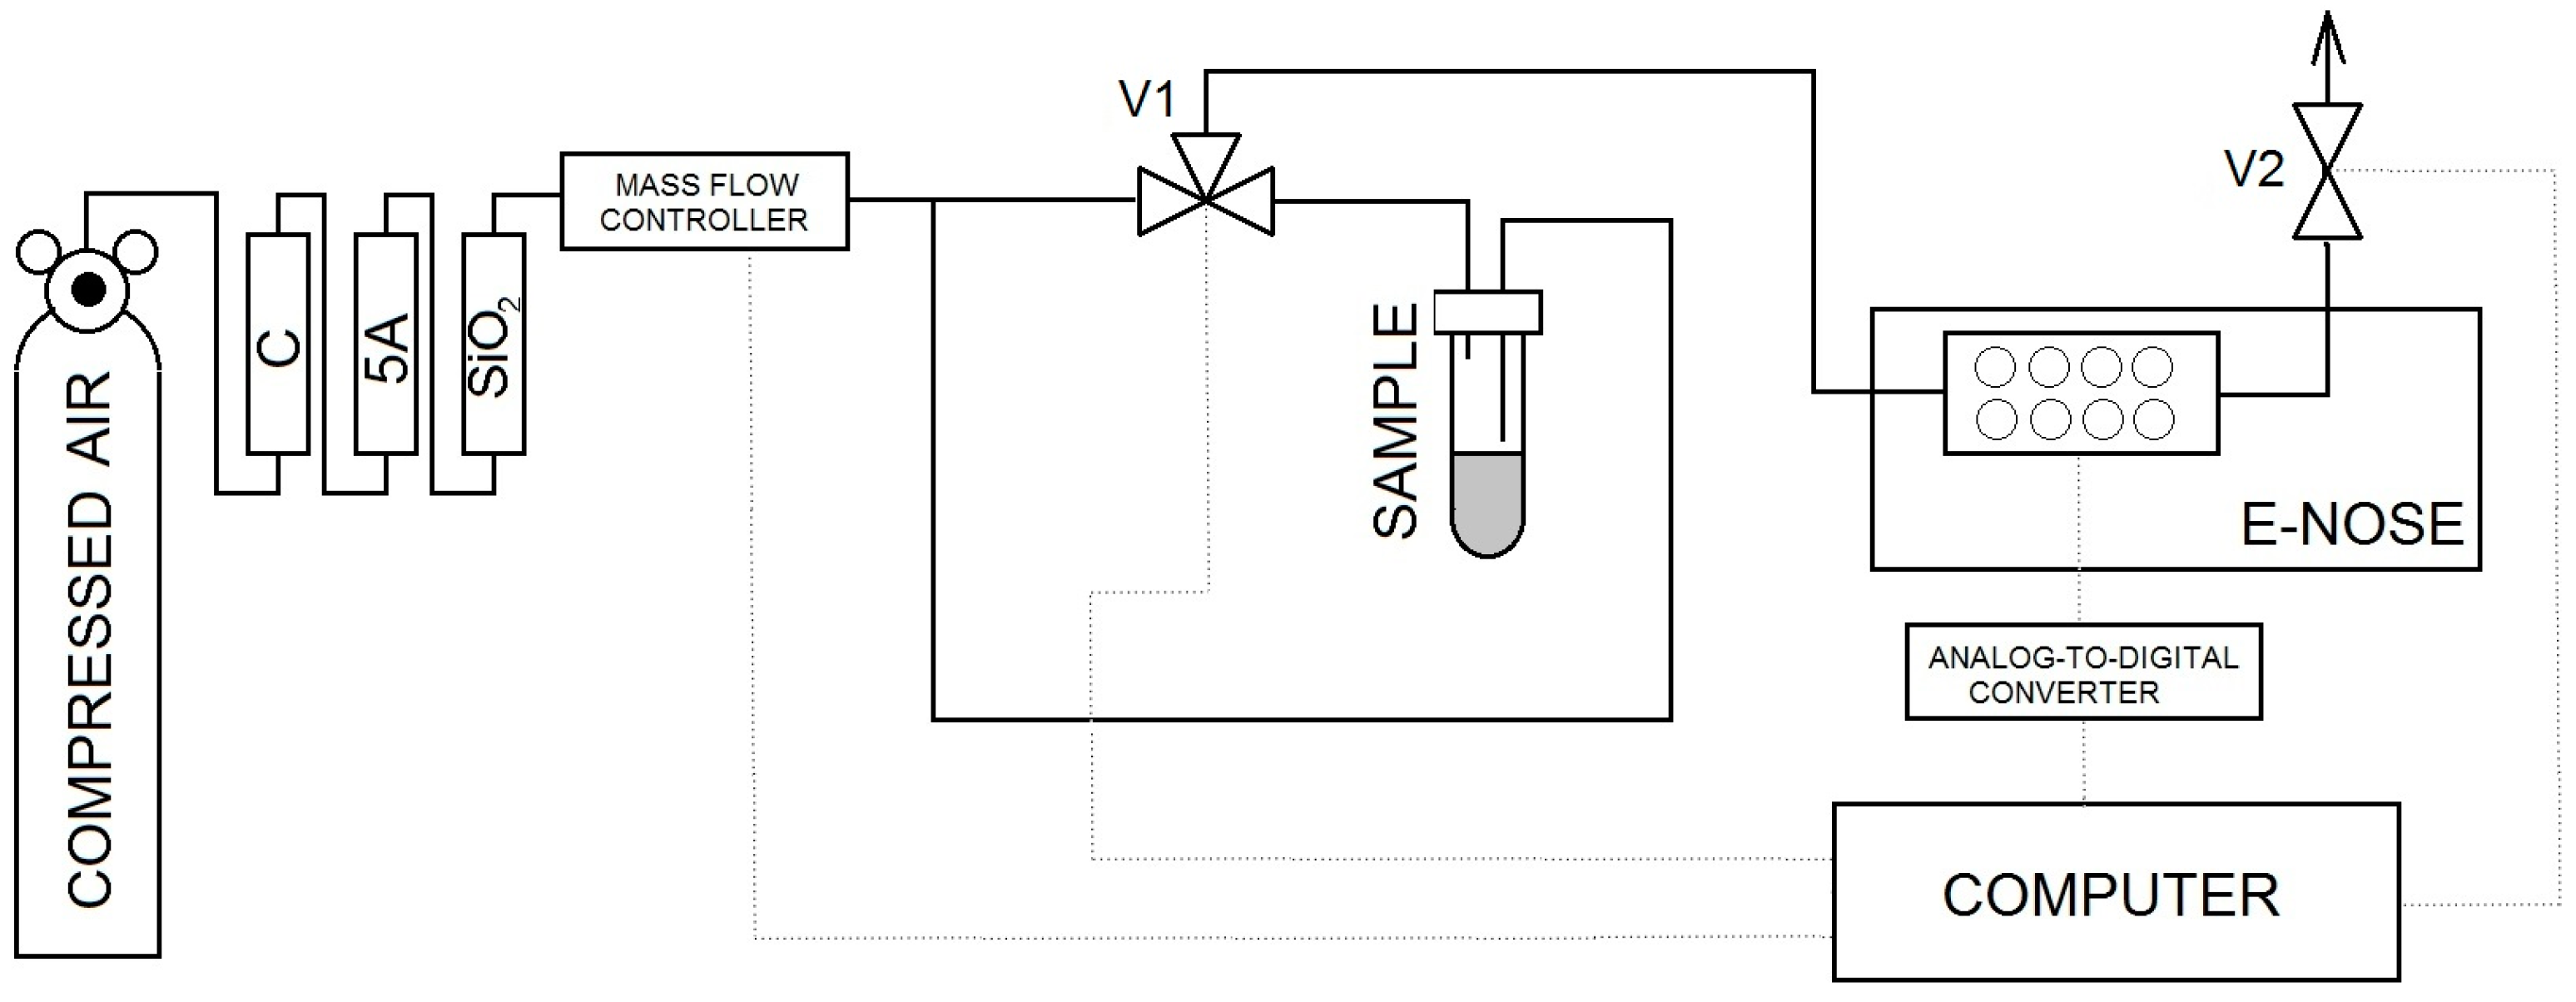
2.4. Description of Experimental Setup for Electronic Nose Investigations
- bottle with carrier gas (compressed air) with reducing valve,
- system of air purification containing three filters filled successively with: active carbon (C), molecular sieve 5A and silica (SiO2),
- three-way V1and cut-off V2 valves,
- sample mounting system,
- mass flow controller (red-y smart series GSC-B9SS-BB23, Voegtlin, Aesch, Switzerland)
- prototype of electronic nose equipped with a matrix of seven sensors: six sensors of MOS-type (TGS 813,TGS 816, TGS 822, TGS 2444, TGS 2602, TGS 2620-FIGARO USA Inc., Arlington Heights, IL, USA) and one PID-type sensor (MiniPID-Ion Science Ltd., Cambridge, UK)
- PC-class computer.
2.5. Methodology of Measurement Using Electronic Nose
- volumetric flow rate of air, determined using the rotameter, was equal 0.3 L/min,
- time of carrier gas flow through the sample: 25 s,
- signal recording: 15 s.
2.6. Data Analysis
3. Results and Discussion
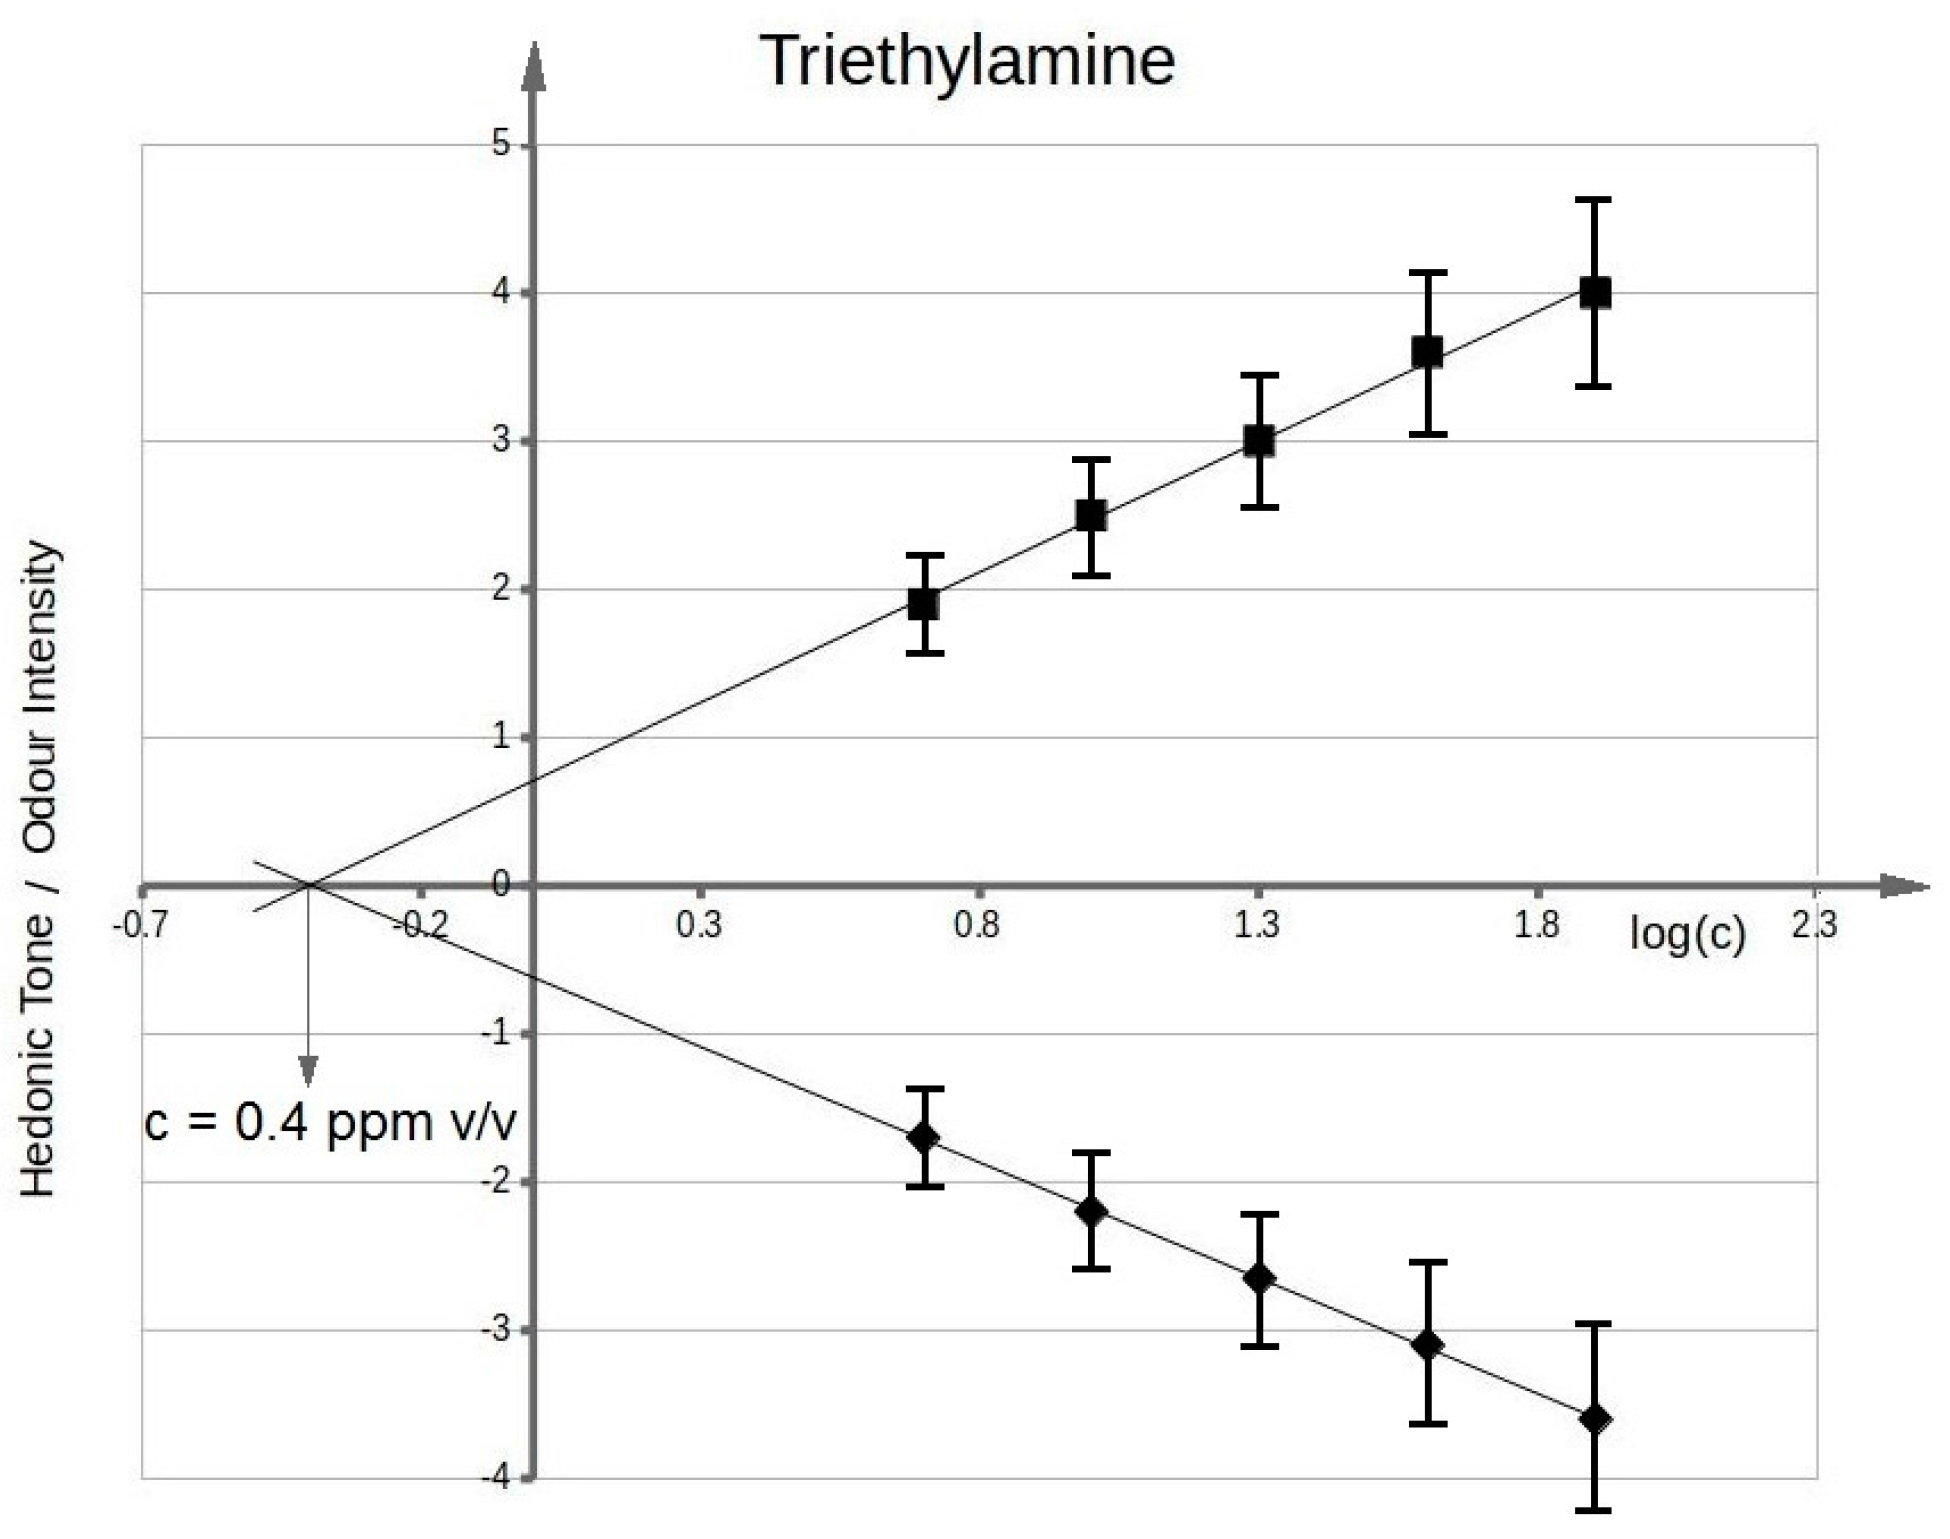
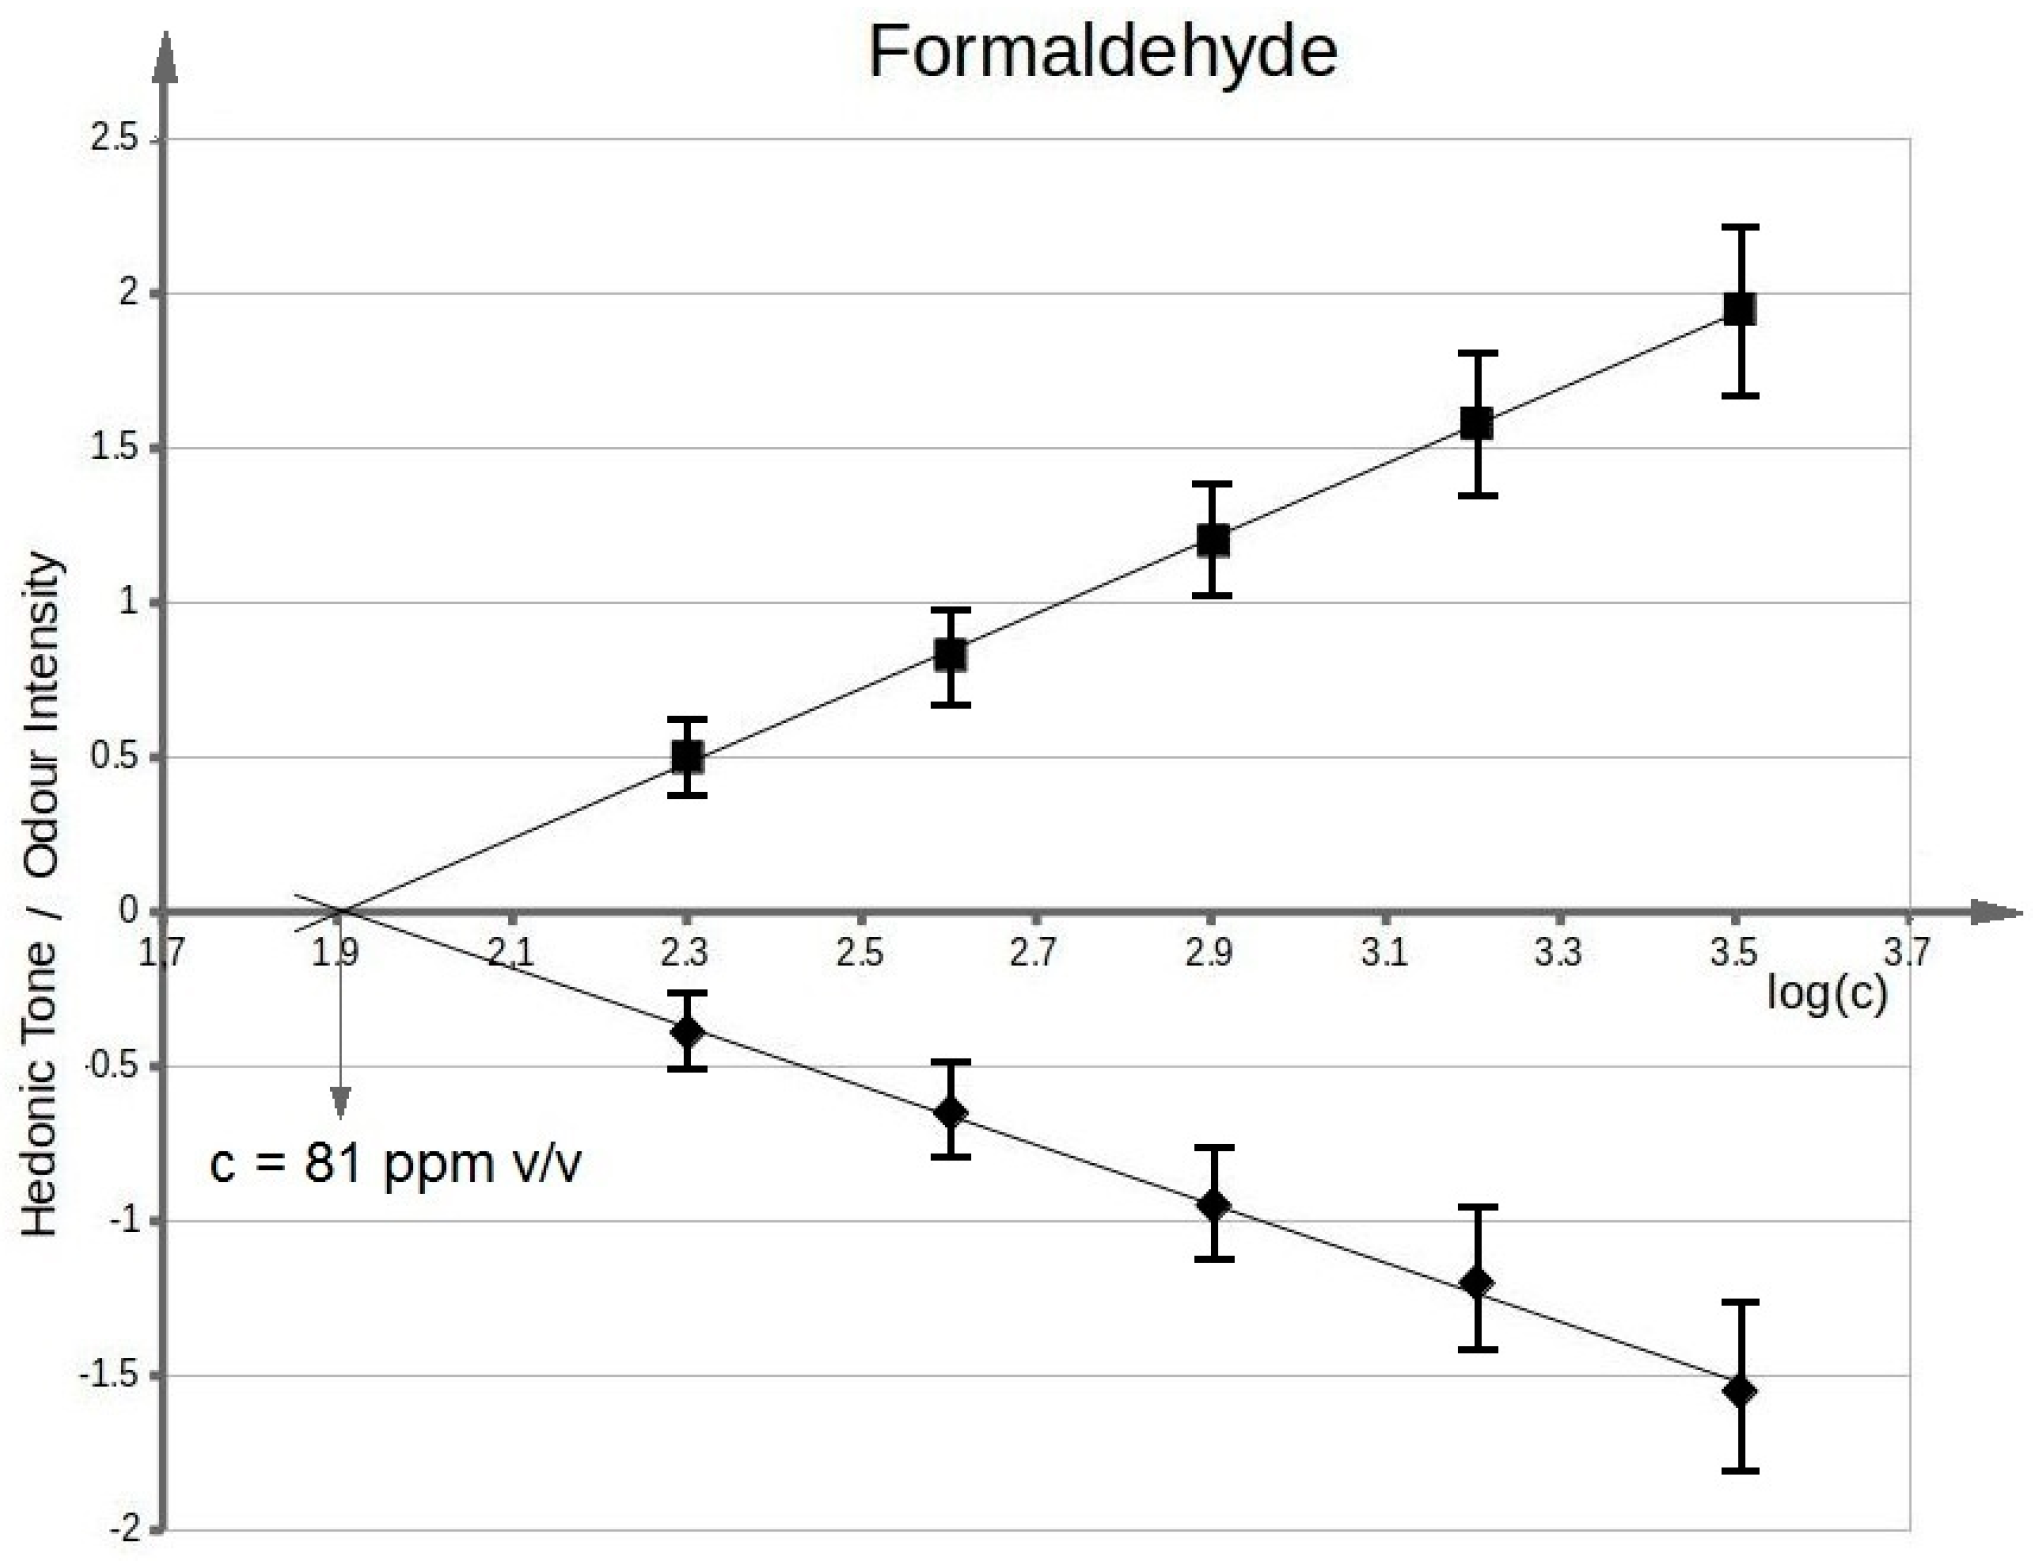
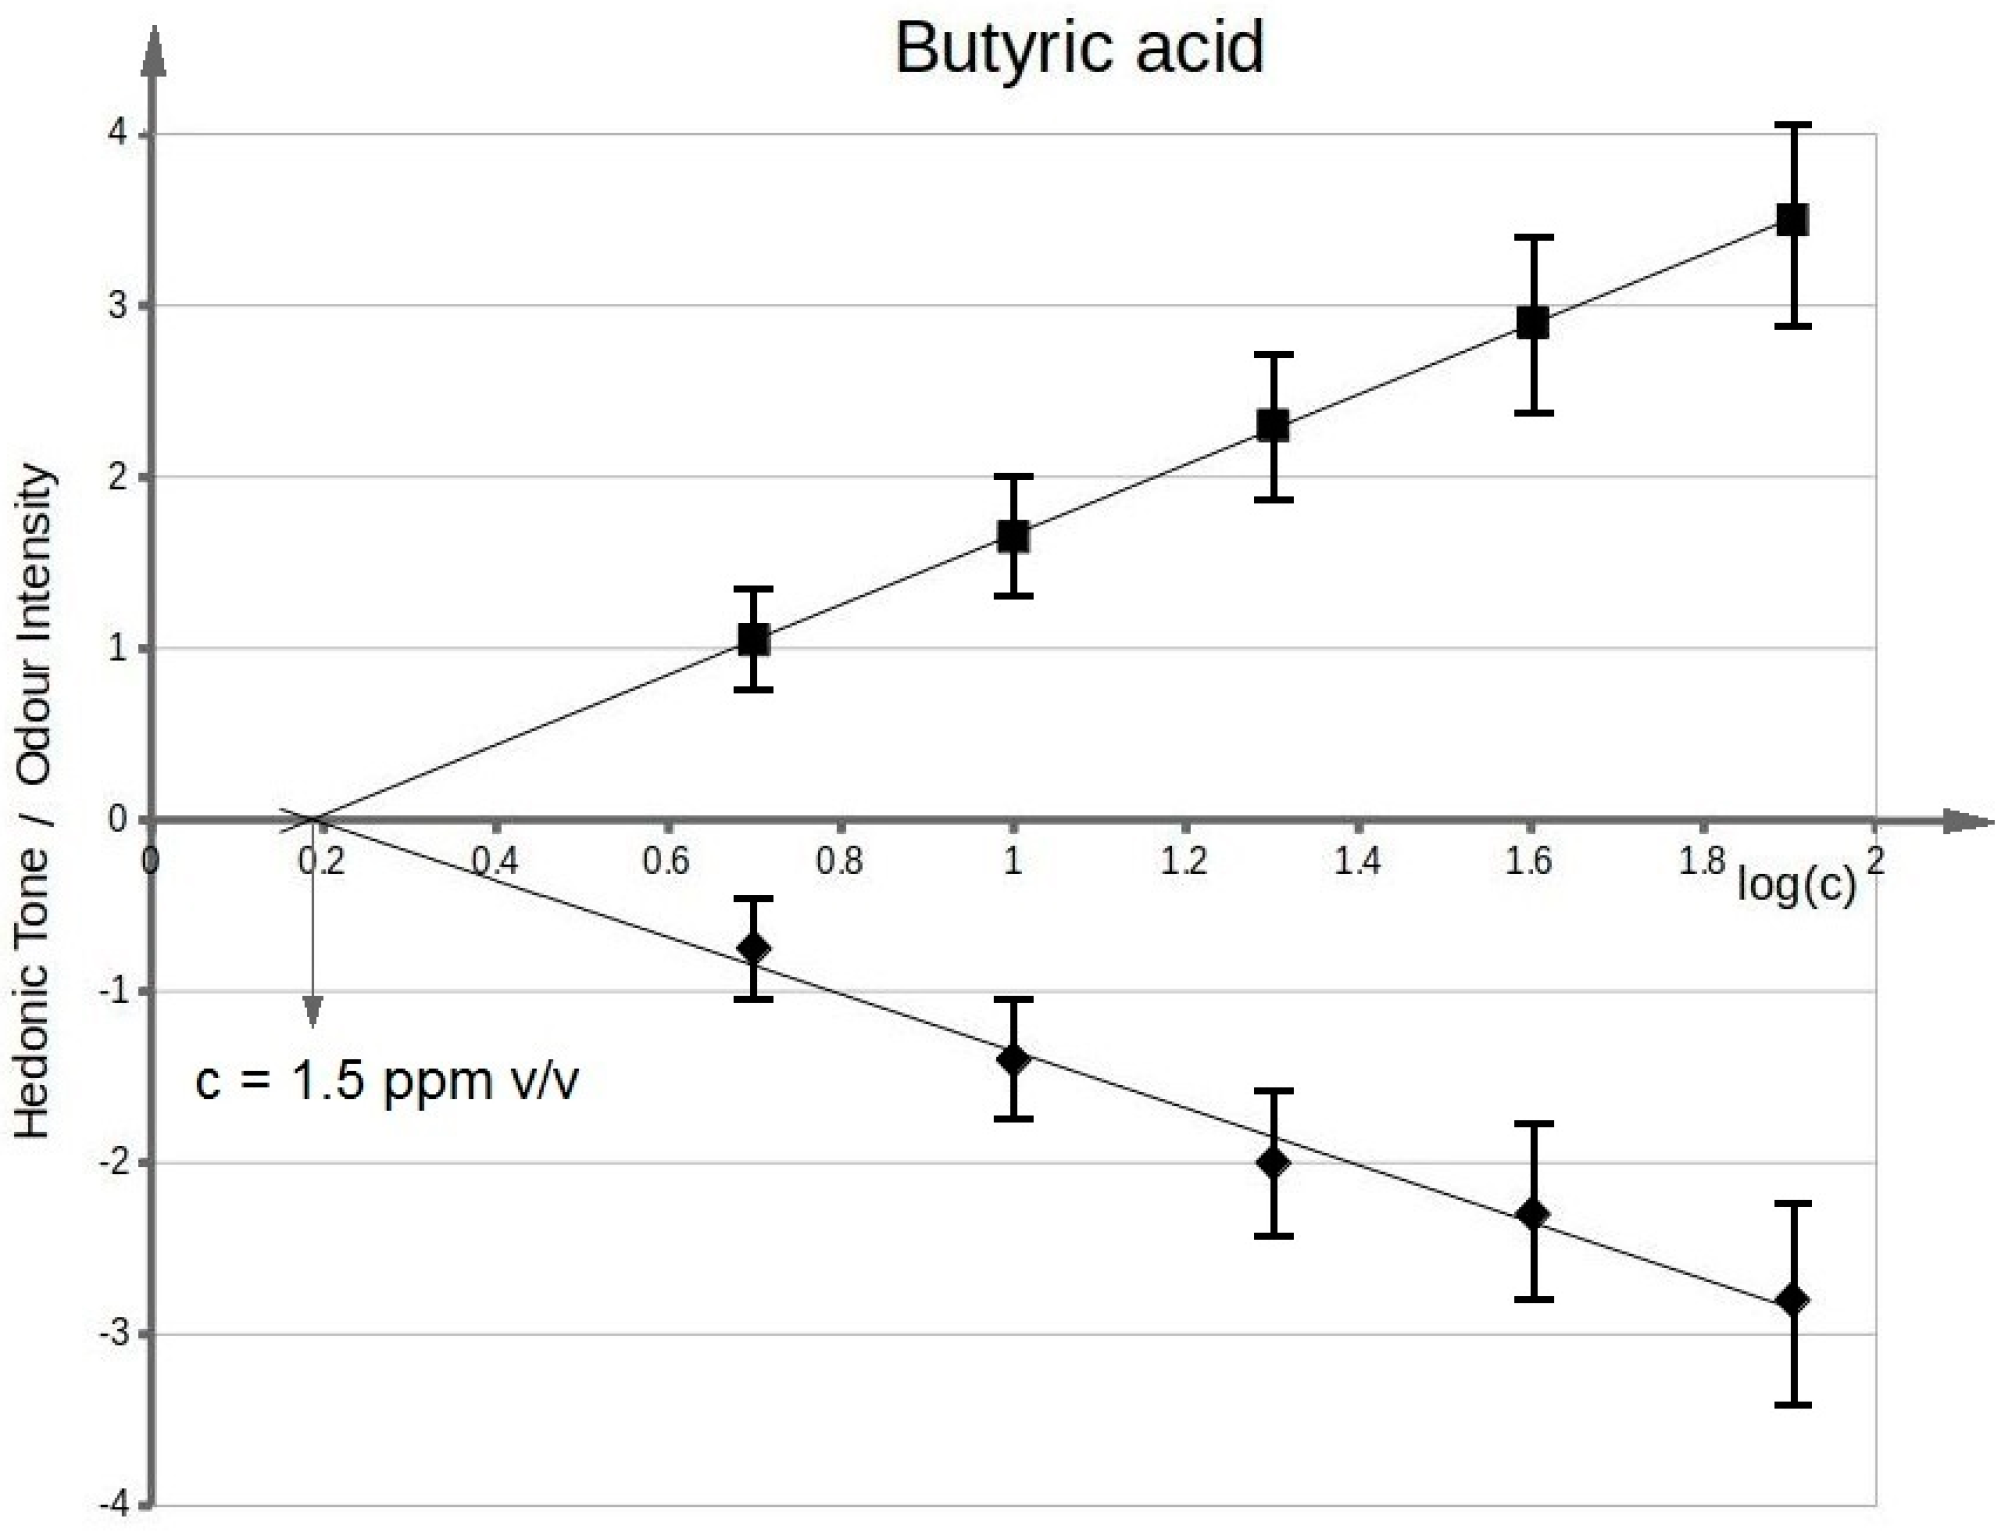
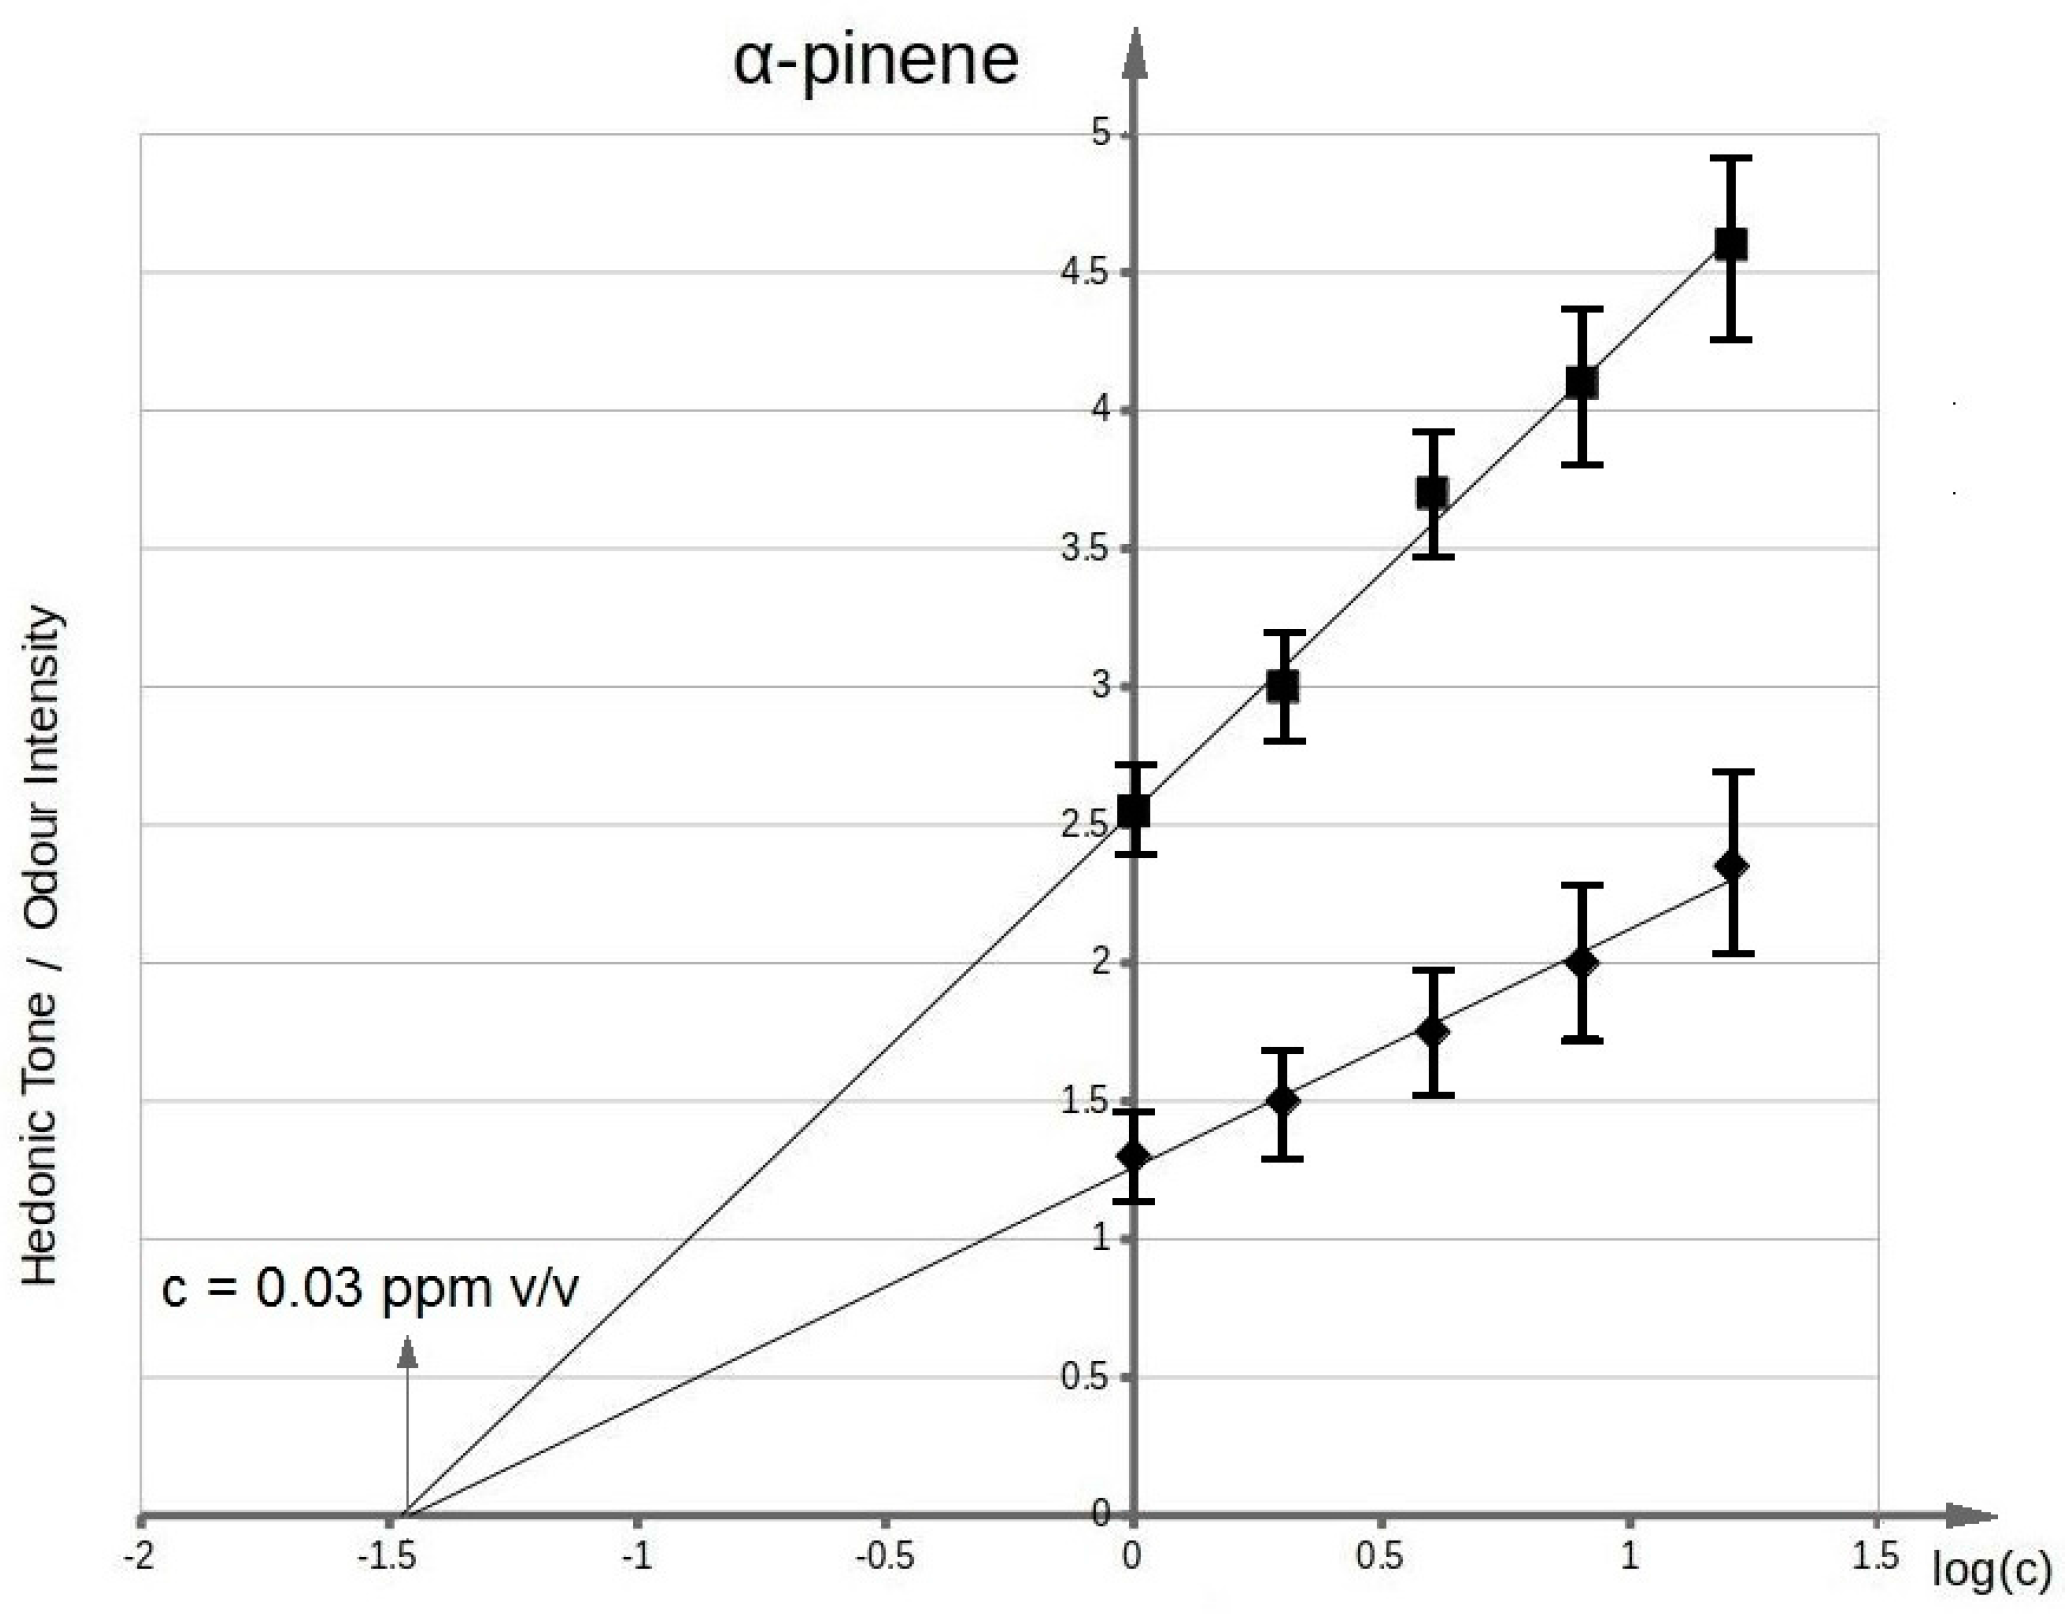
3.1. Determination of Olfactory Thresholds for Particular Odorous Compounds in Aqueous Solution
3.2. Determination of Theoretical Values of Odour Intensity and Hedonic Tone of Three-Component Mixtures Using Perception Model
3.3. Determination of Measurement Points Within Olfactory Triangle Where Odour Interaction Phenomenon Was Discovered by A Group of Assessors
3.4. Determination of Measurement Points within Olfactory Triangle Where Odour Interaction Phenomenon Was Discovered with Electronic Nose Instrument
3.5. Comparison of Information about Odour Interactions Obtained Via Sensory Analysis and Electronic Nose Instrument
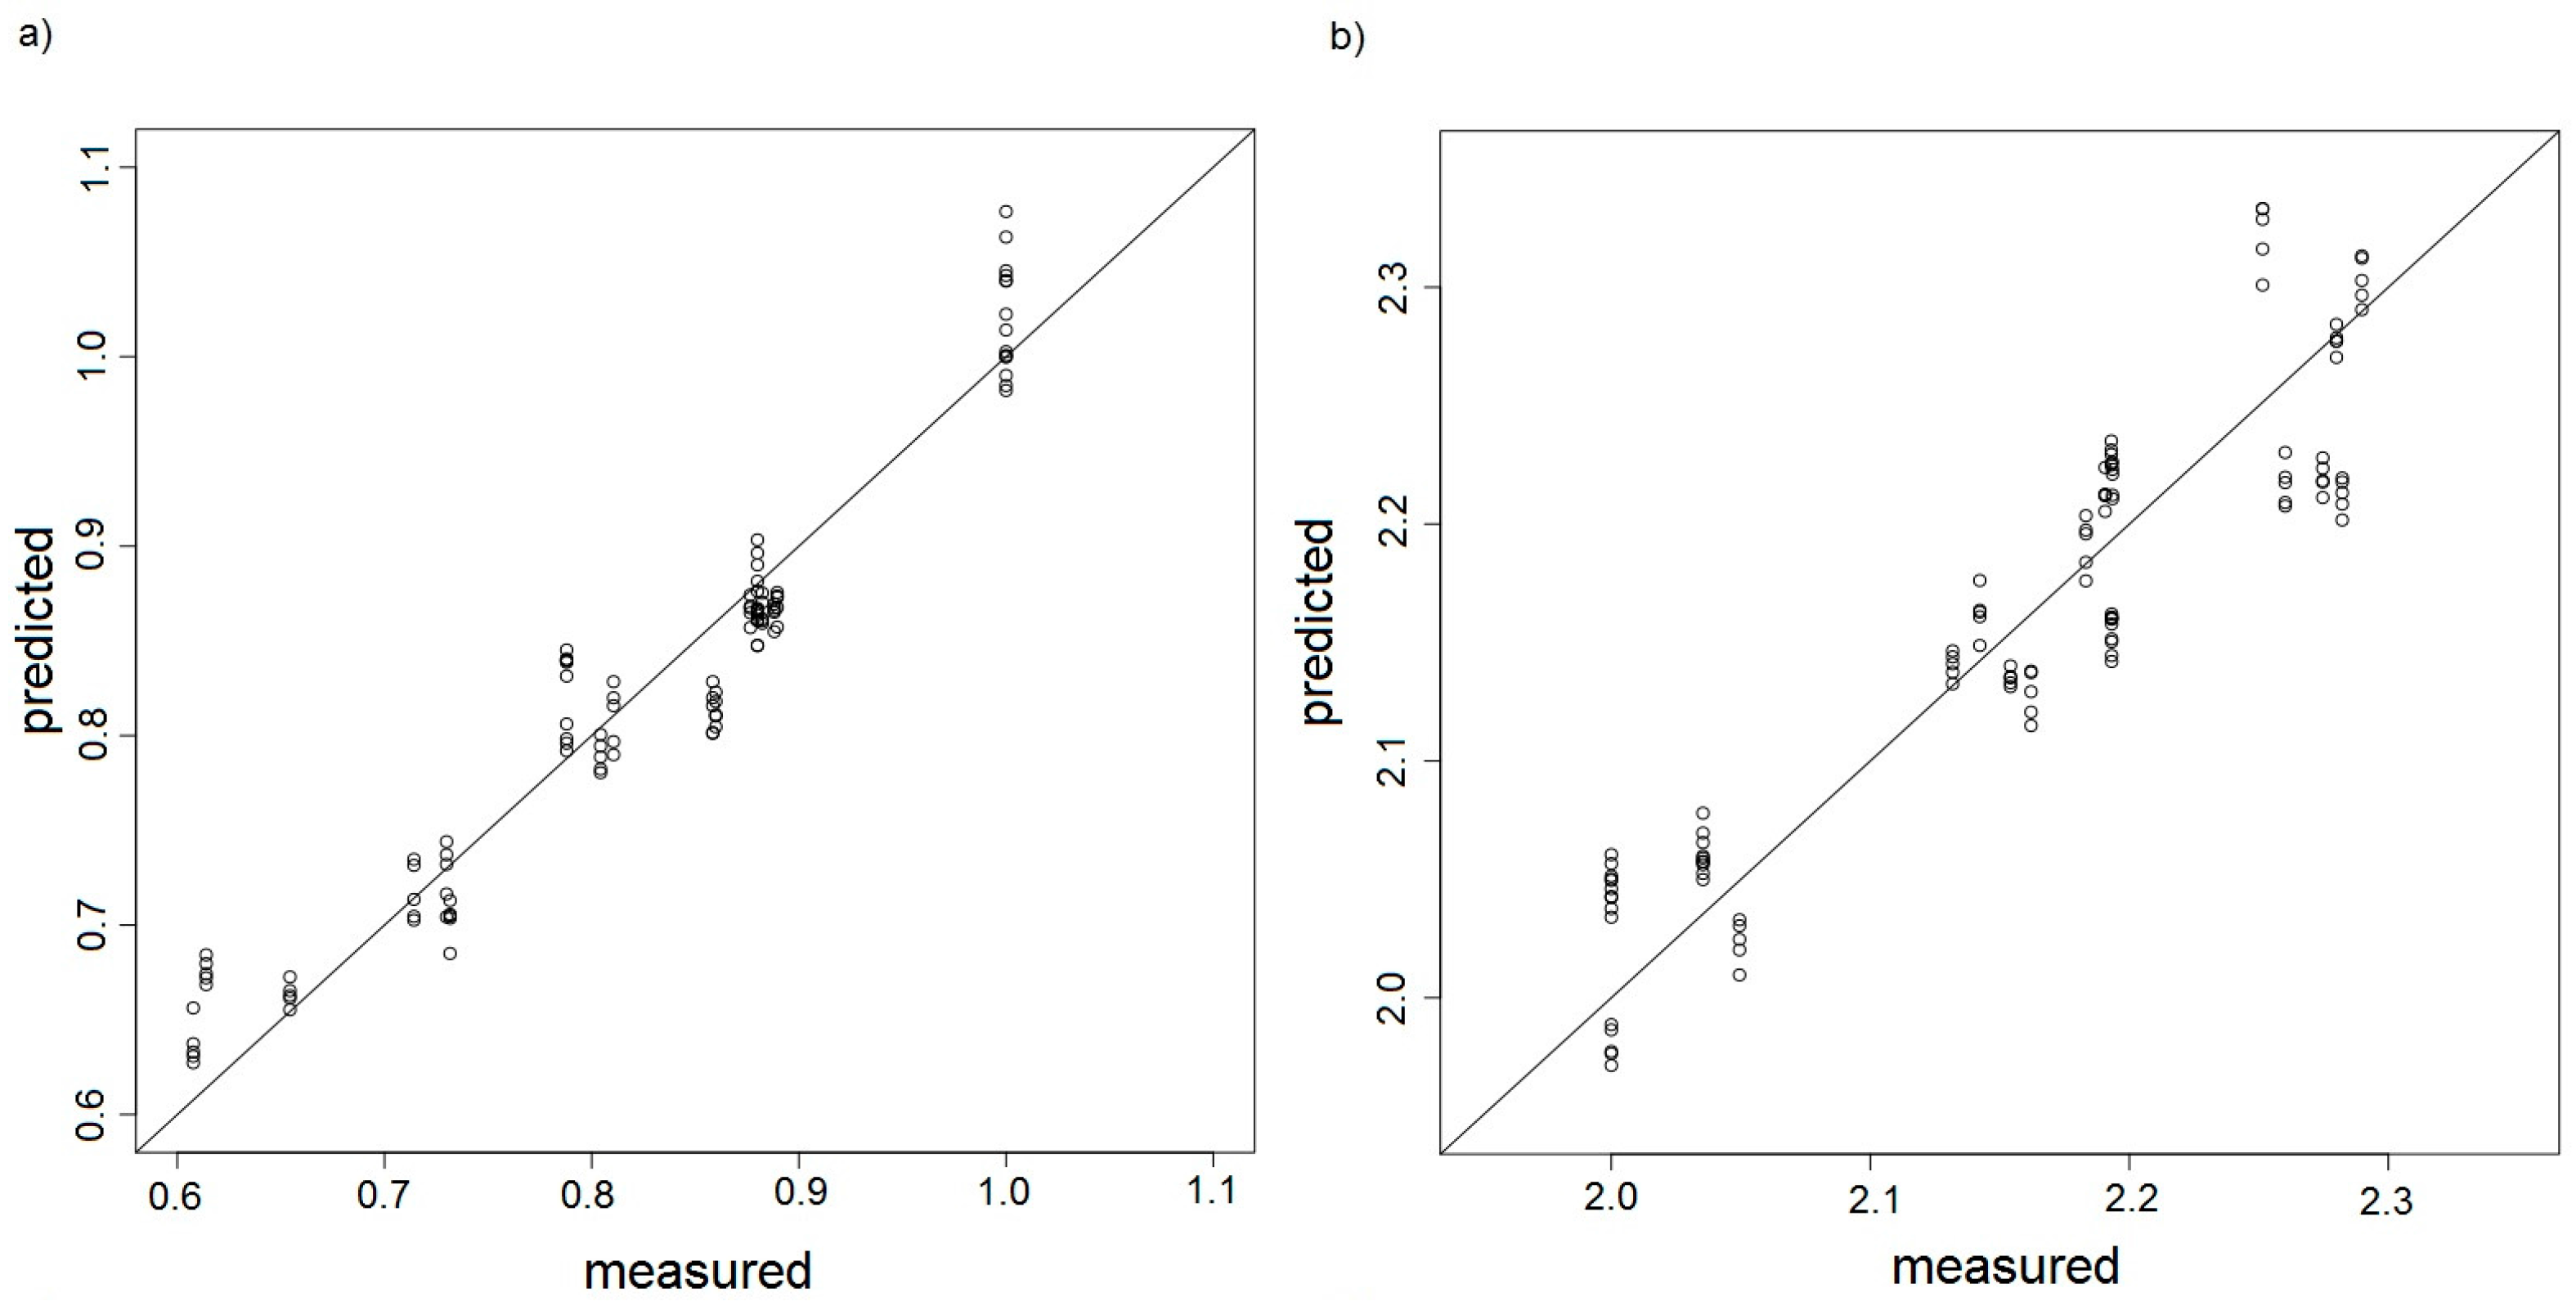
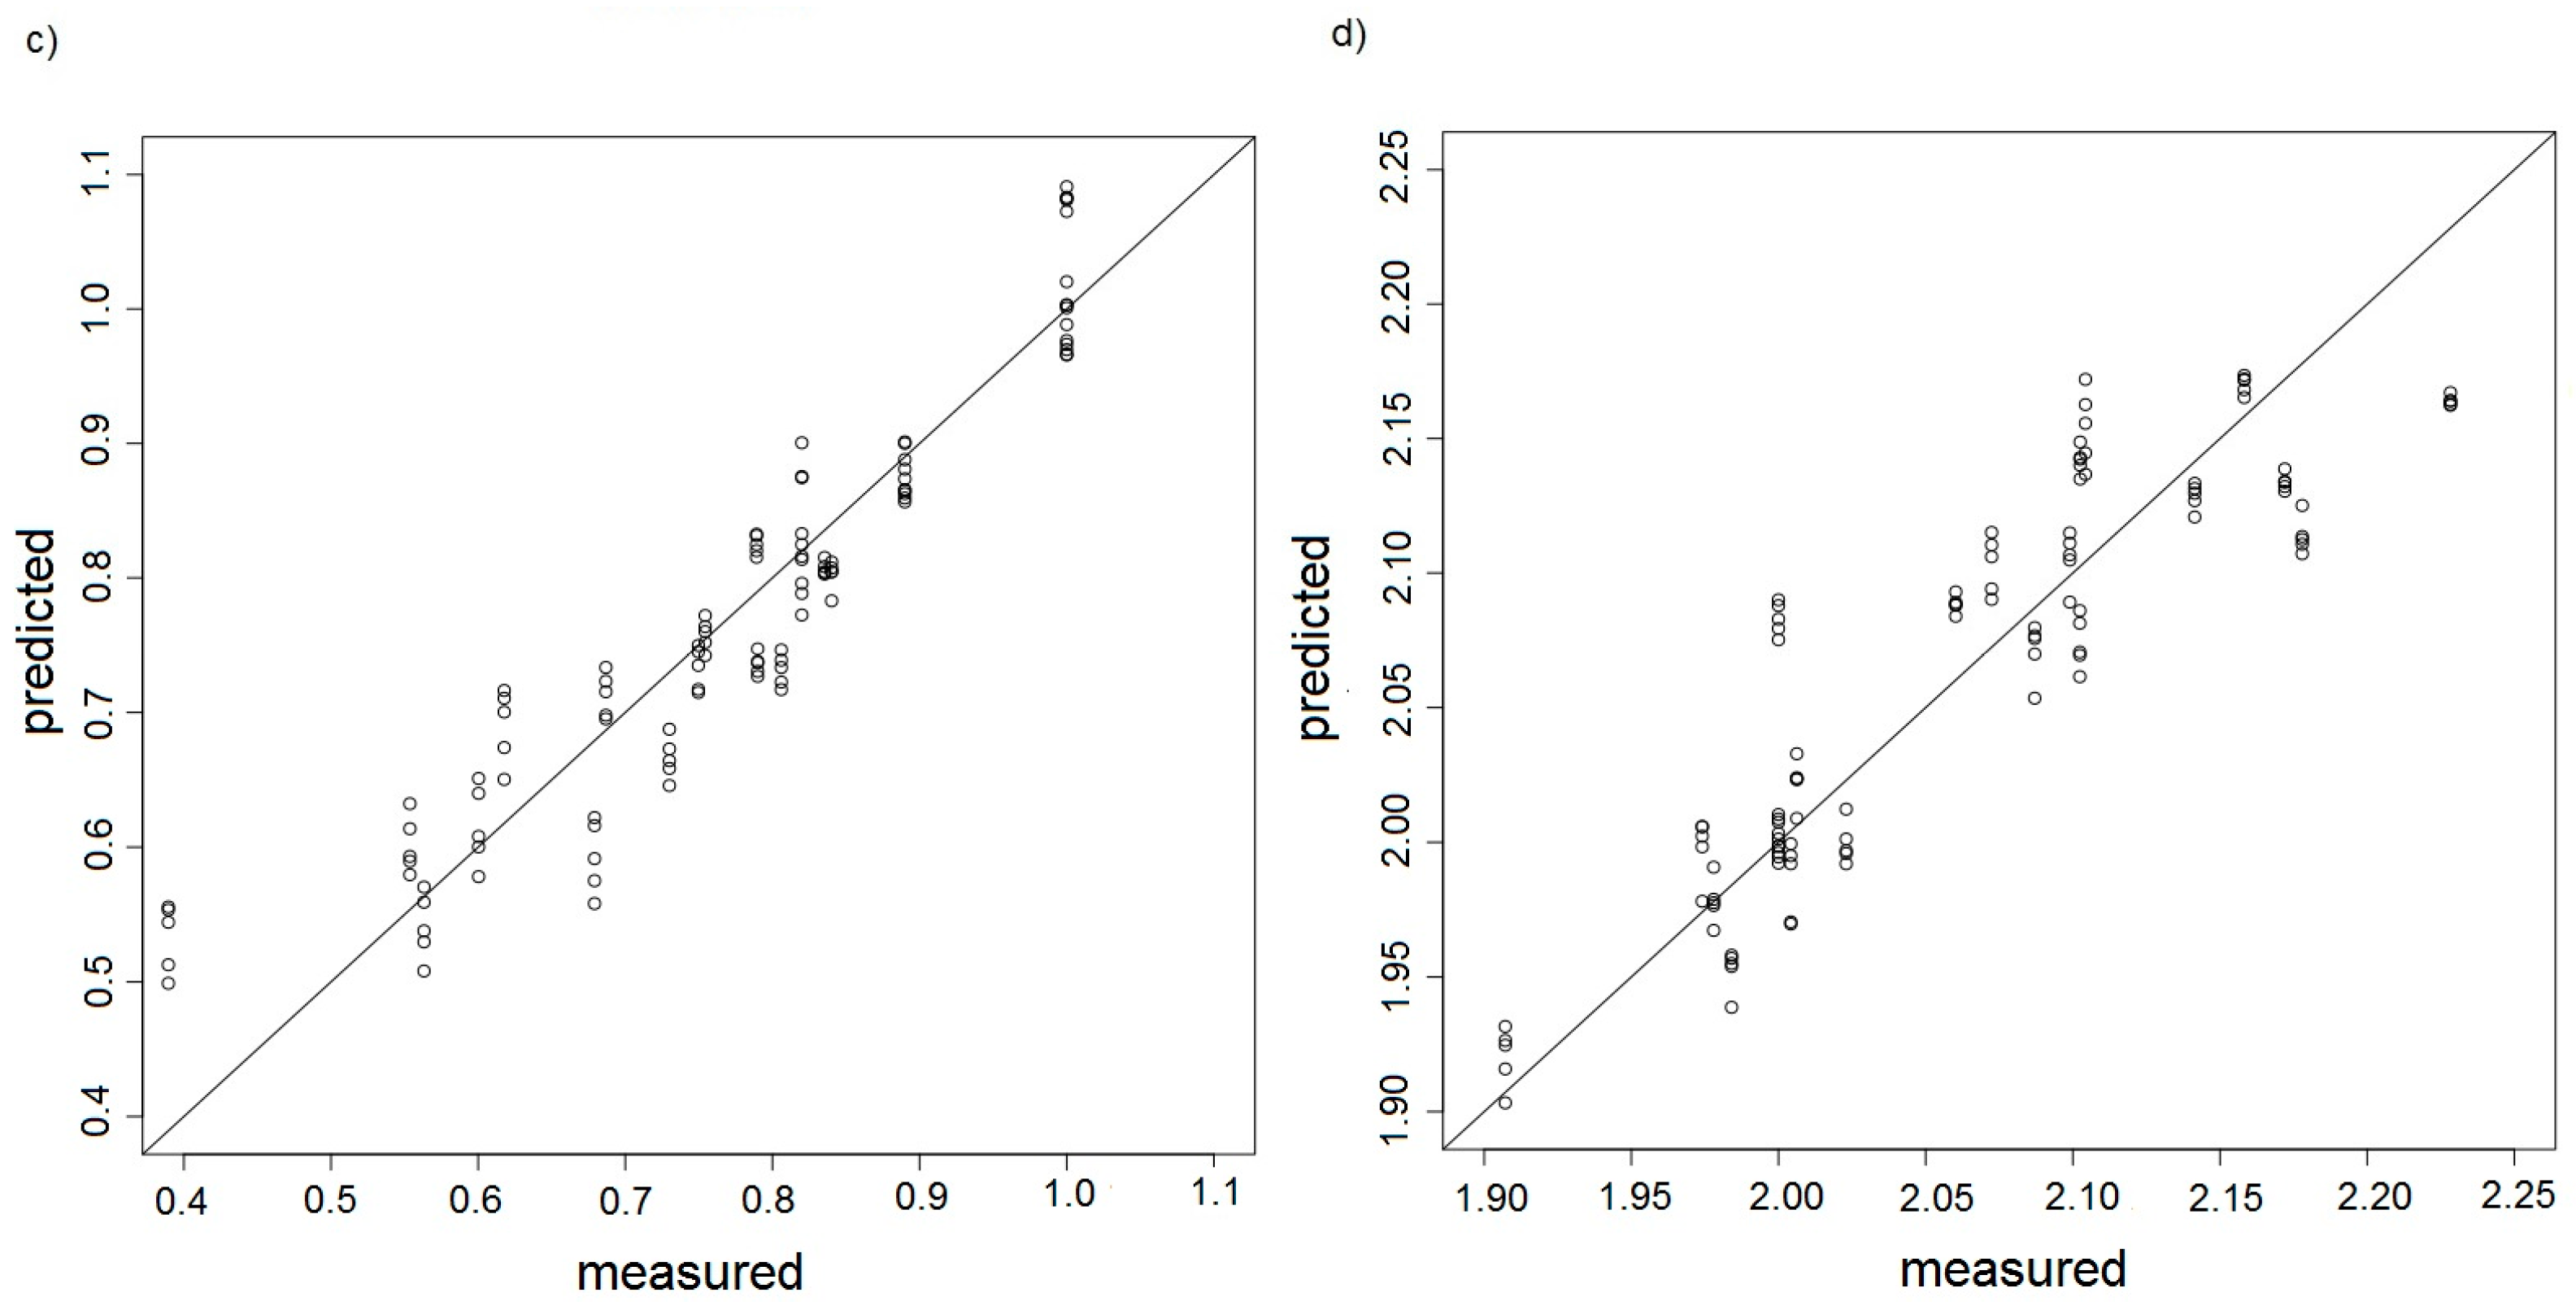
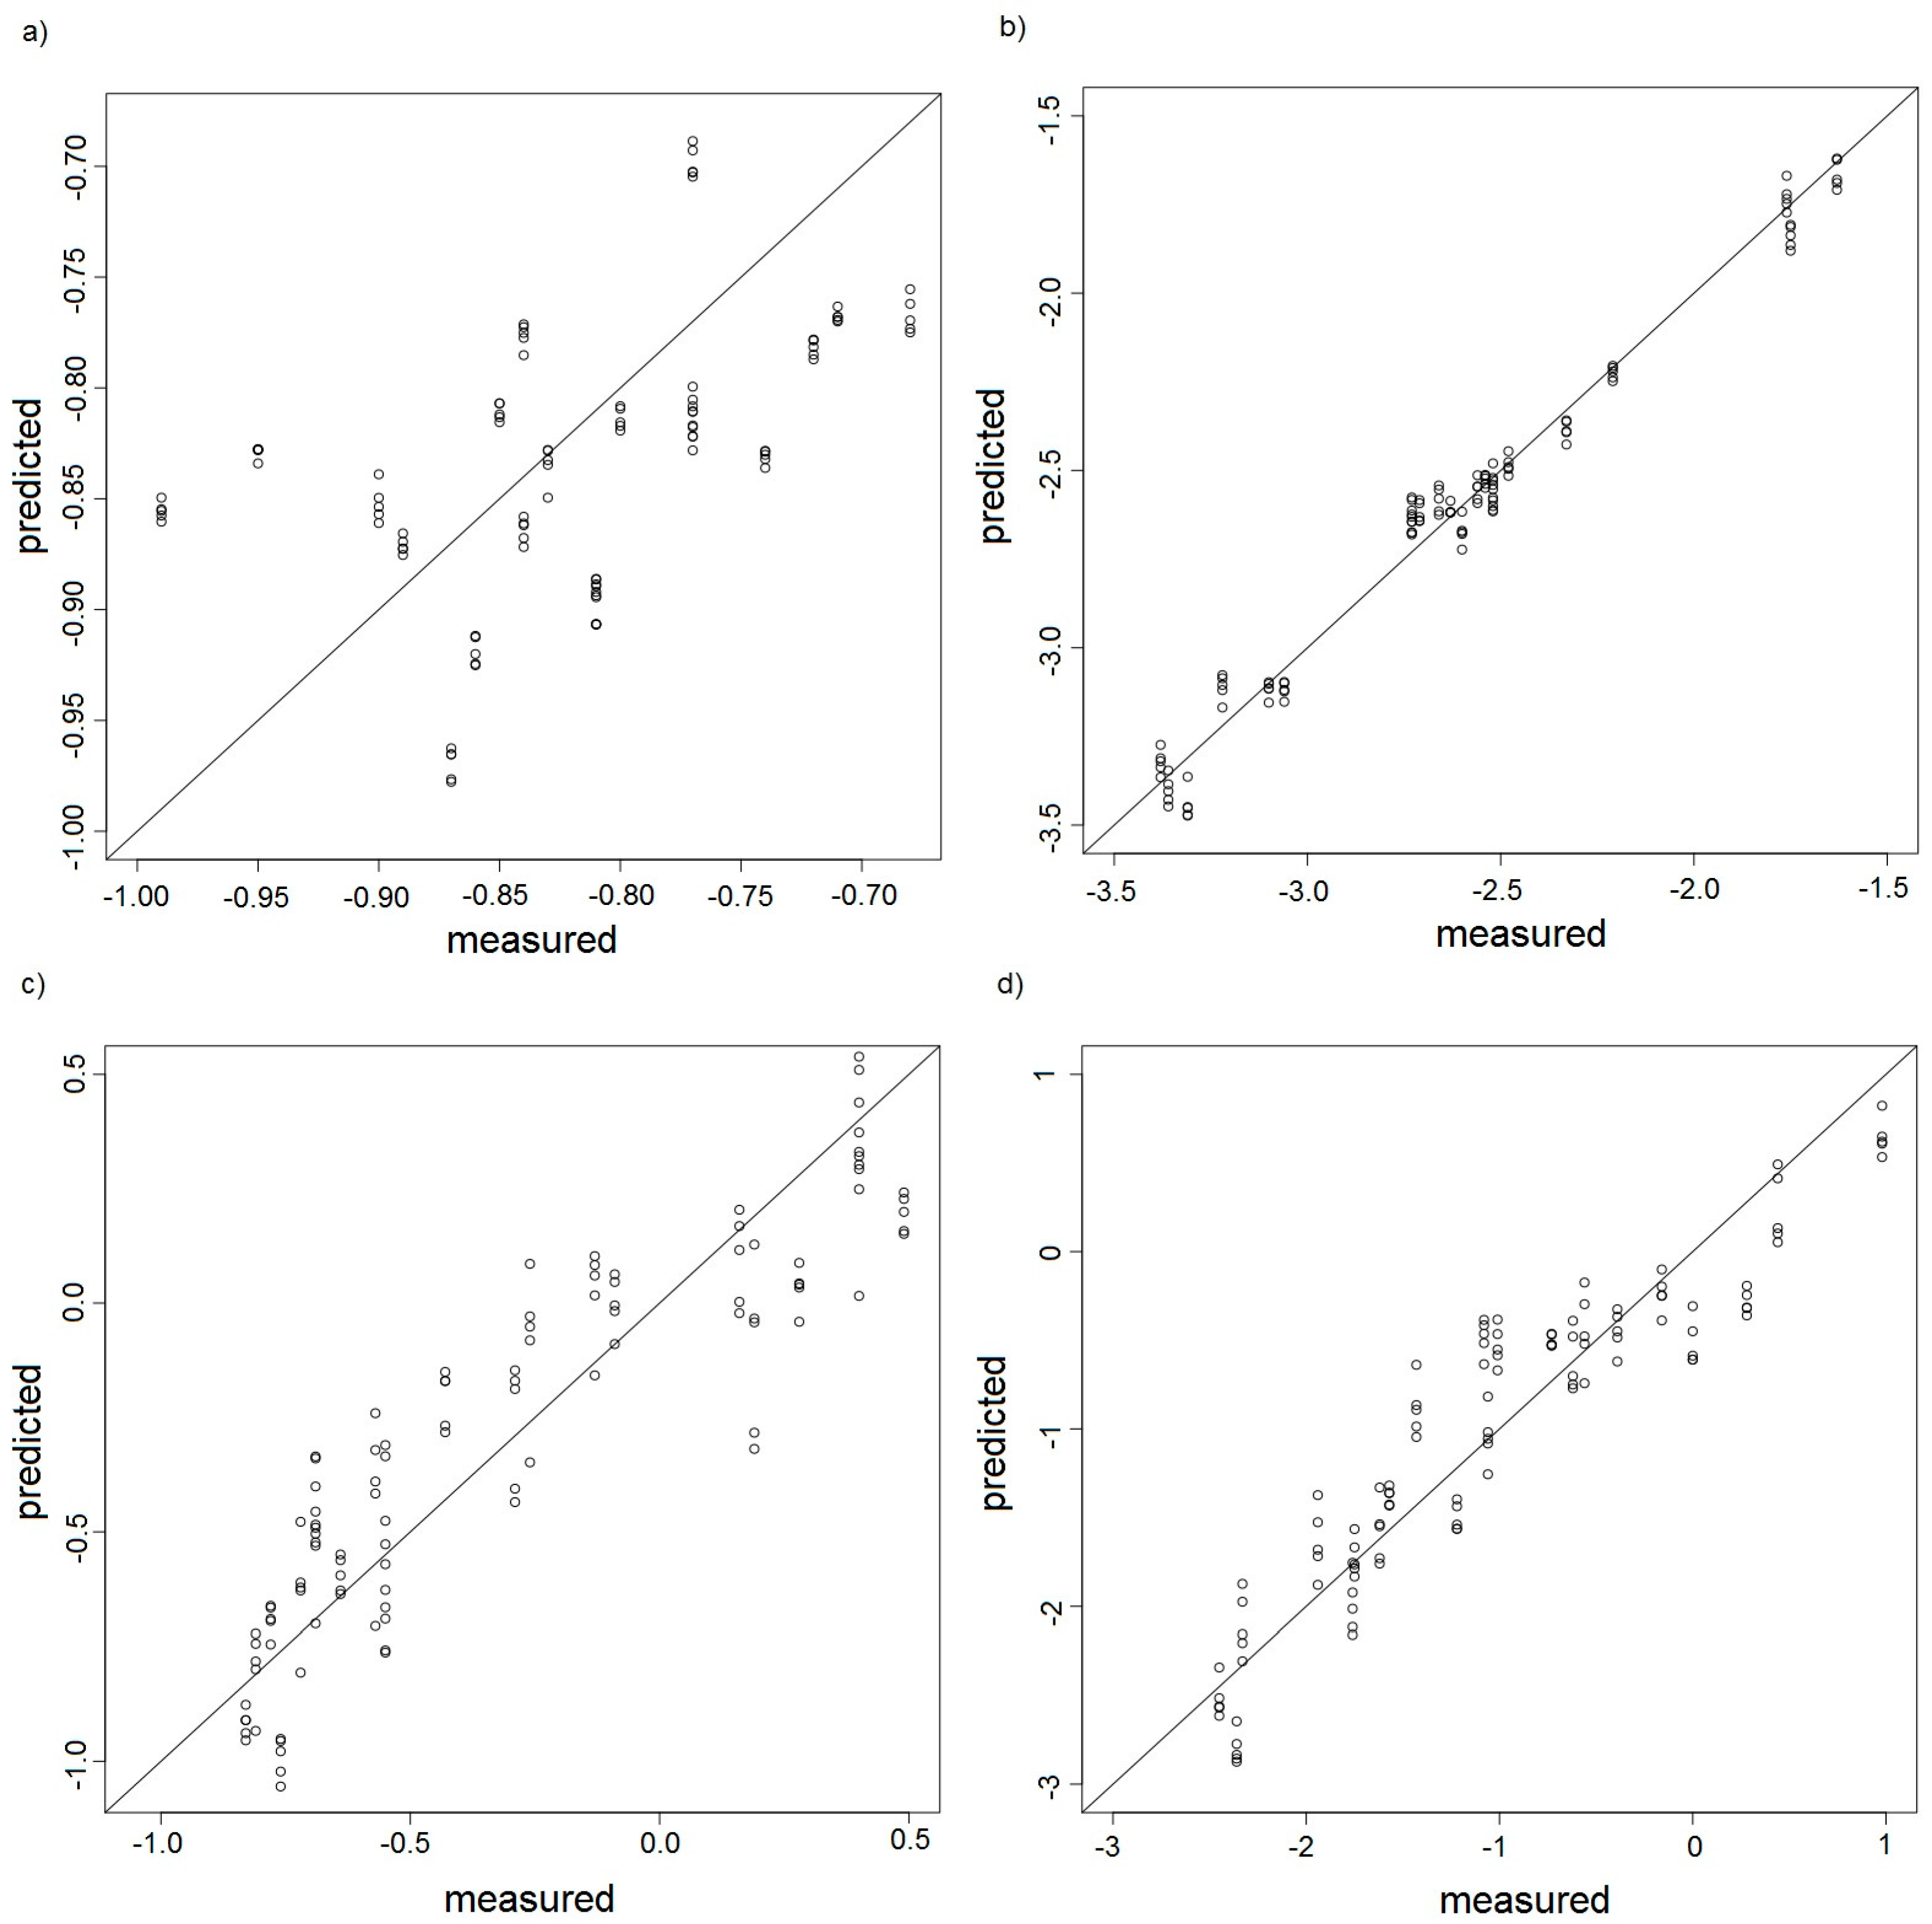
3.6. Evaluation of Constructed PCR Calibration Model
4. Conclusions
Acknowledgments
Author Contributions
Conflicts of Interest
References
- Gardner, J.W.; Bartlett, P.N. A brief history of electronic noses. Sens. Actuators B Chem. 1994, 18, 211–220. [Google Scholar] [CrossRef]
- Boeker, P. On ‘Electronic Nose’ methodology. Sens. Actuators B Chem. 2014, 204, 2–17. [Google Scholar] [CrossRef]
- Craven, M.A.; Gardner, J.W.; Bartlett, P.N. Electronic noses-development and future prospects. Trends Anal. Chem. 1996, 15, 486–493. [Google Scholar] [CrossRef]
- Gardner, J.W.; Bartlett, P.N. Performance definition and standardisation of electronic noses. Sens. Actuators B Chem. 1996, 33, 60–67. [Google Scholar] [CrossRef]
- Rock, F.; Barsan, N.; Weimar, U. Electronic nose: Current status and future trends. Chem. Rev. 2008, 108, 705–725. [Google Scholar] [CrossRef] [PubMed]
- Wilson, A.D.; Baietto, M. Applications and advances in electronic-nose technologies. Sensors 2009, 9, 5099–5148. [Google Scholar] [CrossRef] [PubMed]
- Arshak, K.; Moore, E.; Lyons, G.M.; Harris, J.; Clifford, S. A review of gas sensors employed in electronic nose applications. Sens. Rev. 2004, 24, 181–198. [Google Scholar] [CrossRef]
- Munoz, R.; Sivret, E.C.; Parcsi, G.; Lebrero, R.; Wang, X.; Suffet, I.H.; Stuetz, R.M. Monitoring techniques for odour abatement assessment. Water Res. 2010, 44, 5129–5149. [Google Scholar] [CrossRef] [PubMed]
- Gębicki, J. Application of electrochemical sensors and sensor matrixes for measurement of odorous chemical compounds. Trends Anal. Chem. 2016, 77, 1–13. [Google Scholar] [CrossRef]
- Fend, R.; Bessant, C.; Williams, A.J.; Woodman, A.C. Monitoring haemodialysis using electronic nose and chemometrics. Biosens. Bioelectron. 2004, 19, 1581–1590. [Google Scholar] [CrossRef] [PubMed]
- Bernabei, M.; Pennazza, G.; Santonico, M.; Corsi, C.; Roscioni, C.; Paolesse, R.; Di Natale, C.; D’Amico, A. A preliminary study on the possibility to diagnose urinary tract cancers by an electronic nose. Sens. Actuators B Chem. 2008, 131, 1–4. [Google Scholar] [CrossRef]
- D’Amico, A.; Pennazza, G.; Santonico, M.; Martinelli, E.; Roscioni, C.; Galluccio, G.; Paolesse, R.; Di Natale, C. An investigation on electronic nose diagnosis of lung cancer. Lung Cancer 2010, 68, 170–176. [Google Scholar] [CrossRef] [PubMed]
- Wilson, A.D. Biomarker metabolite signatures pave the way for electronic-nose applications in early clinical disease diagnoses. Curr. Metabol. 2017, 5, 90–101. [Google Scholar] [CrossRef]
- Stuetz, R.M.; Fenner, R.A.; Engin, G. Characterisation of wastewater using an electronic nose. Water Res. 1999, 33, 442–452. [Google Scholar] [CrossRef]
- Dang, L.; Tian, F.; Zhang, L.; Kadri, Ch.; Yin, X.; Peng, X.; Liu, S. A novel classifier ensemble for recognition of multiple indoor air contaminants by an electronic nose. Sens. Actuators B Chem. 2014, 207, 67–74. [Google Scholar] [CrossRef]
- Rudnitskaya, A.; Legin, A. Sensor systems, electronic tongues and electronic noses, for the monitoring of biotechnological processes. J. Ind. Microbiol. Biotechnol. 2008, 35, 443–451. [Google Scholar] [CrossRef] [PubMed]
- Rajamaki, T.; Arnold, M.; Venelampi, O.; Vikman, M.; Rasanen, J.; Itavaara, M. An electronic nose and indicator volatiles for monitoring of the composting process. Water Air Soil Pollut. 2005, 1, 71–87. [Google Scholar] [CrossRef]
- Capelli, L.; Sironi, S.; Del Rosso, R. Electronic Noses for Environmental Monitoring Applications. Sensors 2014, 14, 19979–20007. [Google Scholar] [CrossRef] [PubMed]
- Gębicki, J.; Dymerski, T.; Namieśnik, J. Investigation of Air Quality beside a Municipal Landfill: The Fate of Malodour Compounds as a Model VOC. Environments 2017, 4, 7. [Google Scholar] [CrossRef]
- Deshmukh, S.; Bandyopadhyay, R.; Bhattacharyya, N.; Pandey, R.A.; Jana, A. Application of electronic nose for industrial odors and gaseous emissions measurement and monitoring—An overview. Talanta 2015, 144, 329–340. [Google Scholar] [CrossRef] [PubMed]
- Bourgeois, W.; Stuetz, R.M. Measuring wastewater quality using a sensor array prospects for real-time monitoring. Water Sci. Technol. 2000, 41, 107–112. [Google Scholar]
- Baldwin, E.A.; Bai, J.; Plotto, A.; Dea, S. Electronic noses and tongues: Applications for the food and pharmaceutical industries. Sensors 2011, 11, 4744–4766. [Google Scholar] [CrossRef] [PubMed]
- El Barbri, N.; Llobet, E.; El Bari, N.; Correig, X.; Bouchikhi, B. Electronic nose based on metal oxide semiconductor sensors as an alternative technique for the spoilage classification of red meat. Sensors 2008, 8, 142–156. [Google Scholar] [CrossRef] [PubMed]
- Cynkar, W.; Cozzolino, D.; Dambergs, B.; Janik, L.; Gishen, M. Feasibility study on the use of a head space mass spectrometry electronic nose (MS e-nose) to monitor red wine spoilage induced by Brettanomyces yeast. Sens. Actuators B Chem. 2007, 124, 167–171. [Google Scholar] [CrossRef]
- Dymerski, T.; Gębicki, J.; Wardencki, W.; Namieśnik, J. Application of an electronic nose instrument to fast classification of polish honey types. Sensors 2014, 14, 10709–10724. [Google Scholar] [CrossRef] [PubMed]
- Wilson, A.D. Electronic-nose applications in forensic science and for analysis of volatile biomarkers in the human breath. J. Forensic Sci. Criminol. 2014, 1, 1–21. [Google Scholar]
- Haddi, Z.; Amari, A.; Alami, H.; El Bari, N.; Llobet, E.; Bouchikhi, B. A portable electronic nose system for the identification of cannabis-based drugs. Sens. Actuators B Chem. 2011, 155, 456–463. [Google Scholar] [CrossRef]
- Brudzewski, K.; Osowski, S.; Pawłowski, W. Metal oxide sensor arrays for detection of explosives at sub-parts-per million concentration levels by the differential electronic nose. Sens. Actuators B Chem. 2012, 161, 528–533. [Google Scholar] [CrossRef]
- Alizadeh, T.; Zeynali, S. Electronic nose based on the polymer coated SAW sensors array for the warfare agent simulants classification. Sens. Actuators B Chem. 2008, 129, 412–423. [Google Scholar] [CrossRef]
- Spinelle, L.; Gerboles, M.; Kok, G.; Persijn, S.; Sauerwald, T. Review of portable and low-cost sensors for the ambient air monitoring of benzene and other volatile organic compounds. Sensors 2017, 17, 1520. [Google Scholar] [CrossRef] [PubMed]
- Szulczyński, B.; Gębicki, J. Currently commercially available chemical sensors employed for detection of volatile organic compounds in outdoor and indoor air. Environments 2017, 4, 21. [Google Scholar] [CrossRef]
- Güntner, A.T.; Koren, V.; Chikkadi, K.; Righettoni, M.; Pratsinis, S.E. E-nose sensing of low-ppb formaldehyde in gas mixtures at high relative humidity for breath screening of lung cancer? ACS Sens. 2016, 1, 528–535. [Google Scholar] [CrossRef]
- Güntner, A.T.; Sievi, N.A.; Theodore, S.J.; Gulich, T.; Kohler, M.; Pratsinis, S.E. Non-invasive body fat burn monitoring from exhaled acetone with Si-doped WO3 sensing nanoparticles. Anal. Chem. 2017, 89, 10578–10584. [Google Scholar] [CrossRef] [PubMed]
- Zou, Z.; Buck, L.B. Combinatorial effects of odorant mixes in olfactory cortex. Science 2006, 311, 1477–1481. [Google Scholar] [CrossRef] [PubMed]
- Berglund, B.; Olsson, M.J. A Theoretical and Empirical Evaluation of Perceptual and Psychphisical Models for Odor-Intensity Interaction; No. 764; Stockholm University: Stockholm, Sweden, 1993. [Google Scholar]
- Willing, B.-I.L.; Brundin, A.; Lundström, I. Odour analysis of paperboard, the correlation between human senses and electronic sensors using multivariate analysis. Packag. Technol. Sci. 1998, 11, 59–67. [Google Scholar] [CrossRef]
- Hill, D.T.; Barth, C.L. Quantitative prediction of odor intensity. Trans. ASAE 1976, 19, 939–944. [Google Scholar] [CrossRef]
- Pearce, T.C.; Gardner, J.W. Predicting organoleptic scores of sub-ppm flavour notes Part 2. Computational analysis and results. Analyst 1998, 123, 2057–2066. [Google Scholar] [CrossRef]
- Pearce, T.C.; Gardner, J.W. Predicting organoleptic scores of sub-ppm flavour notes Part 1. Theoretical and experimental details. Analyst 1998, 123, 2047–2055. [Google Scholar] [CrossRef]
- Yan, L.; Liu, J.; Fang, D. Use of a modified vector model for odor intensity prediction of odorant mixtures. Sensors 2015, 15, 5697–5709. [Google Scholar] [CrossRef] [PubMed]
- Yan, L.; Liu, J.; Jiang, S.; Wu, Ch.; Gao, K. The Regular Interaction Pattern among Odorants of the Same Type and Its Application in Odor Intensity Assessment. Sensors 2017, 17, 1624. [Google Scholar] [CrossRef] [PubMed]
- Laffort, P. Models for describing intensity interactions in odor mixtures: A reappraisal. In Perception of Complex Smells and Tastes; Laing, D.G., Cain, W.S., McBride, R.L., Ache, B.W., Eds.; Academic Press: New York, NY, USA, 1989; pp. 205–223. ISBN 012042990X. [Google Scholar]
- Laffort, P. The application of synergy and inhibition phenomena to odor reduction. In Characterization and Control of Odours and VOC in the Process Industries; Vigneron, S., Hermia, J., Chaouki, J., Eds.; Elsevier: Amsterdam, The Netherlands, 1994; pp. 105–117. ISBN 9780080875200. [Google Scholar]
- Laffort, P.; Dravnieks, A. Several models of suprathreshold quantitative olfactory interaction in humans applied to binary, ternary and quaterny mixtures. Chem. Senses 1982, 7, 153–174. [Google Scholar] [CrossRef]
- Berglund, B.; Berglund, U.; Lindvall, T.; Svensson, L.T. A quantitative principle of perceived intensity summation in odor mixtures. J. Exp. Psychol. 1973, 100, 29–38. [Google Scholar] [CrossRef]
- Gebicki, J.; Szulczynski, B.; Kaminski, M. Determinationn of authenticity of brand perfume using electronic nose prototypes. Meas. Sci. Technol. 2015, 26, 125103. [Google Scholar] [CrossRef]
- López, R.; Cabeza, I.O.; Giráldez, I.; Díaz, M.J. Biofiltration of composting gases using different municipal solid waste-pruning residue composts: Monitoring by using an electronic nose. Bioresour. Technol. 2011, 102, 7984–7993. [Google Scholar] [CrossRef] [PubMed]
- Romain, A.-C.; Nicolas, J.; Cobut, P.; Delva, J.; Nicks, B.; Philippe, F.-X. Continuous odour measurement from fattening pig units. Atmos. Environ. 2013, 77, 935–942. [Google Scholar] [CrossRef]
- Cabeza, I.O.; López, R.; Giraldez, I.; Stuetz, R.M.; Díaz, M.J. Biofiltration of α-pinenevapours using municipal solid waste (MSW)–Pruning residues (P) composts as packing materials. Chem. Eng. J. 2013, 233, 149–158. [Google Scholar] [CrossRef]
- Delgado-Rodríguez, M.; Ruiz-Montoya, M.; Giraldez, I.; López, R.; Madejón, E.; Díaz, M.J. Use of electronic nose and GC-MS in detection and monitoring some VOC. Atmos. Environ. 2012, 51, 278–285. [Google Scholar] [CrossRef]
- Littarru, P. Environmental odours assessment from waste treatment plants: Dynamic olfactometry in combination with sensorial analysers “electronic noses”. Waste Manag. 2007, 27, 302–309. [Google Scholar] [CrossRef] [PubMed]
- Sohn, J.H.; Dunlop, M.; Hudson, N.; Kim, T.I.; Yoo, Y.H. Non-specific conducting polymer-based array capable of monitoring odour emissions from a biofiltration system in a piggery building. Sens. Actuators B Chem. 2009, 135, 455–464. [Google Scholar] [CrossRef]
- Nake, A.; Dubreuil, B.; Raynaud, C.; Talou, T. Outdoor in situ monitoring of volatile emissions from wastewater treatment plants with two portable technologies of electronic noses. Sens. Actuators B Chem. 2005, 106, 36–39. [Google Scholar] [CrossRef]
- Boholt, K.; Andreasen, K.; den Berg, F.; Hansen, T. A new method for measuring emission of odour from a rendering plant using the Danish Odour Sensor System (DOSS) artificial nose. Sens. Actuators B Chem. 2005, 106, 170–176. [Google Scholar] [CrossRef]
- Hudon, G.; Guy, Ch.; Hermia, J. Measurement of odor intensity by an electronic nose. J. Air Waste Manag. Assoc. 2000, 50, 1750–1758. [Google Scholar] [CrossRef] [PubMed]
- Hellman, T.M.; Small, F.H. Characterization of the odor properties of 101 petrochemicals using sensory methods. J. Air Pollut. Control Assoc. 1974, 24, 979–982. [Google Scholar] [CrossRef] [PubMed]
- Leonardos, G.; Kendall, D.; Barnard, N. Odor threshold determinations of 53 odorant chemicals. J. Air Pollut. Control Assoc. 1969, 19, 91–95. [Google Scholar] [CrossRef]
- Nagata, Y.; Takeuchi, N. Measurement of odor threshold by triangle odor bag method. In Odor Measurement Review; Government of Japan: Tokyo, Japan, 2003; pp. 118–127. [Google Scholar]
- Hierlemann, A.; Gutierrez-Osuna, R. Higher-order chemical sensing. Chem. Rev. 2008, 108, 563–613. [Google Scholar] [CrossRef] [PubMed]
- Leffingwell, J.C.; Leffingwell, D. GRAS flavor chemicals-detection thresholds. Perfum. Flavor 1991, 16, 1–19. [Google Scholar]
- Amoore, J.E.; Hautala, E. Odor as an aid to chemical safety: Odor thresholds compared with threshold limit values and volatilities for 214 industrial chemicals in air and water dilution. J. Appl. Toxicol. 1983, 3, 272–290. [Google Scholar] [CrossRef] [PubMed]


| Substance | Odour Type | Vapour Pressure (hPa) | Olfactory Threshold in the Gas Phase (ppm) |
|---|---|---|---|
| Toluene | Pleasant and characteristic | 29 | 0.33–2.9 |
| Acetone | Fruity, sweet | 233 | 13–100 |
| Triethylamine | Fish, pungent | 72 | 0.000032–0.48 |
| Formaldehyde | Pungent, stifling | 1.4 | 0.5–1 |
| Butyric acid | Rancid, odour of sweat | 0.6 | 0.00019–0.001 |
| α-Pinene | Pine, resinous | 5 | 0.018 |
| Toluene | Acetone | Triethylamine | Formaldehyde | Butyric Acid | α-Pinene | ||
|---|---|---|---|---|---|---|---|
| Set A | C (ppm v/v) | 0.06–0.6 | 60–600 | 0.15–1.5 | |||
| I | 0–1 | 0–1 | 0–1 | ||||
| HT | −0.8–0 | −0.9–0 | −0.9–0 | ||||
| Set B | C (ppm v/v) | 0.4–3.7 | 390–3900 | 0.5–5.5 | |||
| I | 0.8–2 | 0.75–2 | 0.25–2 | ||||
| HT | −1.6–−0.6 | −1.75–−0.7 | −1.8–−0.2 | ||||
| Set C | C (ppm v/v) | 50–540 | 0.5–4.7 | 0.01–0.13 | |||
| I | 0–1 | 0–1 | 0–1 | ||||
| HT | −0.8–0 | −0.8–0 | 0–0.5 | ||||
| Set D | C (ppm v/v) | 360–3600 | 1.5–14.5 | 0.05–0.5 | |||
| I | 0.8–2 | 0–2 | 0.3–2 | ||||
| HT | −1.6–−0.6 | −1.6–0 | 0.15–1 |
| Substance | Experimental Olfactory Threshold (ppm v/v) | Theoretical Olfactory Threshold in Aqueous Solution (ppm v/v) |
|---|---|---|
| Toluene | 0.1 | 0.04 |
| Acetone | 100 | 20–500 |
| Triethylamine | 0.4 | 0.4 |
| Formaldehyde | 81 | 60 |
| Butyric acid | 1.5 | 0.24 |
| α-Pinene | 0.03 | 0.14 |
| Set | Odour Intensity | Hedonic Tone |
|---|---|---|
| Set A | 6 | 7 |
| Set B | 7 | 7 |
| Set C | 6 | 7 |
| Set D | 8 | 8 |
| Set | Odour Intensity | Hedonic Tone | ||
|---|---|---|---|---|
| Number | Percentage | Number | Percentage | |
| Set A | 4 | 80% | 4 | 67% |
| Set B | 6 | 75% | 6 | 60% |
| Set C | 4 | 80% | 4 | 57% |
| Set D | 6 | 75% | 8 | 73% |
| Odour Intensity | Hedonic Tone | |||||
|---|---|---|---|---|---|---|
| Set | RMSEP | Number of Optimum Factors | R2 | RMSEP | Number of Optimum Factors | R2 |
| Set A | 0.03 | 6 | 0.92 | 0.08 | 4 | 0.30 |
| Set B | 0.04 | 6 | 0.86 | 0.07 | 6 | 0.98 |
| Set C | 0.06 | 6 | 0.87 | 0.20 | 6 | 0.80 |
| Set D | 0.04 | 6 | 0.8 | 0.34 | 6 | 0.87 |
© 2017 by the authors. Licensee MDPI, Basel, Switzerland. This article is an open access article distributed under the terms and conditions of the Creative Commons Attribution (CC BY) license (http://creativecommons.org/licenses/by/4.0/).
Share and Cite
Szulczyński, B.; Namieśnik, J.; Gębicki, J. Determination of Odour Interactions of Three-Component Gas Mixtures Using an Electronic Nose. Sensors 2017, 17, 2380. https://doi.org/10.3390/s17102380
Szulczyński B, Namieśnik J, Gębicki J. Determination of Odour Interactions of Three-Component Gas Mixtures Using an Electronic Nose. Sensors. 2017; 17(10):2380. https://doi.org/10.3390/s17102380
Chicago/Turabian StyleSzulczyński, Bartosz, Jacek Namieśnik, and Jacek Gębicki. 2017. "Determination of Odour Interactions of Three-Component Gas Mixtures Using an Electronic Nose" Sensors 17, no. 10: 2380. https://doi.org/10.3390/s17102380
APA StyleSzulczyński, B., Namieśnik, J., & Gębicki, J. (2017). Determination of Odour Interactions of Three-Component Gas Mixtures Using an Electronic Nose. Sensors, 17(10), 2380. https://doi.org/10.3390/s17102380