Feasibility of Distributed Fiber Optic Sensor for Corrosion Monitoring of Steel Bars in Reinforced Concrete

Abstract
:1. Introduction
2. Distributed Fiber Optic Sensor
2.1. Working Principle
2.2. Optical Fiber
3. Materials
3.1. Concrete
3.2. Steel Bars
4. Experimental Study
4.1. Pull-Out Test
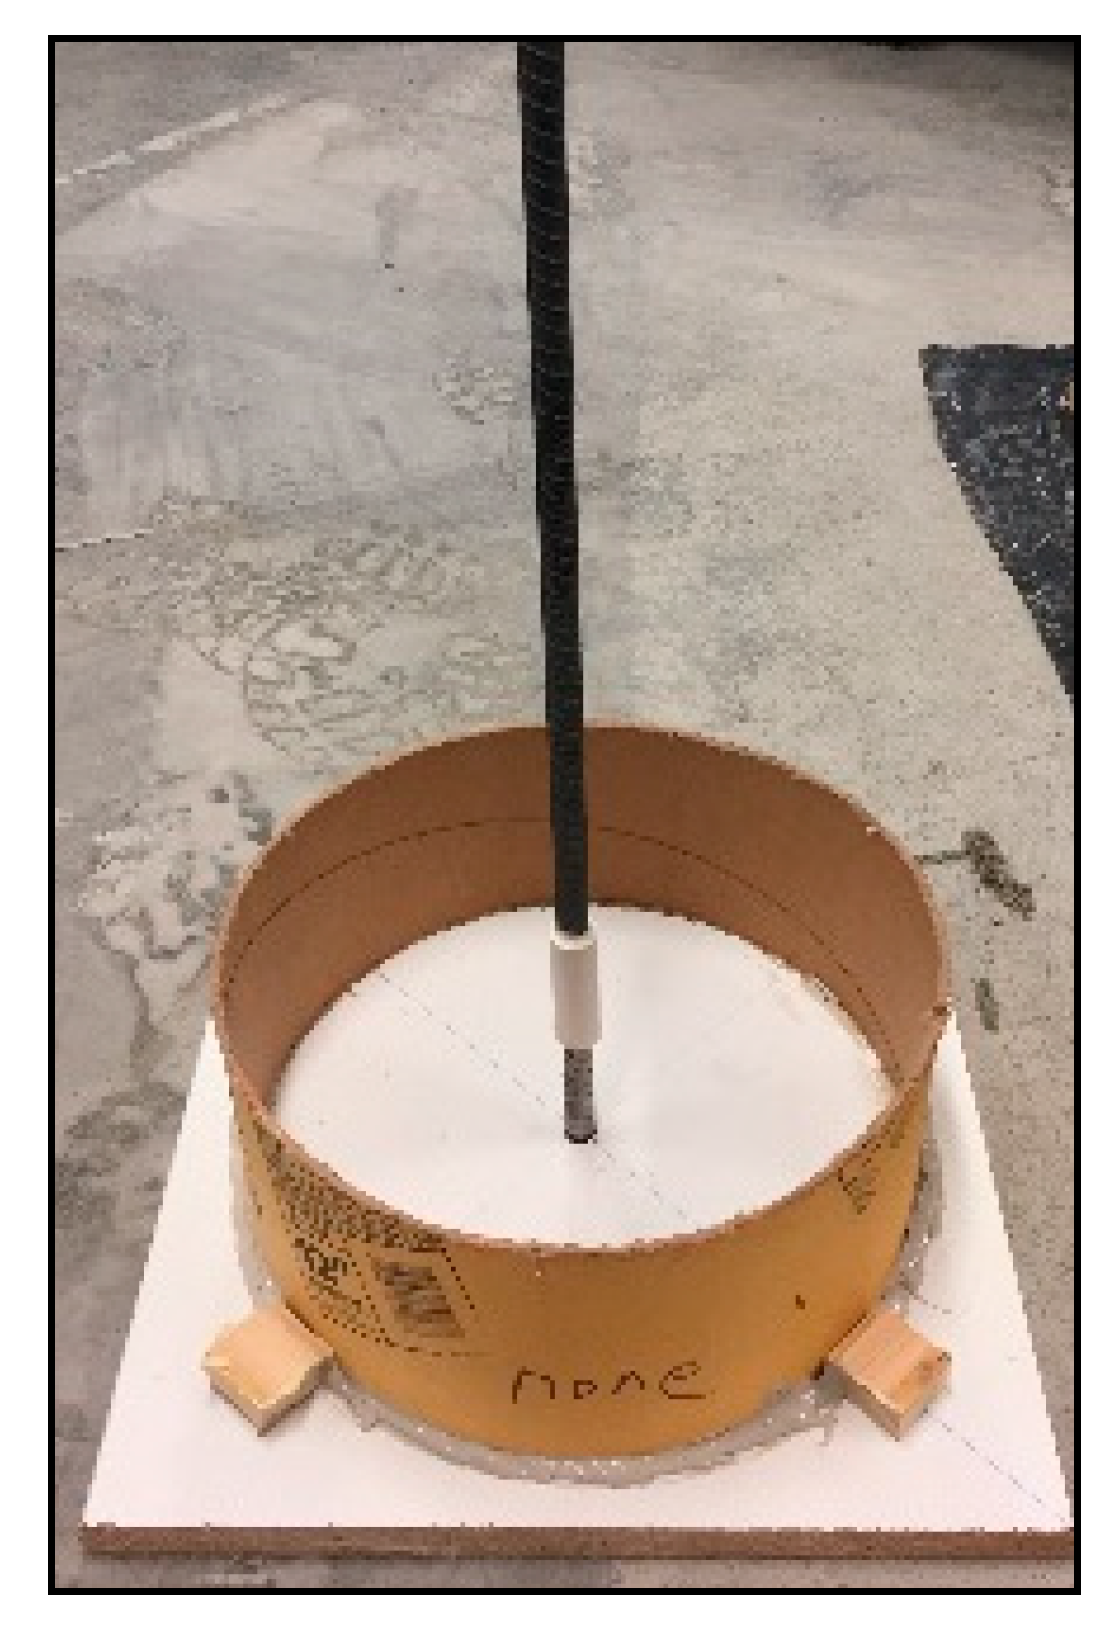
4.2. Corrosion Test
4.3. Corrosion Test
5. Results and Discussion
5.1. Pull-Out Test
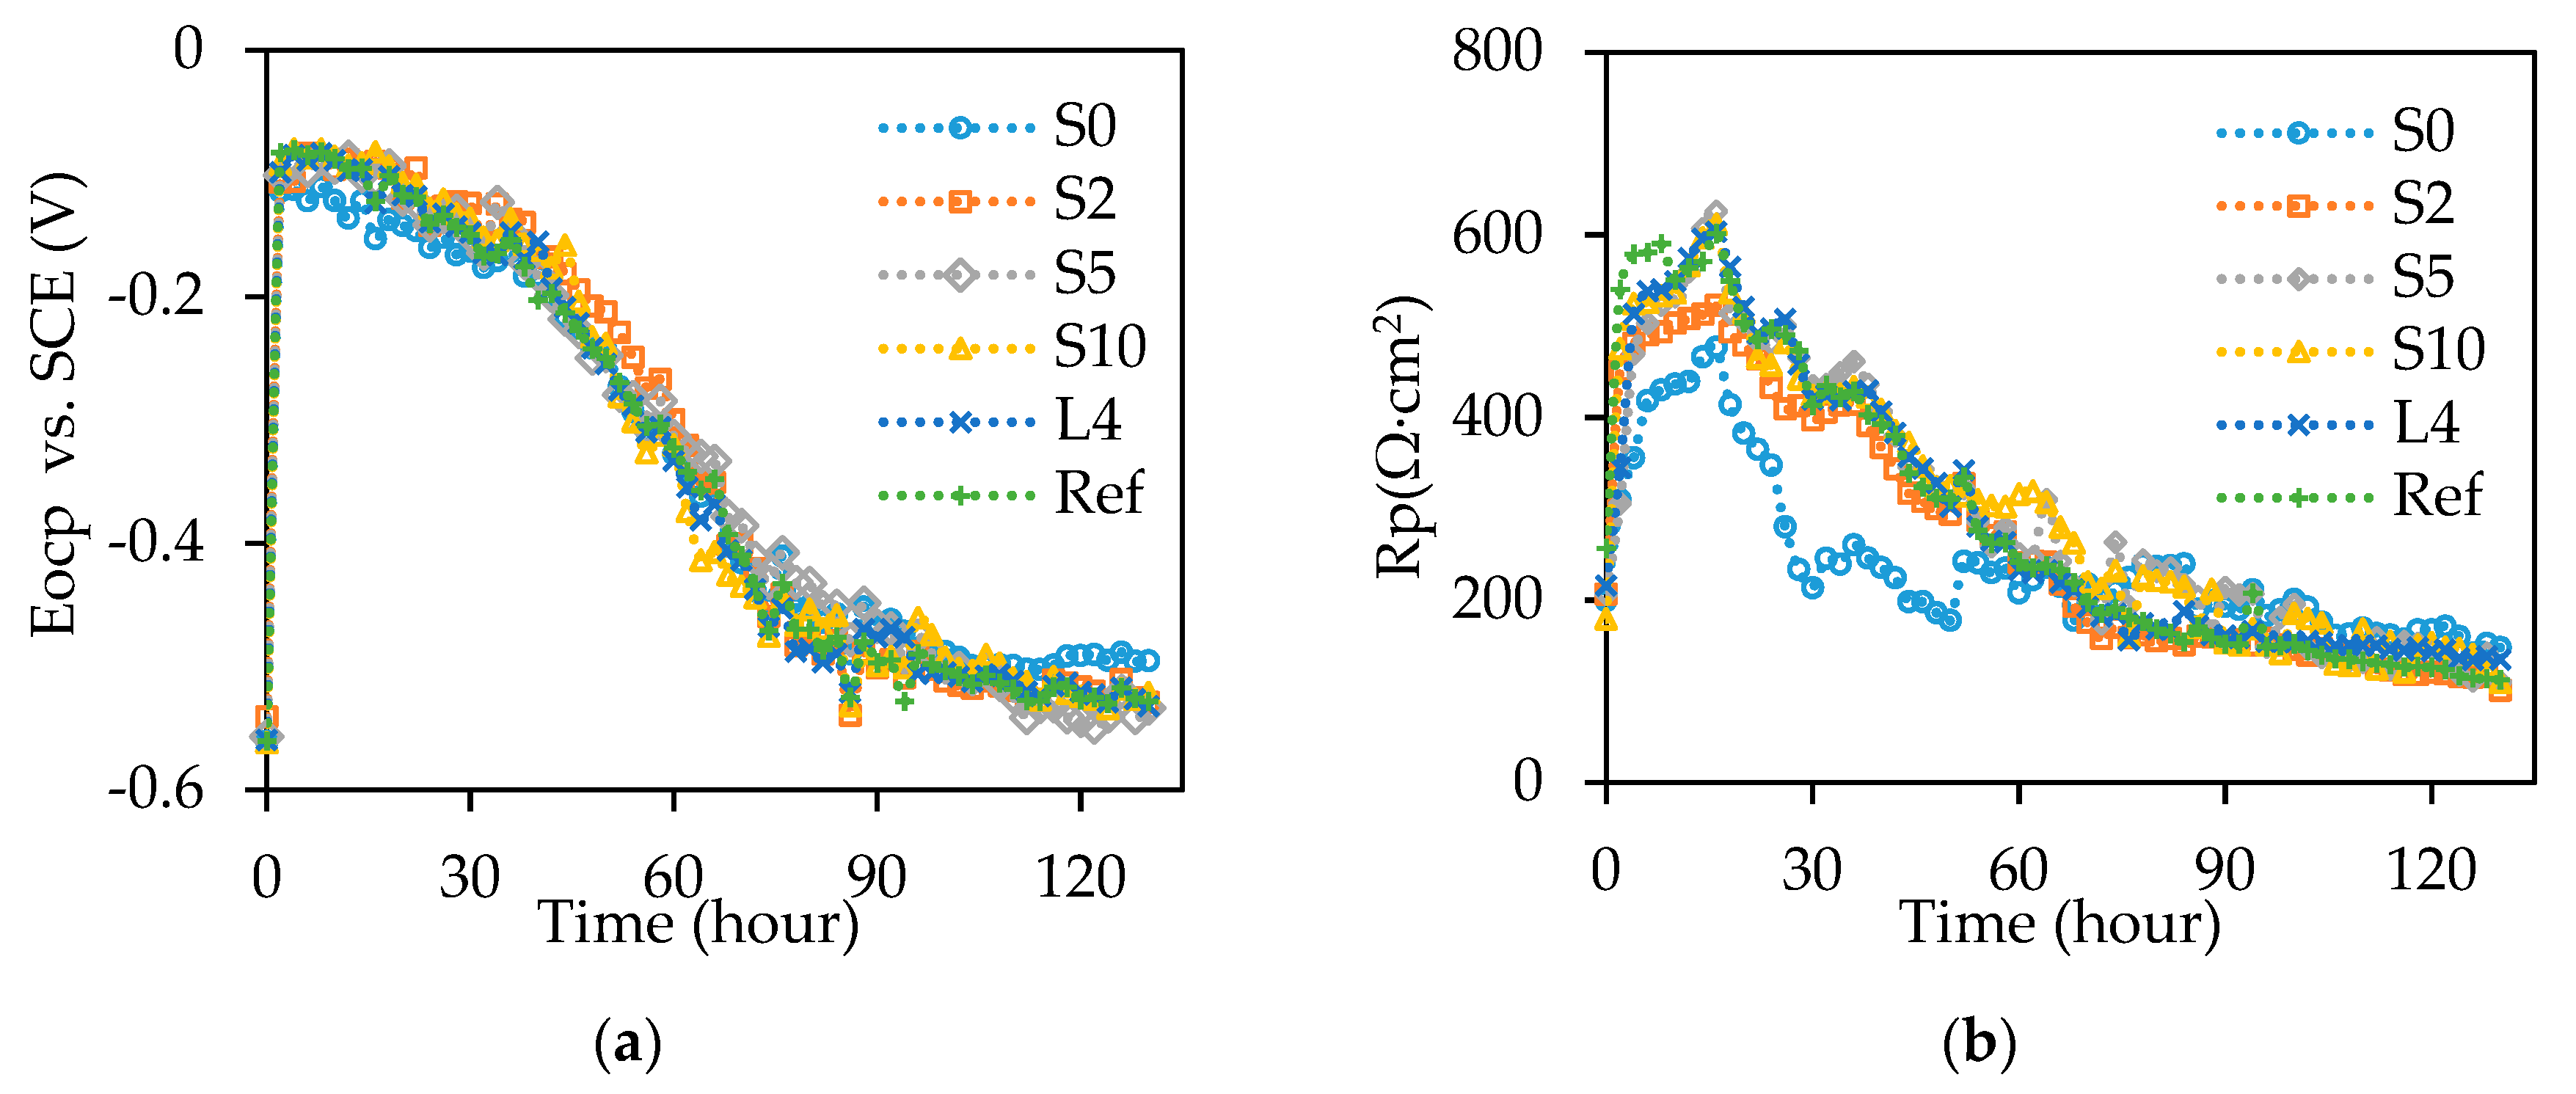
5.2. Electrochemical Test
5.3. Distributed Fiber Optic Sensor Measurement
5.4. Quantification of Corrosion Induced Volume Expansion
6. Conclusions
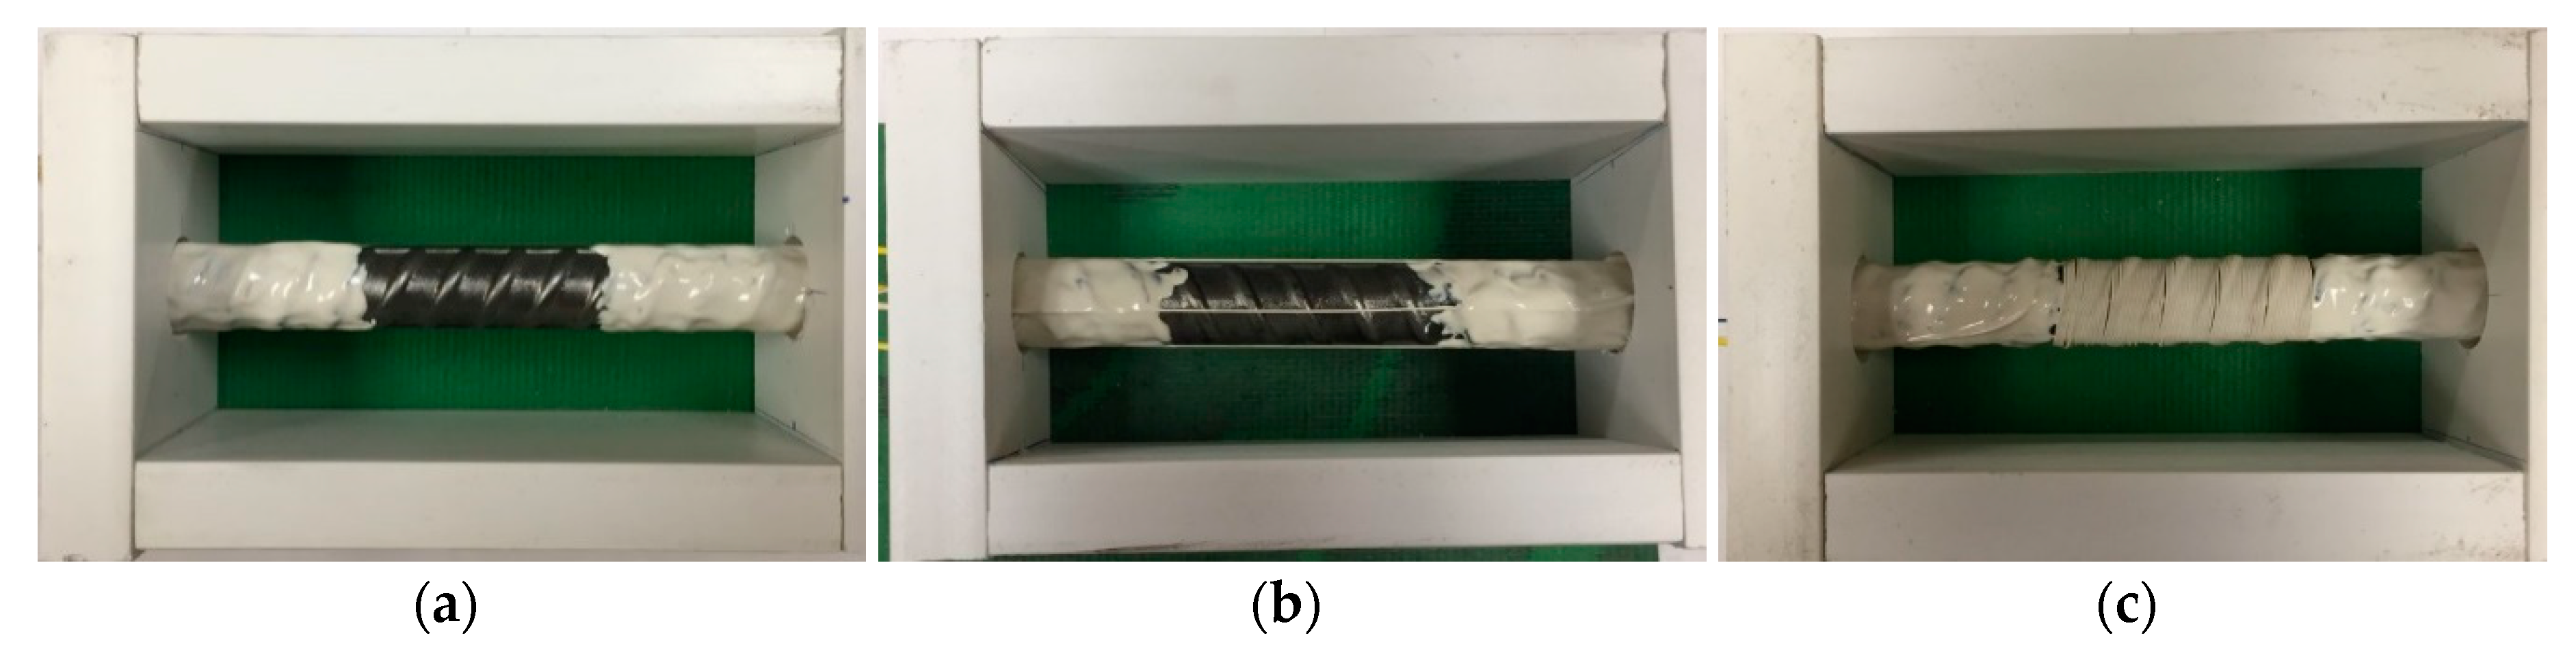
- Spirally winding the optical fiber on steel bar with a spacing of 10 mm does not compromise the bond strength of steel–concrete interface and the corrosion resistance of reinforced concrete beams. This indicates that the installation method of the distributed fiber optic sensor is plausible for corrosion monitoring of reinforced concrete.
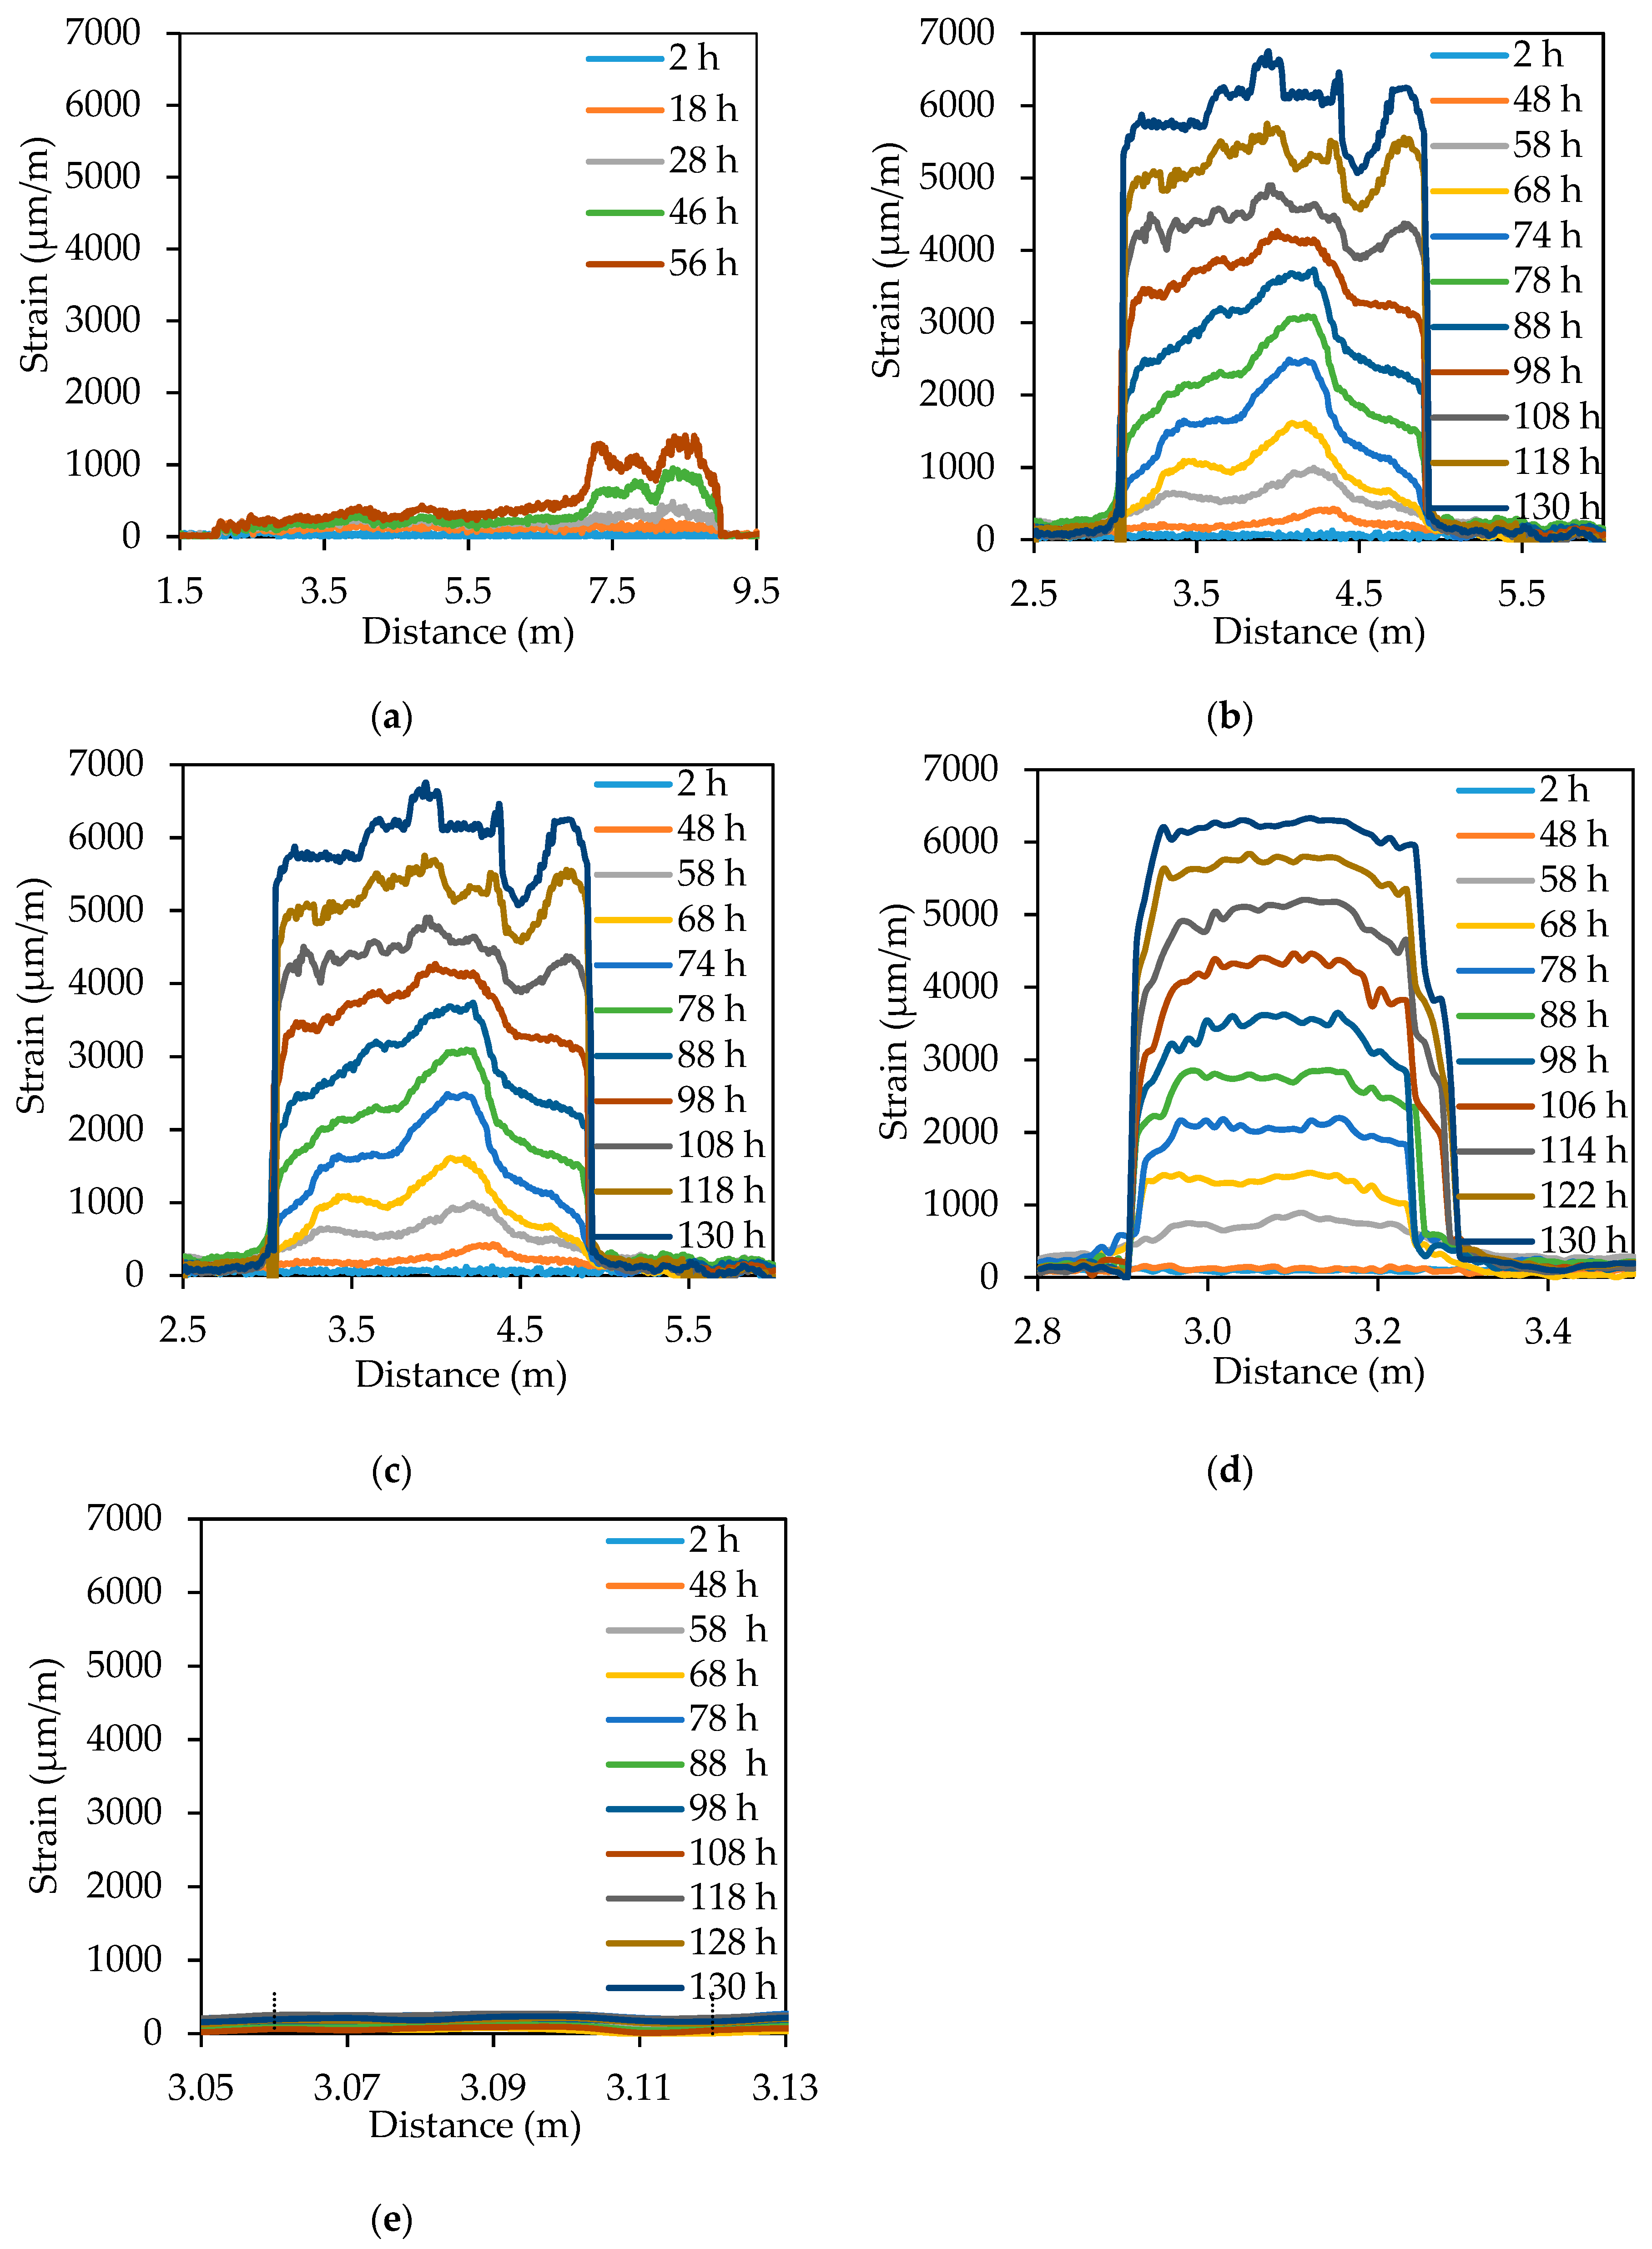
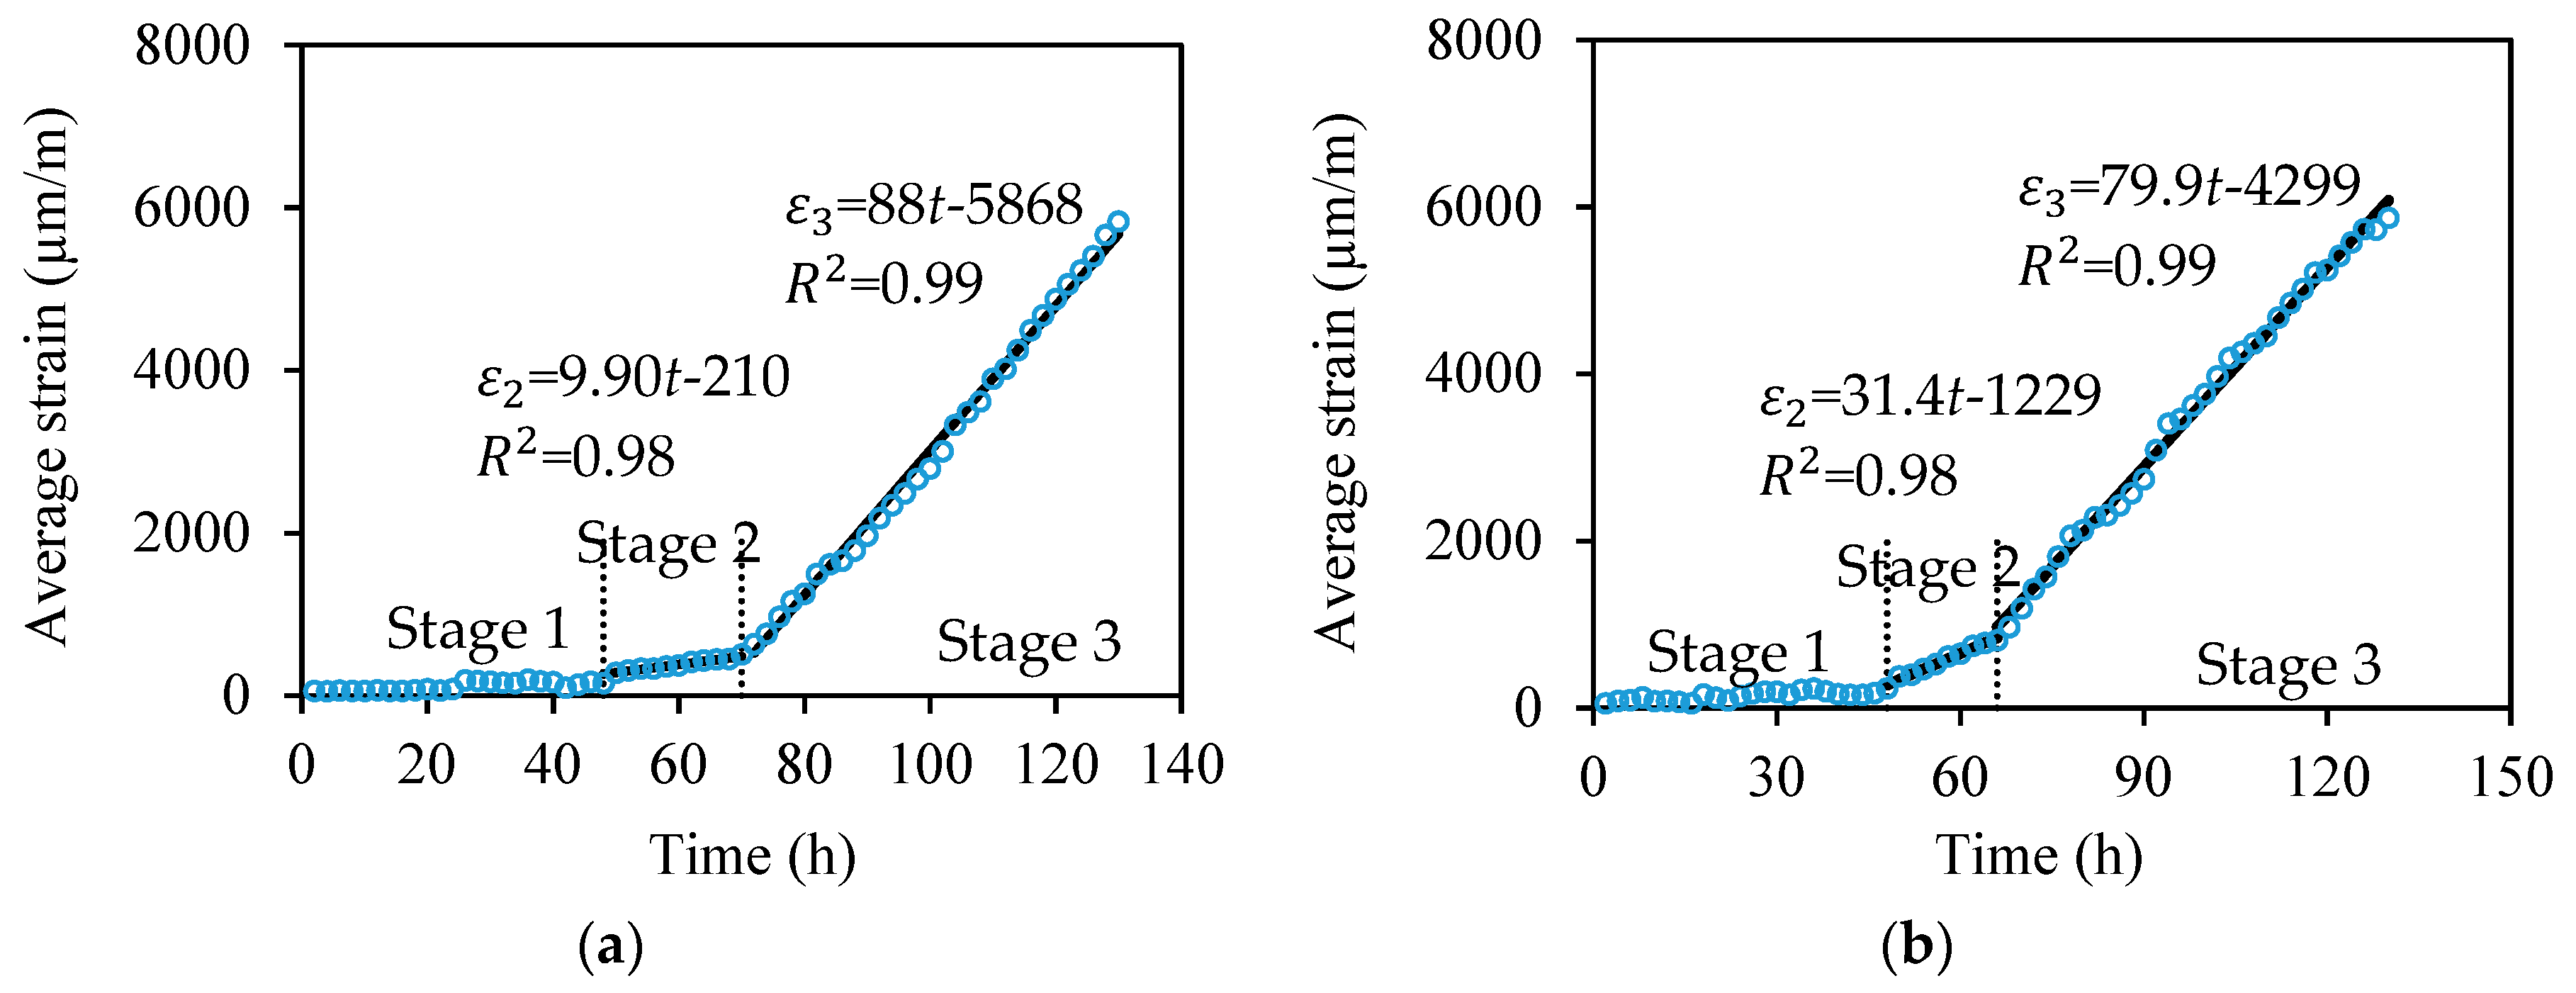
- According to the distributed sensor data, the corrosion process can be divided into three stages in terms of the strain increasing rate, thus experimentally verifying the three-stage theory. In Stage 1, the corrosion induced strain change is small (within 200 με). In Stage 2 and Stage 3, the strain approximately linearly increases with time. The strain increasing rate is higher in Stage 3 than that in Stage 2 due to the presence of concrete cracks.
- Using a winding spacing up to 5 mm reduces the bond strength of steel-concrete interface by 18%, and thus compromises the mechanical property of reinforced concrete. Distributed sensors along the steel bar is insensitive to the corrosion of the bar.
- The strain distributions measured from the distributed sensor can be used to quantify the corrosion condition. The corrosion layer thickness and volume can be estimated using the measured strain distributions.
- Further research is needed to test the performance of the proposed corrosion monitoring method using reinforced concrete under mechanical loading, and understand the effect of mechanical loading on the corrosion process.
Author Contributions
Funding
Conflicts of Interest
References
- Yu, H.; Shi, X.; Hartt, W.H.; Lu, B. Laboratory investigation of reinforcement corrosion initiation and chloride threshold content for self-compacting concrete. Cem. Concr. Res. 2010, 40, 1507–1516. [Google Scholar] [CrossRef]
- Li, W.; Xu, C.; Ho, S.C.M.; Wang, B.; Song, G. Monitoring concrete deterioration due to reinforcement corrosion by integrating acoustic emission and FBG strain measurements. Sensors 2017, 17, 657. [Google Scholar] [CrossRef] [PubMed]
- Nguyen, W.; Duncan, J.F.; Devine, T.M.; Ostertag, C.P. Electrochemical polarization and impedance of reinforced concrete and hybrid fiber-reinforced concrete under cracked matrix conditions. Electrochim. Acta 2018, 271, 319–336. [Google Scholar] [CrossRef] [Green Version]
- Nguyen, W.; Duncan, J.F.; Jen, G.; Ostertag, C.P. Influence of matrix cracking and hybrid fiber reinforcement on the corrosion initiation and propagation behaviors of reinforced concrete. Corros. Sci. 2018, 140, 168–181. [Google Scholar] [CrossRef]
- Stefanoni, M.; Angst, U.; Elsener, B. Corrosion rate of carbon steel in carbonated concrete—A critical review. Cem. Concr. Res. 2018, 103, 35–48. [Google Scholar] [CrossRef]
- Liu, Y.; Weyers, R.E. Modeling the time-to-corrosion cracking in chloride contaminated reinforced concrete structures. Mater. J. 1998, 95, 675–680. [Google Scholar]
- Elsener, B.; Andrade, C.; Gulikers, J.; Polder, R.; Raupach, M. Hall-cell potential measurements—Potential mapping on reinforced concrete structures. Mater. Struct. 2003, 36, 461–471. [Google Scholar] [CrossRef]
- Angst, U. Challenges and opportunities in corrosion of steel in concrete. Mater. Struct. 2018, 51, 4. [Google Scholar] [CrossRef]
- Stern, M.; Geary, A. Electrochemical polarization—1. A theoretical analysis of the shape of polarization curves. J. Electrochem. Soc. 1957, 104, 56–63. [Google Scholar] [CrossRef]
- Mansfeld, F. The effect of uncompensated IR-drop on polarization resistance measurements. Corrosion 1976, 32, 143–146. [Google Scholar] [CrossRef]
- Angst, U.; Büchler, M. On the applicability of the Stern–Geary relationship to determine instantaneous corrosion rates in macro-cell corrosion. Mater. Corros. 2015, 66, 1017–1028. [Google Scholar] [CrossRef]
- Zheng, Z.; Sun, X.; Lei, Y. Monitoring corrosion of reinforcement in concrete structures via fiber Bragg grating sensors. Front. Mech. Eng. China 2009, 4, 316–319. [Google Scholar] [CrossRef]
- Li, W.; Ho, S.C.M.; Song, G. Corrosion detection of steel reinforced concrete using combined carbon fiber and fiber Bragg grating active thermal probe. Smart Mater. Struct. 2016, 25, 045017. [Google Scholar] [CrossRef] [Green Version]
- Gao, J.; Wu, J.; Li, J.; Zhao, X. Monitoring of corrosion in reinforced concrete structure using Bragg grating sensing. NDT E Int. 2011, 44, 202–205. [Google Scholar] [CrossRef]
- Chen, Y.; Tang, F.; Bao, Y.; Chen, G.; Tang, Y. Fe-C coated long period fiber grating sensors for steel corrosion monitoring. Opt. Lett. 2016, 41, 344–346. [Google Scholar]
- Huang, Y.; Gao, Z.; Zhou, Z.; Chen, G. Long period fiber grating sensors coated with nano iron/silica particles for corrosion monitoring. Smart Mater. Struct. 2013, 22, 075018. [Google Scholar] [CrossRef]
- Huang, Y.; Tang, F.; Liang, X.; Chen, G.; Xiao, H.; Azarmi, F. Steel bar corrosion monitoring with long period fiber grating sensors coated with nano iron/silica particles and polyurethane. Struct. Health Monit. 2015, 14, 075018. [Google Scholar] [CrossRef]
- Bao, Y.; Chen, G. Strain distribution and crack detection in thin unbonded concrete pavement overlays with fully distributed fiber optic sensors. Opt. Eng. 2015, 55, 011008. [Google Scholar] [CrossRef]
- Bao, Y.; Tang, F.; Chen, Y.; Meng, W.; Huang, Y.; Chen, G. Concrete pavement monitoring with PPP-BOTDA distributed strain and crack sensors. Smart Struct. Syst. 2016, 18, 405–423. [Google Scholar] [CrossRef]
- Bao, Y.; Valipour, M.; Meng, W.; Khayat, K.H.; Chen, G. Distributed fiber optic sensor-enhanced detection and prediction of shrinkage-induced delamination of ultra-high-performance concrete bonded over an existing concrete substrate. Smart Mater. Struct. 2017, 26, 085009. [Google Scholar] [CrossRef]
- Bao, Y.; Hoehler, M.S.; Smith, C.M.; Bundy, M.; Chen, G. Temperature measurement and damage detection in concrete beams exposed to fire using PPP-BOTDA based fiber optic sensors. Smart Mater. Struct. 2017, 26, 105034. [Google Scholar] [CrossRef] [PubMed] [Green Version]
- Zhao, X.; Gong, P.; Qiao, G.; Lu, J.; Lv, X.; Ou, J. Brillouin corrosion expansion sensors for steel reinforced concrete structures using a fiber optic coil winding method. Sensors 2011, 11, 10798–10819. [Google Scholar] [CrossRef] [PubMed]
- Mao, J.; Chen, J.; Cui, L.; Jin, W.; Xu, C.; He, Y. Monitoring the corrosion process of reinforced concrete using BOTDA and FBG sensors. Sensors 2015, 15, 8866–8883. [Google Scholar] [CrossRef] [PubMed]
- Bao, Y.; Chen, G. Temperature-dependent strain and temperature sensitivities of fused silica single mode fiber sensors with pulse pre-pump Brillouin optical time domain analysis. Meas. Sci. Technol. 2016, 27, 65101–65111. [Google Scholar] [CrossRef]
- Bao, Y.; Chen, G. High temperature measurement with Brillouin optical time domain analysis. Opt. Lett. 2016, 41, 3177–3180. [Google Scholar] [CrossRef] [PubMed]
- Bao, X.; Chen, L. Recent progress in Brillouin scattering based fiber sensors. Sensors 2011, 11, 4152–4187. [Google Scholar] [CrossRef] [PubMed]
- ASTM. Strandard test method for compressive strength of cylindrical concrete specimens. In American Society for Testing and Materials (ASTMs) C39/C39M-18; ASTM: West Conshohocken, PA, USA, 2018. [Google Scholar]
- ASTM. Standard test method for splitting tensile strength of cylindrical concrete specimens. In American Society for Testing and Materials (ASTMs) C496/C496M-17; ASTM: West Conshohocken, PA, USA, 2017. [Google Scholar]
- ASTM. Standard specification for deformed and plain carbon-steel bars for concrete reinforcement. In American Society for Testing and Materials (ASTMs) A615/A615M-13; ASTM: West Conshohocken, PA, USA, 2013. [Google Scholar]
- RILEM 7-II-128. RC6: Bond test for reinforcing steel. 1. Pull-out test. In RILEM Technical Recommendations for the Testing and Use of Construction Materials; CRC Press: London, UK, 1994; pp. 102–105. [Google Scholar]
- Li, X.; Bao, Y.; Xue, N.; Chen, G. Bond strength of steel bars embedded in high-performance fiber-reinforced cementitious composite before and after exposure to elevated temperatures. Fire Saf. J. 2017, 92, 98–106. [Google Scholar] [CrossRef]
- Fan, L.; Tang, F.; Reis, S.T.; Chen, G.; Koenigstein, M.L. Corrosion resistance of transmission pipeline steel coated with five types of enamels. Acta Metall. Sin. Engl. Lett. 2017, 30, 390–398. [Google Scholar] [CrossRef]
- Malumbela, G.; Moyo, P.; Alexander, M. A step towards standardising accelerated corrosion tests on laboratory reinforced concrete specimens. J. S. Afr. Inst. Civ. Eng. 2012, 54, 78–85. [Google Scholar]
- Patil, S.; Karkare, B.; Goyal, S. Acoustic emission vis-à-vis electrochemical techniques for corrosion monitoring of reinforced concrete element. Constr. Build. Mater. 2014, 68, 326–332. [Google Scholar] [CrossRef]
- Caré, S.; Raharinaivo, A. Influence of impressed current on the initiation of damage in reinforced mortar due to corrosion of embedded steel. Cem. Concr. Res. 2007, 37, 1598–1612. [Google Scholar] [CrossRef]
- Tang, F.; Bao, Y.; Chen, Y.; Tang, Y.; Chen, G. Impact and corrosion resistances of duplex epoxy/enamel coated plates. Constr. Build. Mater. 2016, 112, 7–18. [Google Scholar] [CrossRef]


| SiO2 | Al2O3 | Fe2O3 | CaO | MgO | SO3 | Loss of Ignition |
|---|---|---|---|---|---|---|
| 19.8 | 4.5 | 3.2 | 64.2 | 2.7 | 3.4 | 2.6 |
| Alite (C3S) | Belite (C2S) | Aluminate (C3A) | Ferrite (C4AF) | Gypsum (C$.2H) |
|---|---|---|---|---|
| 3.2 | 64.2 | 2.7 | 3.4 | 2.6 |
| Water | 0.5 |
| Ordinary Portland cement | 1.0 |
| Missouri river sand | 2.0 |
| Coarse aggregate | 2.5 |
| Element | C | Si | Mn | P | S | Cr | Mo | Ni | Co | Cu | V | Sn | Fe |
|---|---|---|---|---|---|---|---|---|---|---|---|---|---|
| Wt.% | 0.38 | 0.18 | 1.00 | 0.12 | 0.06 | 0.10 | 0.07 | 0.20 | 0.01 | 0.37 | 0.02 | 0.03 | 97.40 |
| Designation | Stage | Duration (h) | Δm (g) | rn (mm) | r0–rn (mm) | TCL-total (mm) | VCL-total (mm3) |
|---|---|---|---|---|---|---|---|
| S2 | 1 | 48 | 0.15 | 9.518 | 0.032 | 0.202 | 122 |
| 2 | 18 | 0.05 | 9.506 | 0.044 | 0.818 | 510 | |
| 3 | 64 | 0.20 | 9.465 | 0.085 | 5.894 | 4594 | |
| S5 | 1 | 48 | 0.15 | 9.518 | 0.032 | 0.177 | 107 |
| 2 | 18 | 0.05 | 9.506 | 0.044 | 0.845 | 527 | |
| 3 | 64 | 0.20 | 9.465 | 0.085 | 5.854 | 4556 | |
| S10 | 1 | 48 | 0.15 | 9.518 | 0.032 | 0.150 | 91 |
| 2 | 18 | 0.05 | 9.506 | 0.044 | 1.131 | 716 | |
| 3 | 64 | 0.20 | 9.465 | 0.085 | 5.909 | 4608 |
© 2018 by the authors. Licensee MDPI, Basel, Switzerland. This article is an open access article distributed under the terms and conditions of the Creative Commons Attribution (CC BY) license (http://creativecommons.org/licenses/by/4.0/).
Share and Cite
Fan, L.; Bao, Y.; Chen, G. Feasibility of Distributed Fiber Optic Sensor for Corrosion Monitoring of Steel Bars in Reinforced Concrete. Sensors 2018, 18, 3722. https://doi.org/10.3390/s18113722
Fan L, Bao Y, Chen G. Feasibility of Distributed Fiber Optic Sensor for Corrosion Monitoring of Steel Bars in Reinforced Concrete. Sensors. 2018; 18(11):3722. https://doi.org/10.3390/s18113722
Chicago/Turabian StyleFan, Liang, Yi Bao, and Genda Chen. 2018. "Feasibility of Distributed Fiber Optic Sensor for Corrosion Monitoring of Steel Bars in Reinforced Concrete" Sensors 18, no. 11: 3722. https://doi.org/10.3390/s18113722