Author Contributions
Qingzhao Kong and Baoxin Qi designed the experiments; Baoxin Qi, Hui Qian, Ing Lim, and Devendra Patil prepared the specimens, performed the experiments and collected the data. Qingzhao Kong and Baoxin Qi analyzed the data and wrote the manuscript; Gangbing Song, Mo Li, and Dong Liu developed the concept, designed the transducers, and made major revision of the manuscript.
Figure 1.
Embedded polyvinylidene fluoride (PVDF) thin-film sensor: (a) photo and (b) internal structure.
Figure 1.
Embedded polyvinylidene fluoride (PVDF) thin-film sensor: (a) photo and (b) internal structure.
Figure 2.
Smart aggregate (a) photo and (b) internal structure.
Figure 2.
Smart aggregate (a) photo and (b) internal structure.
Figure 3.
Detailed sensor location (unit: mm).
Figure 3.
Detailed sensor location (unit: mm).
Figure 4.
Specimen preparation. (a) molds with pre-installed PVDF sensors and smart aggregates (b) casted PVA-ECC and mortar beams.
Figure 4.
Specimen preparation. (a) molds with pre-installed PVDF sensors and smart aggregates (b) casted PVA-ECC and mortar beams.
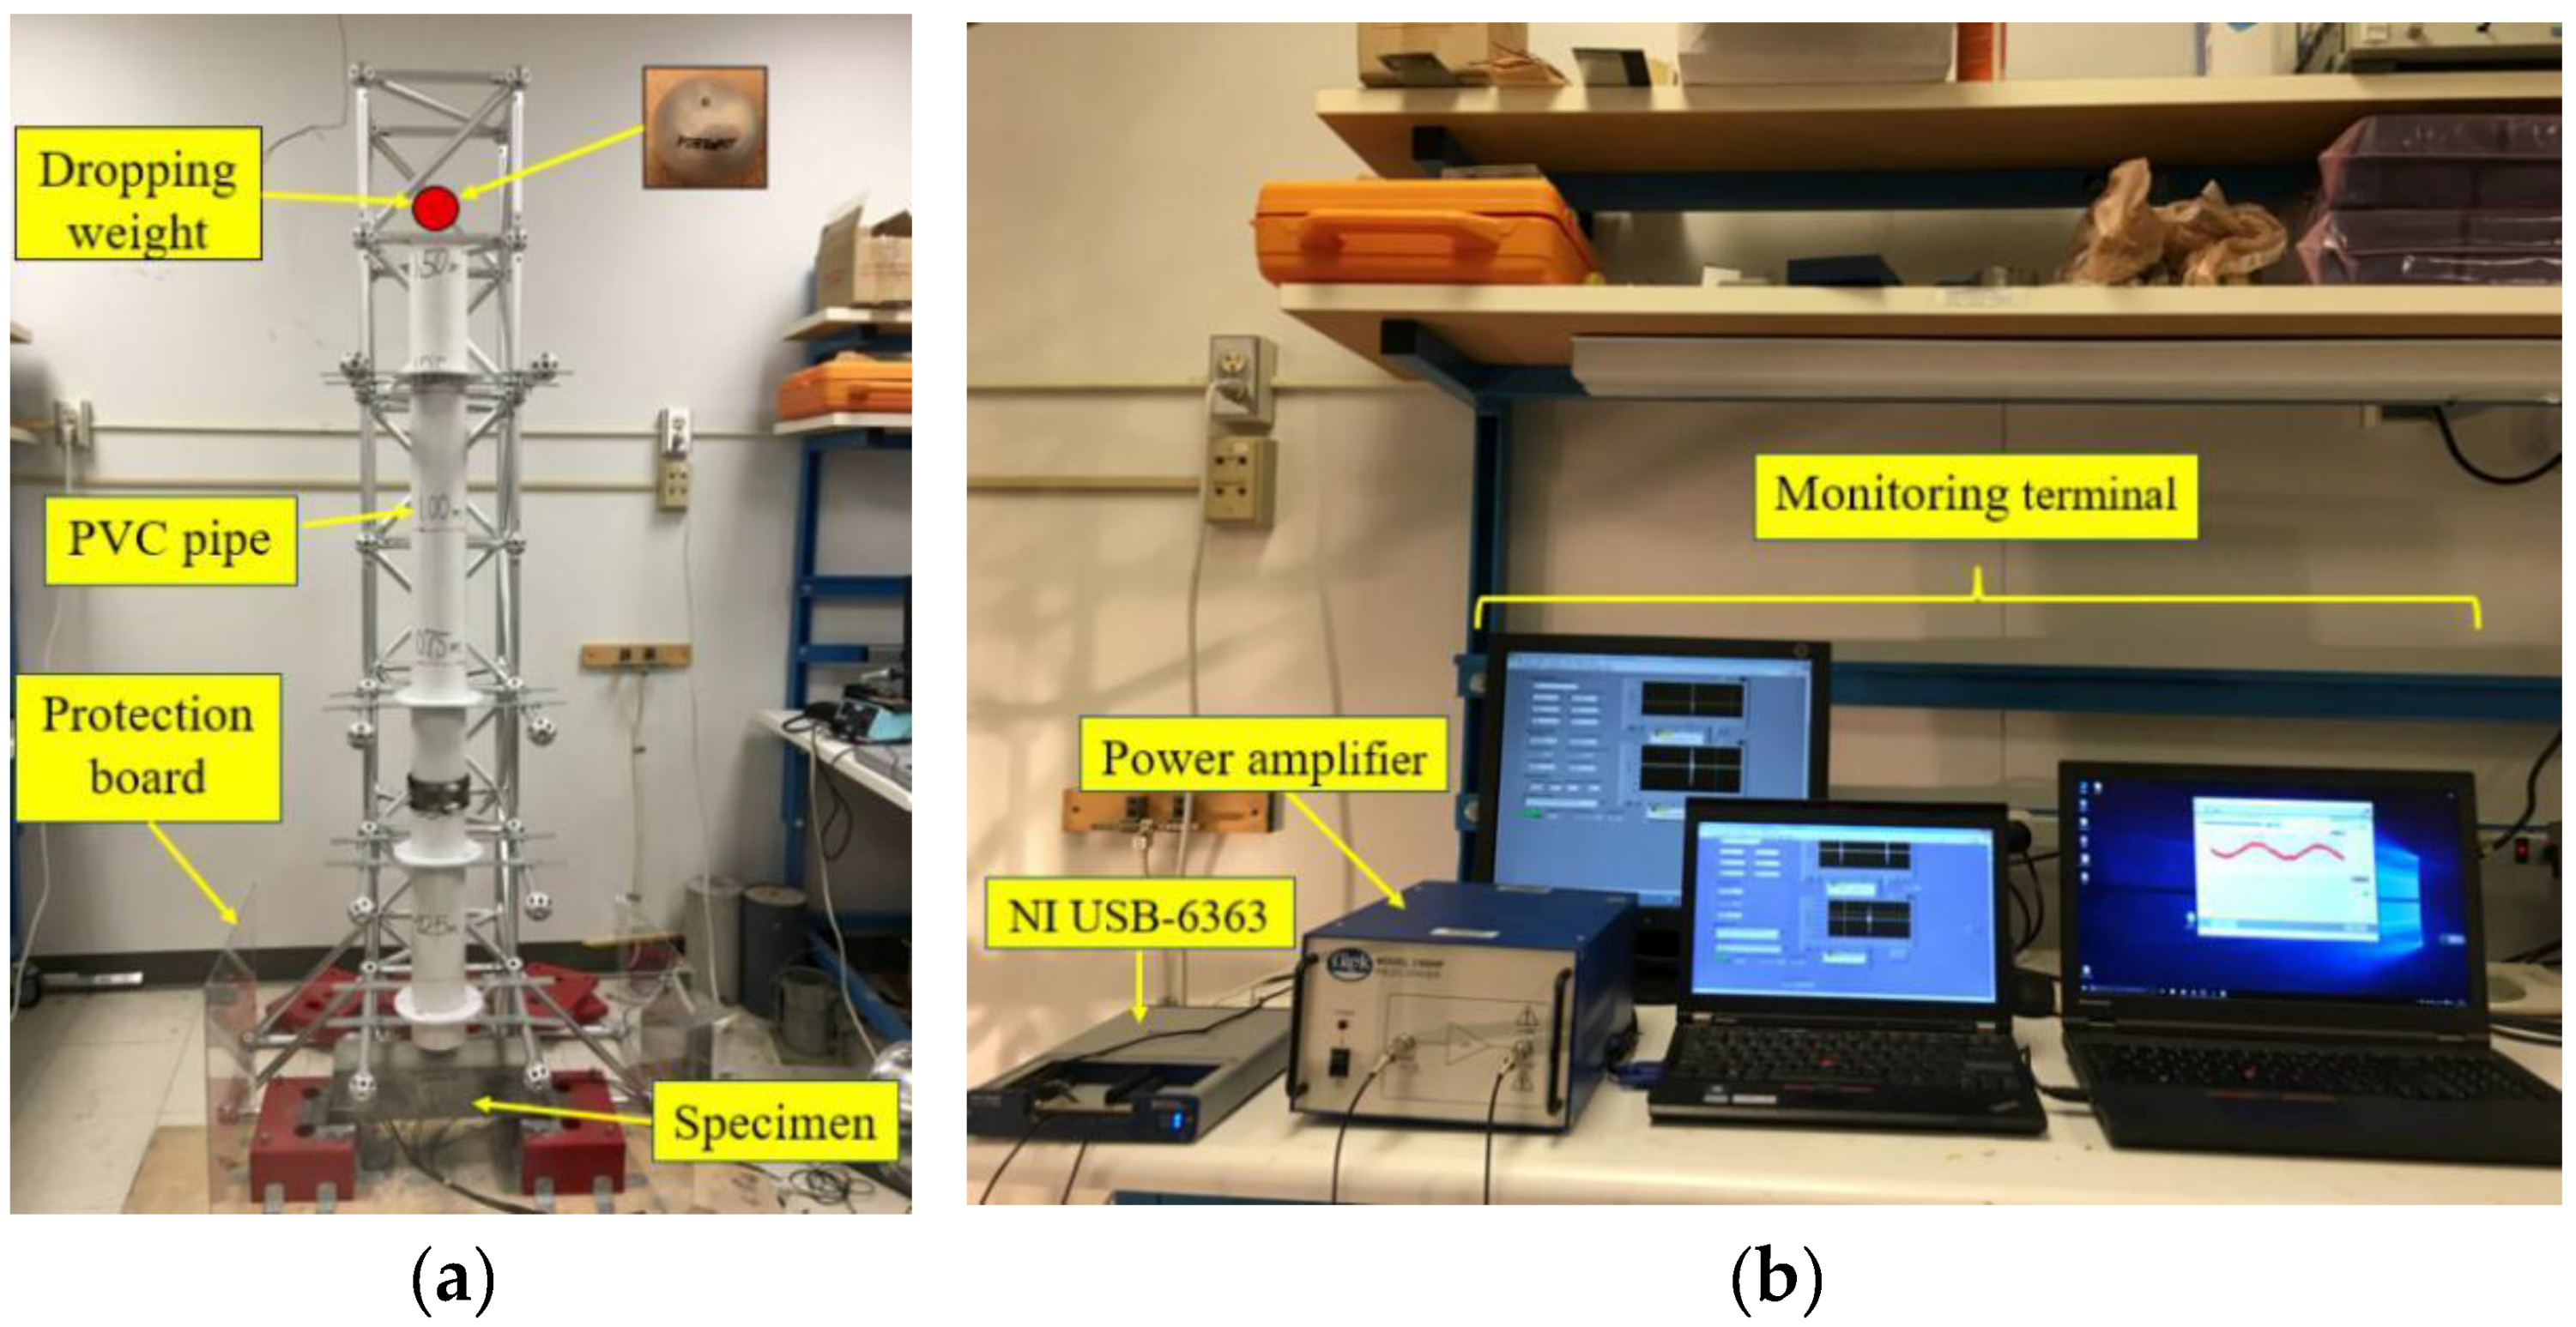
Figure 5.
Low-velocity impact test setup (a) test setup; (b) data acquisition system.
Figure 5.
Low-velocity impact test setup (a) test setup; (b) data acquisition system.
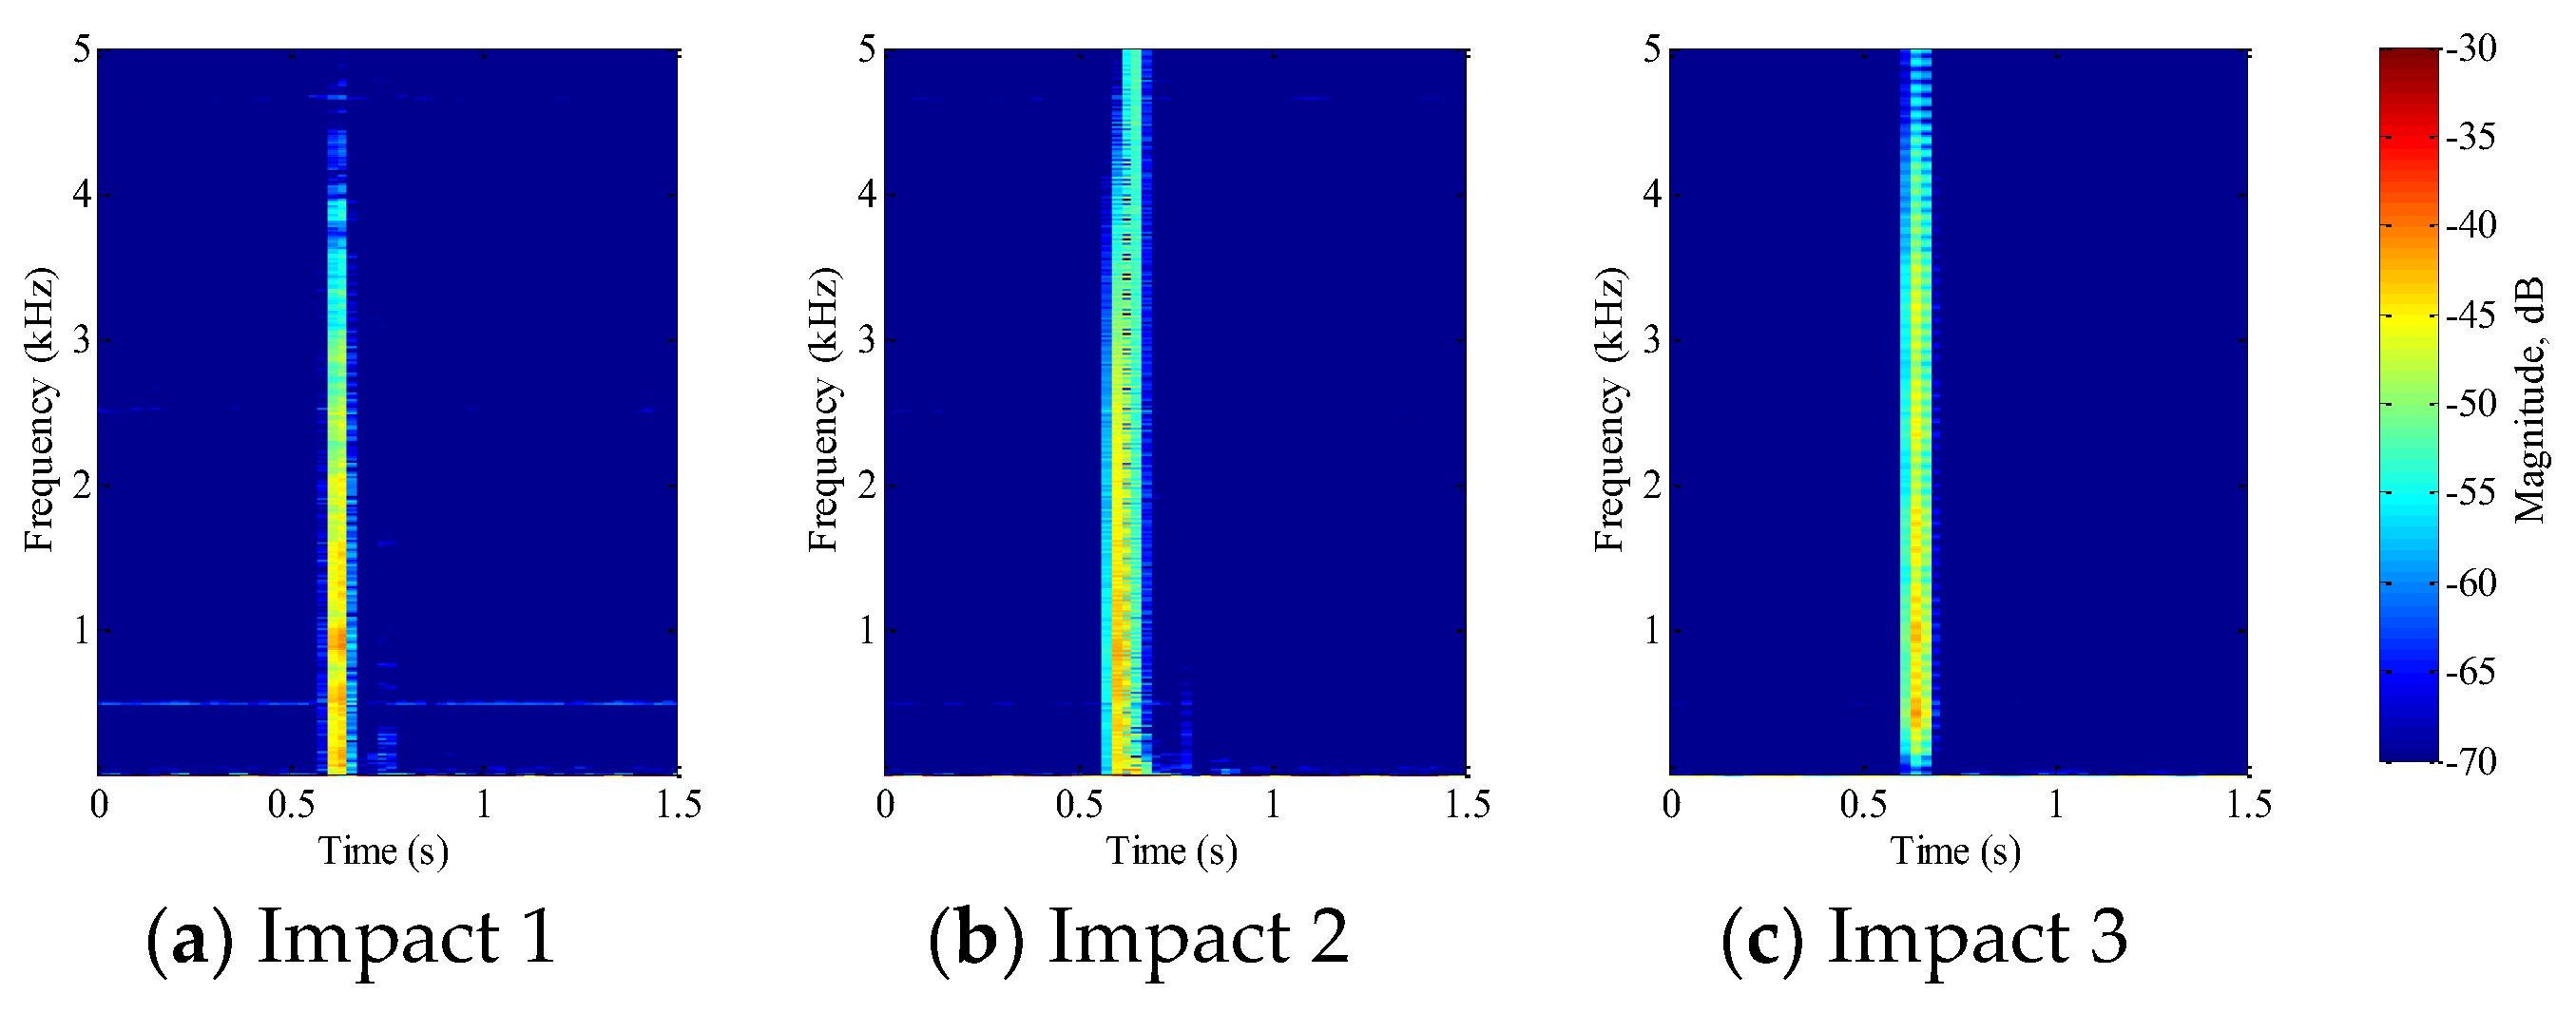
Figure 6.
Short-time Fourier transform (STFT) of PVDF sensor signal for PVA-ECC 1.
Figure 6.
Short-time Fourier transform (STFT) of PVDF sensor signal for PVA-ECC 1.
Figure 7.
STFT of PVDF sensor signal for PVA-ECC 2.
Figure 7.
STFT of PVDF sensor signal for PVA-ECC 2.
Figure 8.
STFT of PVDF sensor signal for PVA-ECC 3.
Figure 8.
STFT of PVDF sensor signal for PVA-ECC 3.
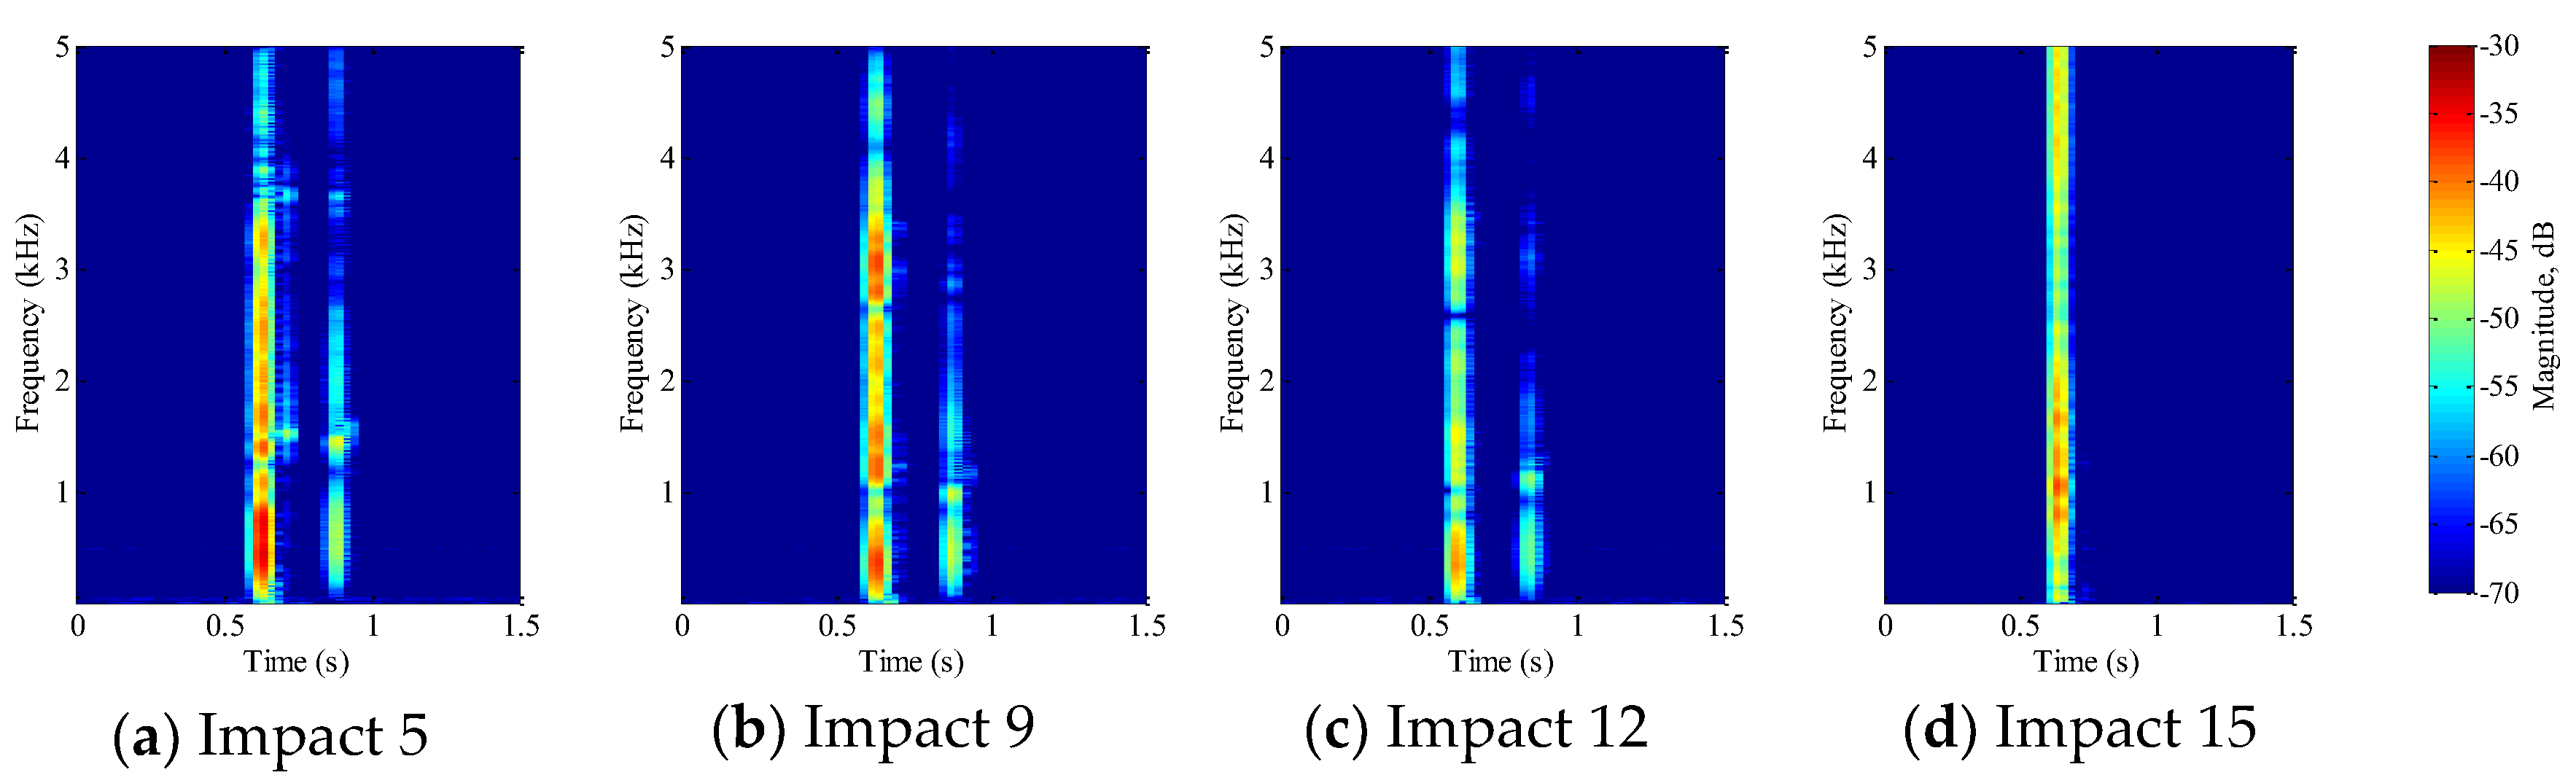
Figure 9.
STFT of PVDF sensor signal for PVA-ECC 3.
Figure 9.
STFT of PVDF sensor signal for PVA-ECC 3.
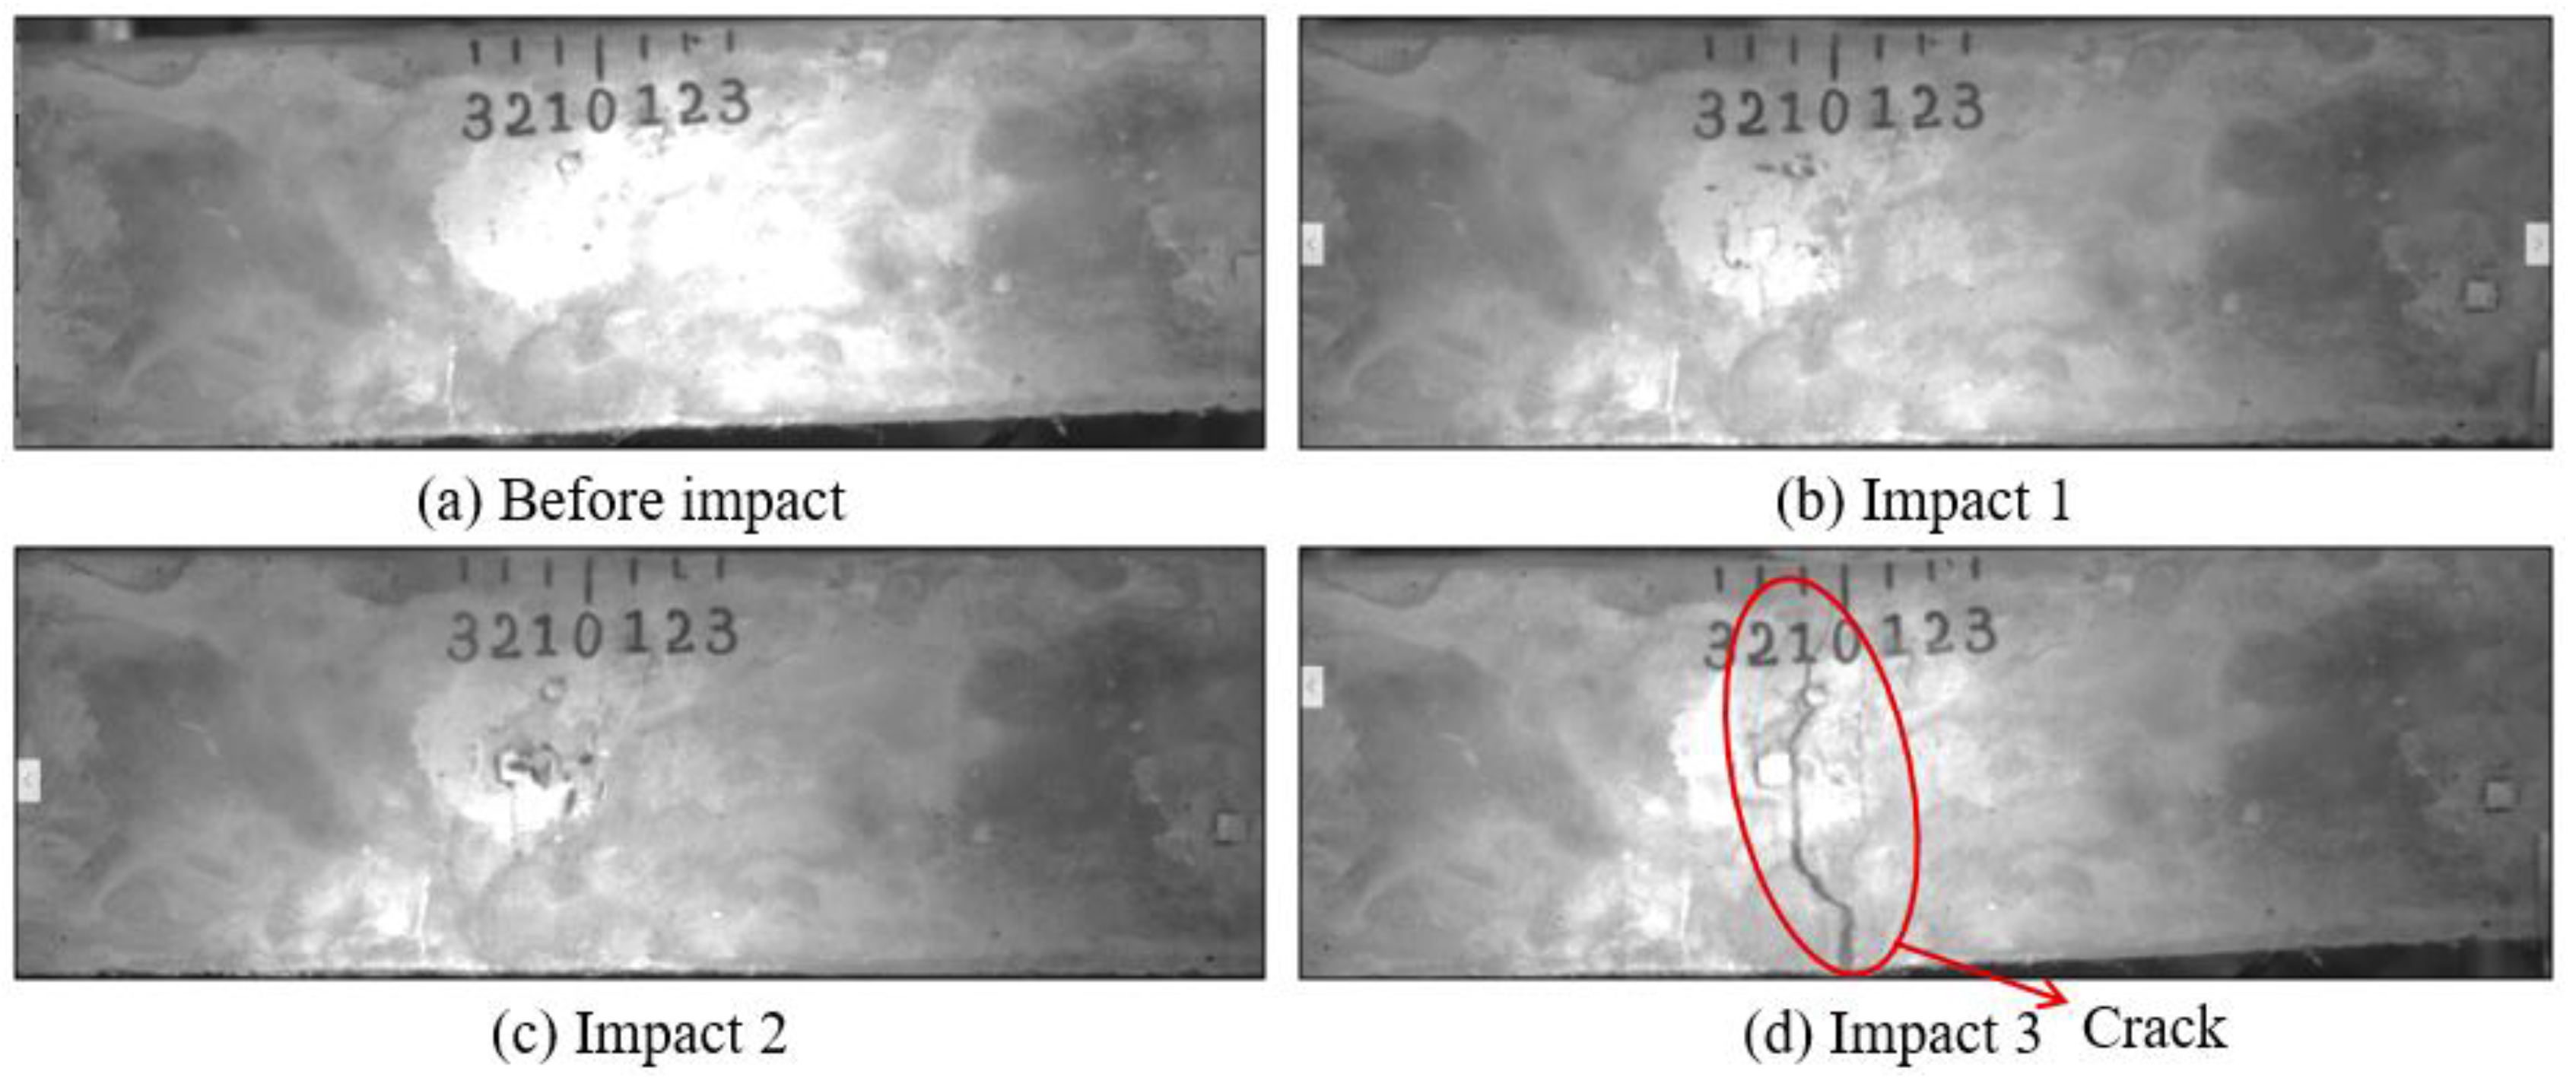
Figure 10.
Results of crack detection in PVA-ECC-1 with high-speed video.
Figure 10.
Results of crack detection in PVA-ECC-1 with high-speed video.
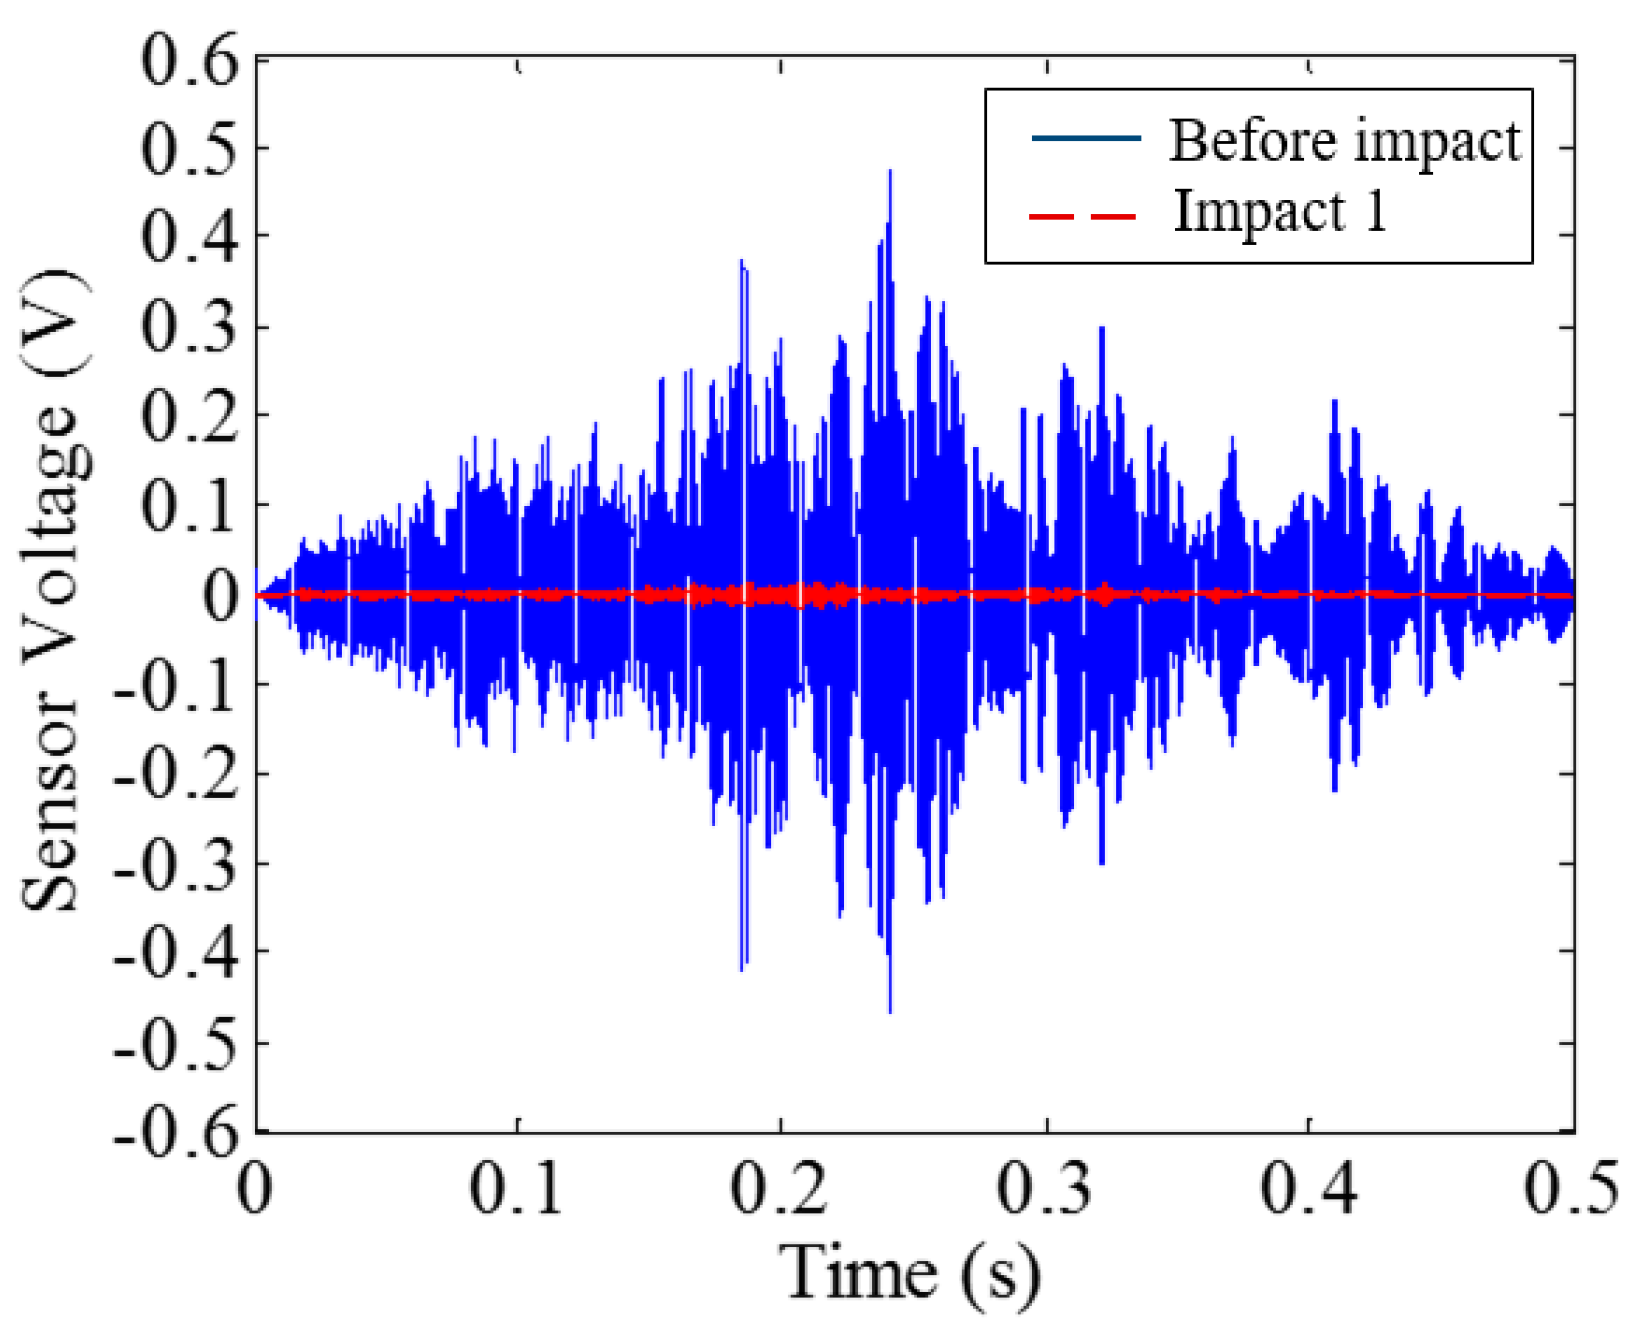
Figure 11.
Time-domain signal received by smart aggregate (SA) sensor in PVA-ECC 1.
Figure 11.
Time-domain signal received by smart aggregate (SA) sensor in PVA-ECC 1.
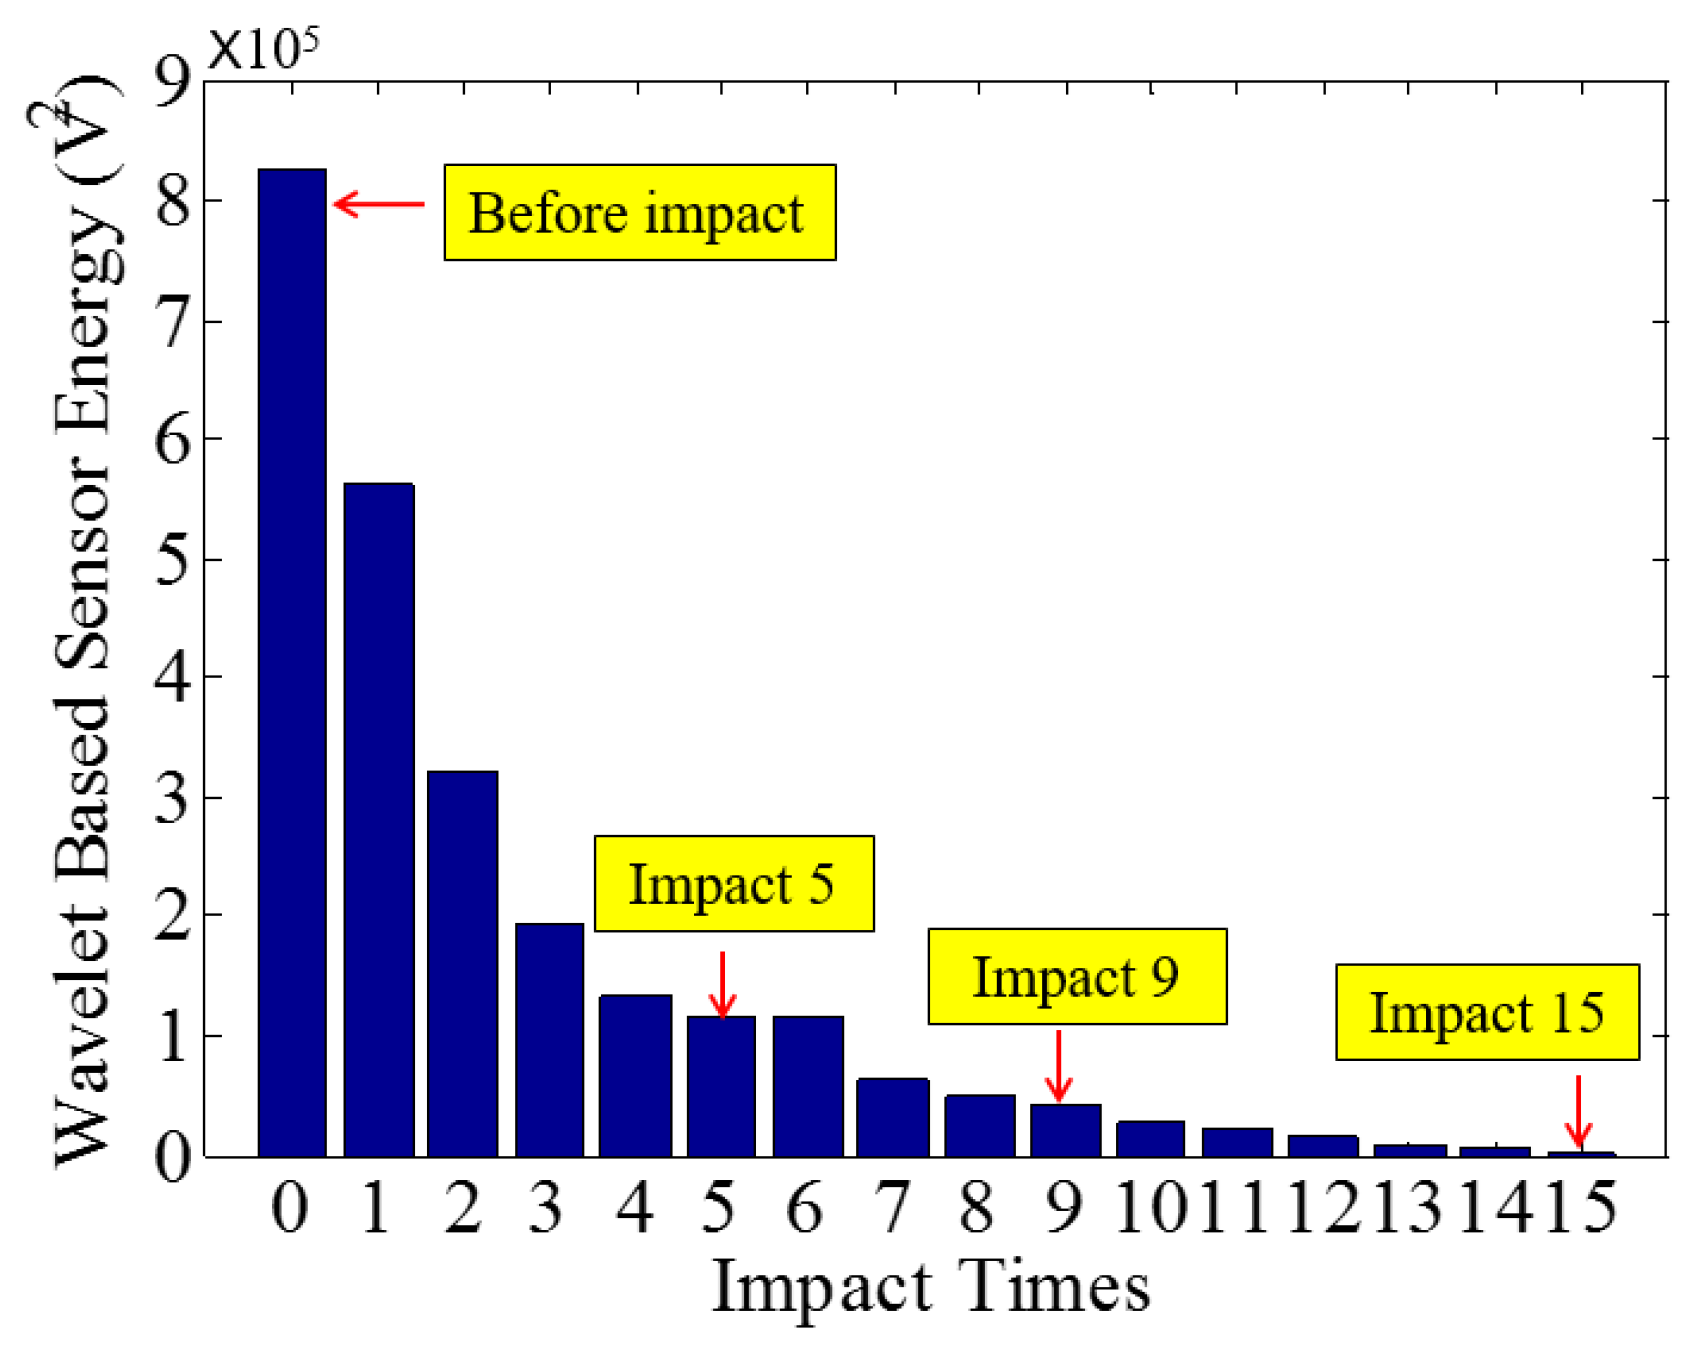
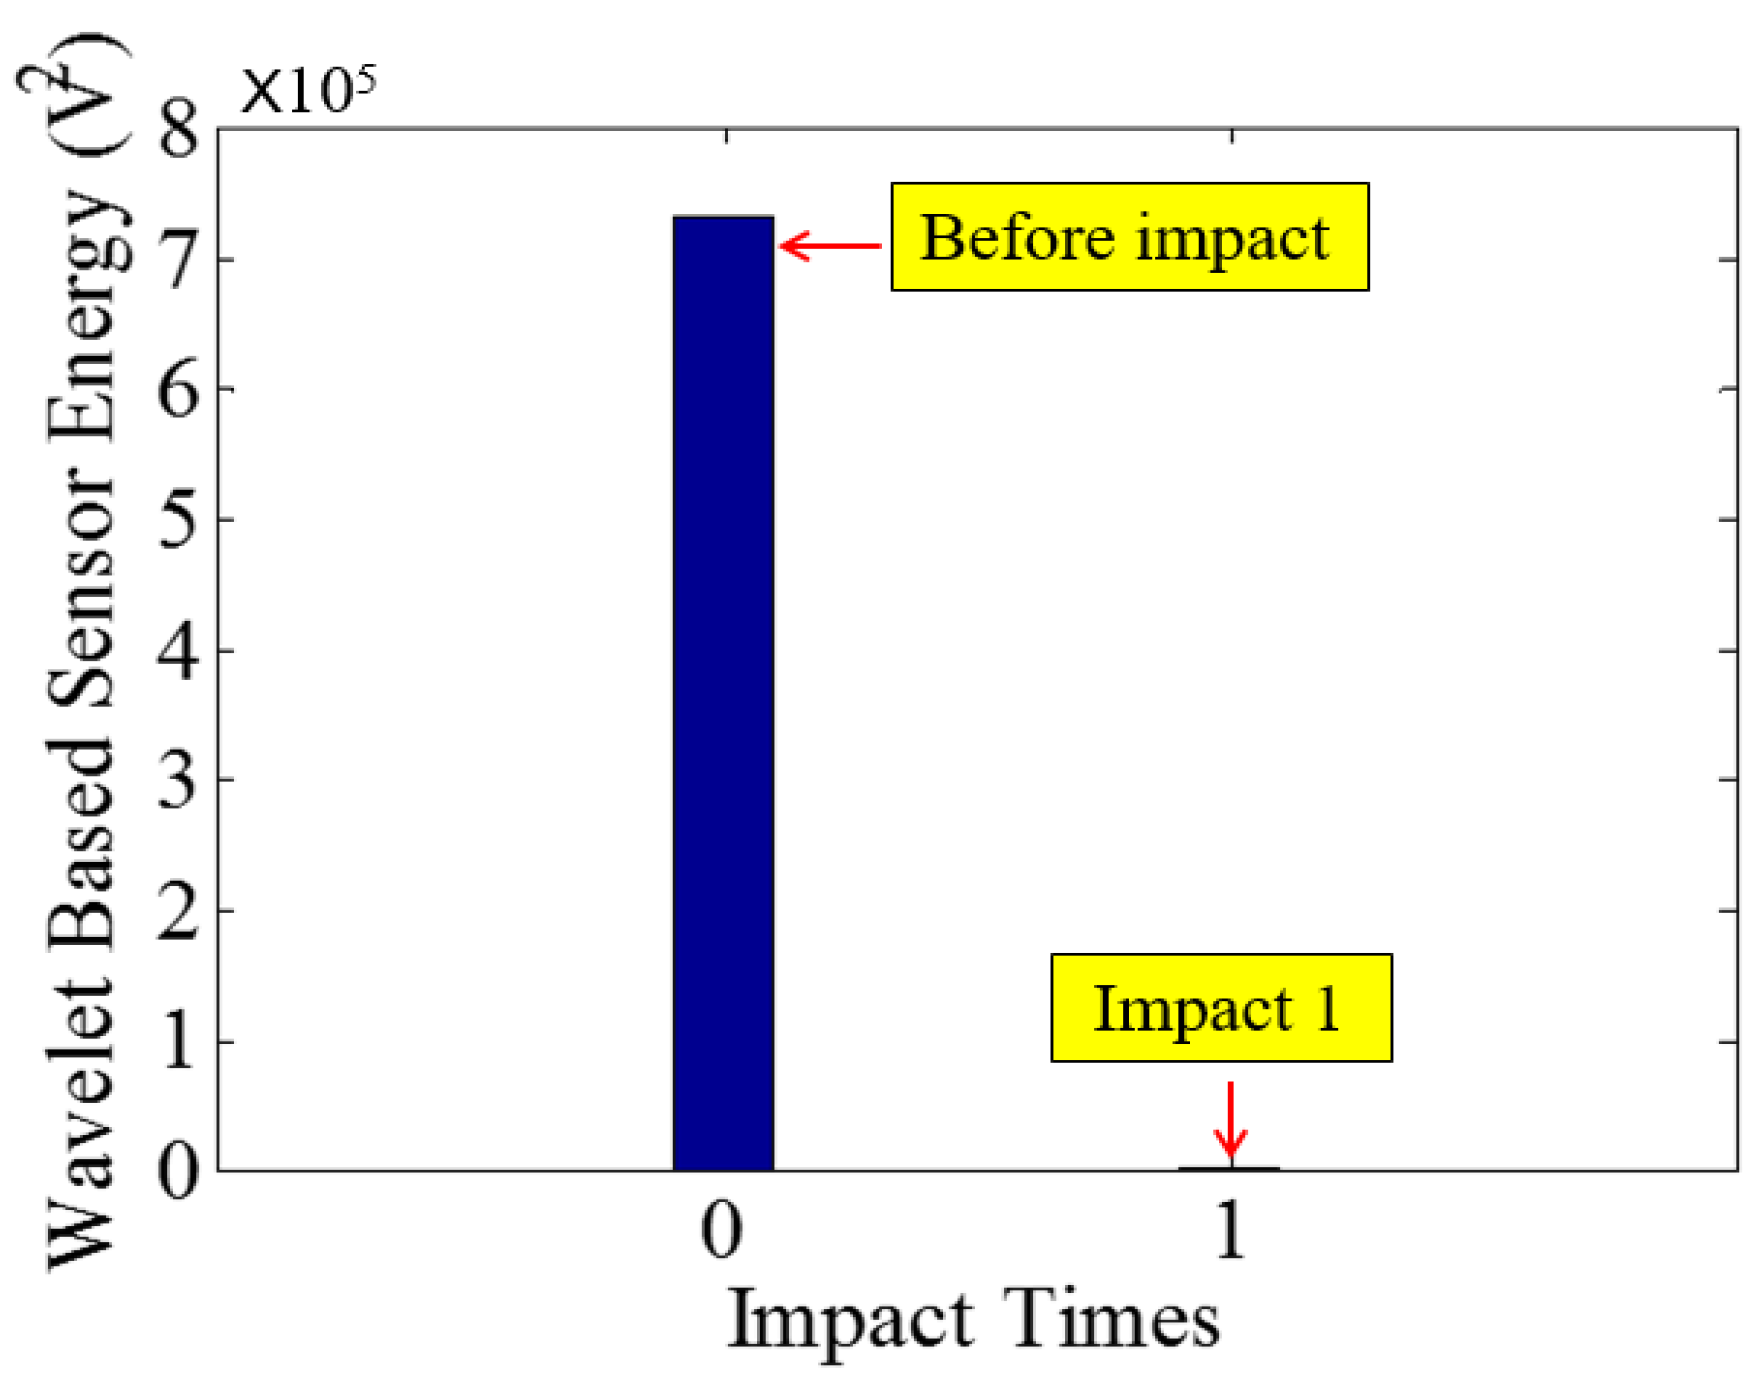
Figure 12.
Wavelet packet-based energy plots of the received signal in PVA-ECC 1.
Figure 12.
Wavelet packet-based energy plots of the received signal in PVA-ECC 1.
Figure 13.
Results of crack detection in PVA-ECC-2 with high-speed video.
Figure 13.
Results of crack detection in PVA-ECC-2 with high-speed video.
Figure 14.
Time-domain signal received by SA sensor in PVA-ECC-2.
Figure 14.
Time-domain signal received by SA sensor in PVA-ECC-2.
Figure 15.
Wavelet packet-based energy plots of the received signal in PVA-ECC-2.
Figure 15.
Wavelet packet-based energy plots of the received signal in PVA-ECC-2.
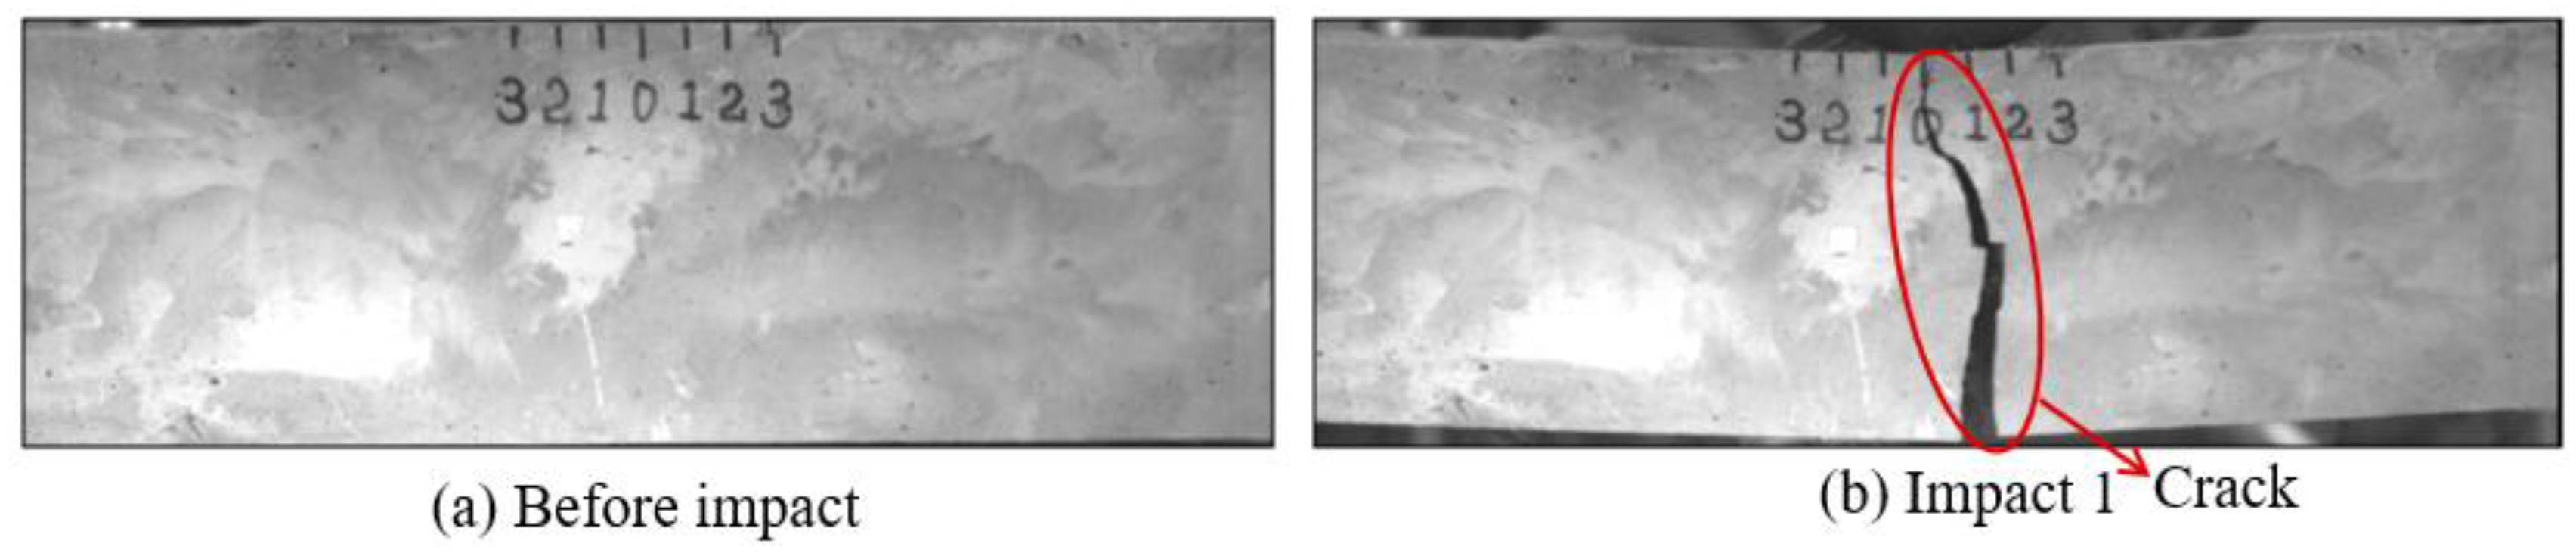
Figure 16.
Results of crack detection in PVA-ECC-3 with high-speed video.
Figure 16.
Results of crack detection in PVA-ECC-3 with high-speed video.
Figure 17.
Time-domain signal received by SA sensor in PVA-ECC-3.
Figure 17.
Time-domain signal received by SA sensor in PVA-ECC-3.
Figure 18.
Wavelet packet-based energy plots of the received signal in PVA-ECC-3.
Figure 18.
Wavelet packet-based energy plots of the received signal in PVA-ECC-3.
Figure 19.
Results of crack detection of Mortar-1 with high-speed video.
Figure 19.
Results of crack detection of Mortar-1 with high-speed video.
Figure 20.
Time-domain signal received by SA sensor in Mortar-1.
Figure 20.
Time-domain signal received by SA sensor in Mortar-1.
Figure 21.
Wavelet packet-based energy plots of the received signal in Mortar-1.
Figure 21.
Wavelet packet-based energy plots of the received signal in Mortar-1.
Figure 22.
Results of crack detection of Mortar-2 with high-speed video.
Figure 22.
Results of crack detection of Mortar-2 with high-speed video.
Figure 23.
Time-domain signal received by SA sensor in Mortar-2.
Figure 23.
Time-domain signal received by SA sensor in Mortar-2.
Figure 24.
Wavelet packet-based energy plots of the received signal in Mortar-2.
Figure 24.
Wavelet packet-based energy plots of the received signal in Mortar-2.
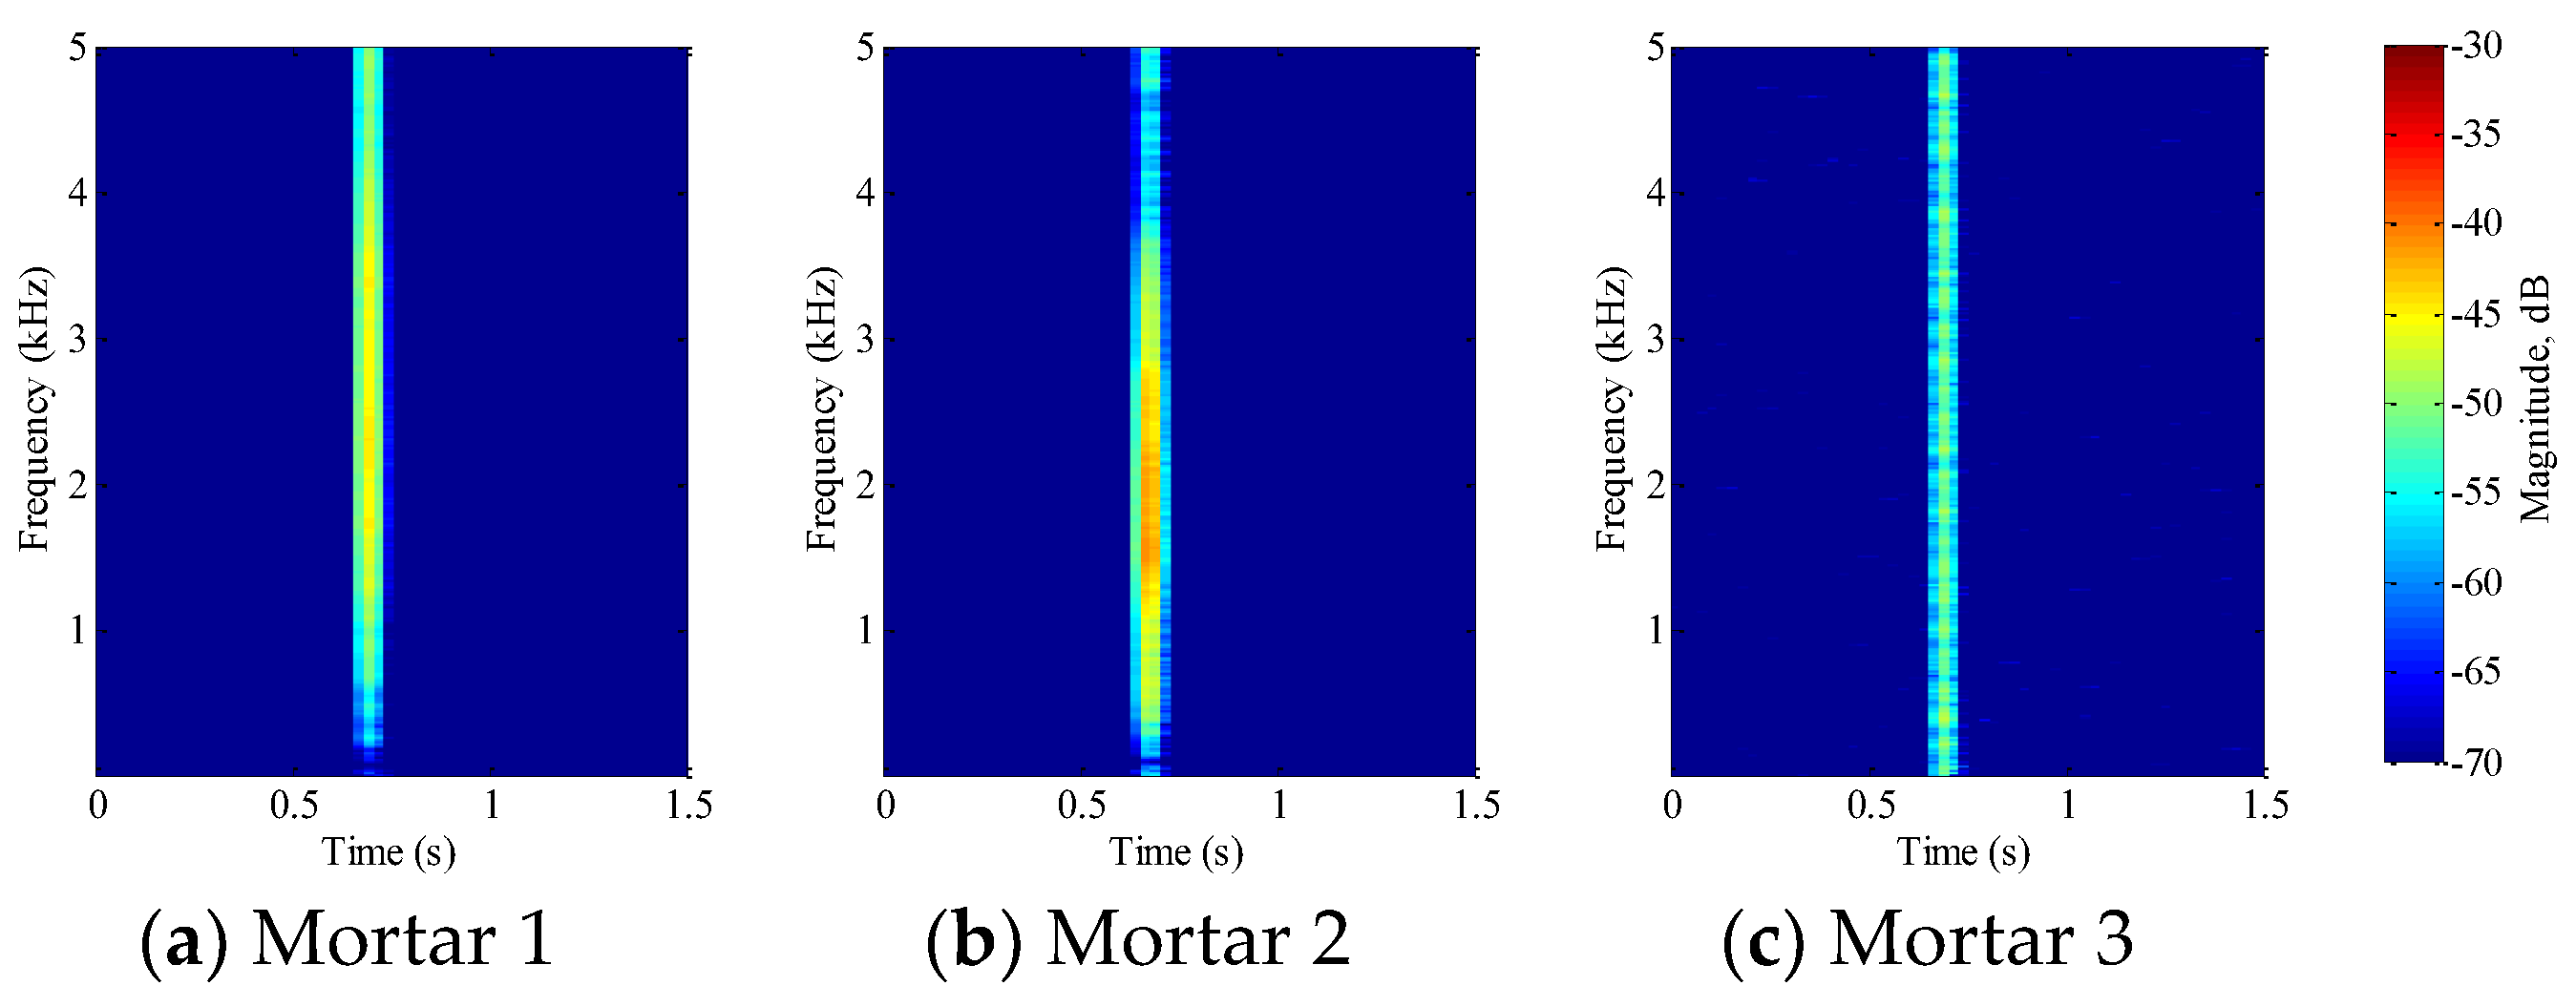
Figure 25.
Results of crack detection of Mortar-3 with high-speed video.
Figure 25.
Results of crack detection of Mortar-3 with high-speed video.
Figure 26.
Time-domain signal received by SA sensor in Mortar-2.
Figure 26.
Time-domain signal received by SA sensor in Mortar-2.
Figure 27.
Wavelet packet-based energy plots of the received signal in Mortar-2.
Figure 27.
Wavelet packet-based energy plots of the received signal in Mortar-2.
Table 1.
Properties of PVDF and Lead Zirconate Titanate (PZT).
Table 1.
Properties of PVDF and Lead Zirconate Titanate (PZT).
| | PVDF | PZT |
|---|
| Density (kg/m3) | 1800 | 7750 |
| Compliance (×10−9 m/N) | 0.1 | 0.02 |
| Relative permittivity | 10 | 1800 |
| d33 (pC/N) | 30 | 410 |
| d31 (pC/N) | ‒18 | ‒175 |
Table 2.
Compositions of polyvinyl alcohol fiber reinforced engineering cementitious composite (PVA-ECC) and mortar.
Table 2.
Compositions of polyvinyl alcohol fiber reinforced engineering cementitious composite (PVA-ECC) and mortar.
| Beam Type | Cement | Sand | Fly Ash | Water | SP (%) | PVA (%) |
|---|
| PVA-ECC | 1.16 | 1.16 | 2.2 | 0.66 | 0.002 | 2 |
| Mortar | 1.16 | 1.16 | 2.2 | 0.66 | 0.002 | 0 |
Table 3.
Properties of PVA fiber.
Table 3.
Properties of PVA fiber.
| Fiber Type | Nominal Strength (MPa) | Apparent Strength (MPa) | Diameter (mm) | Length (mm) | Young’s Modulus (GPa) | Elongation (%) |
|---|
| PVA | 1620 | 1092 | 39 | 12 | 42.8 | 6.0 |
Table 4.
Parameters of the excited swept sine wave signal.
Table 4.
Parameters of the excited swept sine wave signal.
| Amplitude (V) | Start Frequency (Hz) | Stop Frequency (kHz) | Period (s) |
|---|
| 10 | 100 | 250 | 0.5 |
Table 5.
Detailed impact information for each beam specimen.
Table 5.
Detailed impact information for each beam specimen.
| Specimen | PVA-ECC-1 | PVA-ECC-2 | PVA ECC-3 | Mortar-1 | Mortar-2 | Mortar-3 |
|---|
| Drop weight(kg) | 2.724 | 2.724 | 8.172 | 2.724 | 2.724 | 2.724 |
| Drop height (m) | 1.5 | 1.0 | 1.5 | 1.5 | 1.0 | 0.5 |
Table 6.
Total number of the impact tests for each beam specimen.
Table 6.
Total number of the impact tests for each beam specimen.
| Specimen | PVA-ECC-1 | PVA-ECC-2 | PVA ECC-3 | Mortar-1 | Mortar-2 | Mortar-3 |
|---|
| Number of impact tests | 12 | 15 | 3 | 1 | 1 | 1 |

 ,
, 


