Statistical Analysis of SSMIS Sea Ice Concentration Threshold at the Arctic Sea Ice Edge during Summer Based on MODIS and Ship-Based Observational Data


Abstract
1. Introduction
2. Data
2.1. SSMIS Sea Ice Concentration
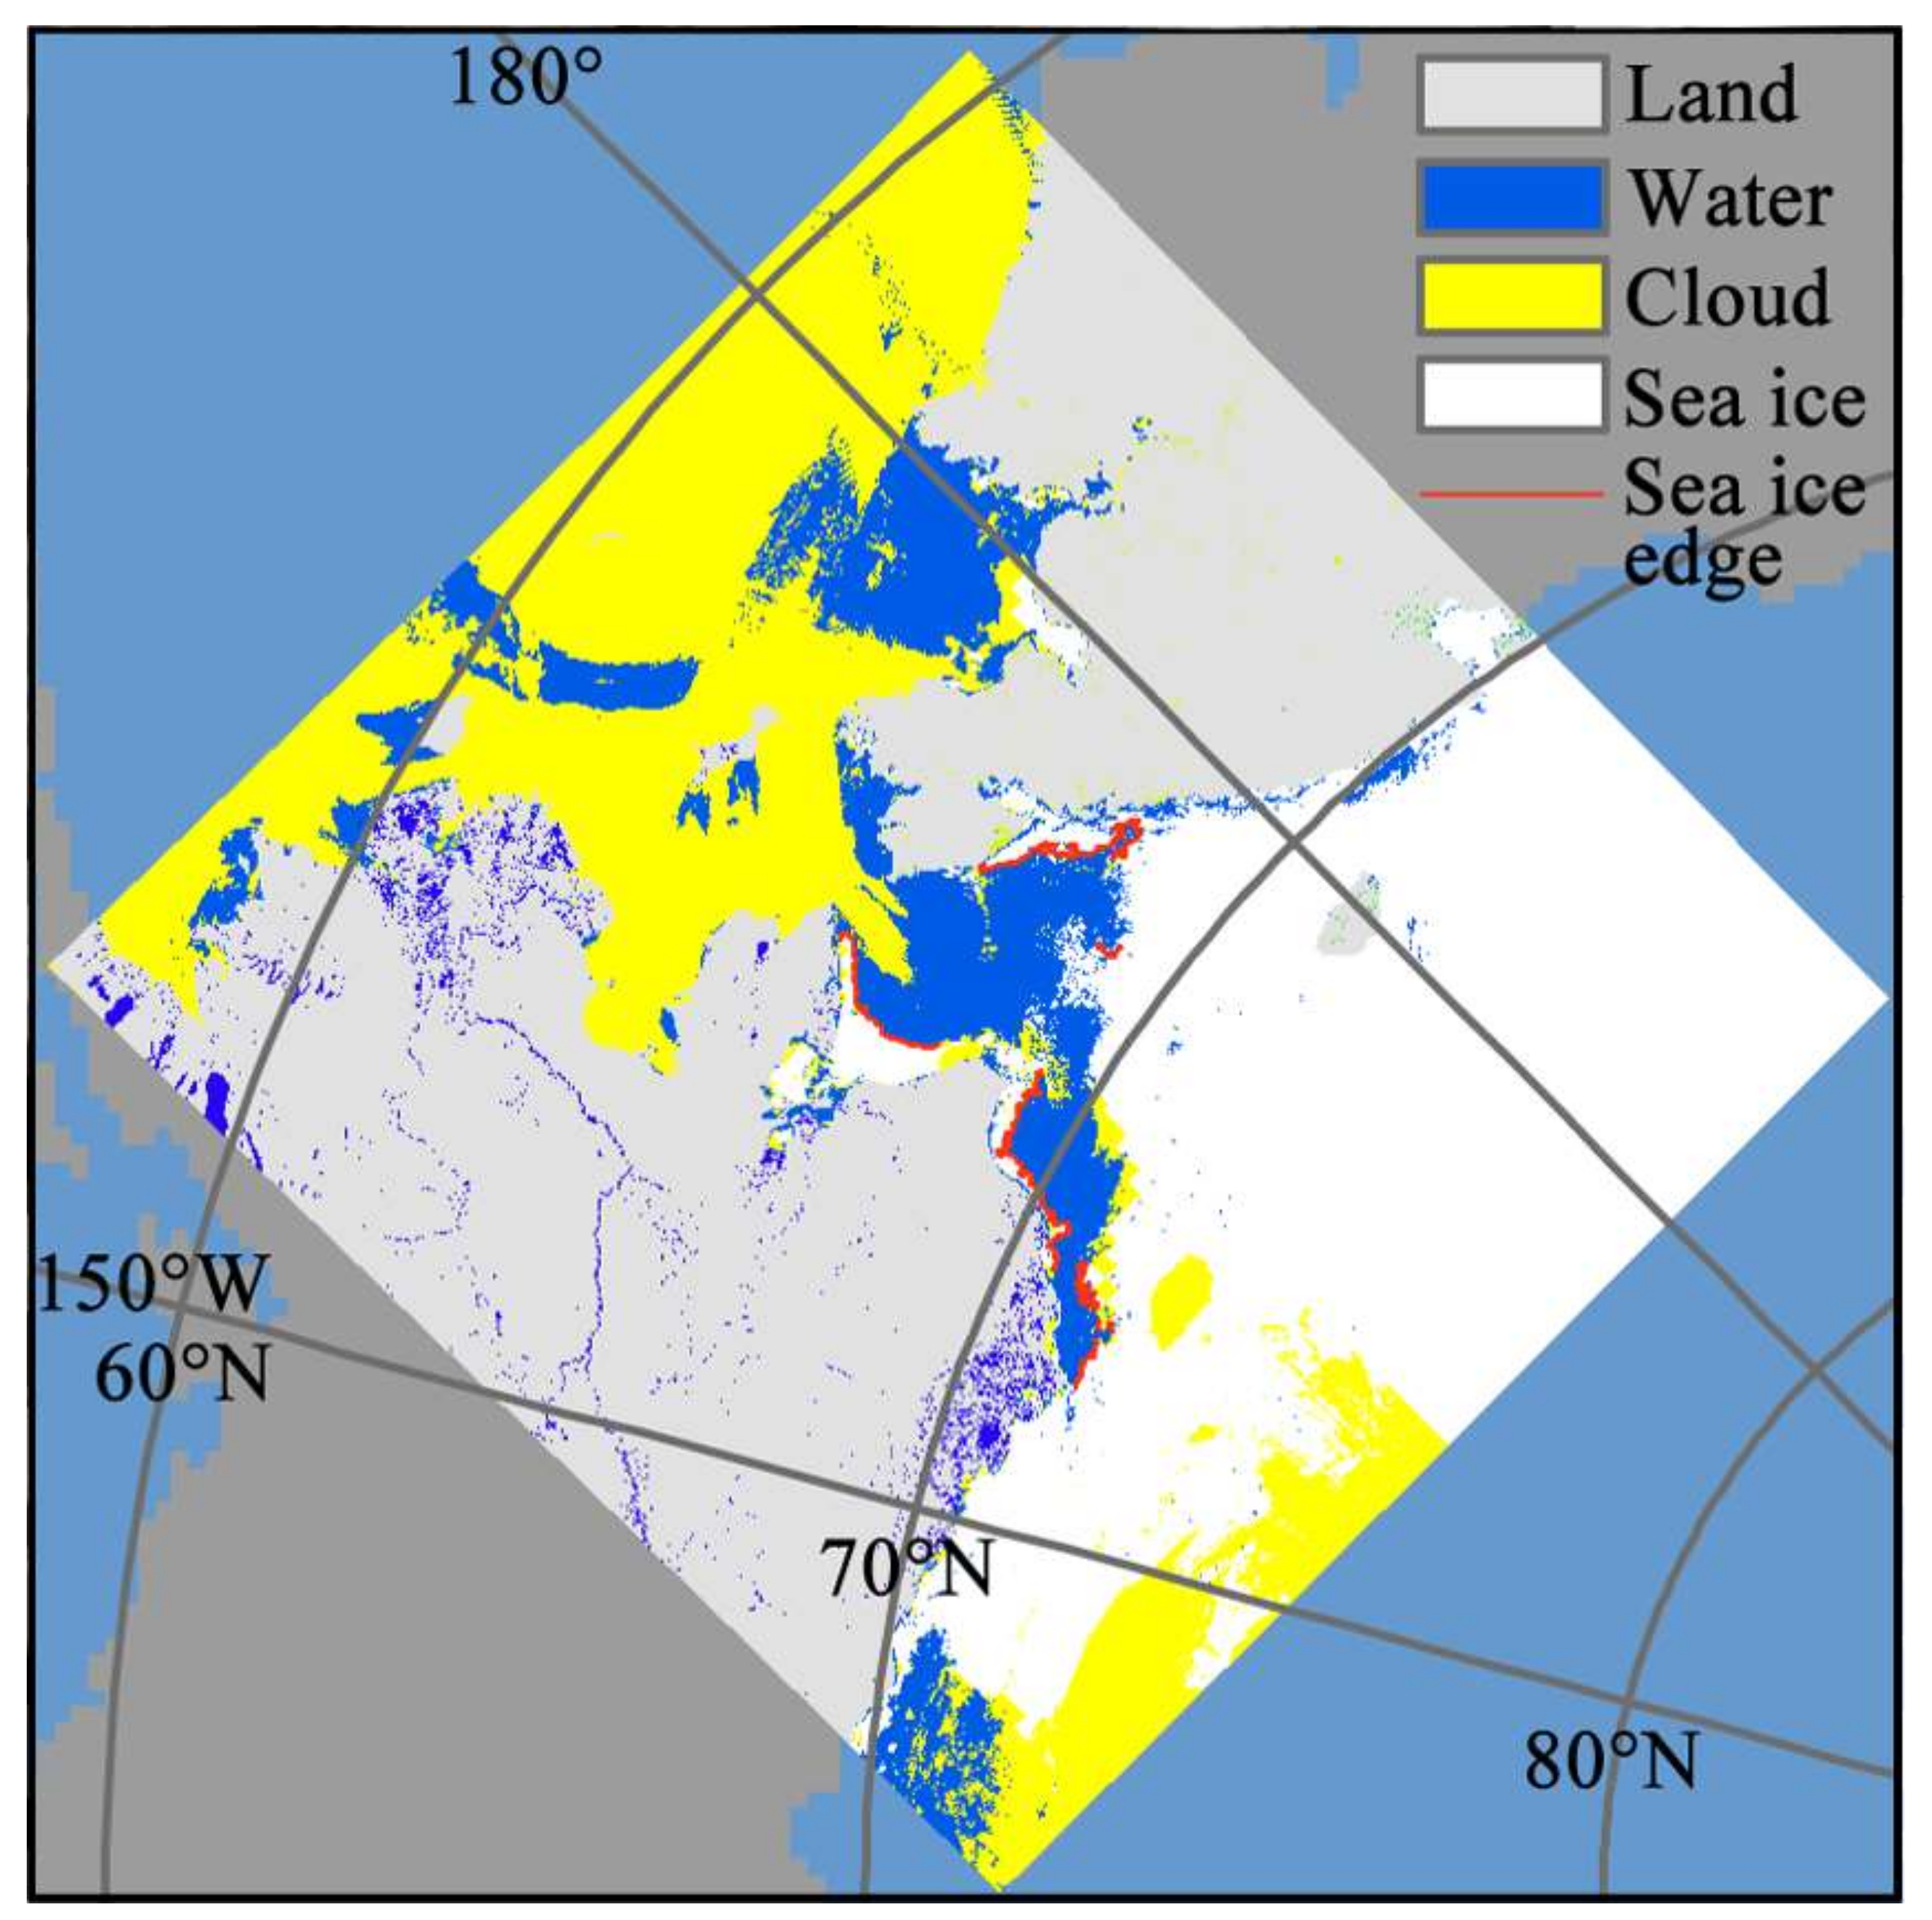
2.2. MOD29 Sea Ice Product
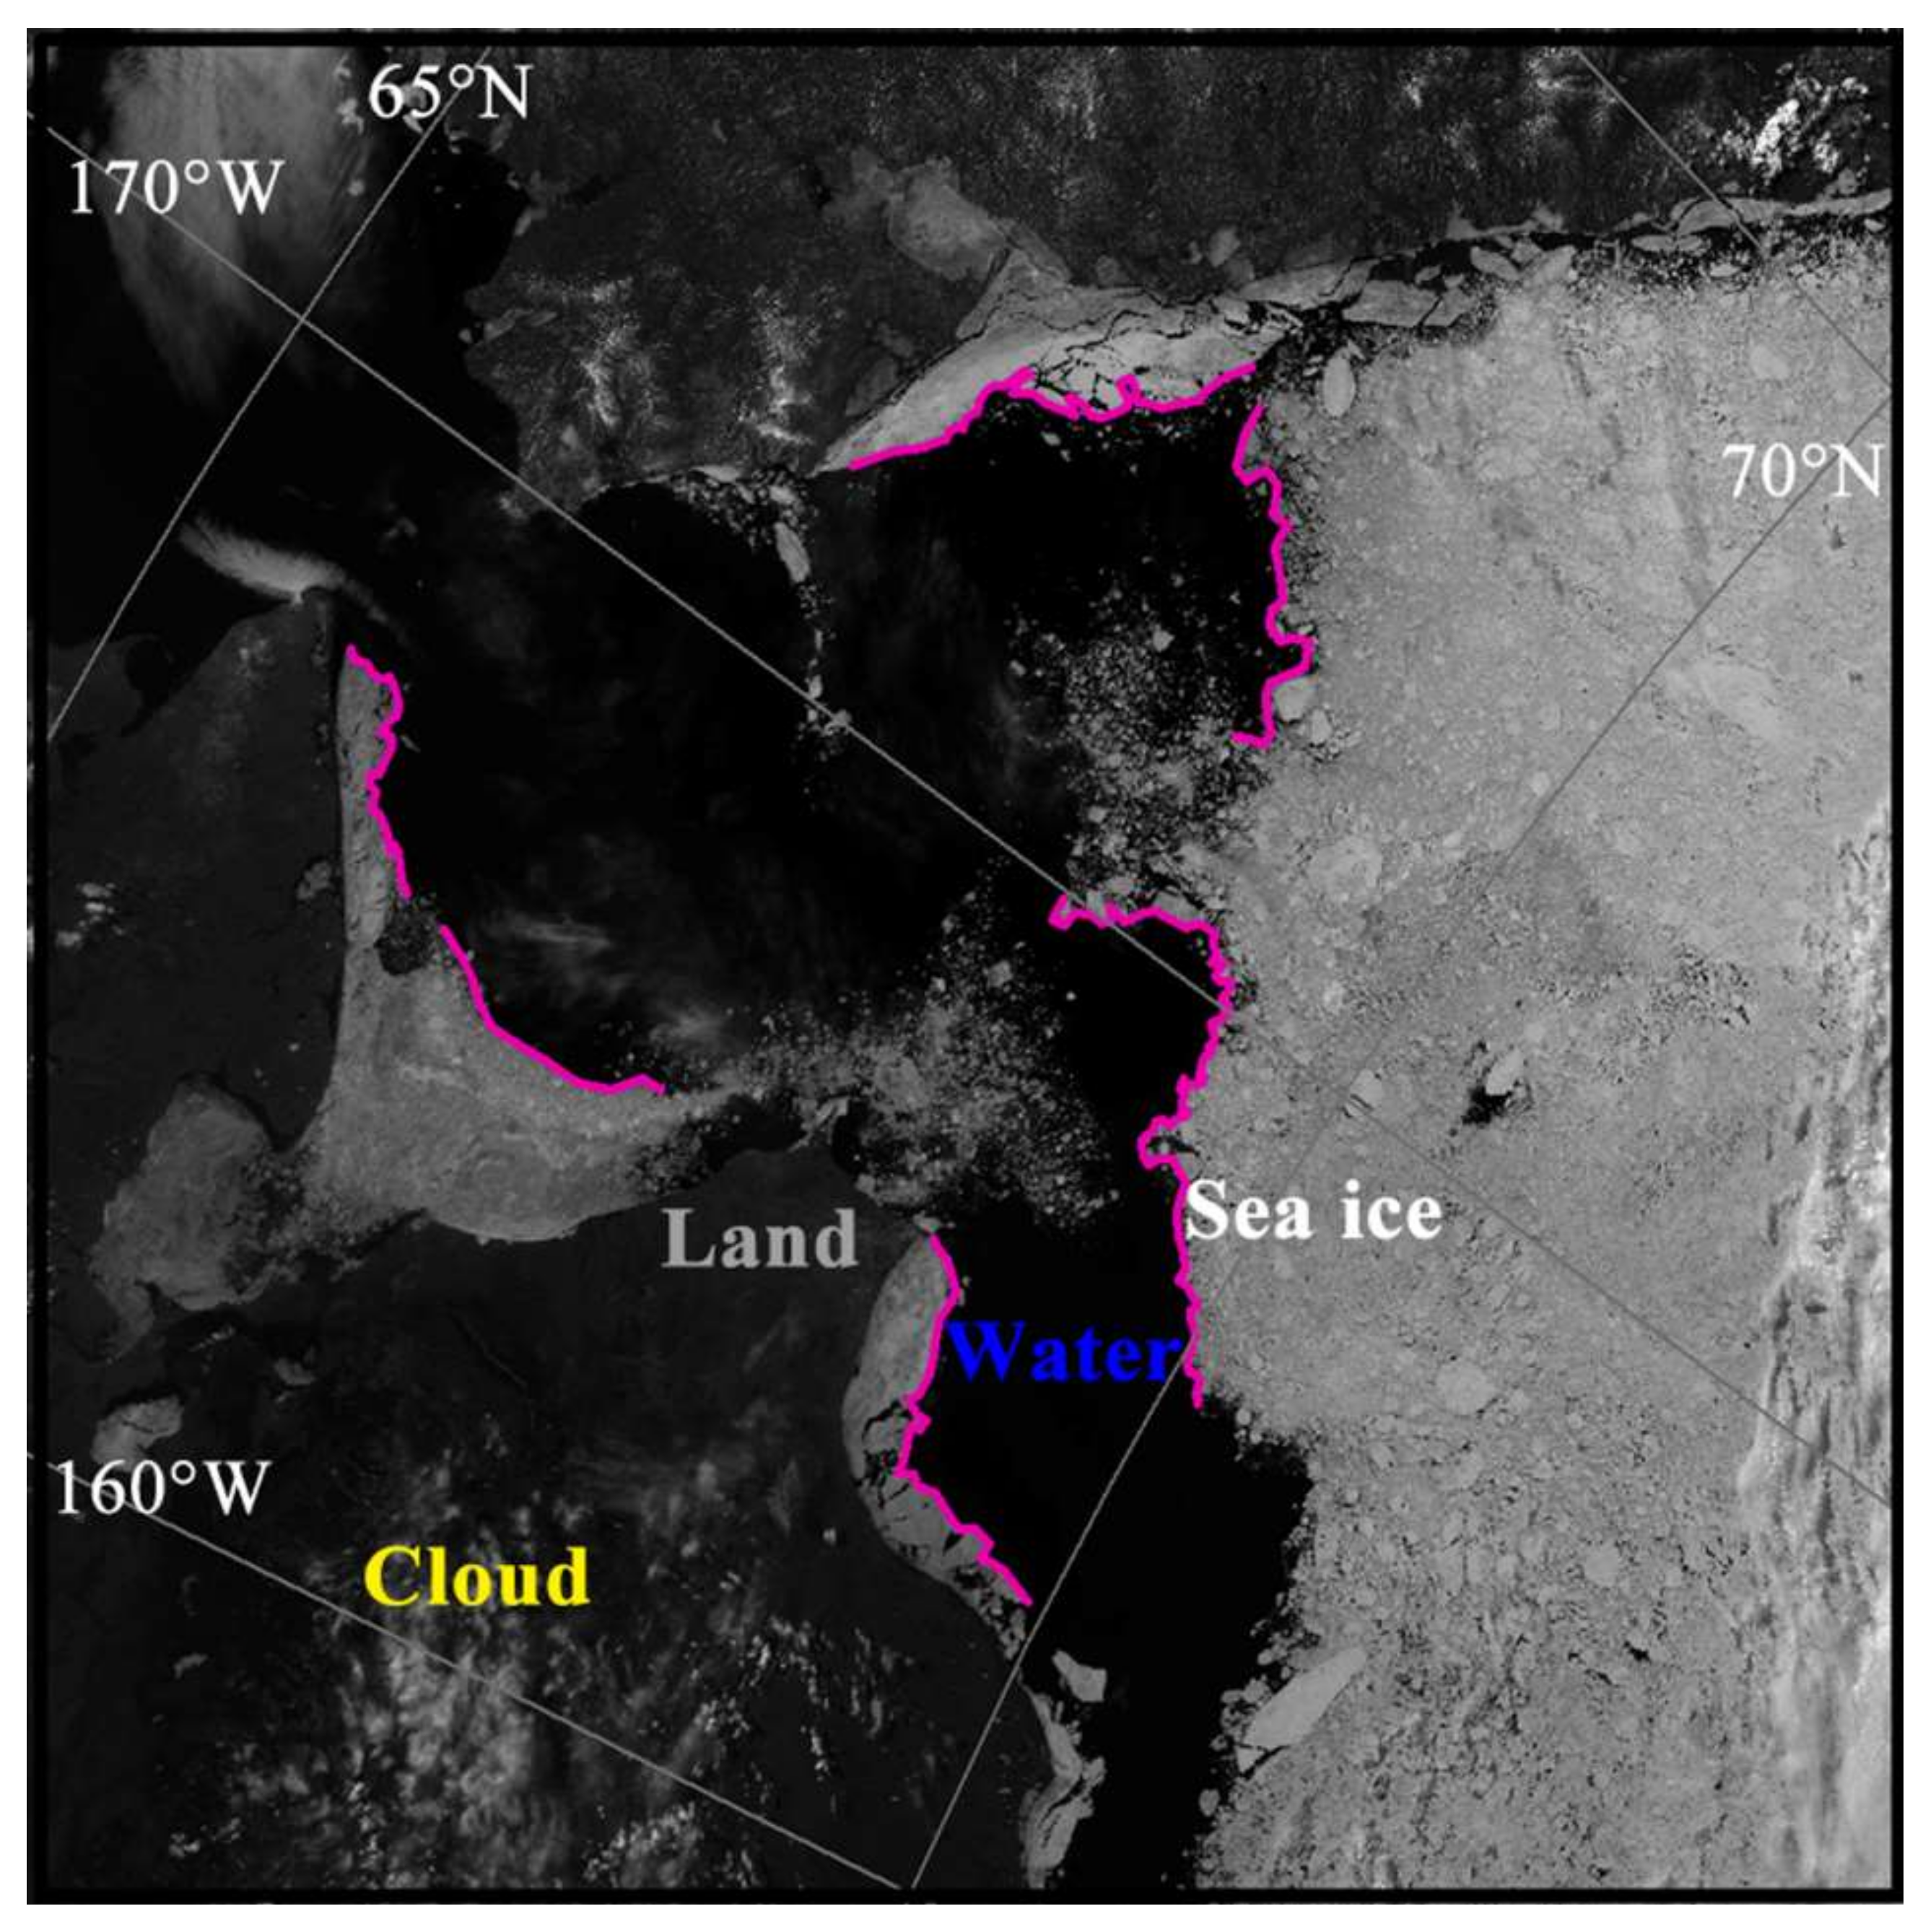
2.3. MODIS Remote Sensing Images
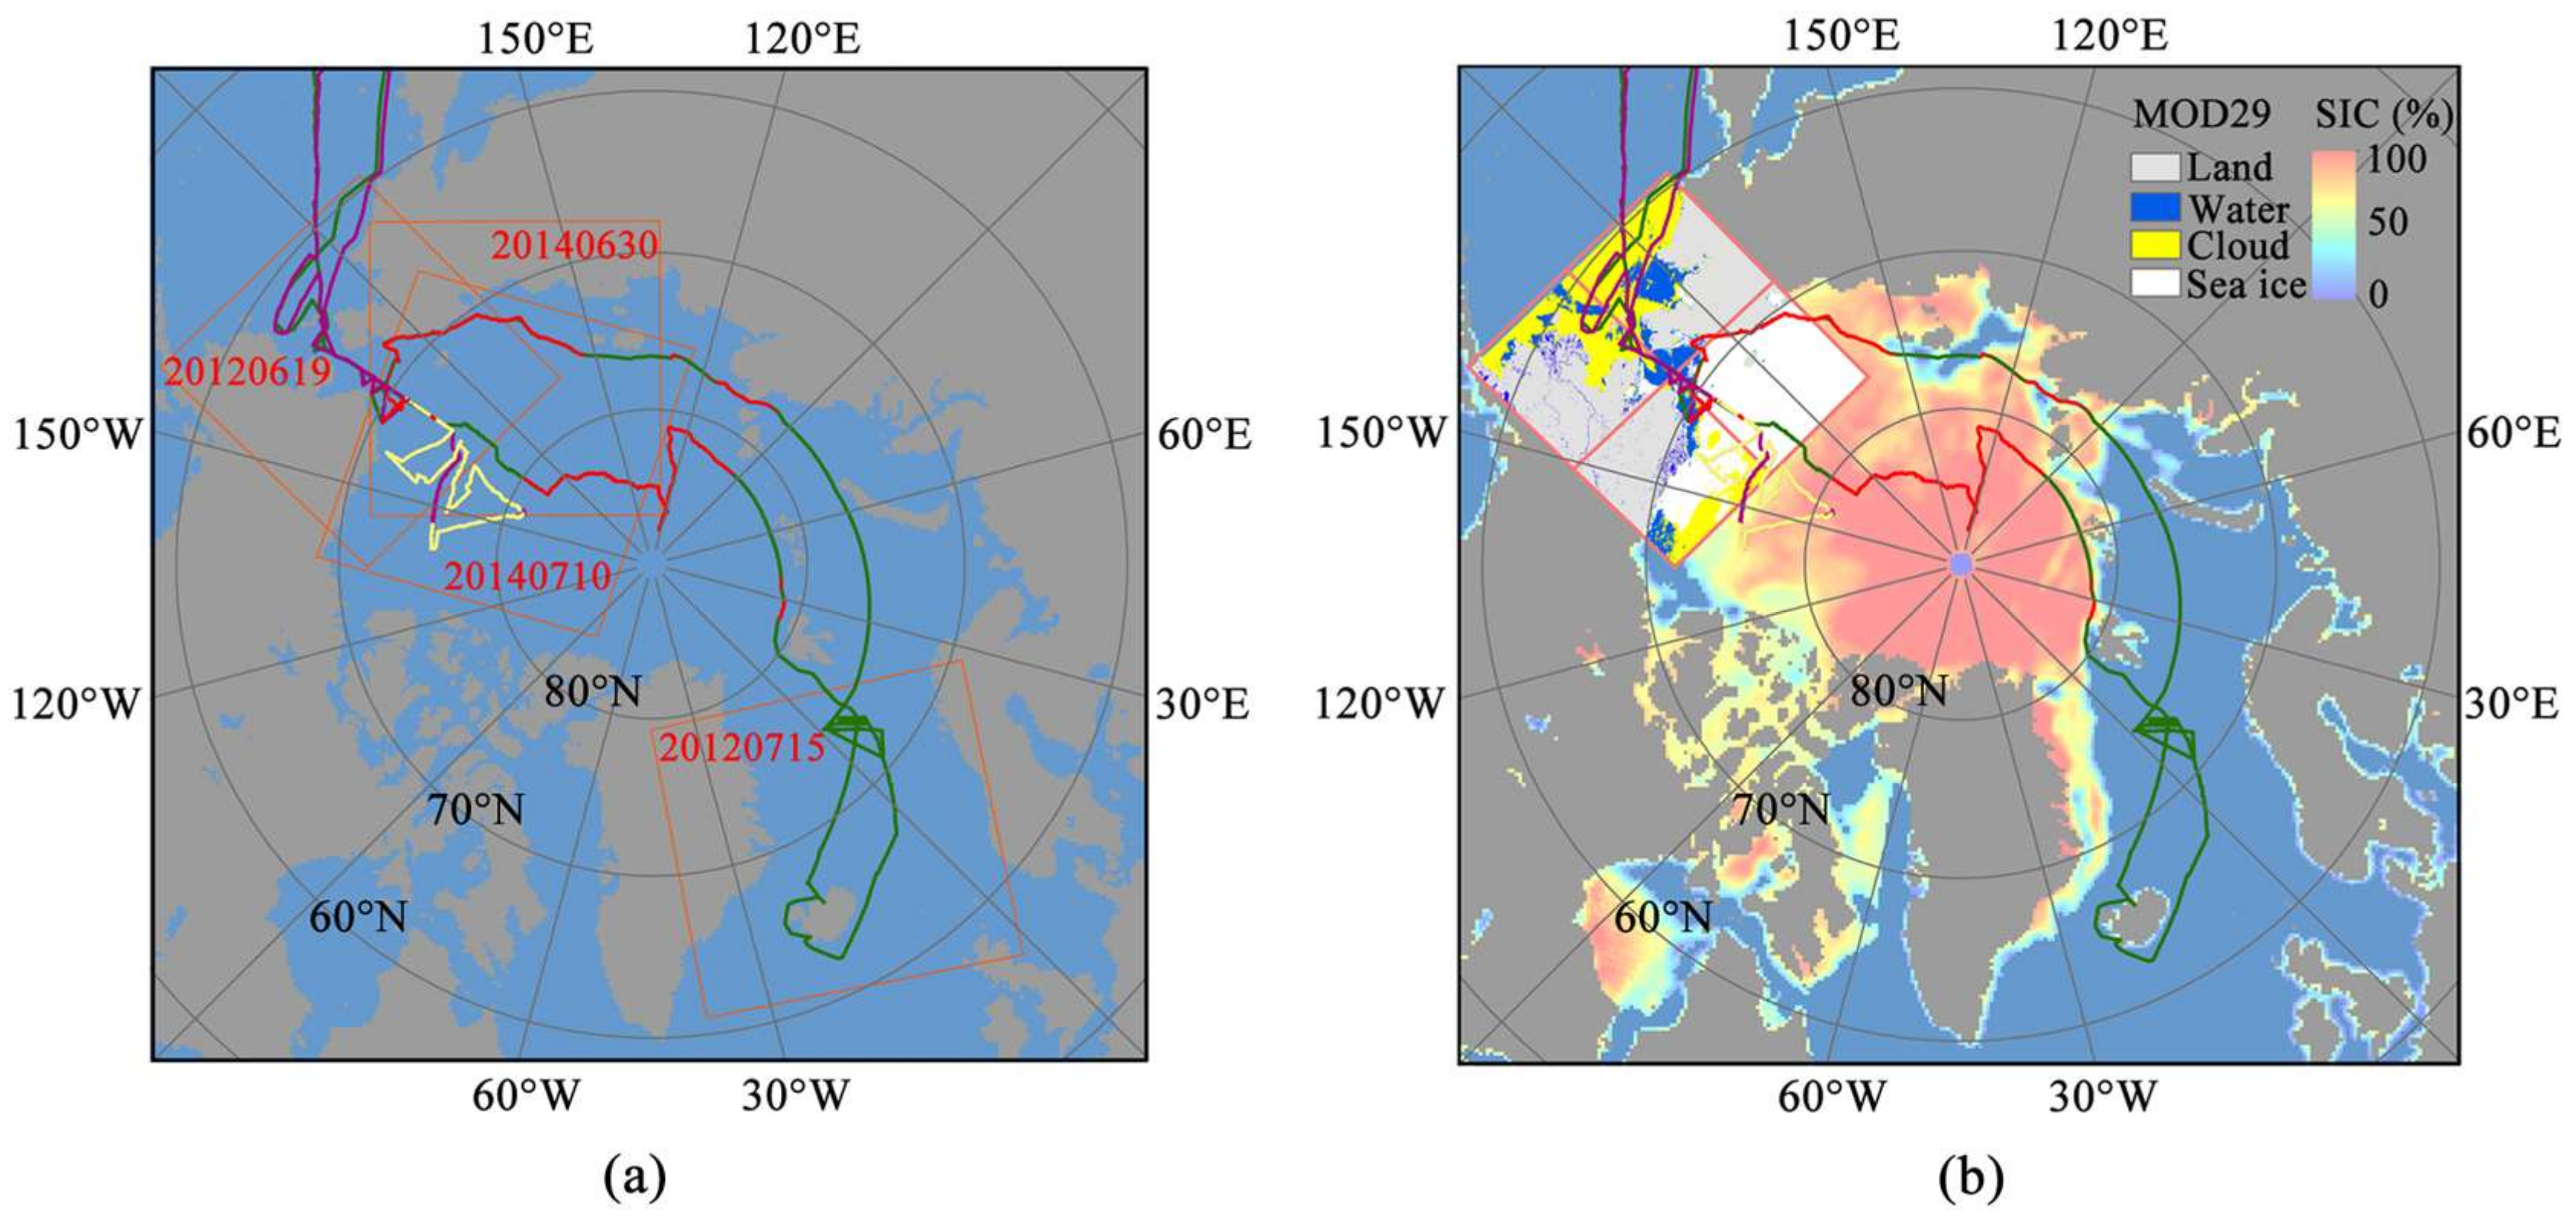
2.4. CHINARE-2012 and CHINARE-2014 Sea Ice Observations
3. Methods
3.1. Sea Ice Edge Lines Extraction from MOD29
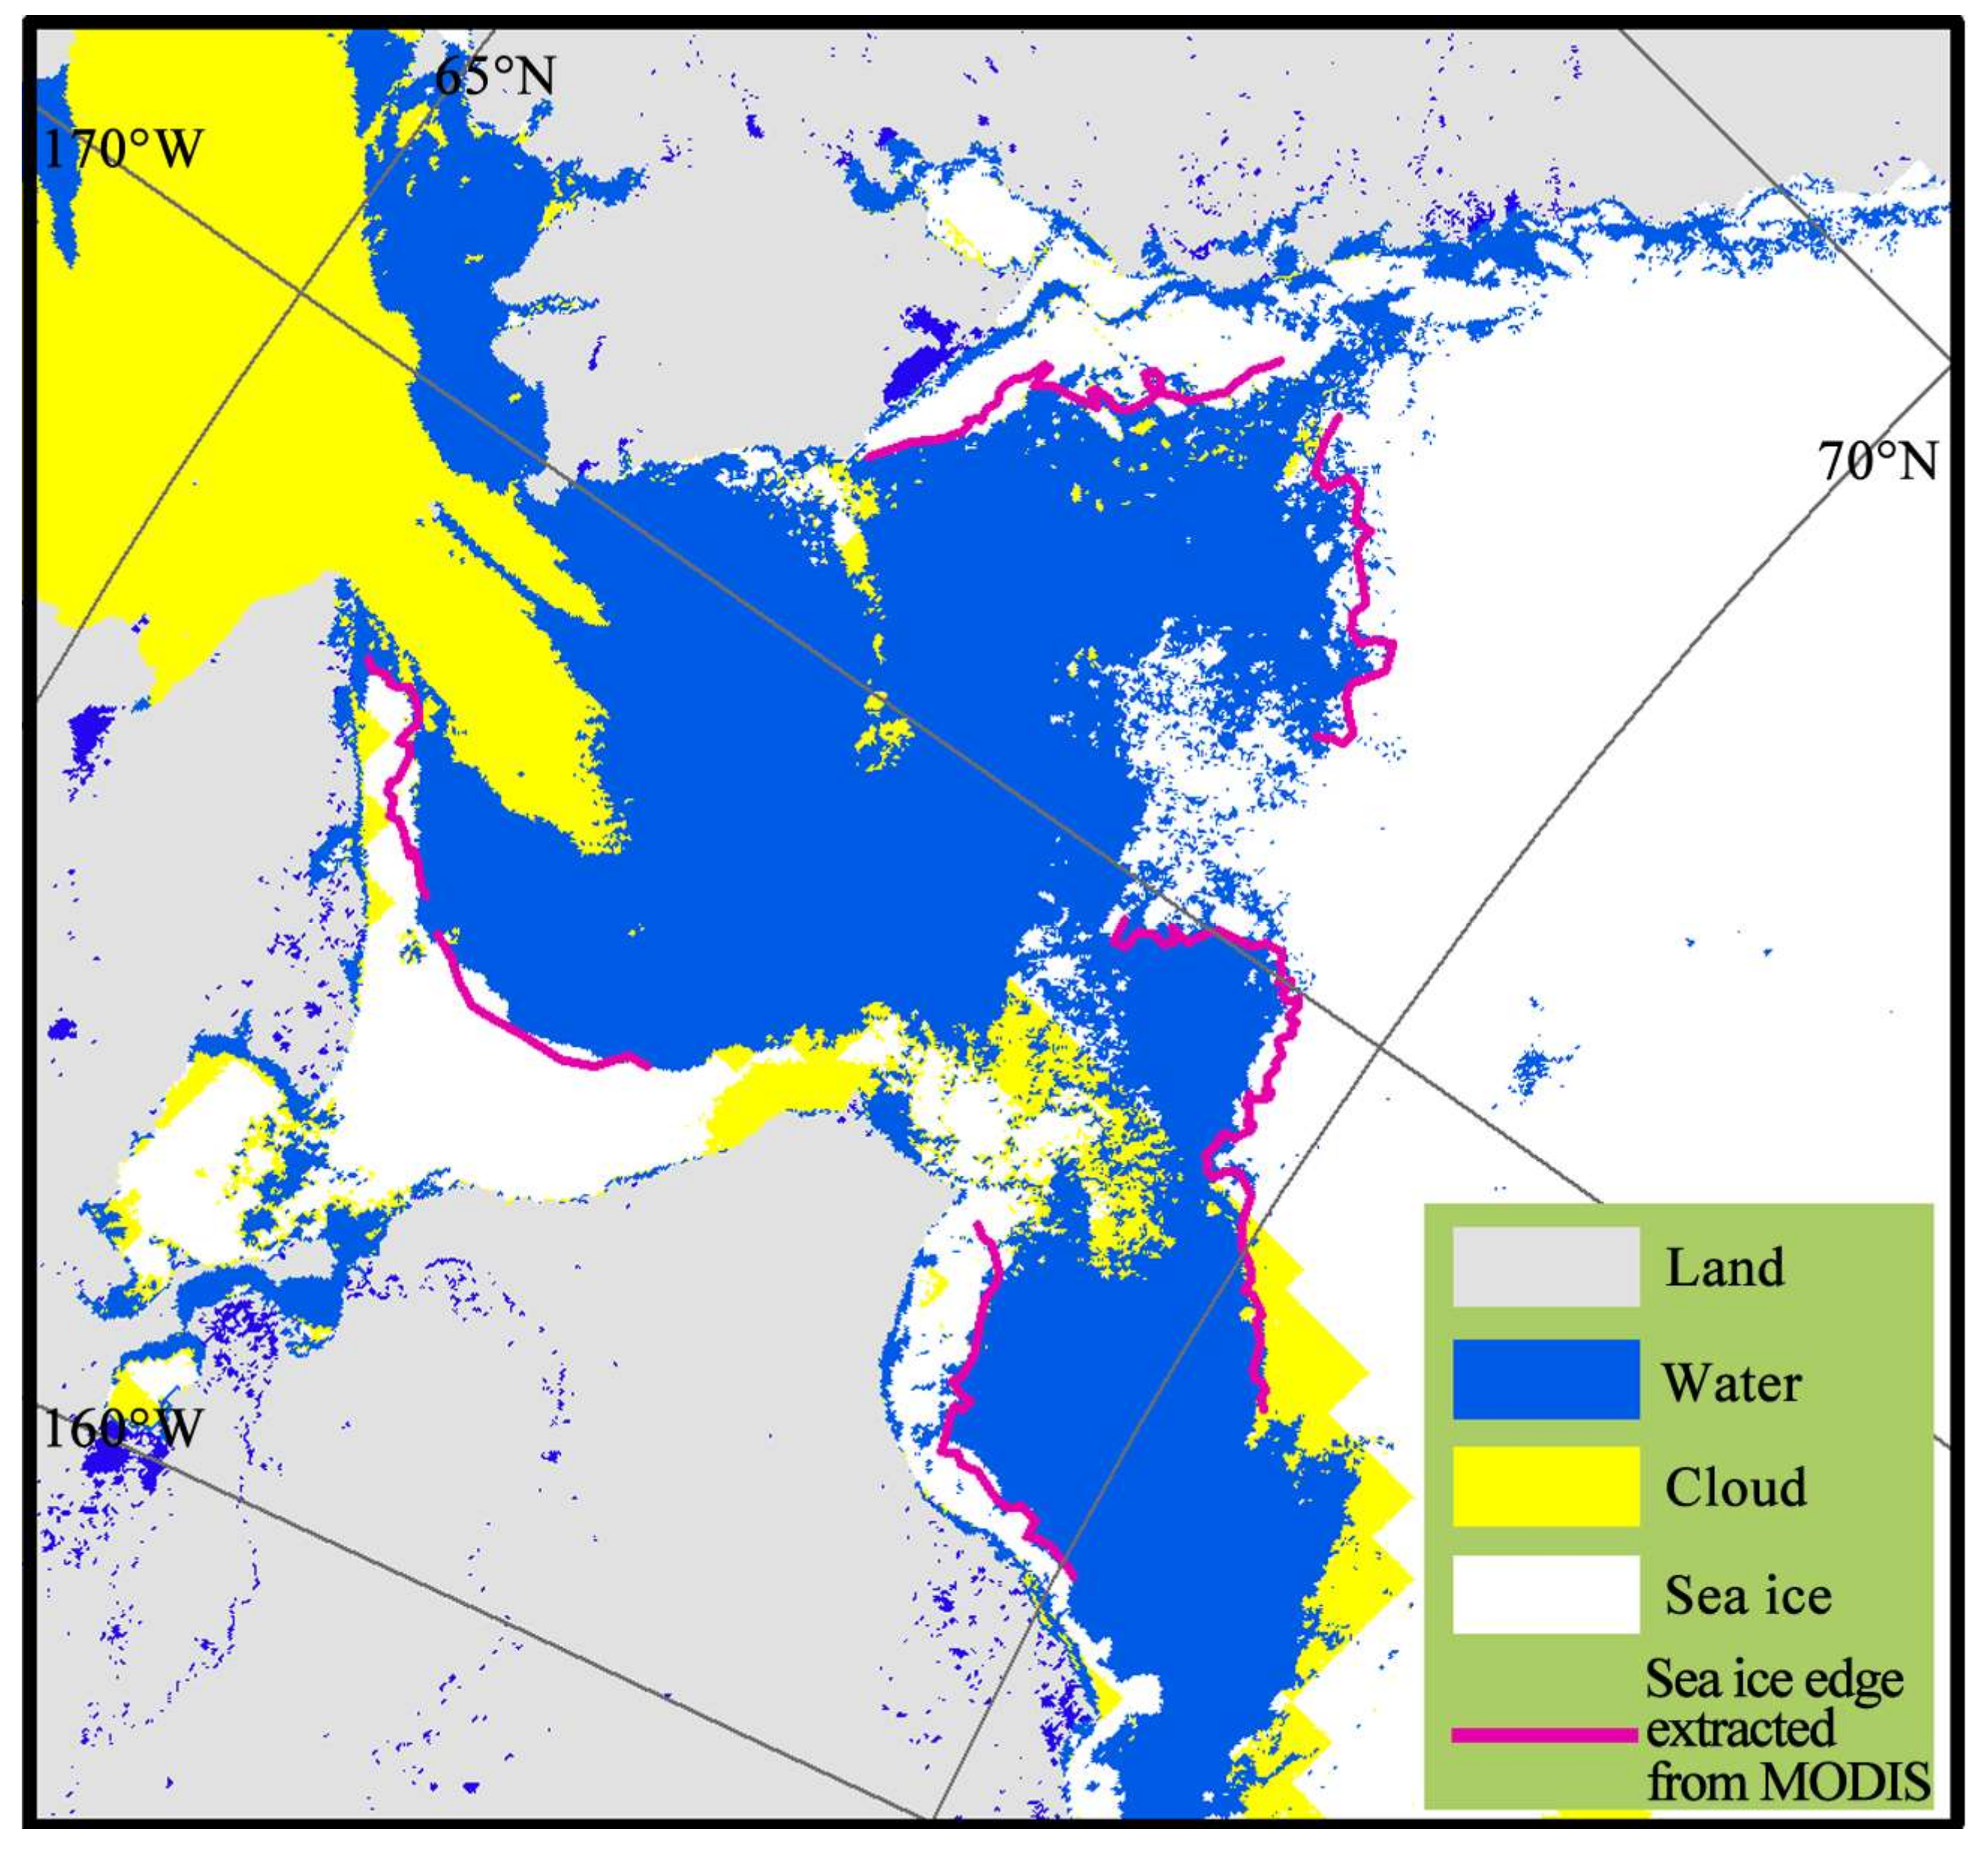
3.2. Sea Ice Edge Lines Visual Interpretation from MODIS Images
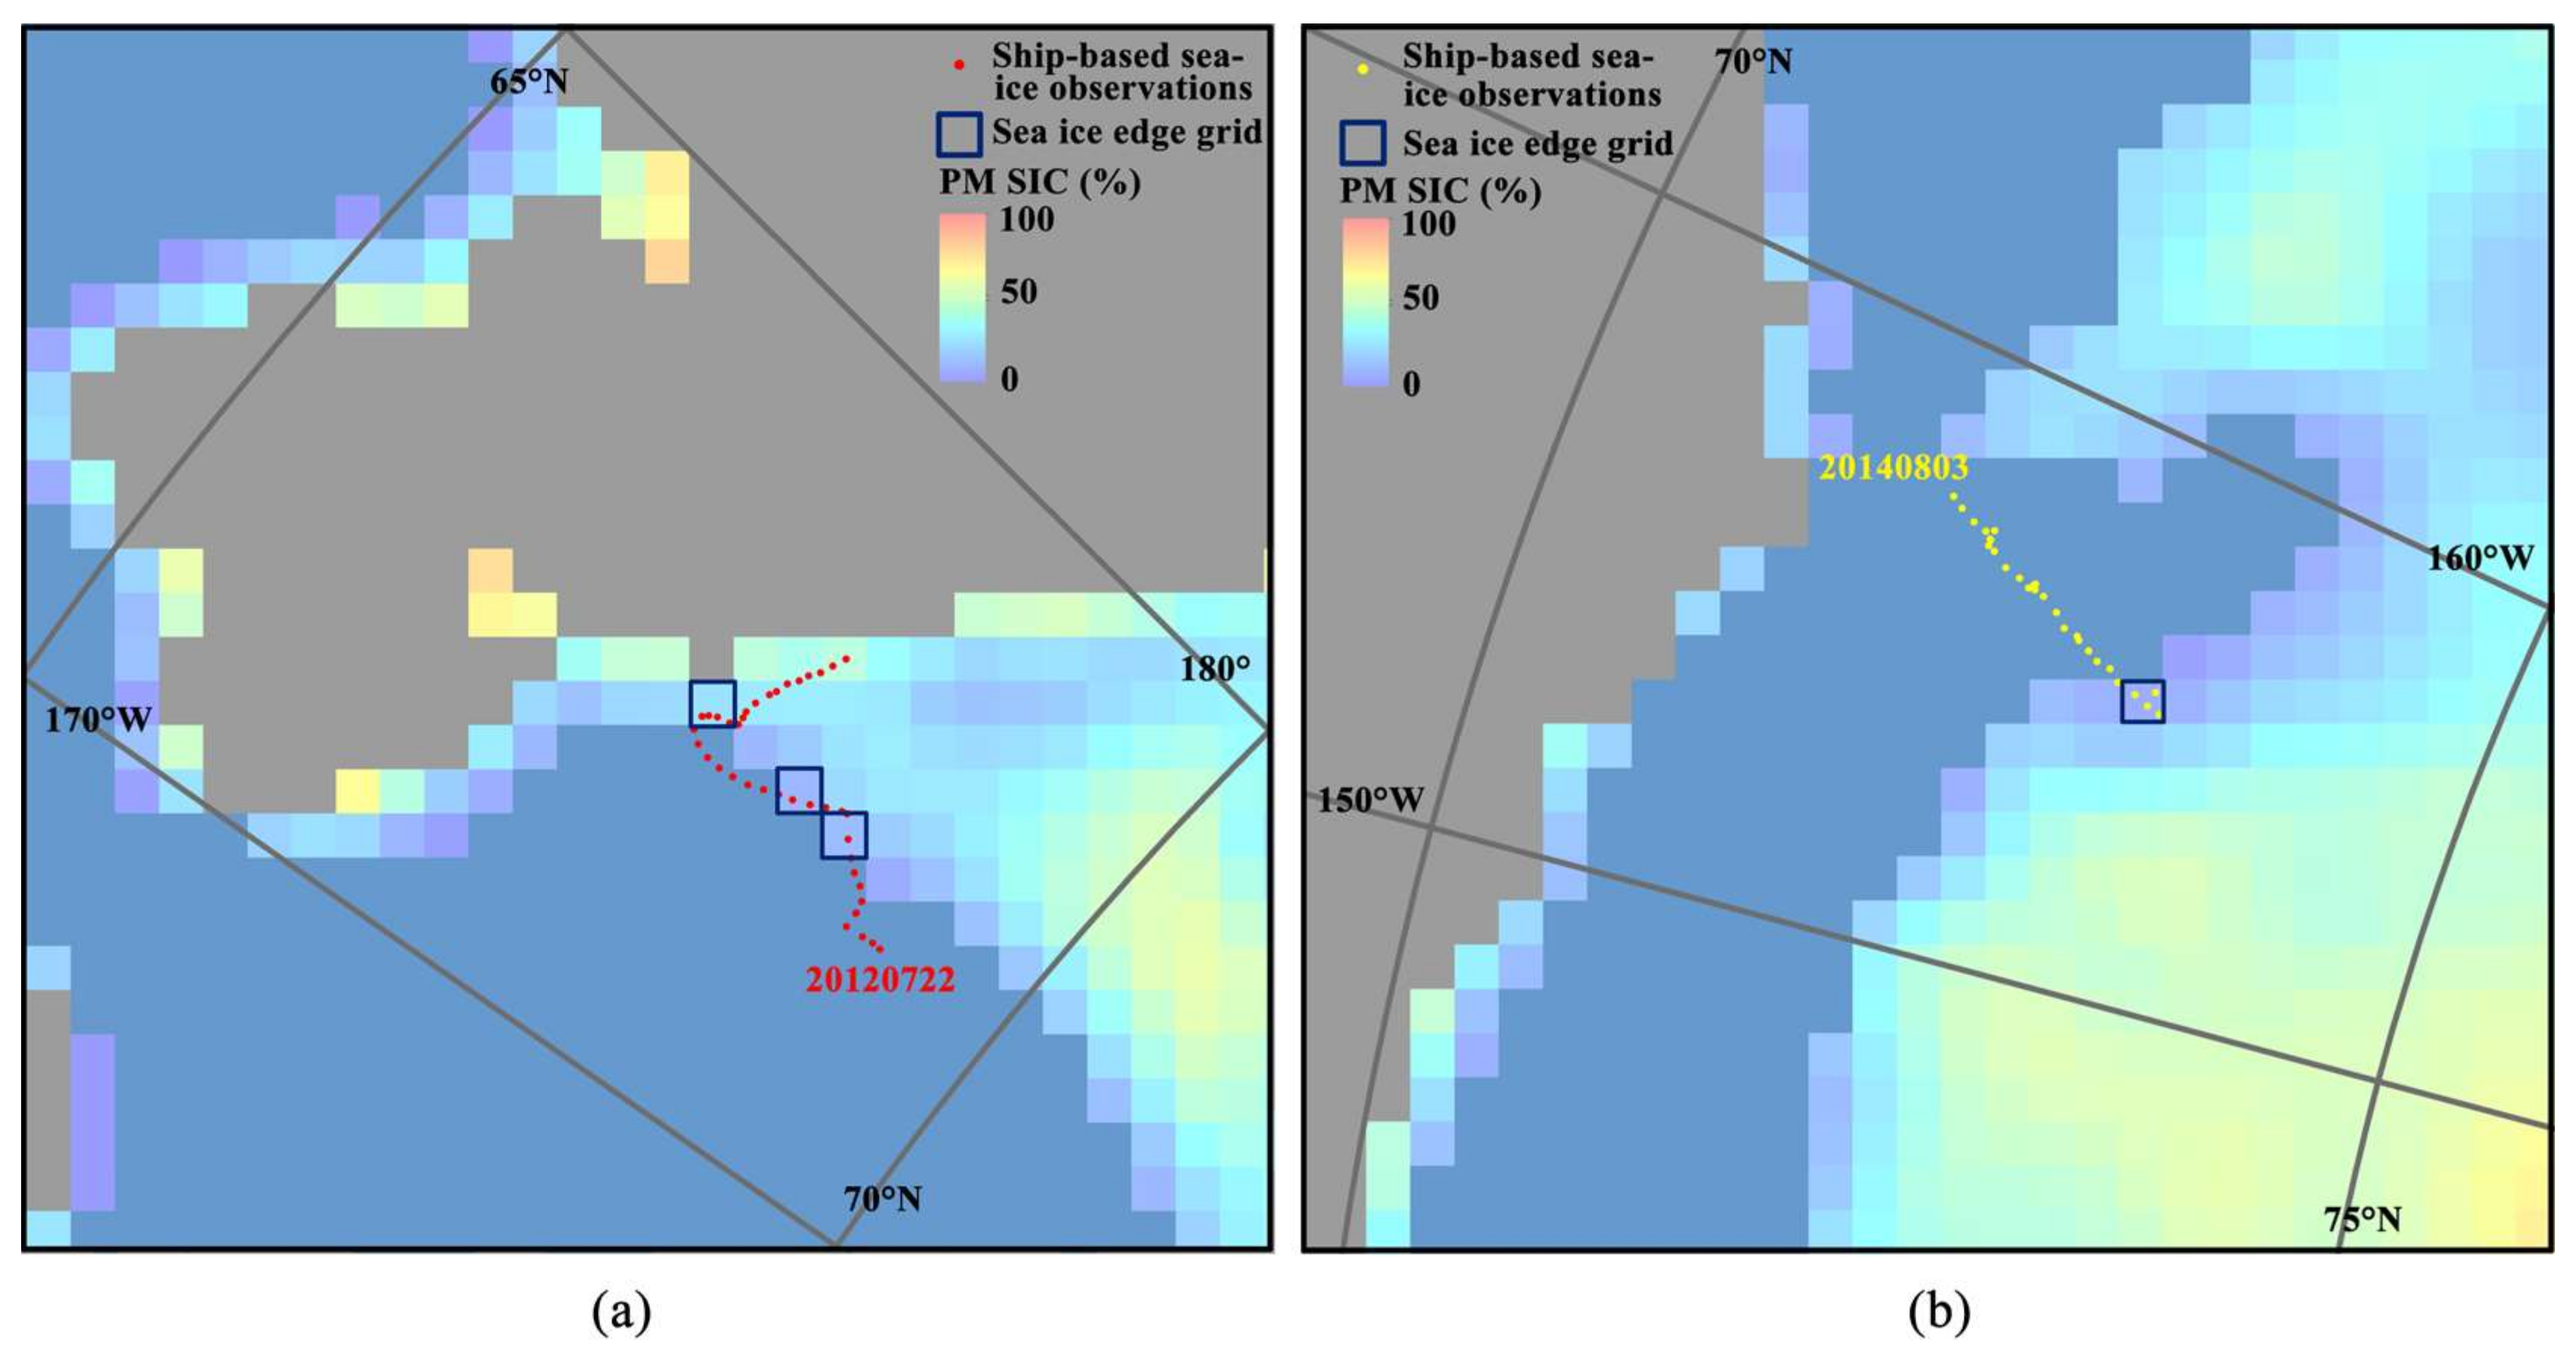
3.3. Sea Ice Edge Points Extraction from Ship-Based Observations
3.4. SSMIS SIC Threshold Calculated Based on Extracted Sea Ice Edge Lines and Points
4. Results
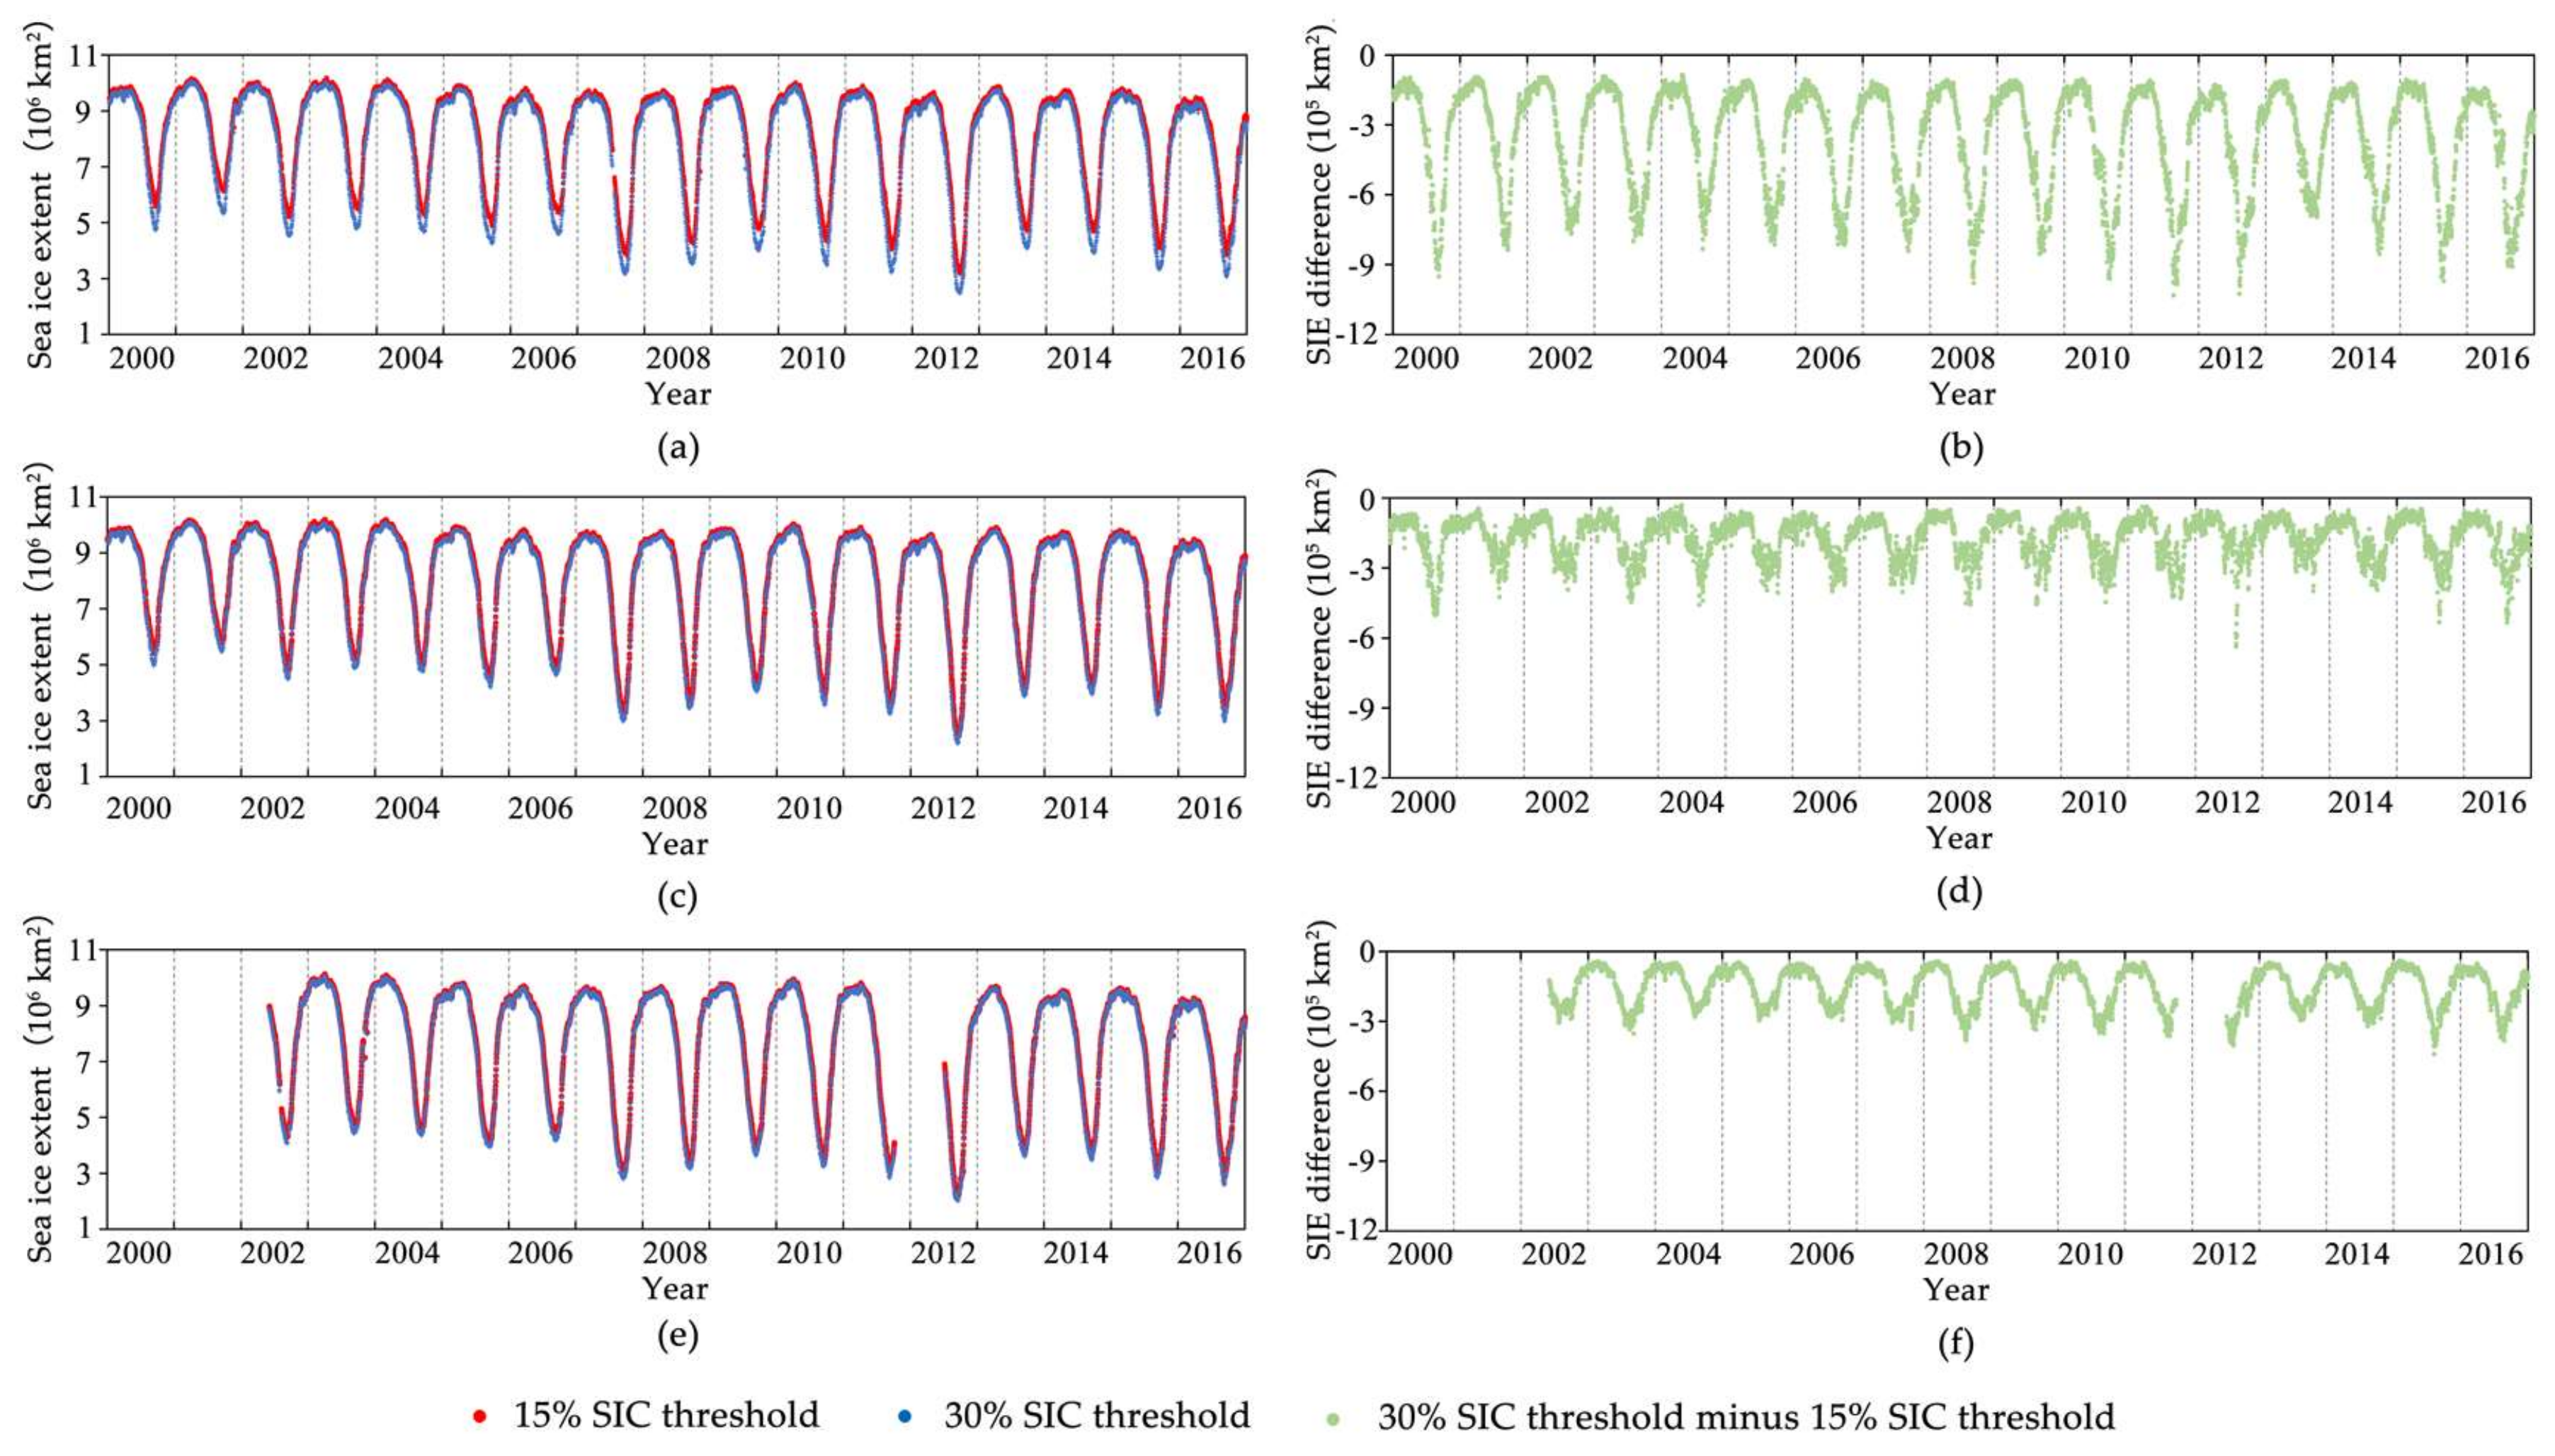
4.1. SSMIS SIC Threshold Based on MOD29 Sea Ice Edge Lines
4.2. SSMIS SIC Threshold Based on MODIS Sea Ice Edge Lines
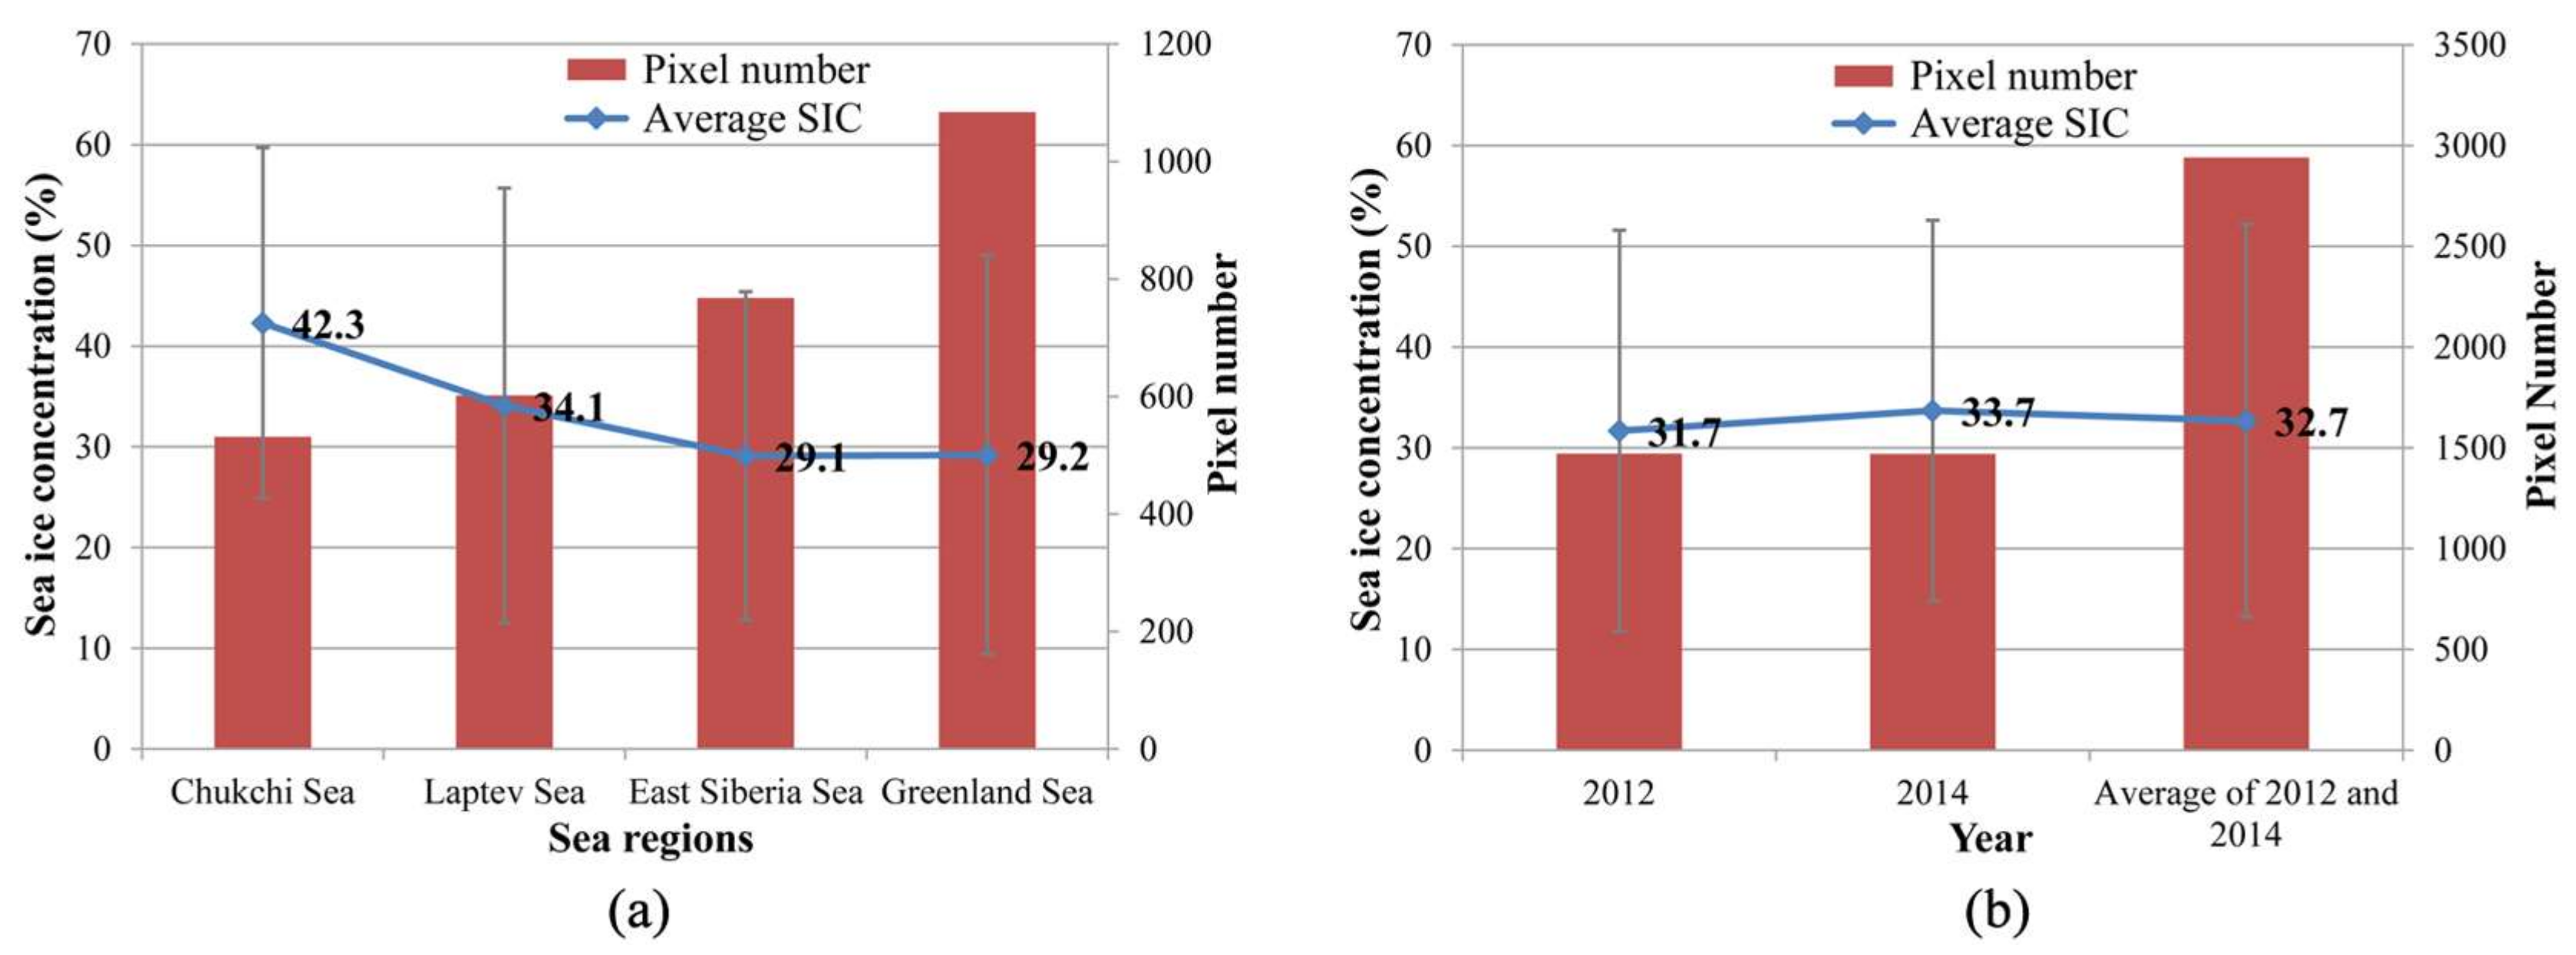
4.3. SSMIS SIC Threshold Based on Ship-Bbserved Sea Ice Edge Points
5. Discussion
6. Conclusions
Acknowledgments
Author Contributions
Conflicts of Interest
References
- Stocker, T. (Ed.) Climate Change 2013: The Physical Science Basis: Working Group I Contribution to the Fifth Assessment Report of the Intergovernmental Panel on Climate Change; Cambridge University Press: Oxford, UK, 2014. [Google Scholar]
- Screen, J.A.; Simmonds, I. The central role of diminishing sea ice in recent Arctic temperature amplification. Nature 2010, 464, 1334–1337. [Google Scholar] [CrossRef] [PubMed]
- Parkinson, C.L.; Comiso, J.C.; Zwally, H.J.; Cavalieri, D.J.; Gloersen, P.; Campbell, W.J. Arctic Sea Ice, 1973–1976: Satellite Passive-Microwave Observations; NASA Goddard Space Flight Center: Greenbelt, MD, USA, 1987.
- Bjørgo, E.; Johannessen, O.M.; Miles, M.W. Analysis of merged SMMR-SSMI time series of Arctic and Antarctic sea ice parameters 1978–1995. Geophys. Res. Lett. 1997, 24, 413–416. [Google Scholar] [CrossRef]
- Comiso, J.C.; Parkinson, C.L.; Gersten, R.; Stock, L. Accelerated decline in the Arctic sea ice cover. Geophys. Res. Lett. 2008, 35, L01703. [Google Scholar] [CrossRef]
- Parkinson, C.L.; DiGirolamo, N.E. New visualizations highlight new information on the contrasting Arctic and Antarctic sea-ice trends since the late 1970s. Remote Sens. Environ. 2016, 183, 198–204. [Google Scholar] [CrossRef]
- Zwally, H.J.; Gloersen, P. Passive microwave images of the Polar Regions and research applications. Pollar Rec. 1977, 18, 431–450. [Google Scholar] [CrossRef]
- Parkinson, C.L.; Cavalieri, D.J. Arctic sea ice 1973–1987: Seasonal, regional, and interannual variability. J. Geophys. Res. Oceans 1989, 94, 14499–14523. [Google Scholar] [CrossRef]
- Cavalieri, D.J.; Parkinson, C.L.; Gloersen, P.; Zwally, H.J. Sea Ice Concentrations from Nimbus-7 SMMR and DMSP SSM/I-SSMIS Passive Microwave Data, Version 1; NASA National Snow and Ice Data Center Distributed Active Archive Center: Boulder, CO, USA, 1996. [Google Scholar] [CrossRef]
- Remund, Q.P.; Long, D.G. Sea ice extent mapping using Ku band scatterometer data. J. Geophys. Res. Oceans 1999, 104, 11515–11527. [Google Scholar] [CrossRef]
- Worby, A.P.; Comiso, J.C. Studies of the Antarctic Sea Ice Edge and Ice Extent from Satellite and Ship Observations. Remote Sens. Environ. 2004, 92, 98–111. [Google Scholar] [CrossRef]
- Fetterer, F.; Knowles, K.; Meier, W.; Savoie, M.; Windnagel, A.K. Sea Ice Index, Version 3; NSIDC National Snow and Ice Data Center: Boulder, CO, USA, 2017; Available online: http://nsidc.org/data/G02135 (accessed on 30 June 2017).
- Stroeve, J.; Meier, W. Sea Ice Trends and Climatologies from SMMR and SSM/I-SSMIS, Version 2; National Snow and Ice Data Center Distributed Active Archive Center: Boulder, CO, USA, 2017; Available online: http://nsidc.org/data/NSIDC-0192 (accessed on 30 June 2017).
- Yi, D.; Zwally, H.J. Arctic Sea Ice Freeboard and Thickness, Version 1; NSIDC National Snow and Ice Data Center: Boulder, CO, USA, 2014; Available online: http://nsidc.org/data/NSIDC-0393 (accessed on 30 June 2017).
- Divine, D.V.; Dick, C. March through August Ice Edge Positions in the Nordic Seas, 1750-2002, Version 1; NSIDC National Snow and Ice Data Center: Boulder, CO, USA, 2007; Available online: http://nsidc.org/data/G02169 (accessed on 30 June 2017).
- Kurtz, N.; Harbeck, J. CryoSat-2 Level-4 Sea Ice Elevation, Freeboard, and Thickness, Version 1; NASA National Snow and Ice Data Center Distributed Active Archive Center: Boulder, CO, USA, 2017; Available online: http://nsidc.org/data/RDEFT4 (accessed on 30 June 2017).
- Aaboe, S.; Breivik, A.; Sorensen, A.; Eastwood, S.; Lavergne, T. Global Sea Ice Edge and Type Product, Version 1.3; OSI SAF Ocean and Sea Ice Satellite Application Facility. 2016. Available online: http://saf.met.no/p/ice/edge_type_long_description.html (accessed on 30 June 2017). OSI SAF Ocean and Sea Ice Satellite Application Facility.
- Cavalieri, D.J.; Gloersen, P.; Campbell, W.J. Determination of Sea Ice Parameters with the NIMBUS-7 SMMR. J. Geophys. Res. 1984, 89, 5355–5369. [Google Scholar] [CrossRef]
- Gloersen, P.; Cavalieri, D.J. Reduction of Weather Effects in the Calculation of Sea Ice Concentration from Microwave Radiances. J. Geophys. Res. 1986, 91, 3913–3919. [Google Scholar] [CrossRef]
- Cavalieri, D.J.; Parkinson, C.L. Arctic sea ice variability and trends, 1979–2010. Cryosphere 2012, 6, 881–889. [Google Scholar] [CrossRef]
- Shokr, M.; Nirmal, S. Sea Ice: Physics and Remote Sensing; John Wiley & Sons: Hoboken, NJ, USA, 2015. [Google Scholar]
- Hall, D.K.; Riggs, G.A. MODIS/Terra Sea Ice Extent 5-min L2 Swath 1 km, Version 6; NASA National Snow and Ice Data Center Distributed Active Archive Center: Boulder, CO, USA, 2015; Available online: http://nsidc.org/data/MOD29 (accessed on 29 February 2016).
- Hall, D.K.; Riggs, G.A.; Salomonson, V.V. Algorithm Theoretical Basis Document (ATBD) for the MODIS Snow and Sea Ice-Mapping Algorithms; Goddard Space Flight Center: Greenbelt, MD, USA, 2001.
- Hall, D.K.; Riggs, G.A. MODIS L1B product Version 6; NASA Goddard Space Flight Center: Greenbelt, MD, USA, 2011. Available online: https://ladsweb.nascom.nasa.gov (accessed on 1 April 2016).
- Serreze, M.C.; Maslanik, J.A.; Scambos, T.A.; Fetterer, F.; Stroeve, J.; Knowles, K.; Fowler, C.; Drobot, S.; Barry, R.G.; Haran, T.M. A record minimum arctic sea ice extent and area in 2002. Geophys. Res. Lett. 2003, 30, 1110. [Google Scholar] [CrossRef]
- CHINARE. Sea Ice Observational Data Based on R/V Xuelong; Chinese National Arctic and Antarctic Data Center: Shanghai, China, 2010. Available online: http://www.chinare.org.cn/PO/physics (accessed on 2 May 2016).
- Worby, A.P.; Allison, I.; Dirita, V. A Technique for Making Ship-Based Observations of Antarctic Sea Ice Thickness and Characteristics; Antarctic CRC: Hobart, Australia, 1999. [Google Scholar]
- Stroeve, J.; Holland, M.M.; Meier, W.; Scambos, T.A.; Serreze, M. Arctic sea ice decline: Faster than forecast. Geophys. Res. Lett. 2007, 34, L09501. [Google Scholar] [CrossRef]
- Serreze, M.C.; Stroeve, J. Arctic sea ice trends, variability and implications for seasonal ice forecasting. Philos. Trans. R. Soc. A 2015, 373, 20140159. [Google Scholar] [CrossRef] [PubMed]
- Divine, D.V.; Dick, C. Historical variability of sea ice edge position in the Nordic Seas. J. Geophys. Res. Oceans 2006, 111, C01001. [Google Scholar] [CrossRef]
- Comiso, J.C.; Parkinson, C.L. Arctic sea ice parameters from AMSR-E data using two techniques and comparisons with sea ice from SSM/I. J. Geophys. Res. Oceans 2008, 113. [Google Scholar] [CrossRef]
- Heygster, G.; Wiebe, H.; Spreen, G.; Kaleschke, L. AMSR-E geolocation and validation of sea ice concentrations based on 89GHz Data. J. Remote Sens. Soc. Jpn. 2009, 29, 226–235. [Google Scholar]
- Beitsch, A.; Kern, S.; Kaleschke, L. Comparison of SSM/I and AMSR-E sea ice concentrations with ASPeCt ship observations around Antarctica. IEEE Trans. Geosci. Remote Sens. 2014, 53, 1985–1996. [Google Scholar] [CrossRef]
- Comiso, J.C.; Cavalieri, D.J.; Parkinson, C.L.; Gloersen, P. Passive microwave algorithms for sea ice concentration: A comparison of two technique. Remote Sens. Environ. 1997, 60, 357–384. [Google Scholar] [CrossRef]
- Spreen, G.; Kaleschke, L.; Heygster, G. Sea ice remote sensing using AMSR-E 89 GHz Channels. J. Geophys. Res. Oceans 2008, 113, C02S03. [Google Scholar] [CrossRef]


| Channel | FOV (km) | NSIDC Polar Stereographic Projection Grid Size (km) |
|---|---|---|
| 19V | 70 × 45 | 25 |
| 19H | 70 × 45 | 25 |
| 37V | 38 × 30 | 25 |
| Coefficient | Value |
|---|---|
| a0 | 3290.2 |
| a1 | –20,761.2 |
| a2 | 23,934.0 |
| a3 | 47,985.4 |
| b0 | –790.9 |
| b1 | 13,825.3 |
| b2 | –33,155.8 |
| b3 | –47,771.9 |
| c0 | 2035.3 |
| c1 | 9244.6 |
| c2 | –5665.8 |
| c3 | –12,875.1 |
| Arctic Sea Regions | 2012 | 2014 | ||||
|---|---|---|---|---|---|---|
| June | July | August | June | July | August | |
| Chukchi Sea | 7 | 4 | 0 | 1 | 1 | 0 |
| East Siberian Sea | 0 | 1 | 1 | 4 | 4 | 8 |
| Laptev Sea | 2 | 3 | 0 | 6 | 3 | 1 |
| Greenland Sea | 5 | 7 | 4 | 3 | 2 | 2 |
| Date | Sea Regions | MODIS Visual Interpretation | MOD29 Extraction | ||
|---|---|---|---|---|---|
| Average (%) | Standard Deviation (%) | Average (%) | Standard Deviation (%) | ||
| 19 June 2012 | Chukchi Sea | 33 | 14 | 36 | 13 |
| 15 July 2012 | Greenland Sea | 34 | 15 | 35 | 17 |
| 30 June 2014 | Laptev Sea | 37 | 17 | 38 | 21 |
| 10 July 2014 | East Siberia Sea | 34 | 17 | 35 | 7 |
| Data | Ship-Observed SIC at Sea Ice Edge Points (%) | SSIMS SIC Corresponding to Ship-Observed Sea Ice Edge Points (%) |
|---|---|---|
| 20 July 2012 | 50 | 43 |
| 22 July 2012 | 12 | 21 |
| 26 July 2012 | 35 | 28 |
| 27 July 2012 | 43 | 26 |
| 28 July 2012 | 31 | 23 |
| 4 September 2012 | 41 | 28 |
| 31 July 2014 | 17 | 31 |
| 2 August 2014 | 33 | 28 |
| 3 August 2014 | 39 | 21 |
| 31 August 2014 | 21 | 21 |
| 1 September 2014 | 15 | 22 |
| Average | 31 | 27 |
| Date | Sea Regions | SIC Based on Bootstrap Algorithm | SIC Based on ASI Algorithm | ||
|---|---|---|---|---|---|
| Average (%) | Standard Deviation (%) | Average (%) | Standard Deviation (%) | ||
| 19 June 2012 | Chukchi Sea | 31 | 18 | 28 | 18 |
| 15 July 2012 | Greenland Sea | 29 | 16 | 32 | 16 |
| 30 June 2014 | Laptev Sea | 38 | 16 | 33 | 17 |
| 10 July 2014 | East Siberia Sea | 34 | 17 | 25 | 18 |
© 2018 by the authors. Licensee MDPI, Basel, Switzerland. This article is an open access article distributed under the terms and conditions of the Creative Commons Attribution (CC BY) license (http://creativecommons.org/licenses/by/4.0/).
Share and Cite
Ji, Q.; Li, F.; Pang, X.; Luo, C. Statistical Analysis of SSMIS Sea Ice Concentration Threshold at the Arctic Sea Ice Edge during Summer Based on MODIS and Ship-Based Observational Data. Sensors 2018, 18, 1109. https://doi.org/10.3390/s18041109
Ji Q, Li F, Pang X, Luo C. Statistical Analysis of SSMIS Sea Ice Concentration Threshold at the Arctic Sea Ice Edge during Summer Based on MODIS and Ship-Based Observational Data. Sensors. 2018; 18(4):1109. https://doi.org/10.3390/s18041109
Chicago/Turabian StyleJi, Qing, Fei Li, Xiaoping Pang, and Cong Luo. 2018. "Statistical Analysis of SSMIS Sea Ice Concentration Threshold at the Arctic Sea Ice Edge during Summer Based on MODIS and Ship-Based Observational Data" Sensors 18, no. 4: 1109. https://doi.org/10.3390/s18041109
APA StyleJi, Q., Li, F., Pang, X., & Luo, C. (2018). Statistical Analysis of SSMIS Sea Ice Concentration Threshold at the Arctic Sea Ice Edge during Summer Based on MODIS and Ship-Based Observational Data. Sensors, 18(4), 1109. https://doi.org/10.3390/s18041109