3.1. Saw Propagation Analysis
Initially, in order to validate our simulation method for the AlN/SiO
2/Si (fast-slow-fast) structure, we first used the AlN/Diamond (slow-fast) structure, which was presented in Reference [
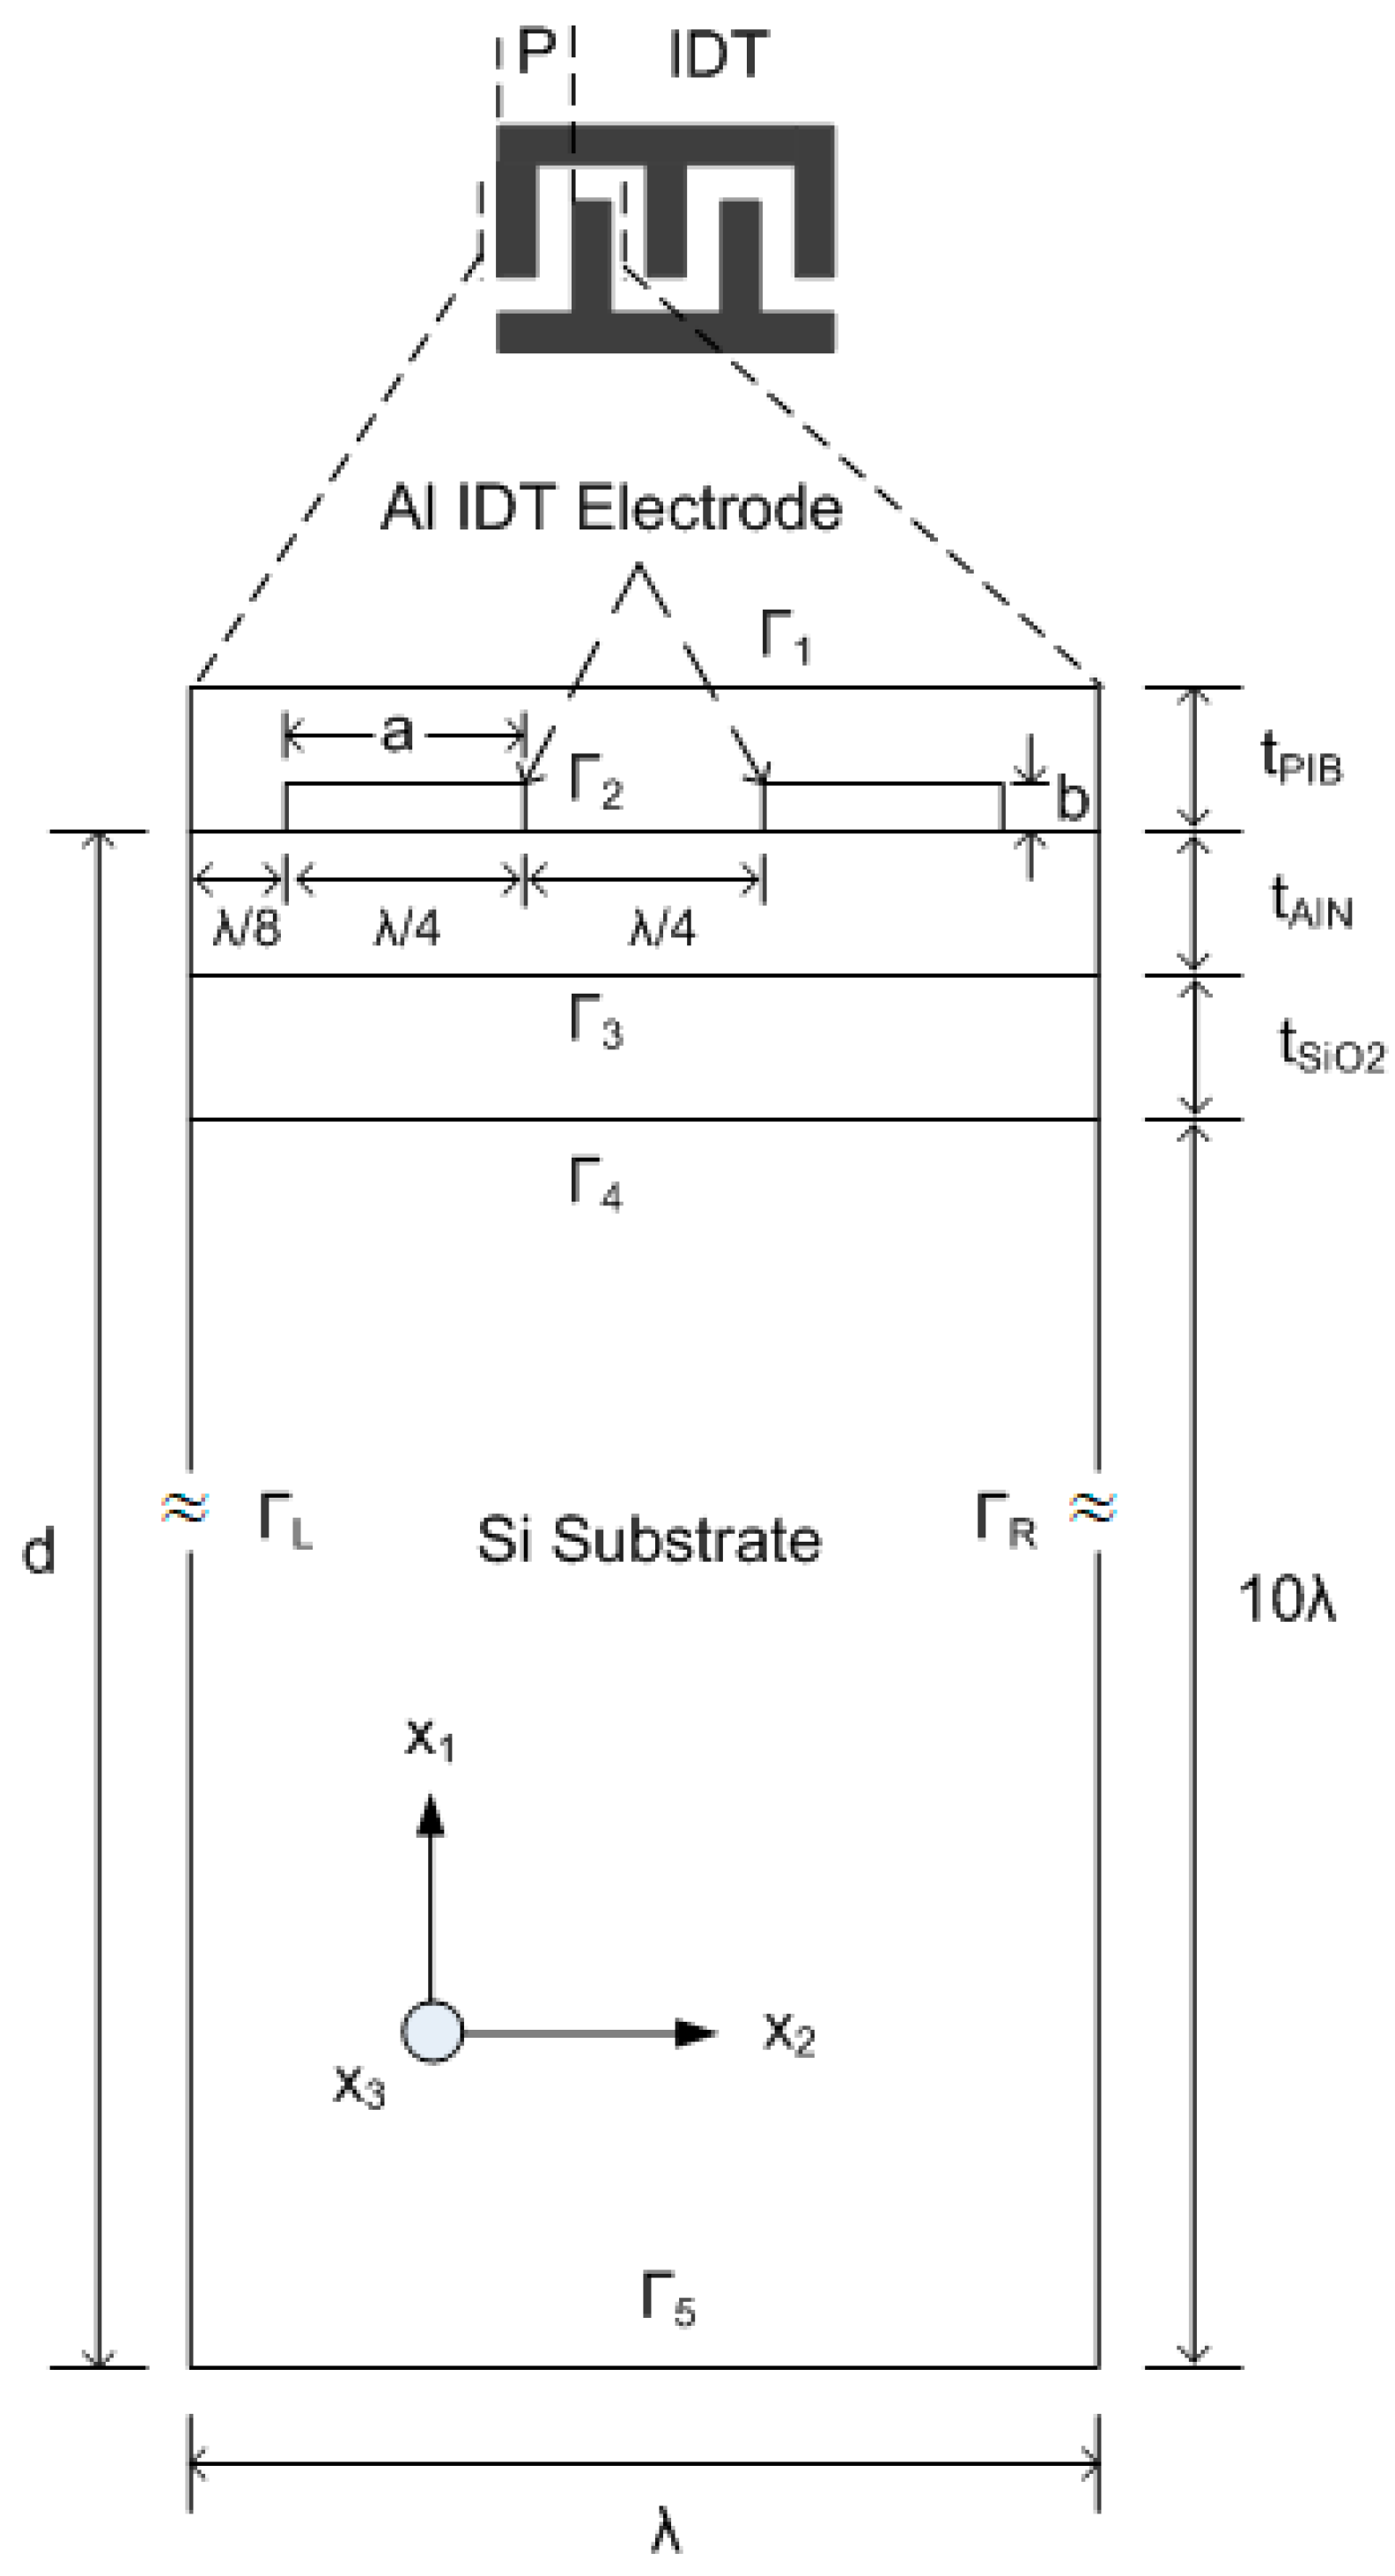
19]. In that work, the SAW propagation characteristics were theoretically calculated by PC acoustic wave software from McGill University. This software is based on a transfer matrix method for calculating SAW propagation in multilayer structures. We extracted their numerical data by using a semi-automated open source plot digitizer tool, that is, WebPlotDigitizer v. 3.12, which has been used in many published works. In our study, we performed a FEM simulation analysis of the AlN/Diamond structure by using the unit cell as in
Figure 1 (but with two layers, i.e., AlN/Diamond) and the boundary conditions as in
Table 2. Same material constants were used as described in Reference [
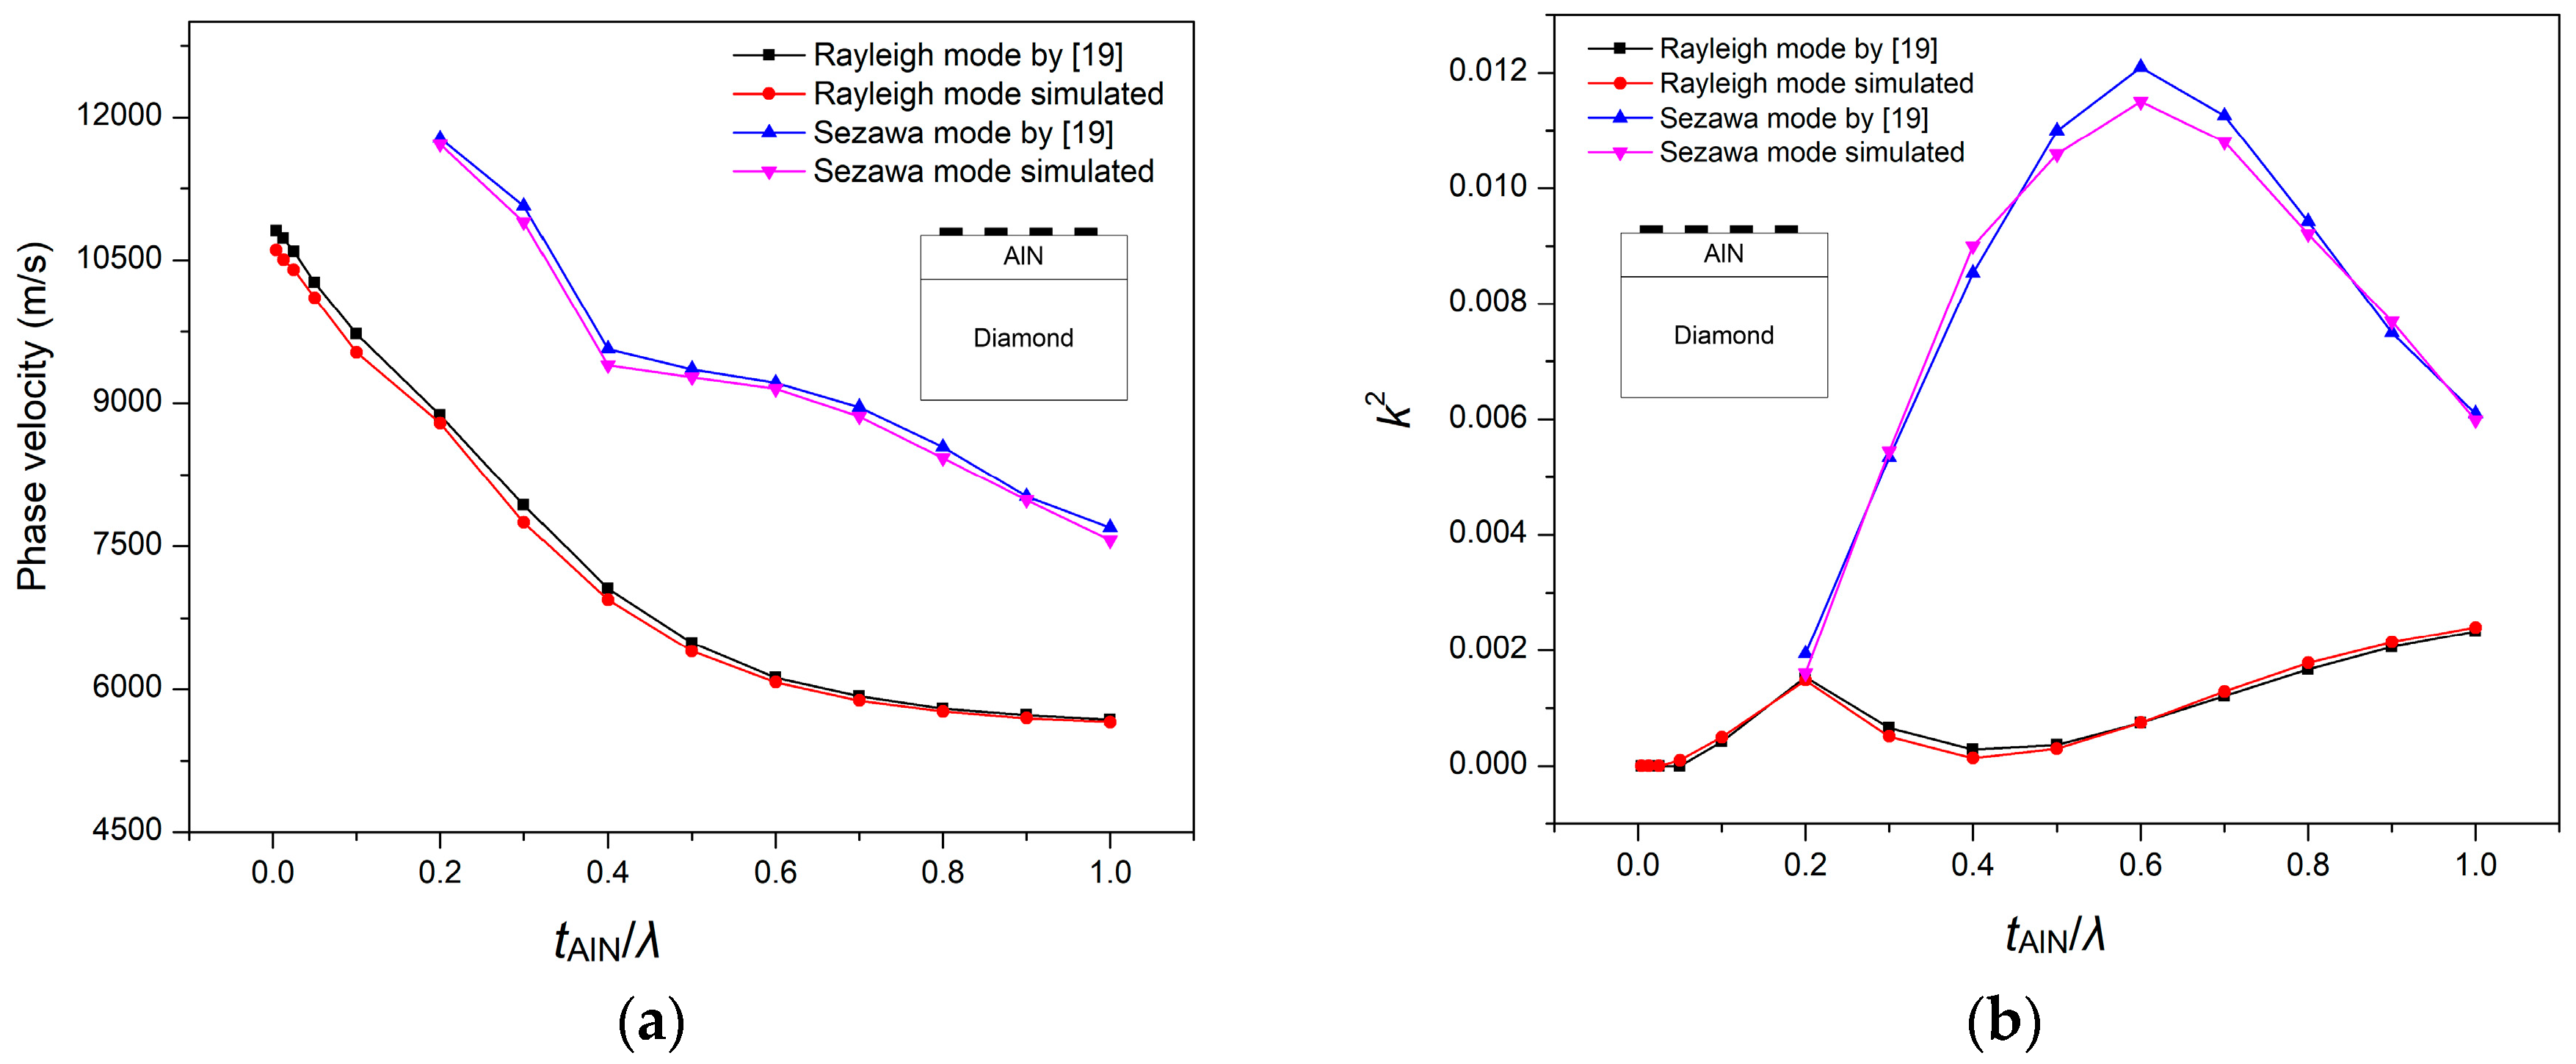
19]. The SAW propagation properties are calculated by (1), (2) and (3). The simulated results are shown in
Figure 2, which are quite close to that of Reference [
19]. The minor error can be attributed to the difference in the methods used. The method used in Reference [
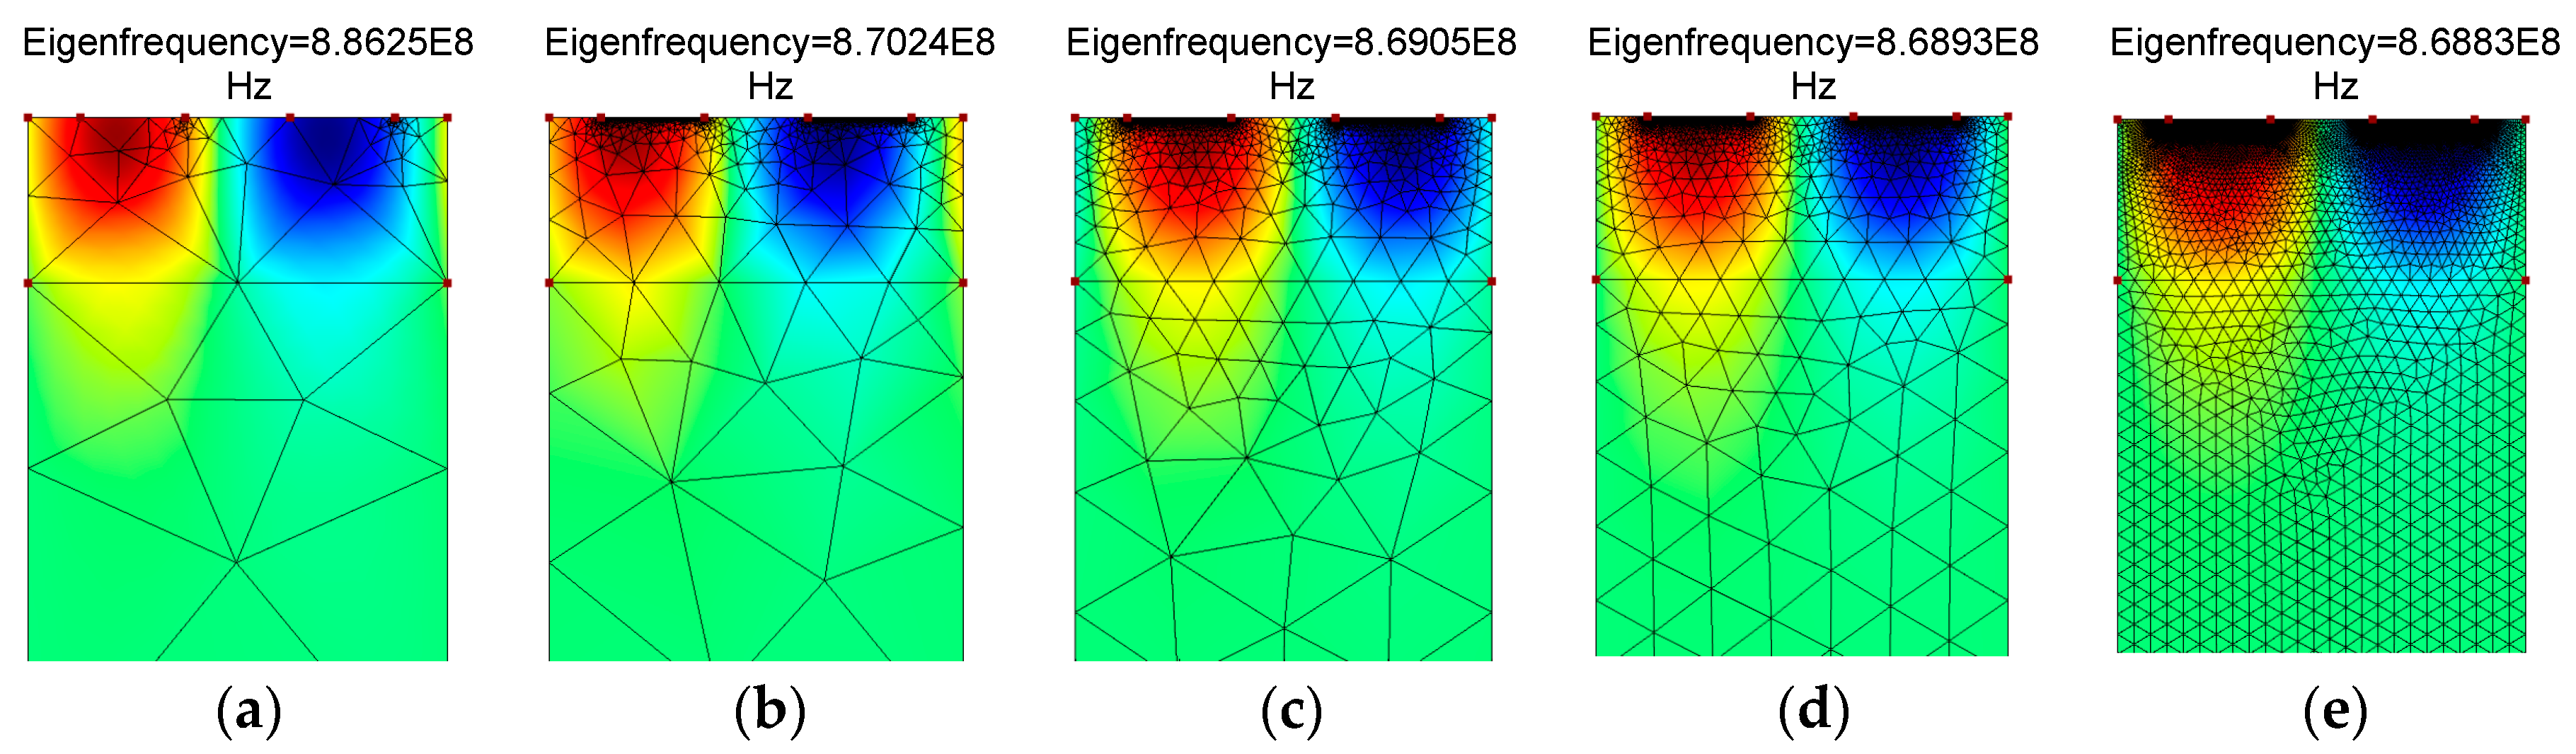
19] relied on a transfer matrix method that makes assumptions of several thin layers in approximating the behavior of interfacial layers, while this paper uses an FEM method. In order to justify the sufficiency of mesh density, a mesh convergence study was also conducted until the values of the velocity of SAW became constant. The mesh profile for a specific thickness of the AlN layer (i.e., t
AlN/
= 0.4) is summarized in
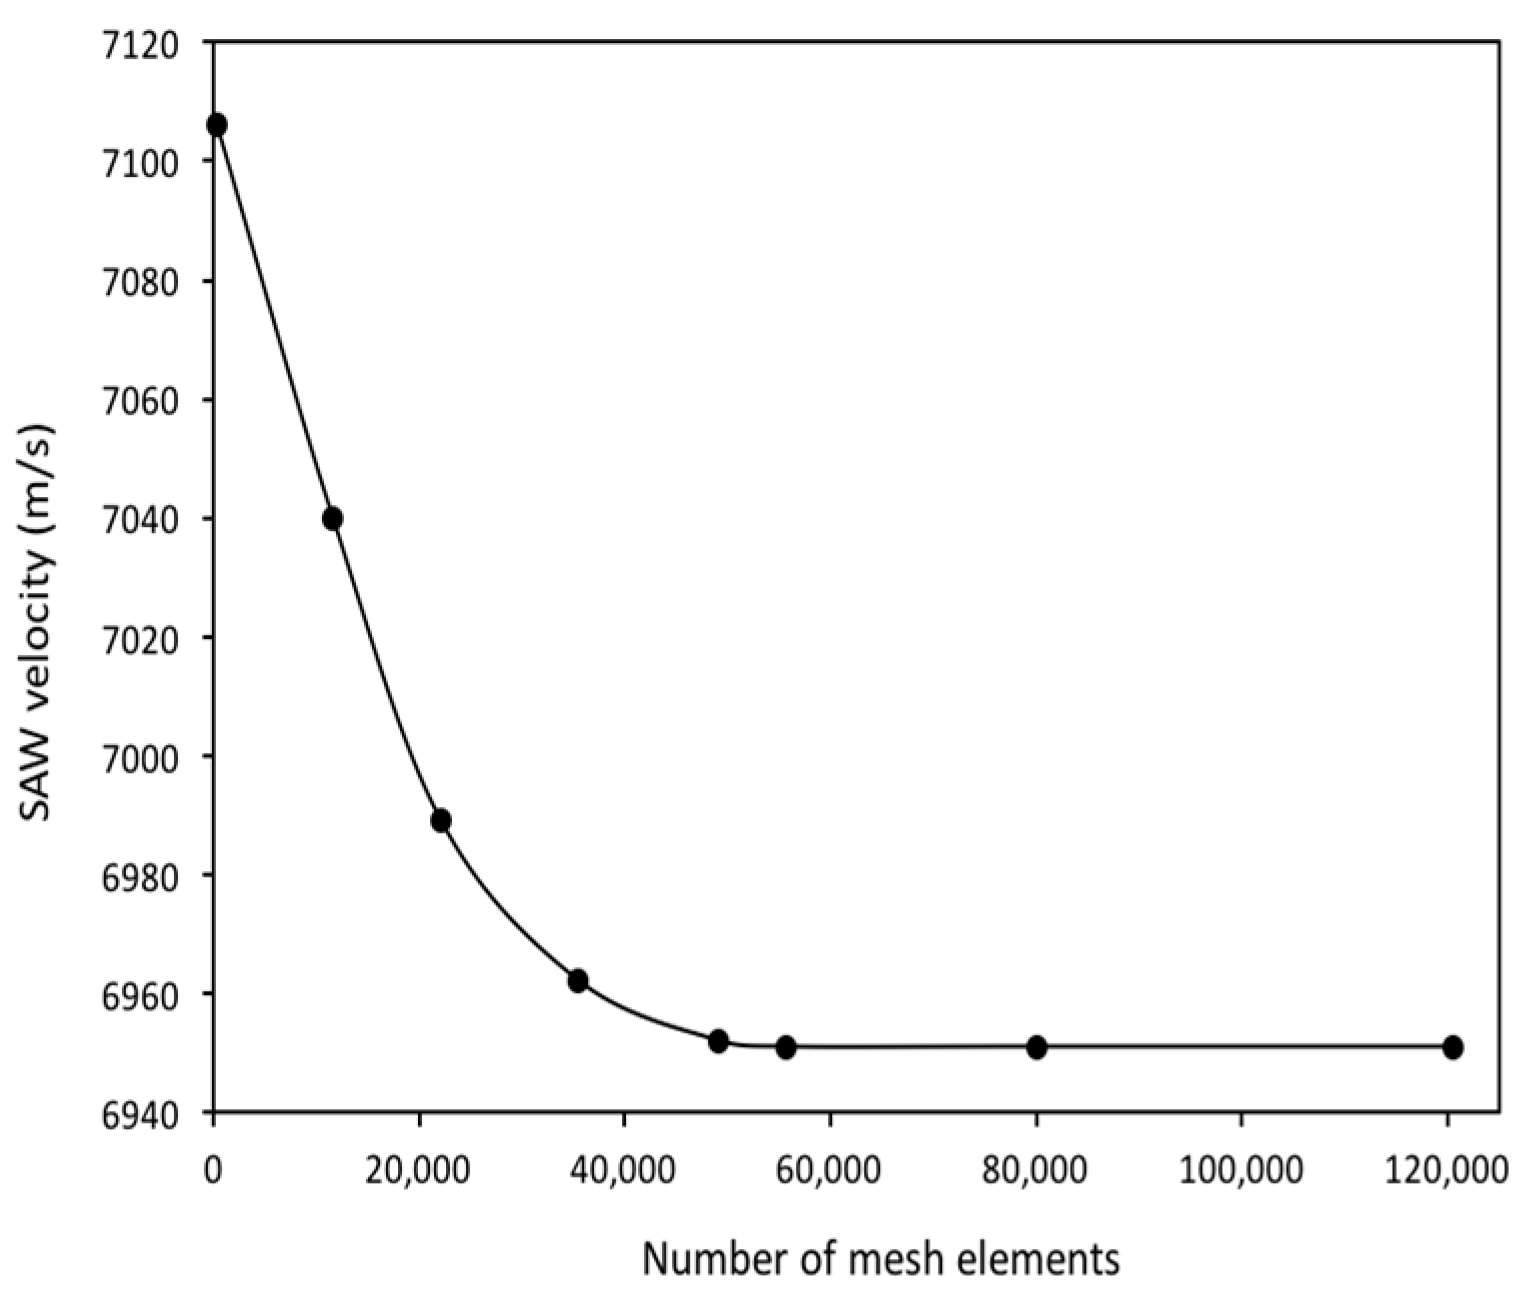
Figure 3. As shown in
Figure 4, the SAW velocity becomes constant at 6951 m/s, the value that has been used in this work. It can be mentioned that the velocity, 7056.5 m/s, in Reference [
19] is obtained at a much coarser mesh. In order to get accurate results for our study, the maximum number of mesh elements are chosen (i.e., 120,503).
The next simulation is performed to determine the velocity and electromechanical coupling coefficient (
k2) of AlN/SiO
2/Si structure for the modes polarized in the sagittal plane (Rayleigh type). The typical Sezawa wave mode is generated in a slow-fast structure. On the same principle, in the AlN/SiO
2/Si (fast-slow-fast) structure, the Sezawa mode is generated by SiO
2/Si (slow on fast) layers while the piezoelectric AlN layer generates the acoustic waves. The simulation results for the propagation characteristics in the AlN/SiO
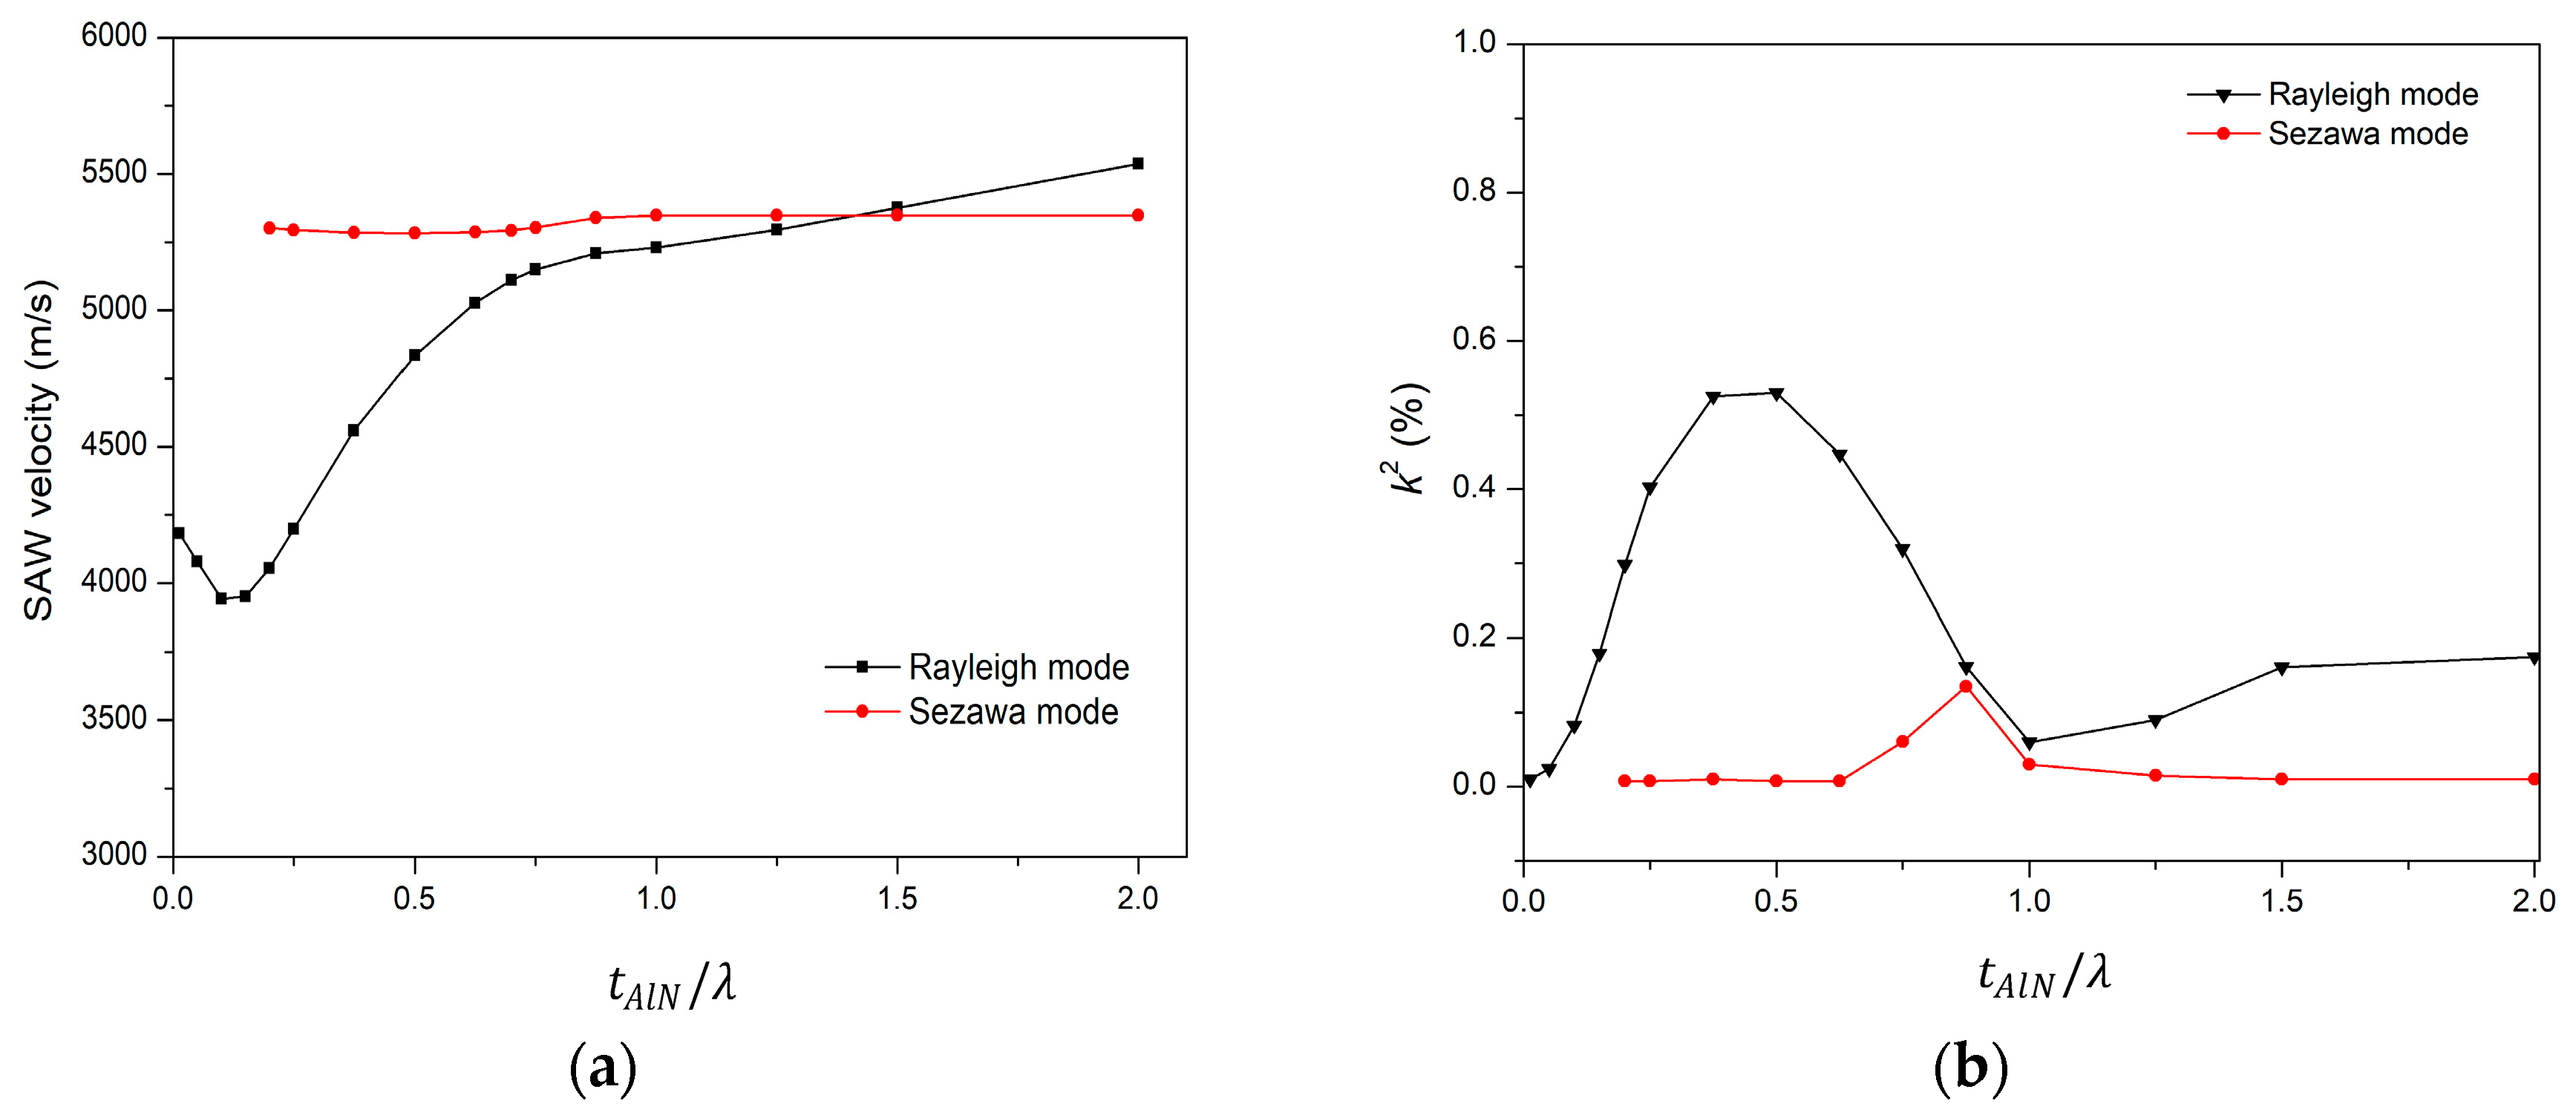
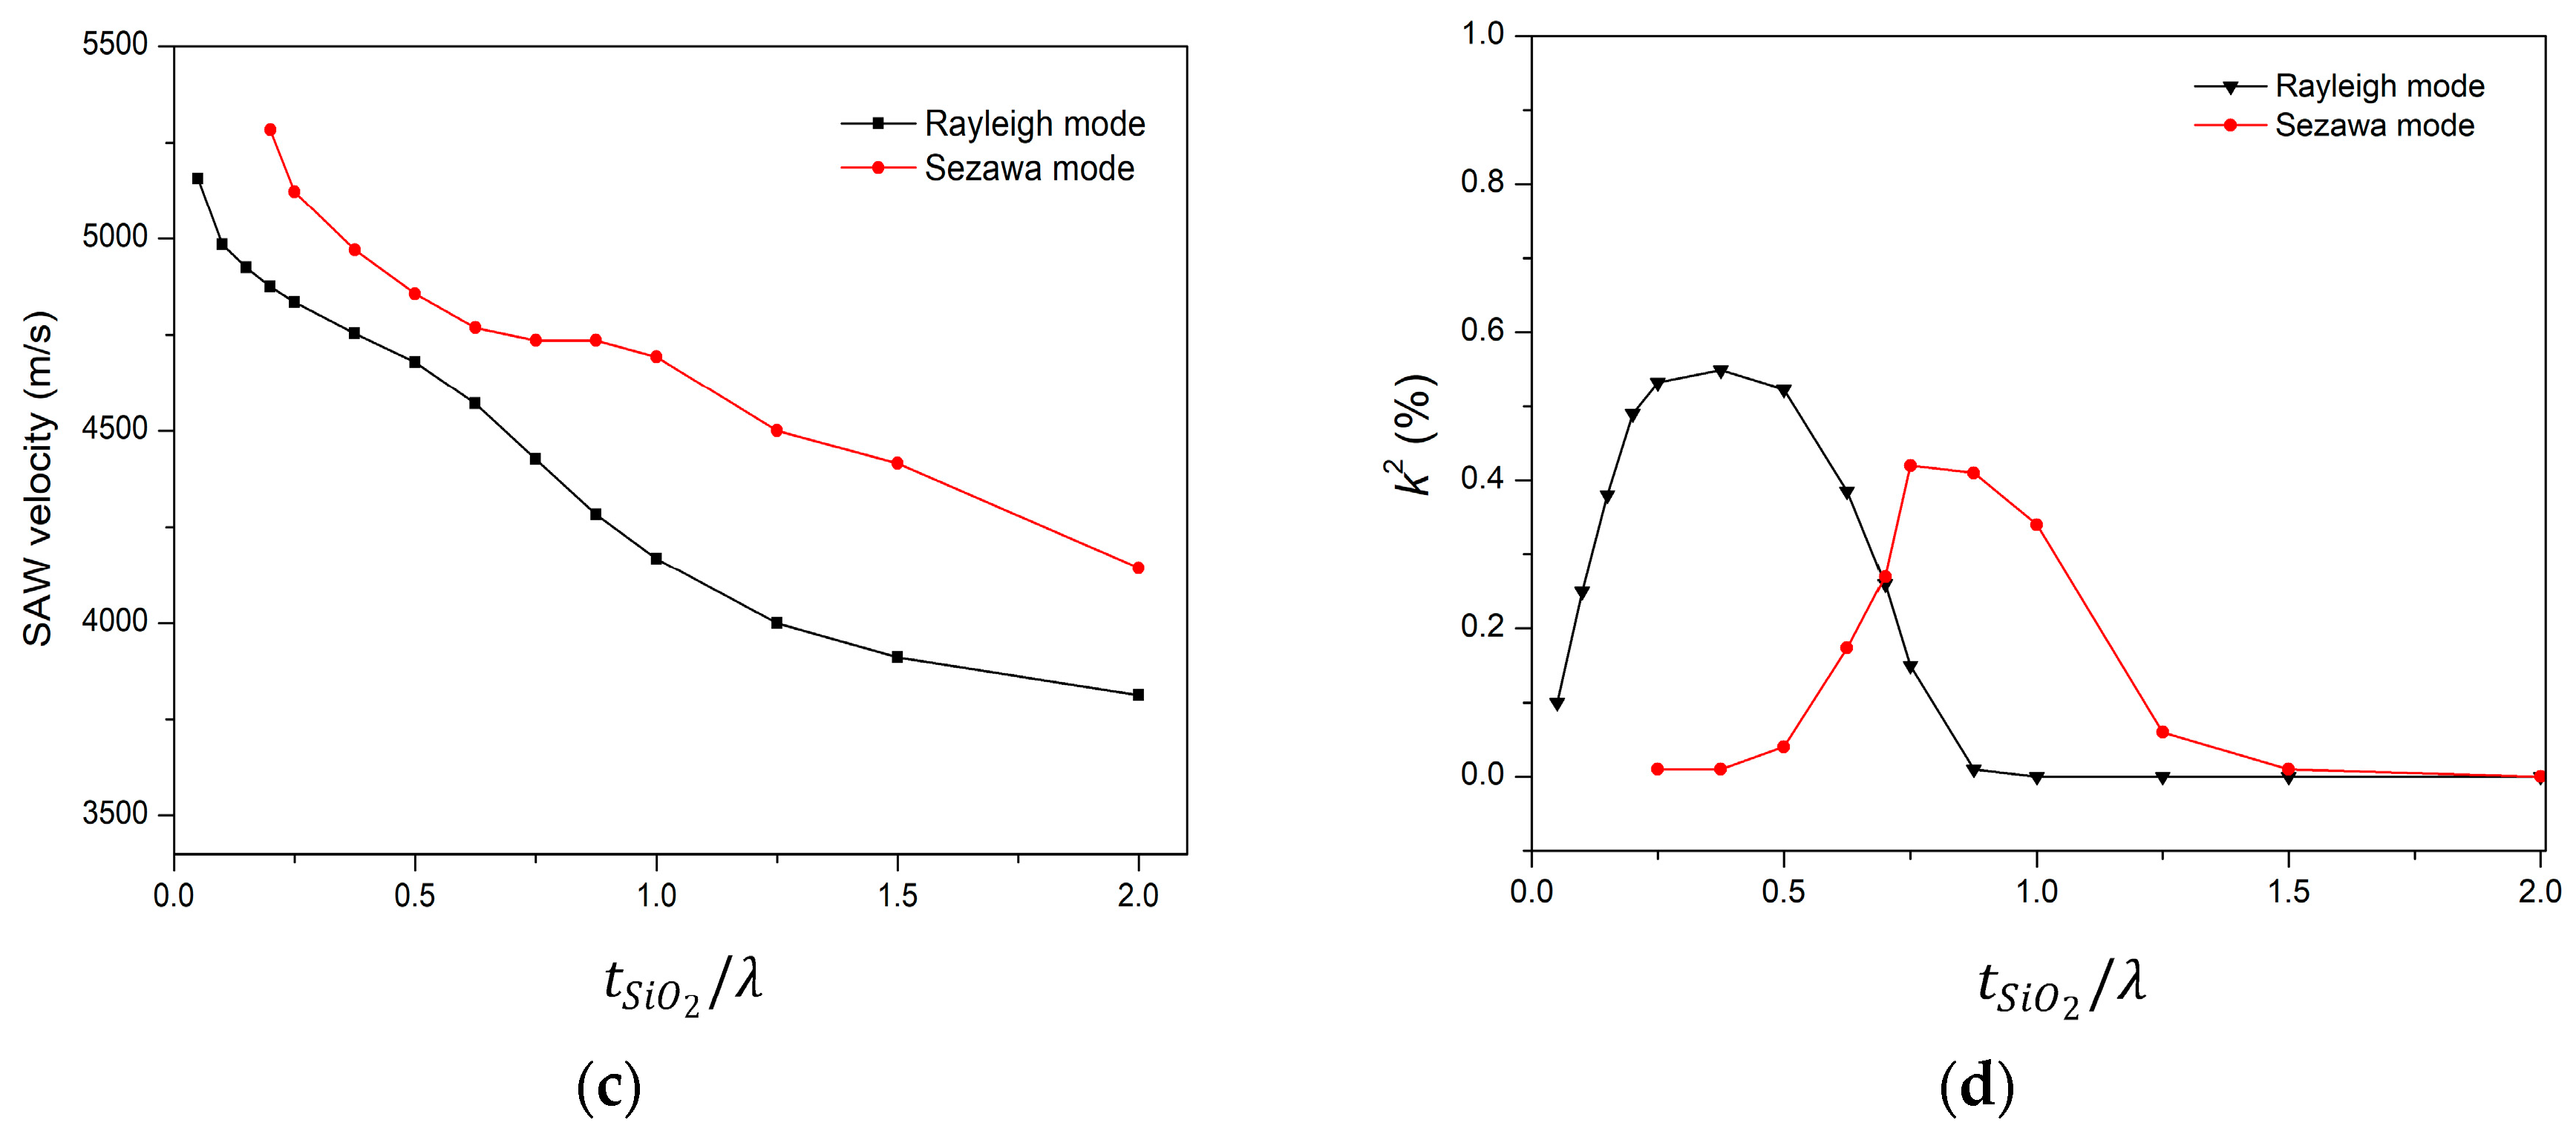
2/Si structure are presented in
Figure 5. The phase velocity of Rayleigh mode increases with increasing normalized AlN film thickness (
), while that of Sezawa mode remains nearly constant. In this simulation, the SiO
2 thickness is kept constant. In
Figure 5a, the value of the phase velocity changes from 4181 m/s to 5537 m/s of Rayleigh mode when 0.01 <
< 2 and
is 0.25. For 0.01 <
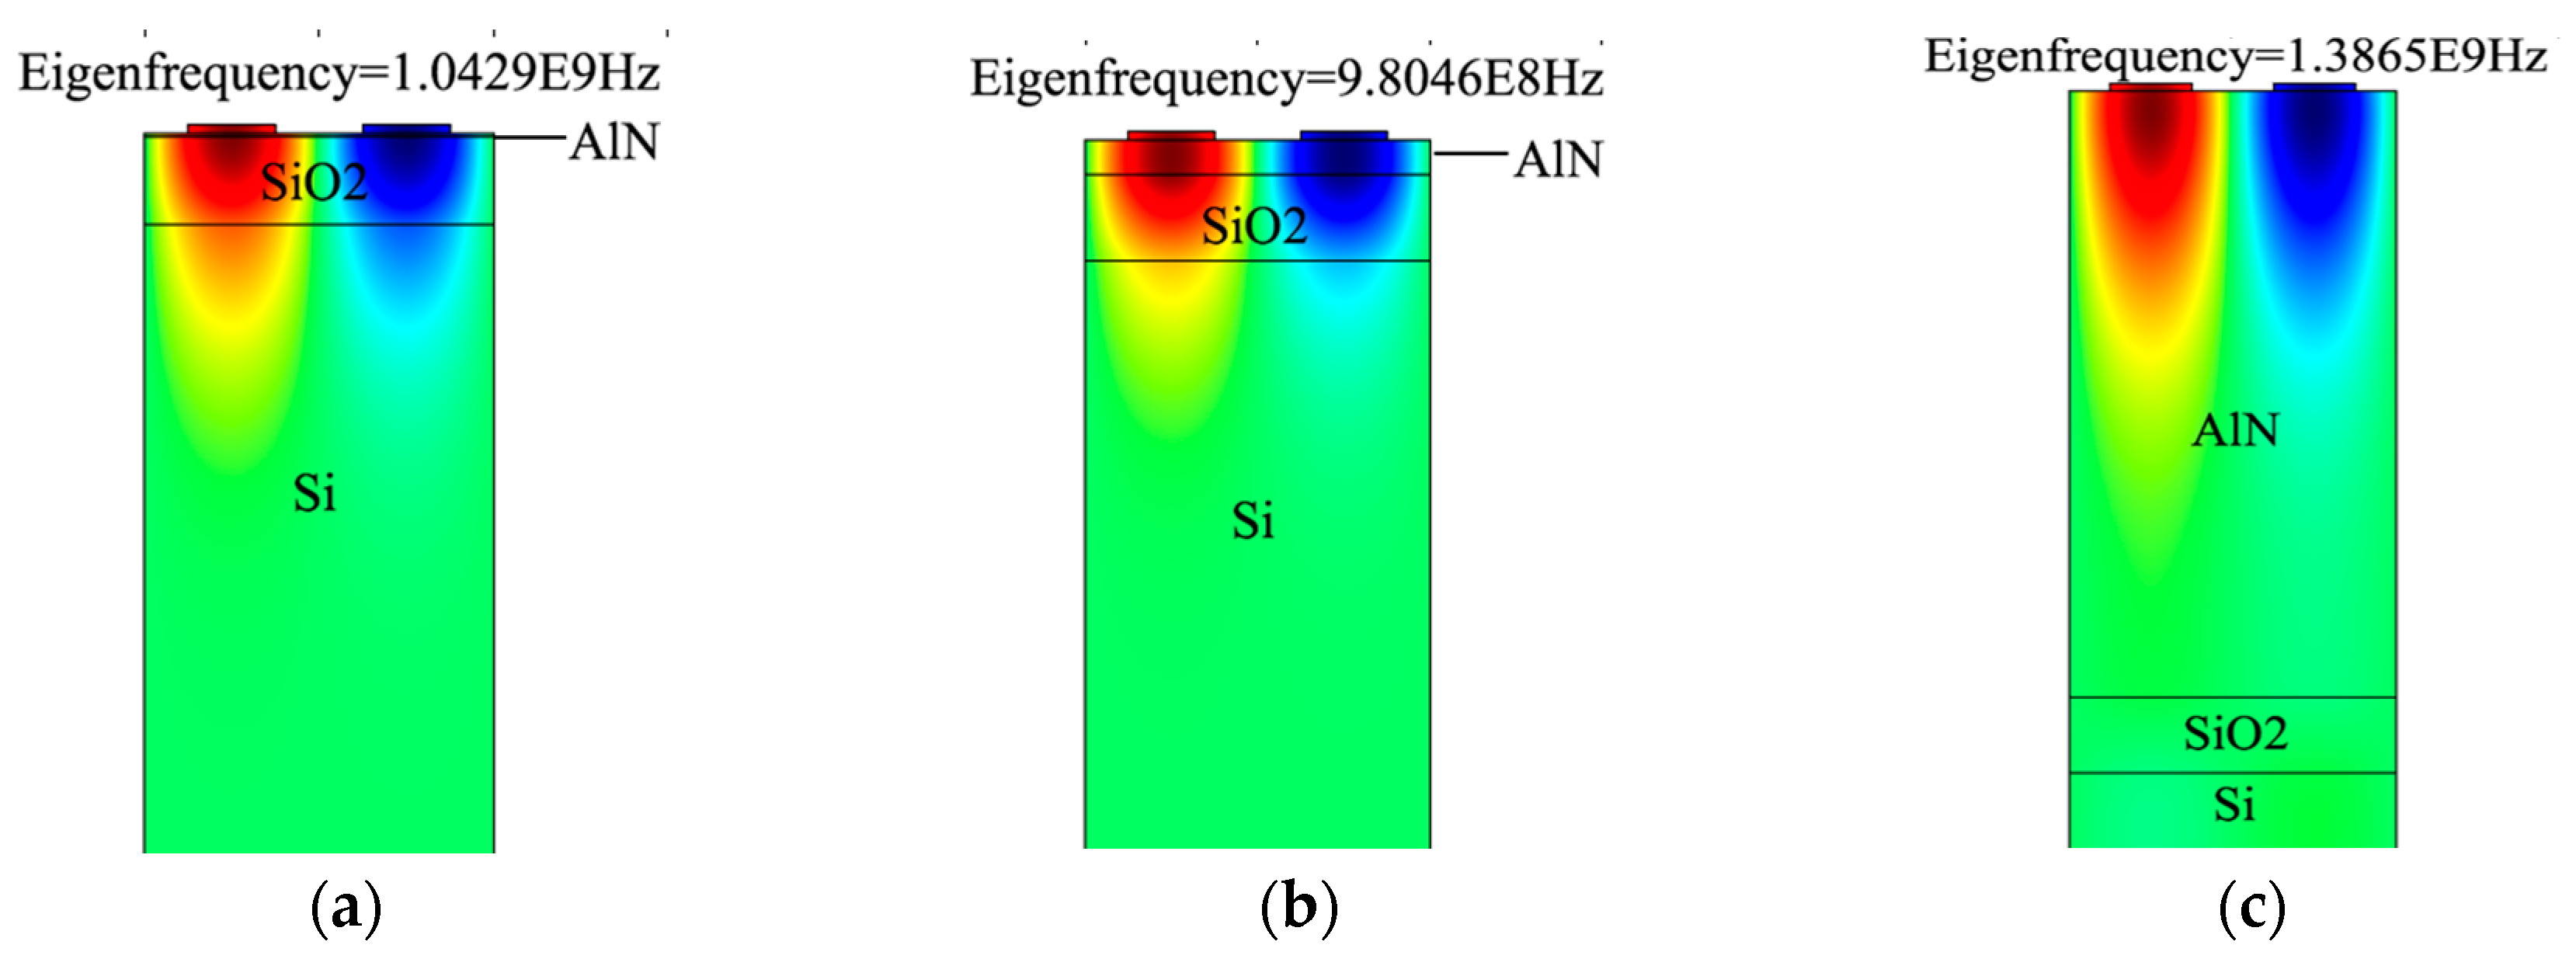
< 0.1, the acoustic velocity in Rayleigh mode decreases from 4181 m/s to 3941 m/s, which suggests that initially the acoustic wave is confined largely in SiO
2 and also to some degree in Si, as shown in
Figure 6a. Therefore, net velocity is the intermediate of SiO
2 velocities (3750 m/s [
28]) and Si (5000 m/s [
28]). Similarly, with a further increase in
, acoustic velocity gradually increases as the acoustic wave starts confining more in the AlN layer and in SiO
2 and no longer in Si, as shown in
Figure 6b. It keeps doing so until the whole acoustic wave is confined only in the AlN substrate (as in
Figure 6c), reaching a velocity of 5539 m/s at
= 2, close to the theoretical acoustic velocity of AlN (5600 m/s [
28]).
The acoustic velocity in Sezawa mode remains unchanged for 0.01 <
< 2. This is because of the fact that the Sezawa mode depends on the slow-on-fast structure, that is, SiO
2/Si, which is constant in this case while varying in AlN thickness. In
Figure 5b, for the Rayleigh wave, the
k2 firstly increases with an increase in
and reaches its maximum value of 0.55% when
is 0.5 and then it starts reducing with a further increase of
. In Sezawa wave mode, the
k2 remains unchanged except for a small peak at
= 0.875, as
= 0.25 is not sufficient to generate Sezawa mode. Next, the AlN layer thickness is kept constant at
= 0.5 and the effect of varying
on SAW velocity is analyzed, as shown in
Figure 5c.
It is clear that Sezawa mode exhibits a higher acoustic velocity than the Rayleigh mode. For both wave modes, the acoustic wave velocity reduces with increasing SiO
2 layer thickness, as the acoustic energy starts confining more in the SiO
2 layer, which has the lowest SAW velocity in the proposed structure. In
Figure 5d, for the Rayleigh wave, the
k2 firstly increases with an increase of
and reaches its maximum value of 0.55% when
is 0.375 and then it starts reducing with a further increase of
. In Sezawa wave mode, the
k2 initially increases with an increase of
and reaches its maximum value of 0.44% when
= 0.75 and reduces upon a further increase of
. In our later study of mass loading sensitivity, we used peak values of
k2 for its relevant mode, which are the optimal points for both modes.
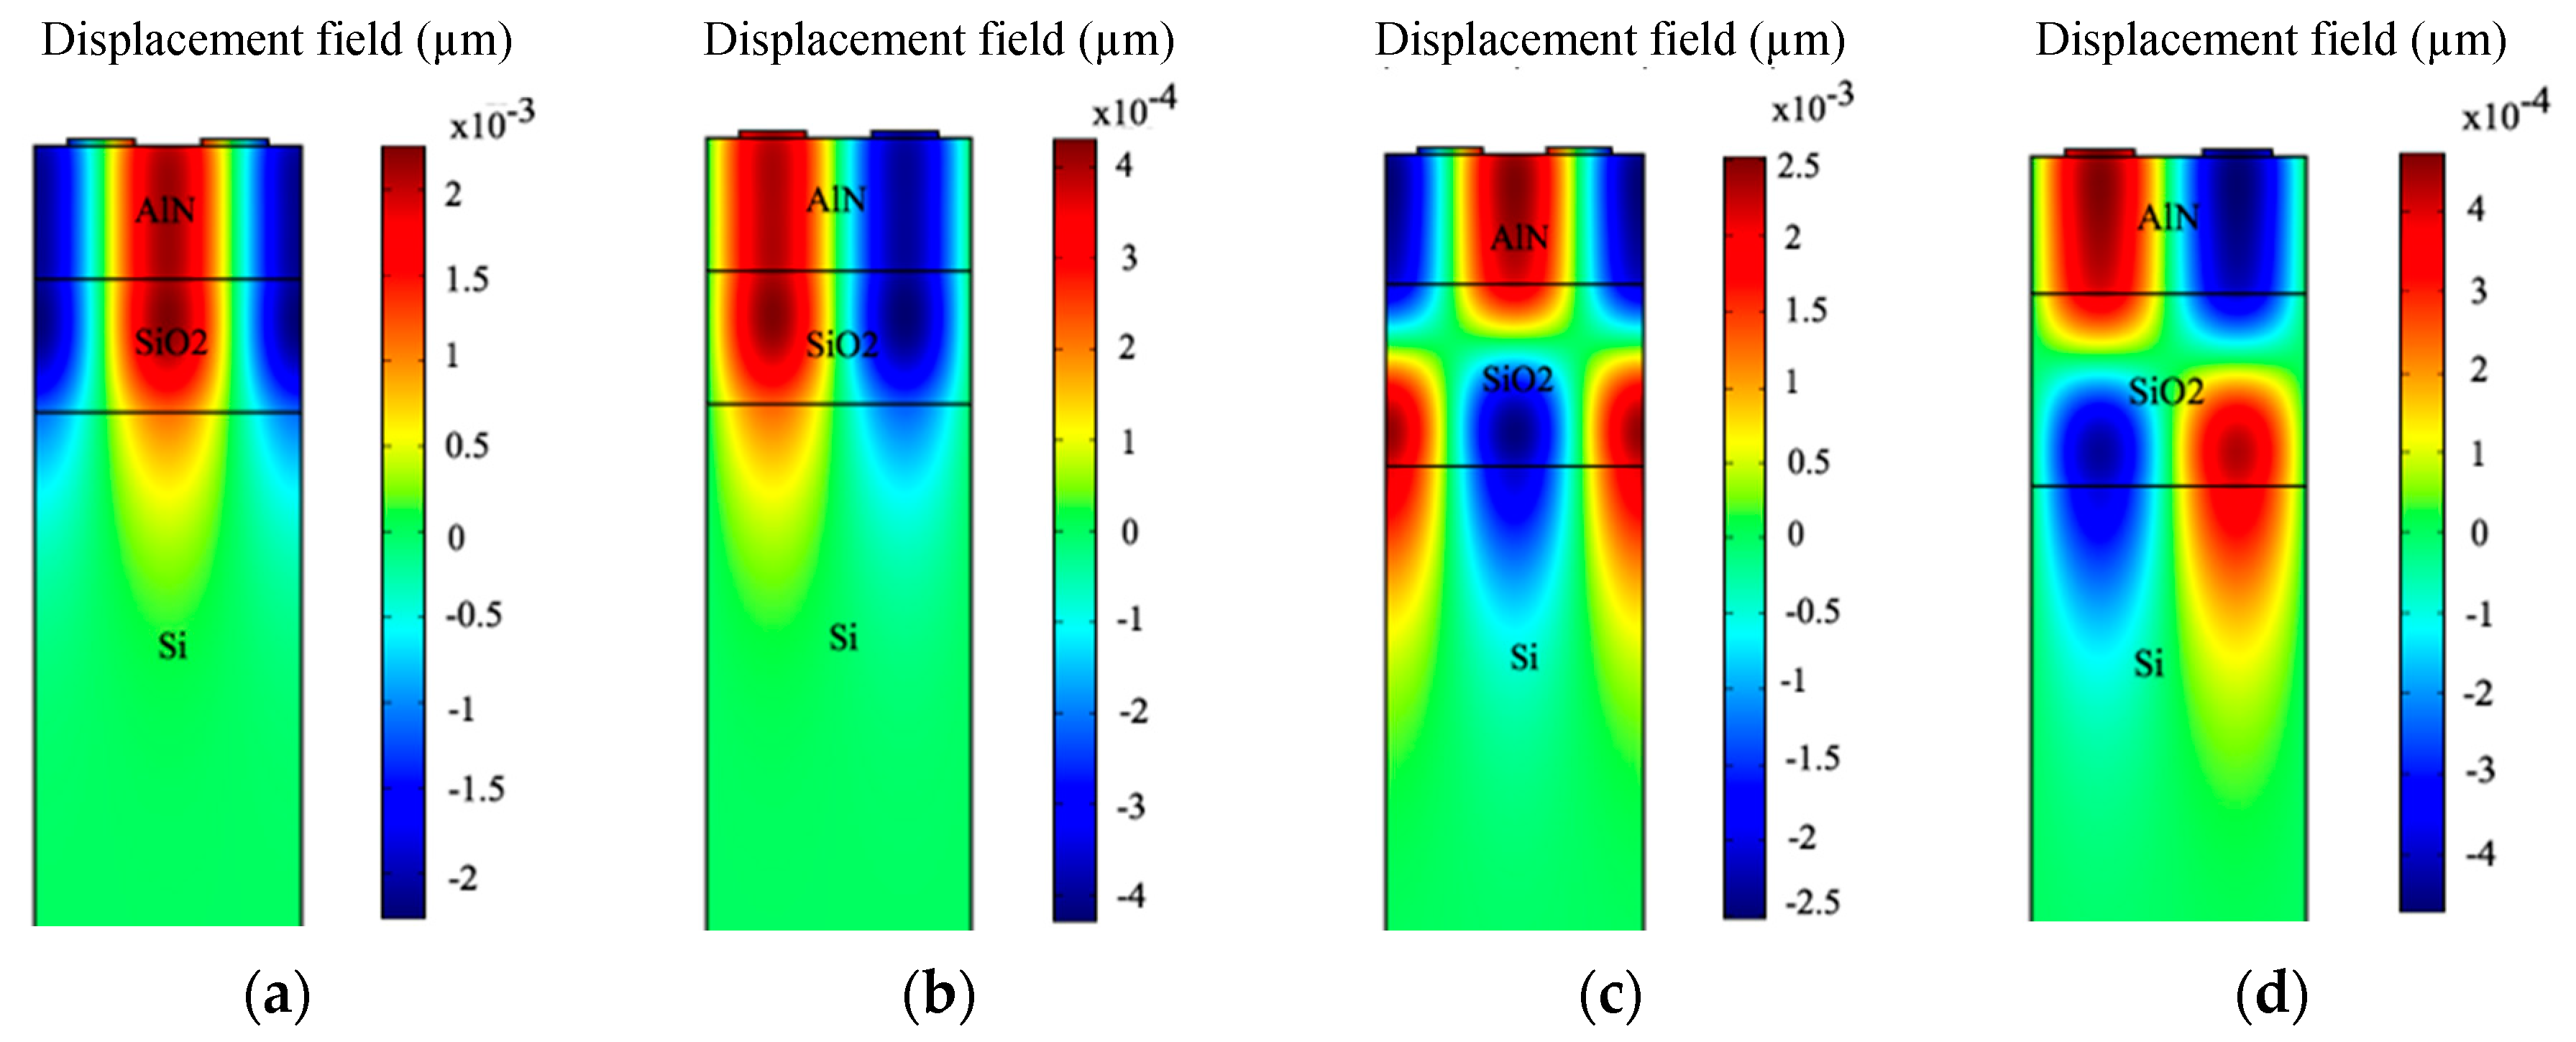
The displacement profiles of the device are summarized in
Figure 7. The mode shapes of the displacement profile are helpful in recognizing the Rayleigh and Sezawa wave modes. The results in
Figure 7 are recorded at resonance and anti-resonance modes of Eigen frequency analysis for
= 2 µm and
= 2.8 µm. The resonance (
Figure 7a) and anti-resonance (
Figure 7b) modes in the Eigen frequency analysis of Rayleigh mode were observed as 1.167 GHz and 1.172 GHz respectively. Similarly, for Sezawa wave mode, the Eigen frequency for resonance (
Figure 7c) and anti-resonance mode (
Figure 7d) is recorded at 1.2 GHz and 1.214 GHz respectively.


