On the Potential of the RST-FLARE Algorithm for Gas Flaring Characterization from Space


Abstract
:1. Introduction
2. Data and Methods
2.1. Satellite Data
2.2. Ancillary Data
2.3. RST-FLARE
2.3.1. Flaring Sites Detection
2.3.2. Source Emissive Power Computation
- -
- y refers to each of the investigated years in the 2000–2016 period;
- -
- j refers to each of the M identified flaring site (only in presence of detected thermal anomaly);
- -
- BT20j is the brightness temperature (K) measured in the MODIS band 20 for the target j (i.e., the detected flaring site);
- -
- <BT20j,bg>, referred to the background, is equal to the spatial mean of the temporal mean μ20(x,y) in a 5 × 5 box around the site;
- -
- α is a coefficient which weights the variability, between years, in sampling and cloud cover. For each of the detected flaring sites within the single year, αj,y is computed as the ratio between the useful images (i.e., clear and with SatZA < 40° and SolZA < 101°) and the total ones. To take into account of αj,y variability in the considered period, it has been normalized with respect to its maximum value computed within the 17 years (αy,max = 0.30).
2.3.3. Gas Flared Volumes Estimation
3. Results
3.1. Detection of Flaring Sites
3.2. Computation of Source Emissive Power
3.3. Estimation of Gas Flared Volumes
4. Validation Analyses
4.1. Flaring Sites
4.2. Gas Flared Volumes
5. Discussion
- (a)
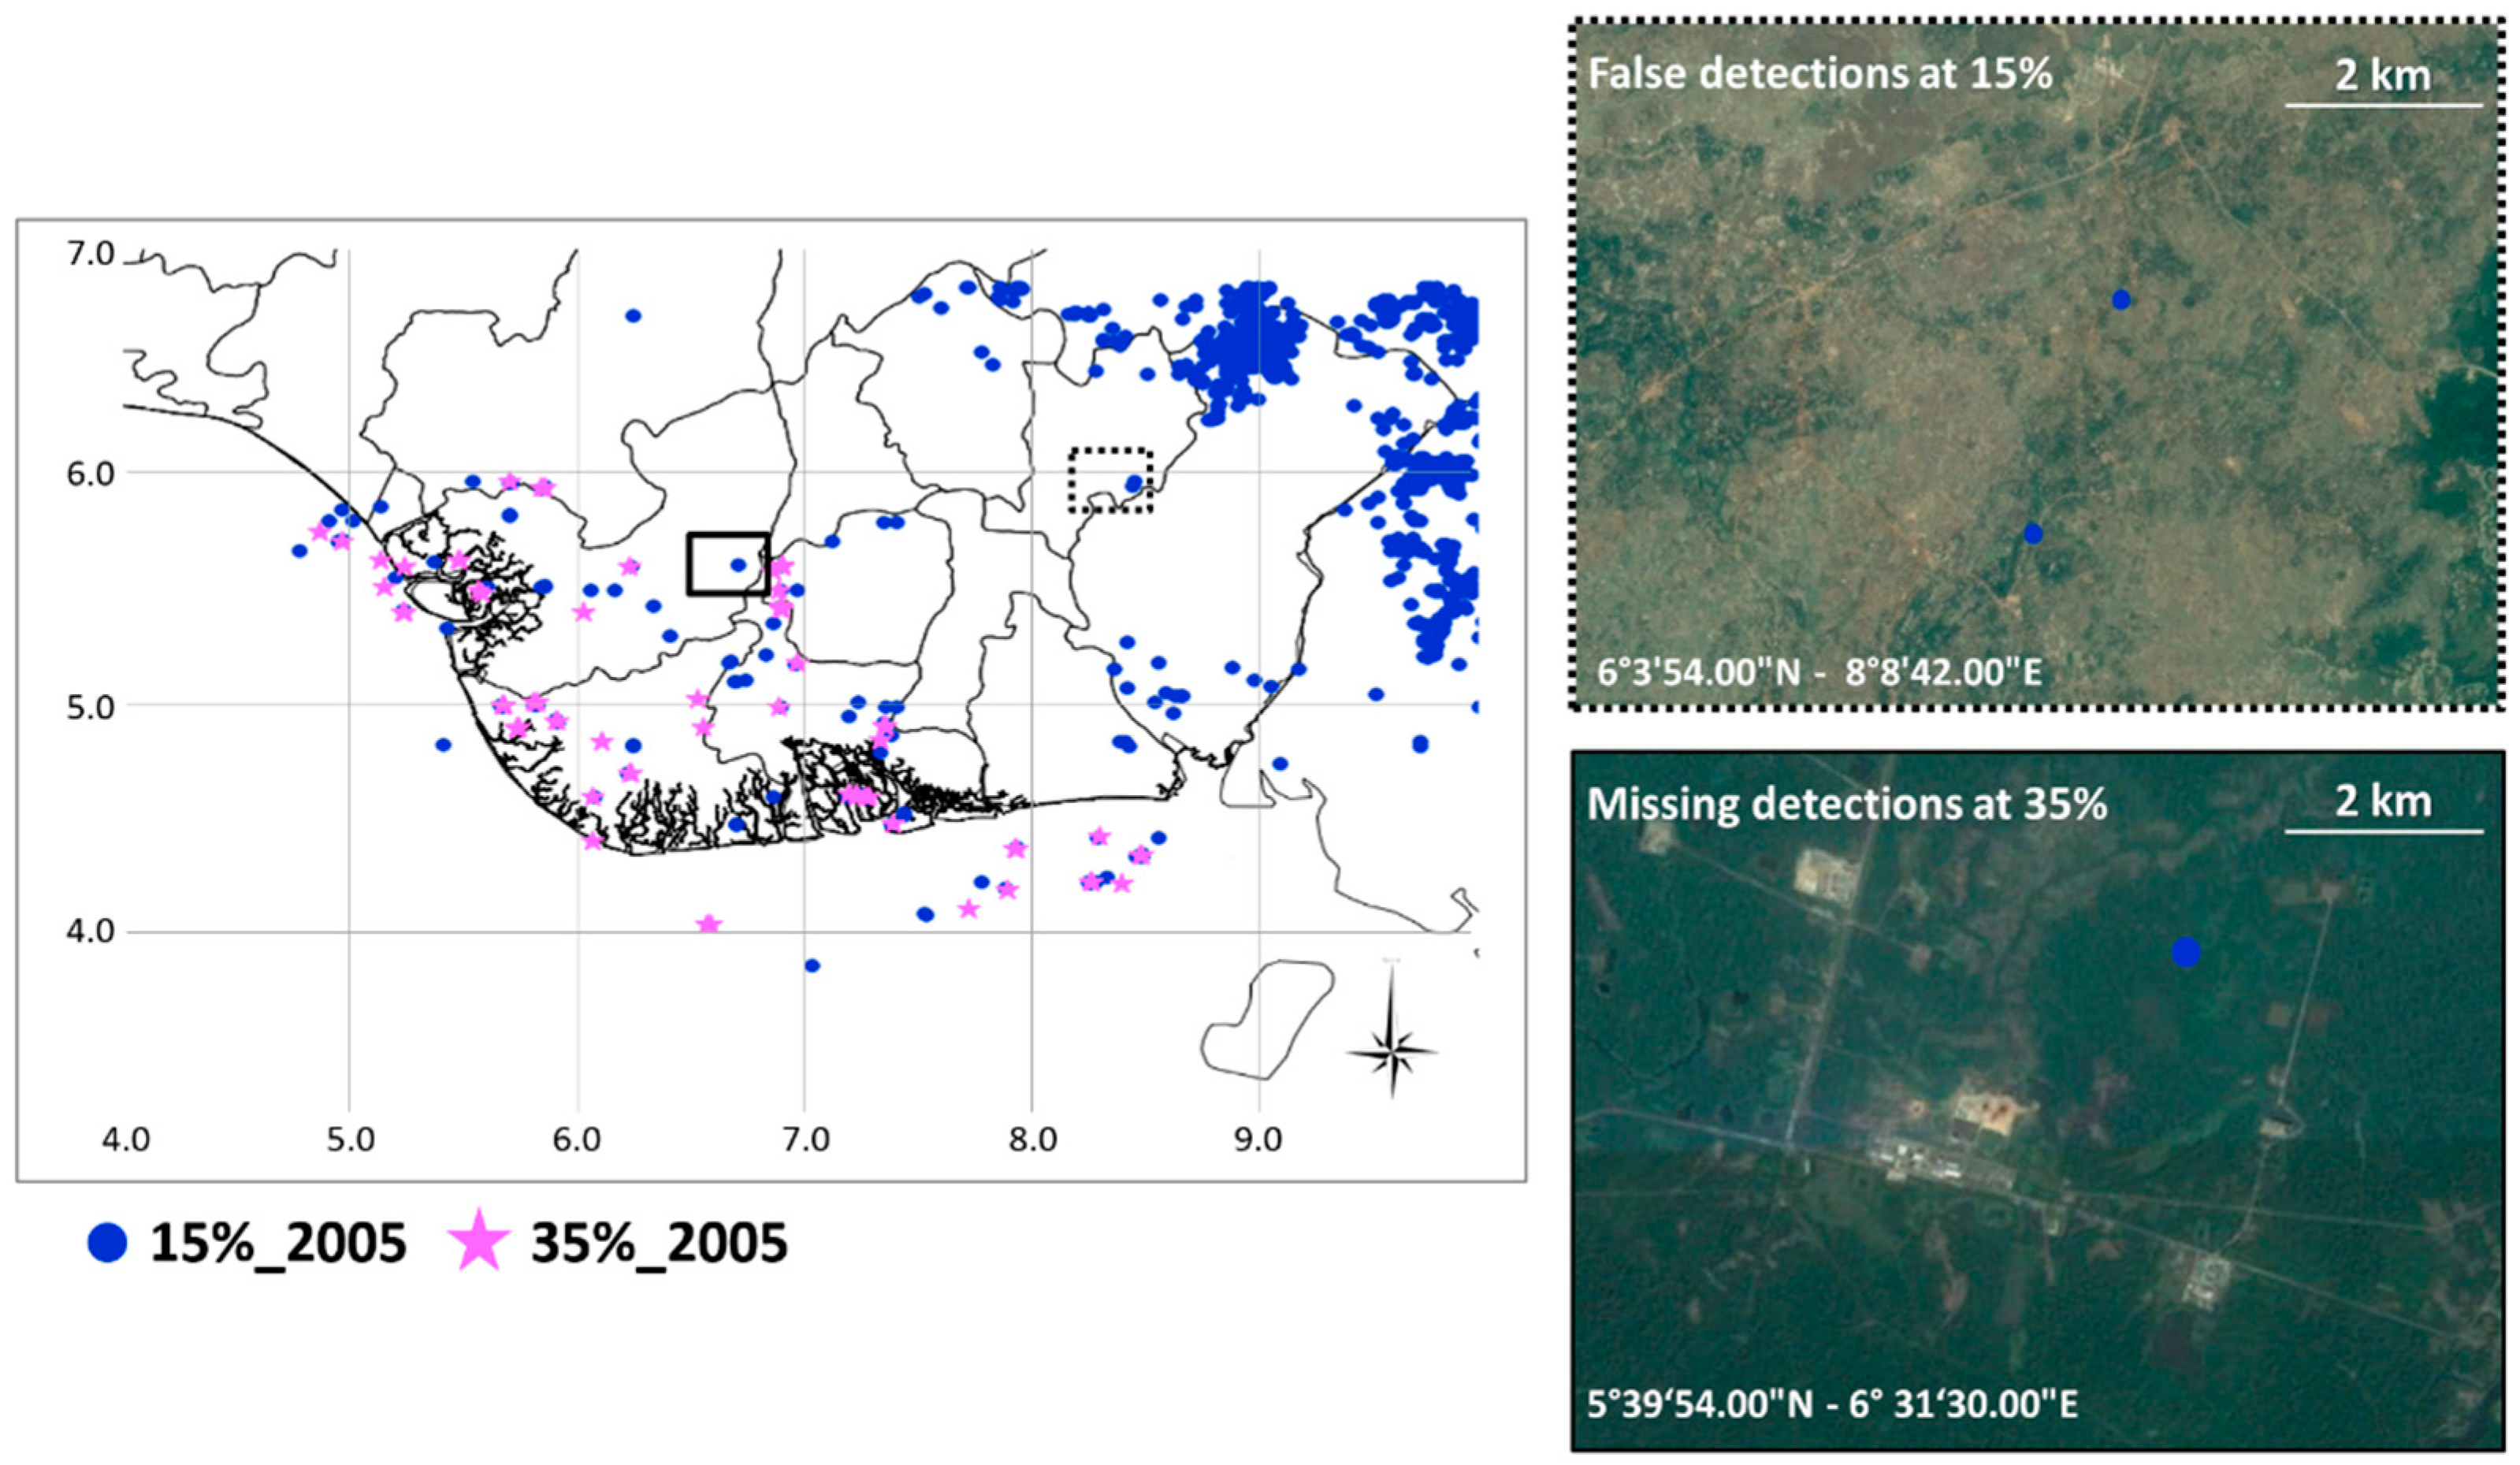
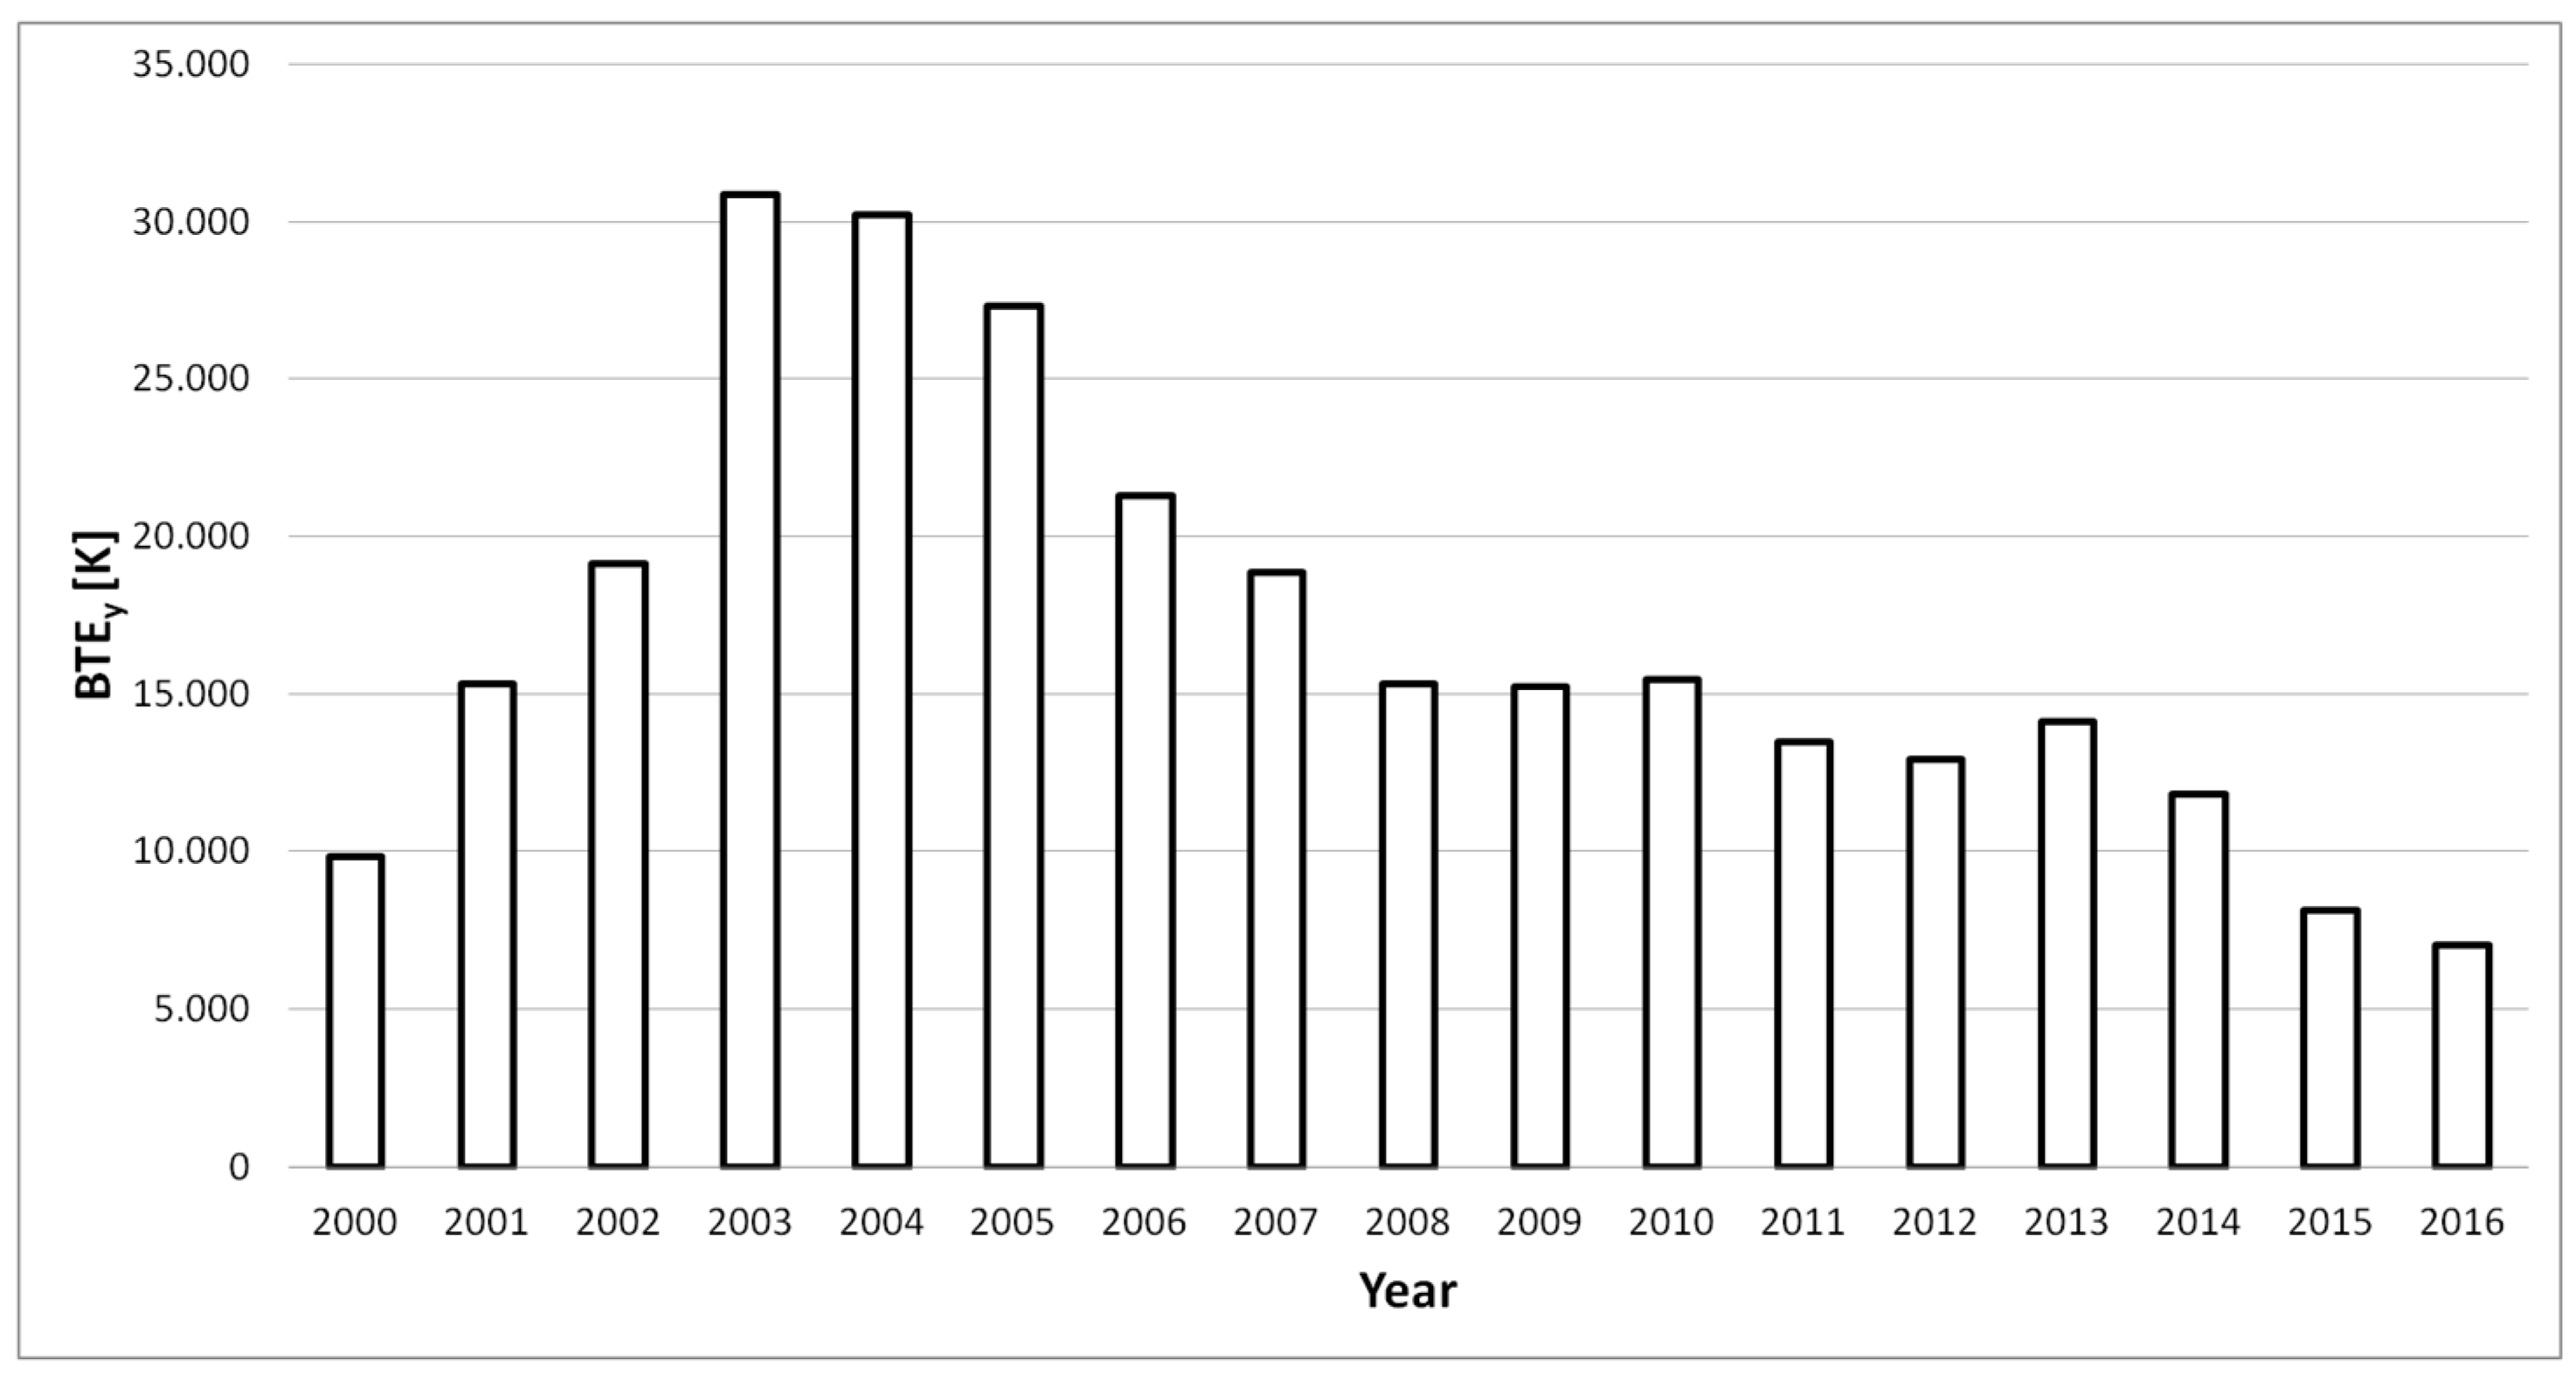
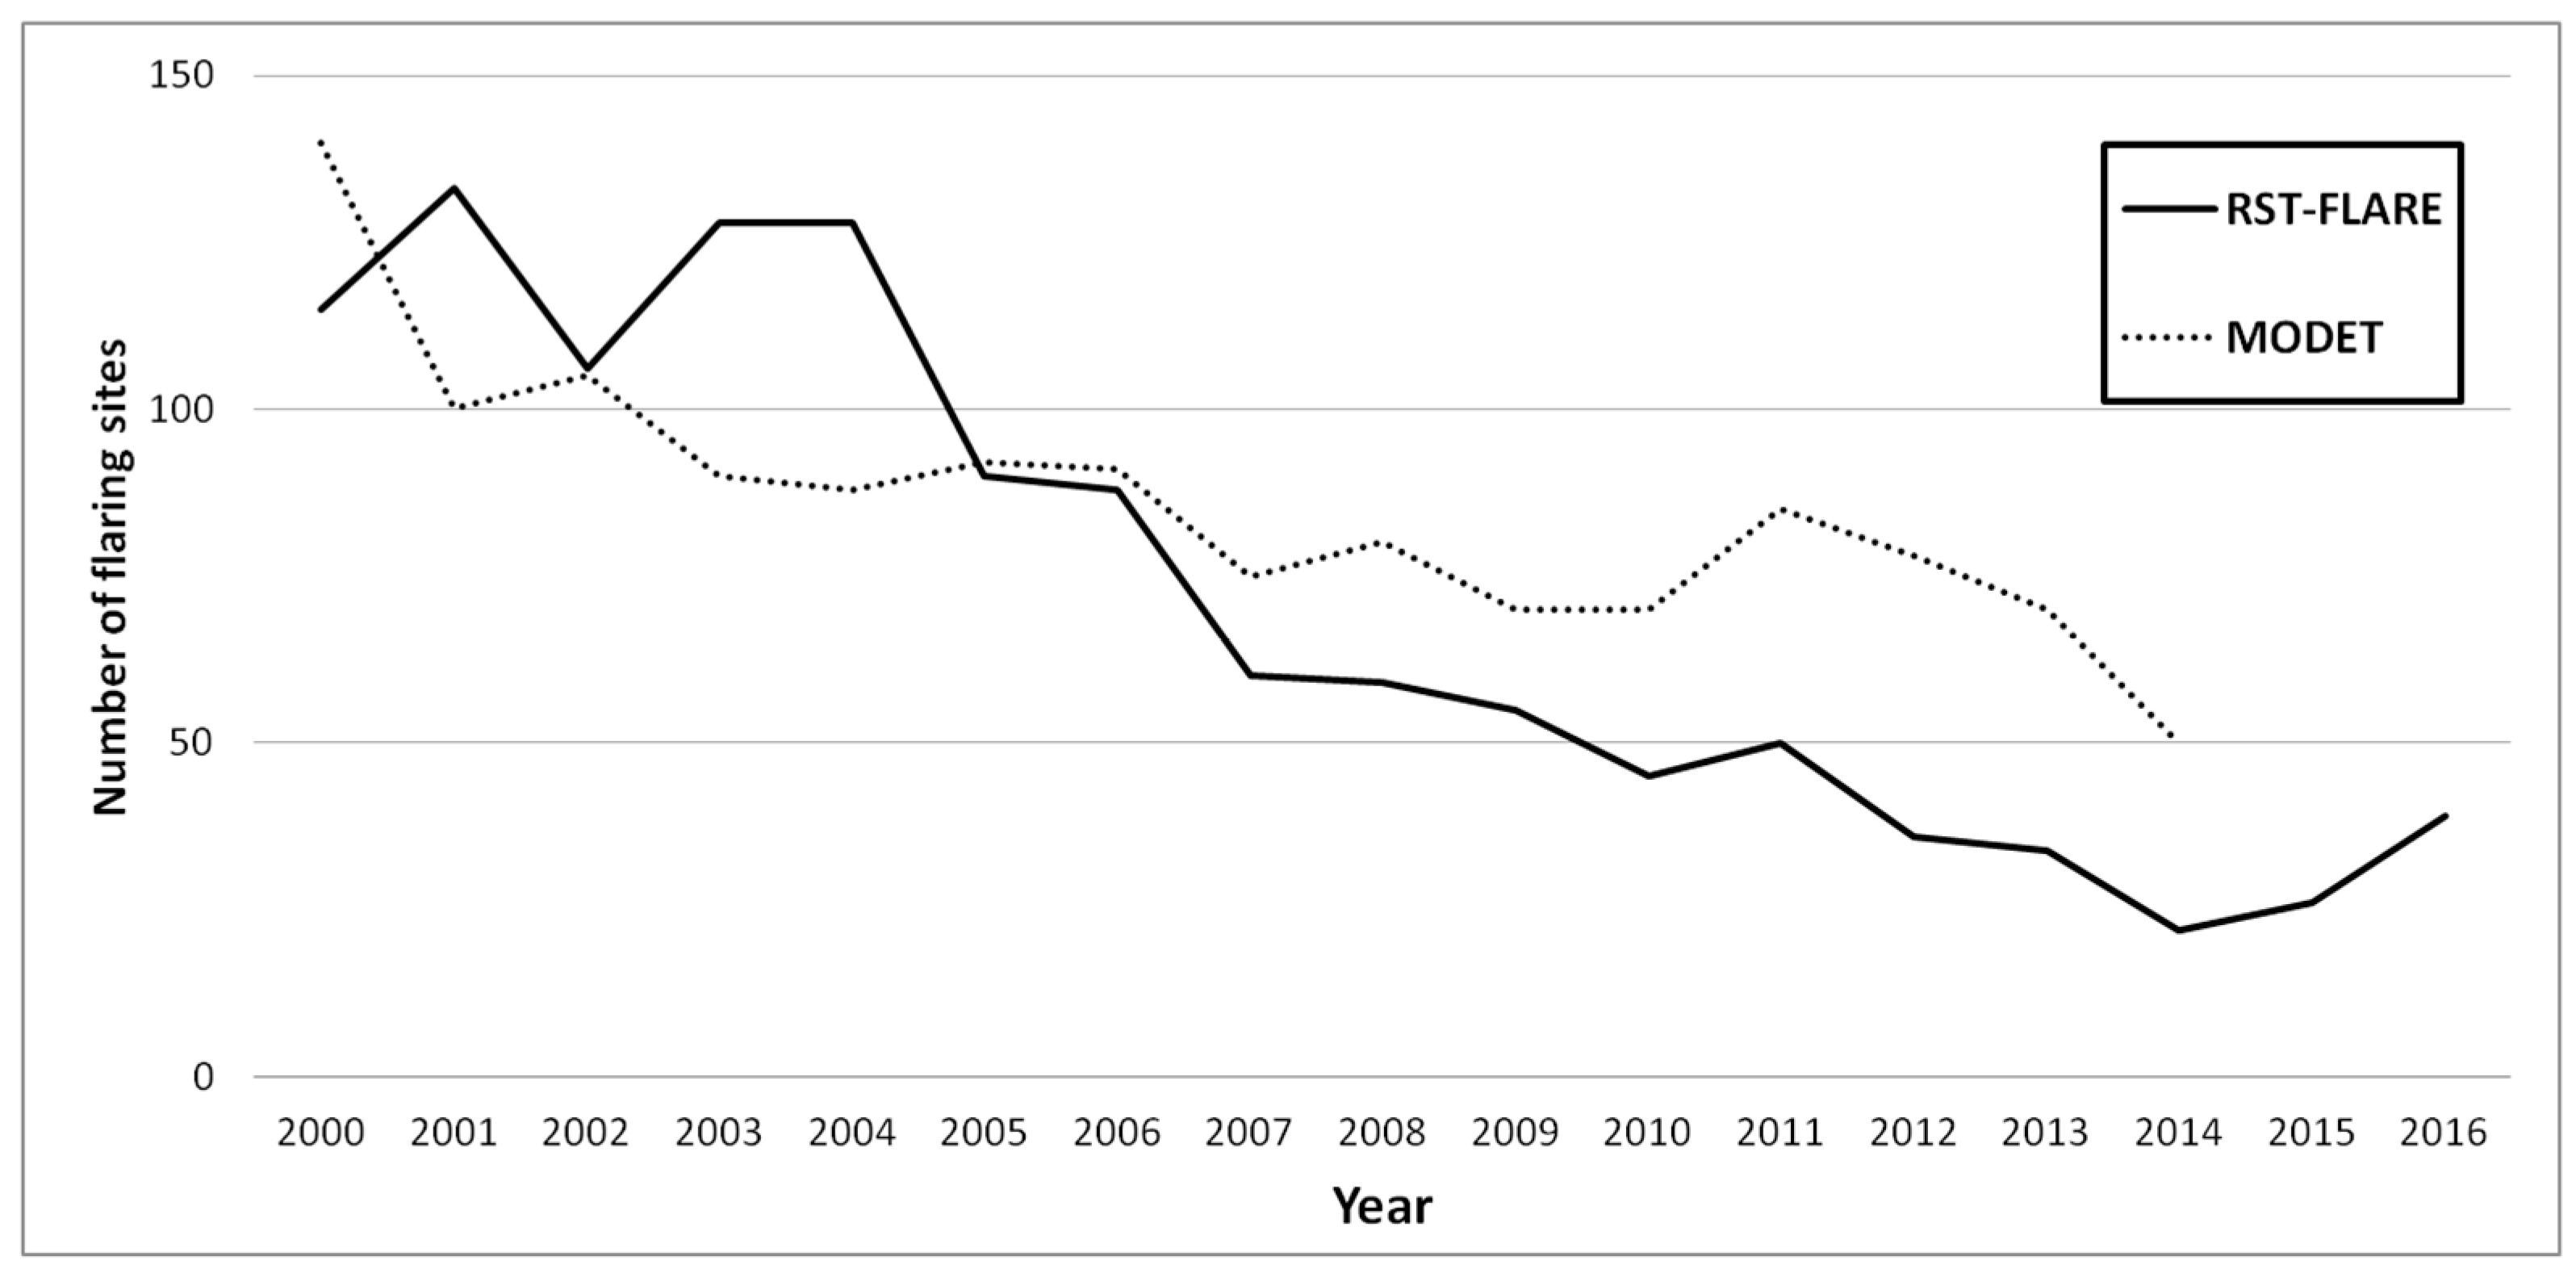
- The first cause of inaccuracy in effectively discriminating flaring sites in the Niger Delta region could come from the use of the MIR signals. Considering that gas flares typically operate at temperatures >1400 K, with a peak spectral radiant output occurring in the SWIR region [7], at MIR wavelengths their emissions are significantly minor (about one third of the signals emitted in the SWIR region). This could result in an under estimation of flare spectral response, especially for the hottest sources [7,25,26]. However, RST-FLARE, thanks to its differential and self-adaptive nature (i.e., exploiting locally derived, in space and time domains, rather than fixed thresholds to identify signals above background), enables the identification of flaring sites over the considered long-period with a good accuracy level when compared with both ancillary data and satellite methods.Besides the comparison to independent data sets, even the analysis of the temporal trend of the detected flaring sites (black line in Figure 5), seem to confirm the accuracy of the results, allowing for a reconstruction of the flaring history in the region. The Niger Delta basin is strongly affected by onshore gas flaring, with a number of flaring sites almost double respect to the ones identified offshore. In both cases, an overall general reduction in the number of active flare sites between 2000 and 2014 was observed, with a significant decreasing trend that started in 2003 onshore and in 2004 offshore, respectively. Especially for the onshore sites, the general downward trend in the number of flares is due to several causes, mainly related to the operations carried out since 2002 for the installation of associated gas gathering infrastructures at various oilfields [12,45,46,47]. Moreover, the Niger Delta militants’ actions occurred between 2006 and 2009, which severely disrupted oil and gas production in the region, may explain the observed reduction in total number of flaring sites in the same period [48]. Since 2014 (for onshore) and 2015 (for offshore), a new increasing in flaring sites seems to be started (of about 64% for land and 36% for sea areas). No information on gas flaring sites, both from official sources and independent satellite methods, have been found to explain such a significant relative variation. It can be probably due to new investments in oil plants equipped with modern infrastructures able to collect, treat, transport and utilize the associated gases. Of course, further analyses have to be carried out to assess these results. Besides, the satisfactory agreement with MODET (between in 74% and 95%) strengthen the RST achievements, confirming the high variability among the years in the number of operational flares, even if detected with a different level of accuracy by the two algorithms. The different aggregation scheme, bi-monthly (only December and January) over 15 years (2000–2014) for MODET, monthly (for each calendar month) for the 2000–2016 period for RST-FLARE, may be one of the possible causes of the observed discrepancies together with the different detection methods and thresholds.Concerning the flaring sites localization, RST-FLARE shows again a very good agreement (95% of spatial matching) when compared to results derived by means of VNF, a fully independent product based on VIIRS data offering improved spectral (with a SWIR band capability) and spatial (~750 m of pixel size in SWIR) resolution. Such a cross-validation between two independent satellite-based products reveals to be helpful in a twofold perspective: (i) common detections strengthened the accuracy of each system in providing reliable and consistent information; (ii) on the other hand, unmatched detections might reveal possible false positives (a couple of examples are shown in Figure 13), allowing for further “fine tunings” and optimization of the products.
- (b)
- A further possible issue in the flaring sites characterization may be due to the variability in sampling and cloud cover, which could affect the RST-FLARE results consistence between years. In order to reduce these effects, a coefficient αj,y has been defined and computed for each of the detected flaring sites within the single year. It allows normalizing, between investigated years, the source emissive power (quantified in terms of Brightness Temperature Excess, BTE, see Equation (2)) according to the imagery sampling caused by the cloud coverage and the satellite view geometry.
- (c)
- Additionally, the MIR MODIS signal, used in the BTE metric computation, may be affected by the atmosphere. Although a number of papers in literature [49,50] do not use atmospherically corrected MODIS MIR radiances and, more recently, [51] suggested considering the atmospheric transmittance of the 4-μm channel (MODIS band 22) equal to 1 when computing the Collection 6 MODIS fire product, atmospheric effects might be not completely negligible. However, the RST-FLARE configuration partially takes into account and mitigates the atmospheric effects impact by using the <BT20j,bg> spatial mean as reference value for BTEs computation as well as the ALICE index. For its construction, μ20(x,y) is representative of average conditions in terms of the above-cited noise sources, therefore, if in one image their contribution is quite relevant, producing a significant attenuation in BT20, the corresponding BTE will result lower. The ALICE, using the temporal mean, enables to further reduce the impact of signal variability in the image at hand due to possible noise sources, such as the geometry of observation and atmospheric contributions. Ref. [12] provided a similar indication, defining their bi-monthly composite aggregation scheme a practical and effective atmospheric correction method.
6. Conclusions
- (i)
- sites affected by flaring activity are automatically identified, at different temporal scales (both annual and multitemporal), using a standardized variable index measuring the local variation of infrared radiation from flare;
- (ii)
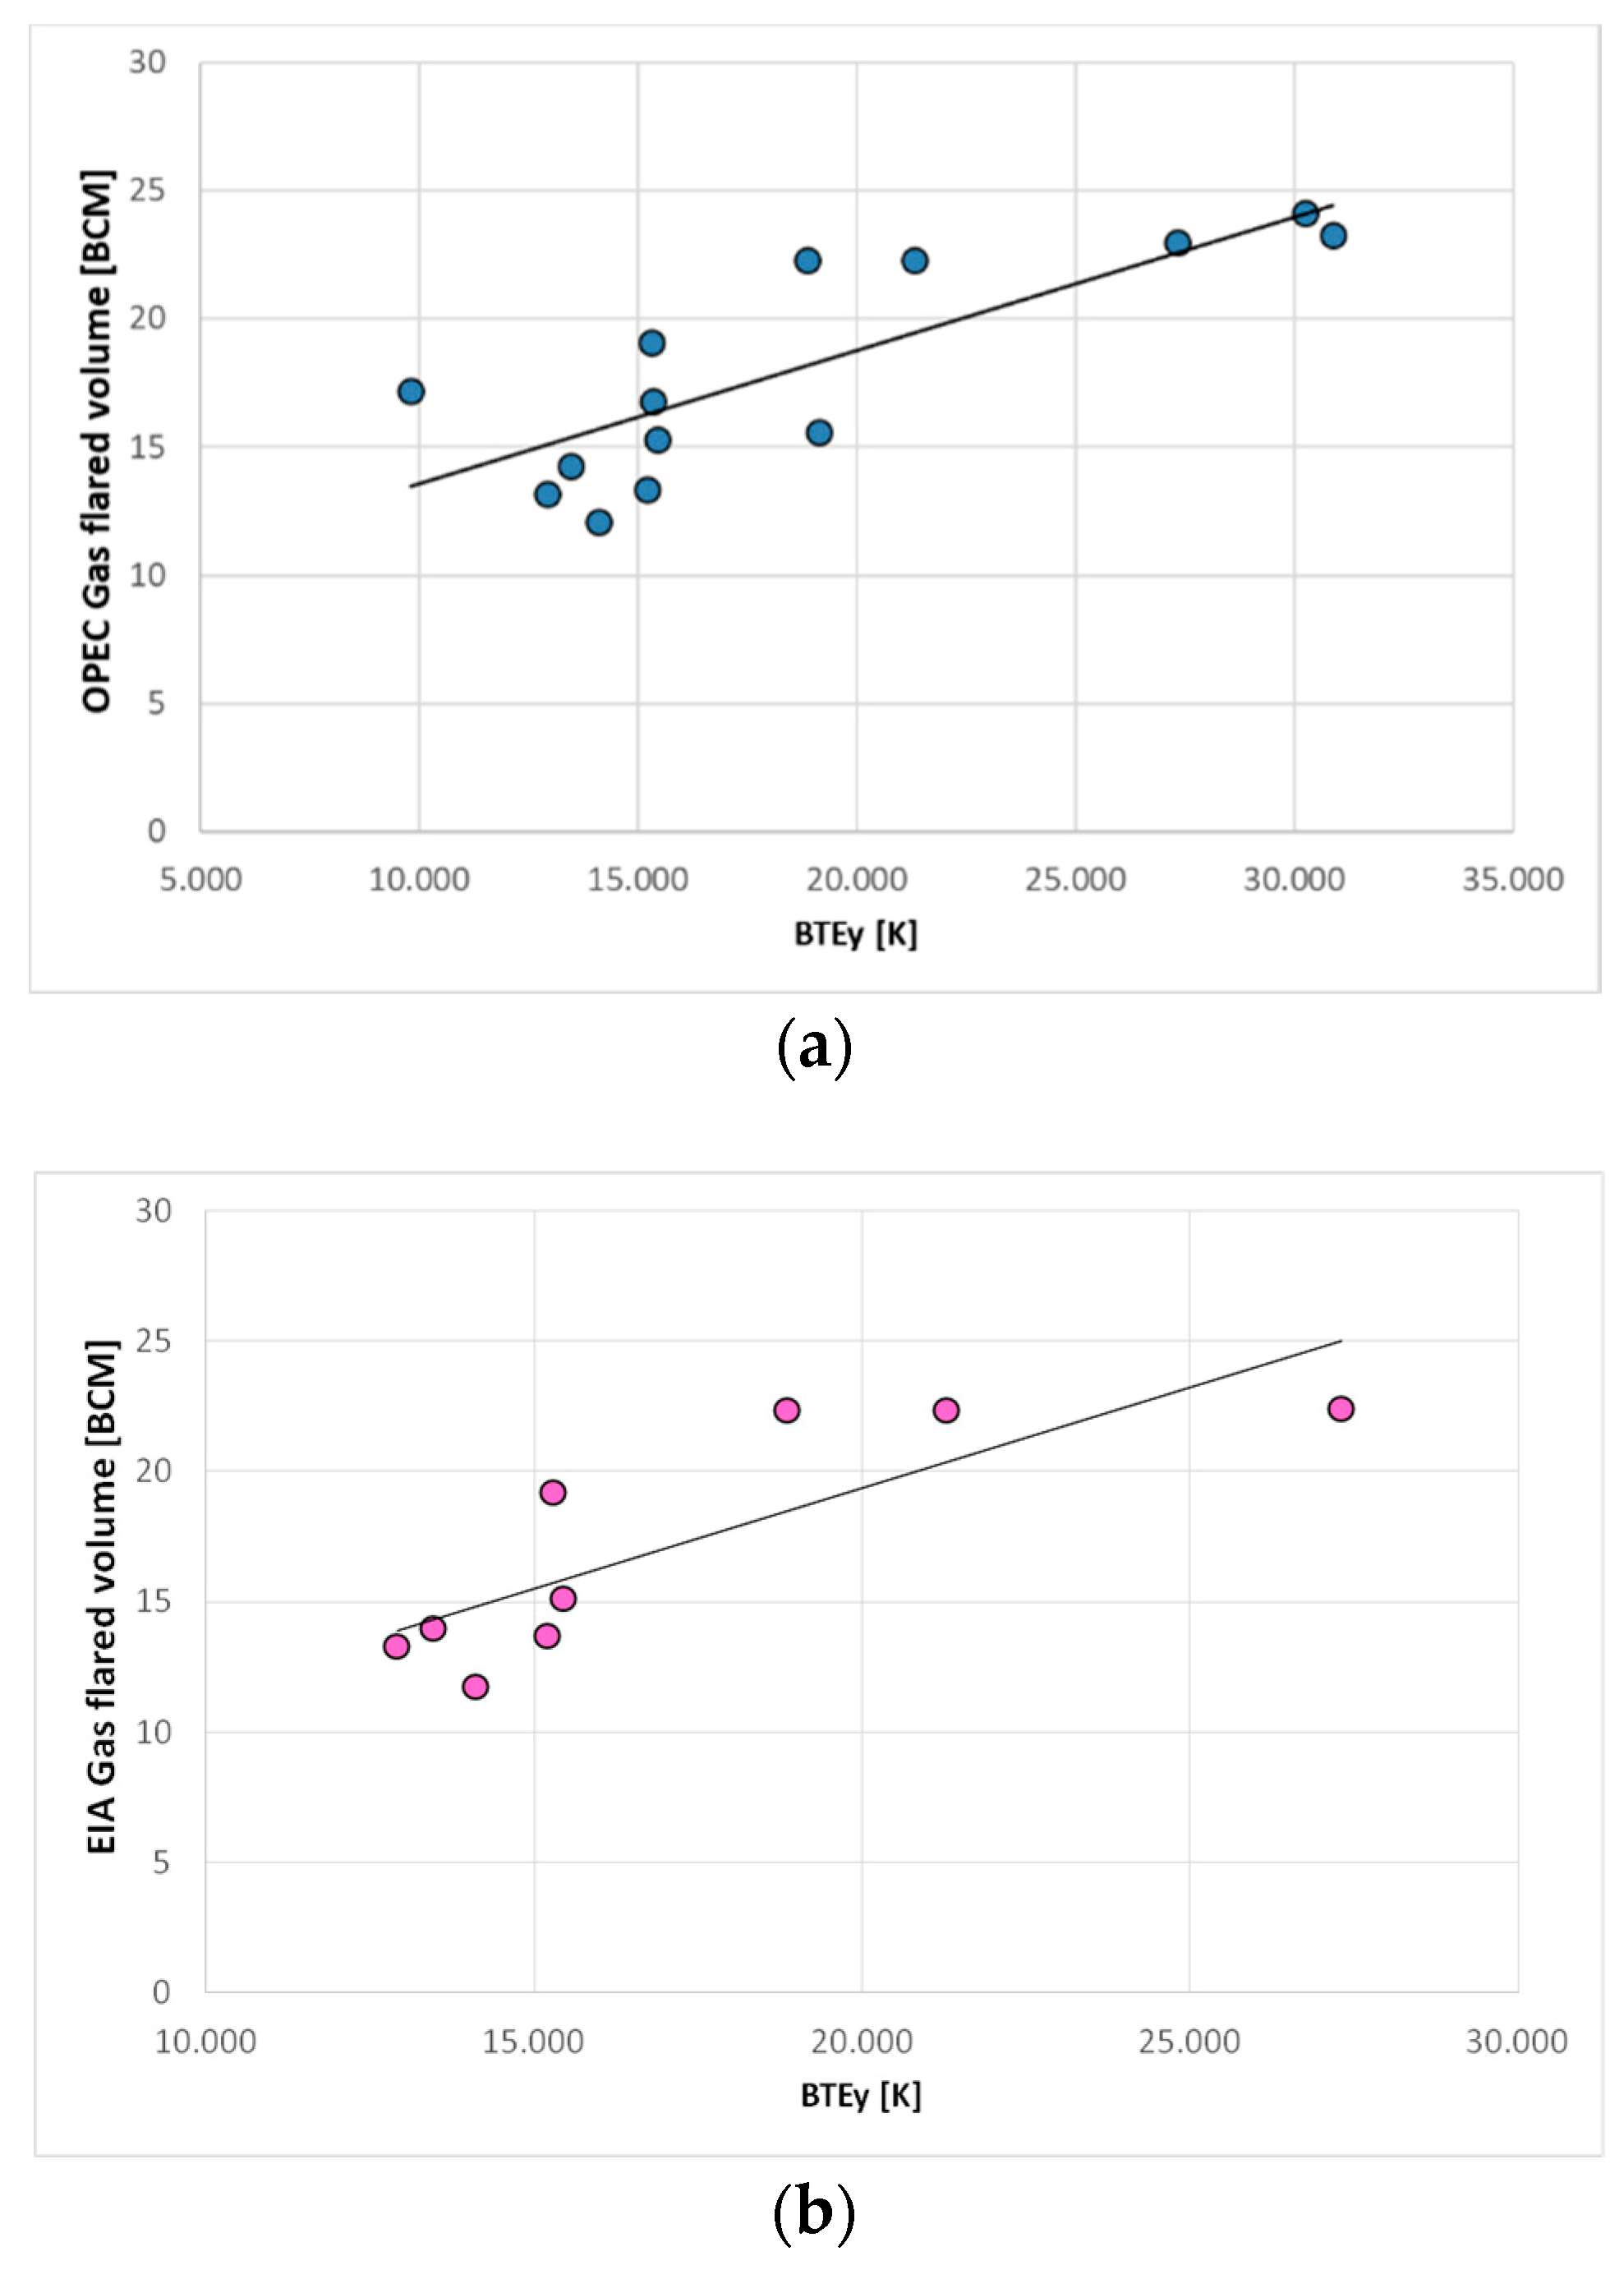
- the volumes of gas annually emitted, at national scale, are computed by developing a regression model using the Brightness Temperature Excess (BTE), measuring the difference between the 4-μm source emission and its surrounding expected background, as well as official data on gas volumes emitted by the plants to quantify the emissive power of the hot sources;
- (iii)
- the long term variation in flaring activity, in terms of flaring sites and flared volumes, is evaluated considering annual estimates within the 17-year investigated period.
Author Contributions
Funding
Conflicts of Interest
References
- Gervet, B. Gas Flaring Emission Contributes to Global Warming. March 2007. Available online: http://www.ltu.se/cms_fs/1.5035!/gas%20flaring%20report%20-%20final.pdf (accessed on 20 April 2018).
- Sharma, A.; Wang, J.; Lennartson, E.M. Intercomparison of MODIS and VIIRS Fire Products in Khanty-Mansiysk Russia: Implications for Characterizing Gas Flaring from Space. Atmosphere 2017, 8, 95. [Google Scholar] [CrossRef]
- Giwa, S.O.; Nwaokocha, C.N.; Kuye, S.I.; Adama, K.O. Gas flaring attendant impacts of criteria and particulate pollutants: A case of Niger Delta region of Nigeria. J. King Saud Univ. Eng. Sci. 2017. [Google Scholar] [CrossRef]
- Ismail, O.S.; Umukoro, G.E. Global Impact of Gas Flaring. Energy Power Eng. 2012, 4, 20231. [Google Scholar] [CrossRef]
- Carbon Limits. Associated Petroleum Gas Flaring Study for Russia, Kazakhstan, Turkmenistan and Azerbaijan—Final Report. 2013. Available online: http://www.ebrd.com/downloads/sector/sei/ap-gas-flaring-study-final-report.pdf (accessed on 18 June 2018).
- Farina, M.F. Flare Gas Reduction—Recent Global Trends and Policy Considerations. GE Energy, Global Strategy and Planning. GE Energy|GEA18592 (10/2010). 2010. Available online: http://www.ge-spark.com/spark/resources/whitepapers/Flare_Gas_Reduction.pdf (accessed on 18 June 2018).
- Elvidge, C.D.; Zhizhin, M.; Baugh, K.; Hsu, F.C.; Ghosh, T. Methods for Global Survey of Natural Gas Flaring from Visible Infrared Imaging Radiometer Suite Data. Energies 2015, 9, 14. [Google Scholar] [CrossRef]
- Arino, O.; Casadio, S.; Serpe, D. Global night-time fire season timing and fire count trends using the ATSR instrument series. Remote Sens. Environ. 2012, 116, 226–238. [Google Scholar] [CrossRef]
- Adesina, E. Gas flaring in Africa. A Critical Overview of Gas Flaring Reduction in Nigeria Oil Sector and its Challenges. In Proceedings of the 6th German-Africa Energy Forum 2012, Hamburg, Germany, 23–24 April 2012; Available online: http://www.energyafrica.de/fileadmin/user_upload/Energy-Africa__12/Presentation_Nigeria%20LNG_Gas%20Flaring%20in%20Africa.pdf (accessed on 18 June 2018).
- The World Bank. 2017. Available online: http://www.worldbank.org/en/news/feature/2017/07/10/new-gas-flaring-data-shows-mixed-results (accessed on 18 June 2018).
- The World Bank. Nigeria’s Flaring Reduction Target: 2020. 10 March 2017. Available online: http://www.worldbank.org/en/news/feature/2017/03/10/nigerias-flaring-reduction-target-2020?Energy=EAE_Gplus_Energy_EN_EXT (accessed on 18 June 2018).
- Anejionu, O.C.D.; Blackburn, G.A.; Whyatt, J.D. Detecting gas flares and estimating flaring volumes at individual flow stations using MODIS data. Remote Sens. Environ. 2015, 158, 81–94. [Google Scholar] [CrossRef]
- Liu, Y.; Chao, S.; Yang, Y.; Zhou, M.; Zhan, W.; Cheng, W. Automatic extraction of offshore platforms using time-series Landsat-8 Operational Land Imager data. Remote Sens. Environ. 2016, 175, 73–91. [Google Scholar] [CrossRef]
- Elvidge, C.D.; Baugh, K.E.; Tuttle, B.T.; Howard, A.T.; Pack, D.W.; Milesi, C.; Erwin, E.H. A Twelve Year Record of National and Global Gas Flaring Volumes Estimated Using Satellite Data. Final Report to the World Bank. 30 May 2007. Available online: http://siteresources.worldbank.org/INTGGFR/Resources/DMSP_flares_20070530_b-sm.pdf (accessed on 18 June 2018).
- Showstack, R. Satellite study of natural gas flaring. EOS Trans. Am. Geophys. Union 2007, 88. [Google Scholar] [CrossRef]
- Elvidge, C.D.; Ziskin, D.; Baugh, K.E.; Tuttle, B.T.; Ghosh, T.; Pack, D.W.; Erwin, E.H.; Zhizhin, M.A. A Fifteen Year Record of Global Natural Gas Flaring Derived from Satellite Data. Energies 2009, 2, 595–622. [Google Scholar] [CrossRef] [Green Version]
- Anejionu, O.C.D.; Blackburn, G.A.; Whyatt, J.D. Satellite survey of gas flares: Development and application of a Landsat based technique in the Niger Delta. Int. J. Remote Sens. 2014, 35, 1900–1925. [Google Scholar] [CrossRef] [Green Version]
- Chowdhury, S.; Shipman, T.; Chao, D.; Elvidge, C.D.; Zhizhin, M.; Hsu, F.C. Daytime gas flare detection using Landsat-8 multispectral data. In Proceedings of the IEEE International Geoscience Remote Sensing Symposium, Quebec City, QC, Canada, 13–18 July 2014; pp. 258–261, ISBN 978-1-4799-5775-0. [Google Scholar]
- Elvidge, C.D.; Baugh, K.E.; Ziskin, D.; Anderson, S.; Ghosh, T. Estimation of Gas Flaring Volumes Using NASA MODIS Fire Detection Products. NGDC Annual Report; 2011. Available online: https://ngdc.noaa.gov/eog/interest/flare_docs/NGDC_annual_report_20110209.pdf (accessed on 18 June 2018).
- Faruolo, M.; Coviello, I.; Filizzola, C.; Lacava, T.; Pergola, N.; Tramutoli, V. A satellite-based analysis of the Val d’Agri Oil Center (Southern Italy) gas flaring emissions. Nat. Hazards Earth Syst. Sci. 2014, 14, 2783–2793. [Google Scholar] [CrossRef]
- Zhang, X.; Scheving, B.; Shoghli, B.; Zygarlicke, C.; Wocken, C. Quantifying Gas Flaring CH4 Consumption Using VIIRS. Remote Sens. 2015, 7, 9529–9541. [Google Scholar] [CrossRef]
- Elvidge, C.D.; Zhizhin, M.; Hsu, F.C.; Baugh, K.E. VIIRS Nightfire: Satellite Pyrometry at Night. Remote Sens. 2013, 5, 4423–4449. [Google Scholar] [CrossRef] [Green Version]
- Casadio, S.; Arino, O.; Serpe, D. Gas flaring monitoring from space using the ATSR instrument series. Remote Sens. Environ. 2012, 116, 239–249. [Google Scholar] [CrossRef]
- Casadio, S.; Arino, O.; Minchella, A. Use of ATSR and SAR measurements for the monitoring and characterisation of night-time gas flaring from off-shore platforms: The North Sea test case. Remote Sens. Environ. 2012, 123, 175–186. [Google Scholar] [CrossRef]
- Liu, Y.; Hu, C.; Zhan, W.; Sun, C.; Murch, B.; Ma, L. Identifying industrial heat sources using time-series of the VIIRS Nightfire product with an object-oriented approach. Remote Sens. Environ. 2018, 204, 347–365. [Google Scholar] [CrossRef]
- Fisher, D.; Wooster, M.J. Shortwave IR Adaption of the Mid-Infrared Radiance Method of Fire Radiative Power (FRP) Retrieval for Assessing Industrial Gas Flaring Output. Remote Sens. 2018, 10, 305. [Google Scholar] [CrossRef]
- Cuomo, V.; Filizzola, C.; Pergola, N.; Pietrapertosa, C.; Tramutoli, V. A self-sufficient approach for GERB cloudy radiance detection. Atmos. Res. 2004, 72, 39–56. [Google Scholar] [CrossRef]
- Pietrapertosa, C.; Pergola, N.; Lanorte, V.; Tramutoli, V. Self Adaptive Algorithms for Change Detection: OCA (the One-channel Cloud-detection Approach) an adjustable method for cloudy and clear radiances detection. In Proceedings of the Eleventh International (A)TOVS Study Conference (ITSC-XI), Budapest, Hungary, 20–26 September 2000; pp. 281–291. [Google Scholar]
- Nigerian National Petroleum Corporation (NNPC). 2016. Available online: http://www.nnpcgroup.com/nnpcbusiness/upstreamventures/oilproduction.aspx (accessed on 20 April 2018).
- Organization of the Petroleum Exporting Countries (OPEC). Annual Statistical Bulletin 2016. 2016. Available online: http://www.opec.org/opec_web/static_files_project/media/downloads/publications/ASB2016.pdf (accessed on 18 June 2018).
- Energy Information Administration (EIA). Country Analysis Brief: Nigeria. 6 May 2016. Available online: http://www.marcon.com/library/country_briefs/Nigeria/nigeria.pdf (accessed on 20 April 2018).
- Tramutoli, V. Robust AVHRR Techniques (RAT) for Environmental Monitoring: Theory and applications. In Earth Surface Remote Sensing II; Cecchi, G., Zilioli, E., Eds.; SPIE: Barcelona, Spain, 1998; Volume 3496. [Google Scholar]
- Tramutoli, V. Robust Satellite Techniques (RST) for natural and environmental hazards monitoring and mitigation: Ten years of successful applications. In Proceedings of the 9th International Symposium on Physical Measurements and Signatures in Remote Sensing, Beijing, China, 17–19 October 2005; Liang, S., Liu, J., Li, X., Liu, R., Schaepman, M., Eds.; Volume XXXVI, pp. 792–1750, ISBN 1682-1750. [Google Scholar]
- Tramutoli, V. Robust Satellite Techniques (RST) for Natural and Environmental Hazards Monitoring and Mitigation: Theory and Applications. In Proceedings of the Fourth International Workshop on the Analysis of Multitemporal Remote Sensing Images, Louven, Belgium, 18–20 July 2007. [Google Scholar] [CrossRef]
- Faruolo, M.; Coviello, I.; Lacava, T.; Pergola, N.; Tramutoli, V. A Multi-Sensor Exportable Approach for Automatic Flooded Areas Detection and Monitoring by a Composite Satellite Constellation. IEEE Trans. Geosci. Remote Sens. 2013, 51, 2136–2149. [Google Scholar] [CrossRef]
- Pergola, N.; Coviello, I.; Filizzola, C.; Lacava, T.; Marchese, F.; Paciello, P.; Tramutoli, V. A review of RSTVOLC, an original algorithm for automatic detection and near-real-time monitoring of volcanic hotspots from space. Geol. Soc. Lond. Spec. Publ. 2015, 426. [Google Scholar] [CrossRef]
- Filizzola, C.; Corrado, R.; Marchese, F.; Mazzeo, G.; Paciello, R.; Pergola, N.; Tramutoli, V. RST-FIRES, an exportable algorithm for early-fire detection and monitoring: Description, implementation, and field validation in the case of the MSG-SEVIRI sensor. Remote Sens. Environ. 2016, 186, 196–216. [Google Scholar] [CrossRef]
- Lacava, T.; Ciancia, C.; Coviello, I.; Di Polito, C.; Grimaldi, C.S.L.; Pergola, N.; Satriano, V.; Temimi, M.; Zhao, J.; Tramutoli, V. A MODIS-Based Robust Satellite Technique (RST) for Timely Detection of Oil Spilled Areas. Remote Sens. 2017, 9, 128. [Google Scholar] [CrossRef]
- Marchese, F.; Falconieri, A.; Pergola, N.; Tramutoli, V. Monitoring the Agung (Indonesia) Ash Plume of November 2017 by Means of Infrared Himawari 8 Data. Remote Sens. 2018, 10, 919. [Google Scholar] [CrossRef]
- Koeppen, W.C.; Pilger, E.; Wright, R. Time series analysis of infrared satellite data for detecting thermal anomalies: A hybrid approach. Bull. Volcanol. 2011, 73, 577–593. [Google Scholar] [CrossRef]
- International Forest Fire News. Fire situation in Nigeria. 2006. Available online: http://www.fire.uni-freiburg.de/iffn/iffn_34/12-IFFN-34-Nigeria.pdf (accessed on 18 June 2018).
- Nigerian National Petroleum Corporation (NNPC). NNPC News & Update, 6 January 2017. Available online: http://nnpcgroup.com/PublicRelations/NNPCinthenews/tabid/92/articleType/ArticleView/articleId/755/Gas-Flaring-Nigeria-Achieves-26-Per-Cent-Reduction.aspx pdf (accessed on 18 June 2018).
- Okafor, J.C.; Aniche, E.T. Nigeria and World Bank Global Gas Flaring Reduction (GGFR) Partnership: The Tragedy of the Commons. Dev. Ctry. Stud. 2016, 6, 44–57. Available online: https://ssrn.com/abstract=2915074 (accessed on 18 June 2018).
- Fluenta. Gas Flaring in the News–December/January 2017. 2017. Available online: http://www.fluenta.com/news/flaring-in-the-news/gas-flaring-in-the-news-december-january/ (accessed on 18 June 2018).
- Thurber, M.; Emelife, I.; Heller, P. NNPC and Nigeria’s oil patronage ecosystem. In Oil and Governance: State-Owned Enterprises and the World Energy Supply; Victor, D., Hults, D., Thurber, M., Eds.; Cambridge University Press: Cambridge, UK, 2011; pp. 701–752. Available online: https://fsi-live.s3.us-west-1.amazonaws.com/s3fs-public/WP_95%2C_Thurber_Emelife_Heller%2C_NNPC%2C_16_September_2010.pdf (accessed on 18 June 2018). [CrossRef]
- Ibitoye, F.I. Ending Natural Gas Flaring in Nigeria’s Oil Fields. J. Sustain. Dev. 2014, 7, 13–22. [Google Scholar] [CrossRef]
- Shell Petroleum Development Company of Nigeria (SPDC). Shell in Nigeria: Gas Flaring. 2014. Available online: https://s06.static-shell.com/content/dam/shell-new/local/country/nga/downloads/pdf/2014bnotes/gas-flaring.pdf (accessed on 18 June 2018).
- Paki, A.E.; Ebienfa, I.K. Militant Oil Agitations in Nigeria’s Niger Delta and the Economy. Int. J. Hum. Soc. Sci. 2011, 1, 140–145. [Google Scholar]
- Coppola, D.; Laiolo, M.; Lara, L.E.; Cigolini, C.; Orozco, G. The 2008 “silent” eruption of Nevados de Chillán (Chile) detected from space: Effusive rates and trends from the MIROVA system. J. Volcanol. Geotherm. Res. 2016, 327, 322–329. [Google Scholar] [CrossRef]
- Wright, R.; Blackett, M.; Hill-Butler, C. Some observations regarding the thermal flux from Earth’s erupting volcanoes for the period of 2000 to 2014. Geophys. Res. Lett. 2015, 42, 282–289. [Google Scholar] [CrossRef]
- Giglio, L.; Schroeder, W.; Justice, C.O. The collection 6 MODIS active fire detection algorithm and fire products. Remote Sens. Environ. 2016, 178, 31–41. [Google Scholar] [CrossRef]


| State | N. Detected Flaring Sites | ||
|---|---|---|---|
| Onshore | Offshore | Total | |
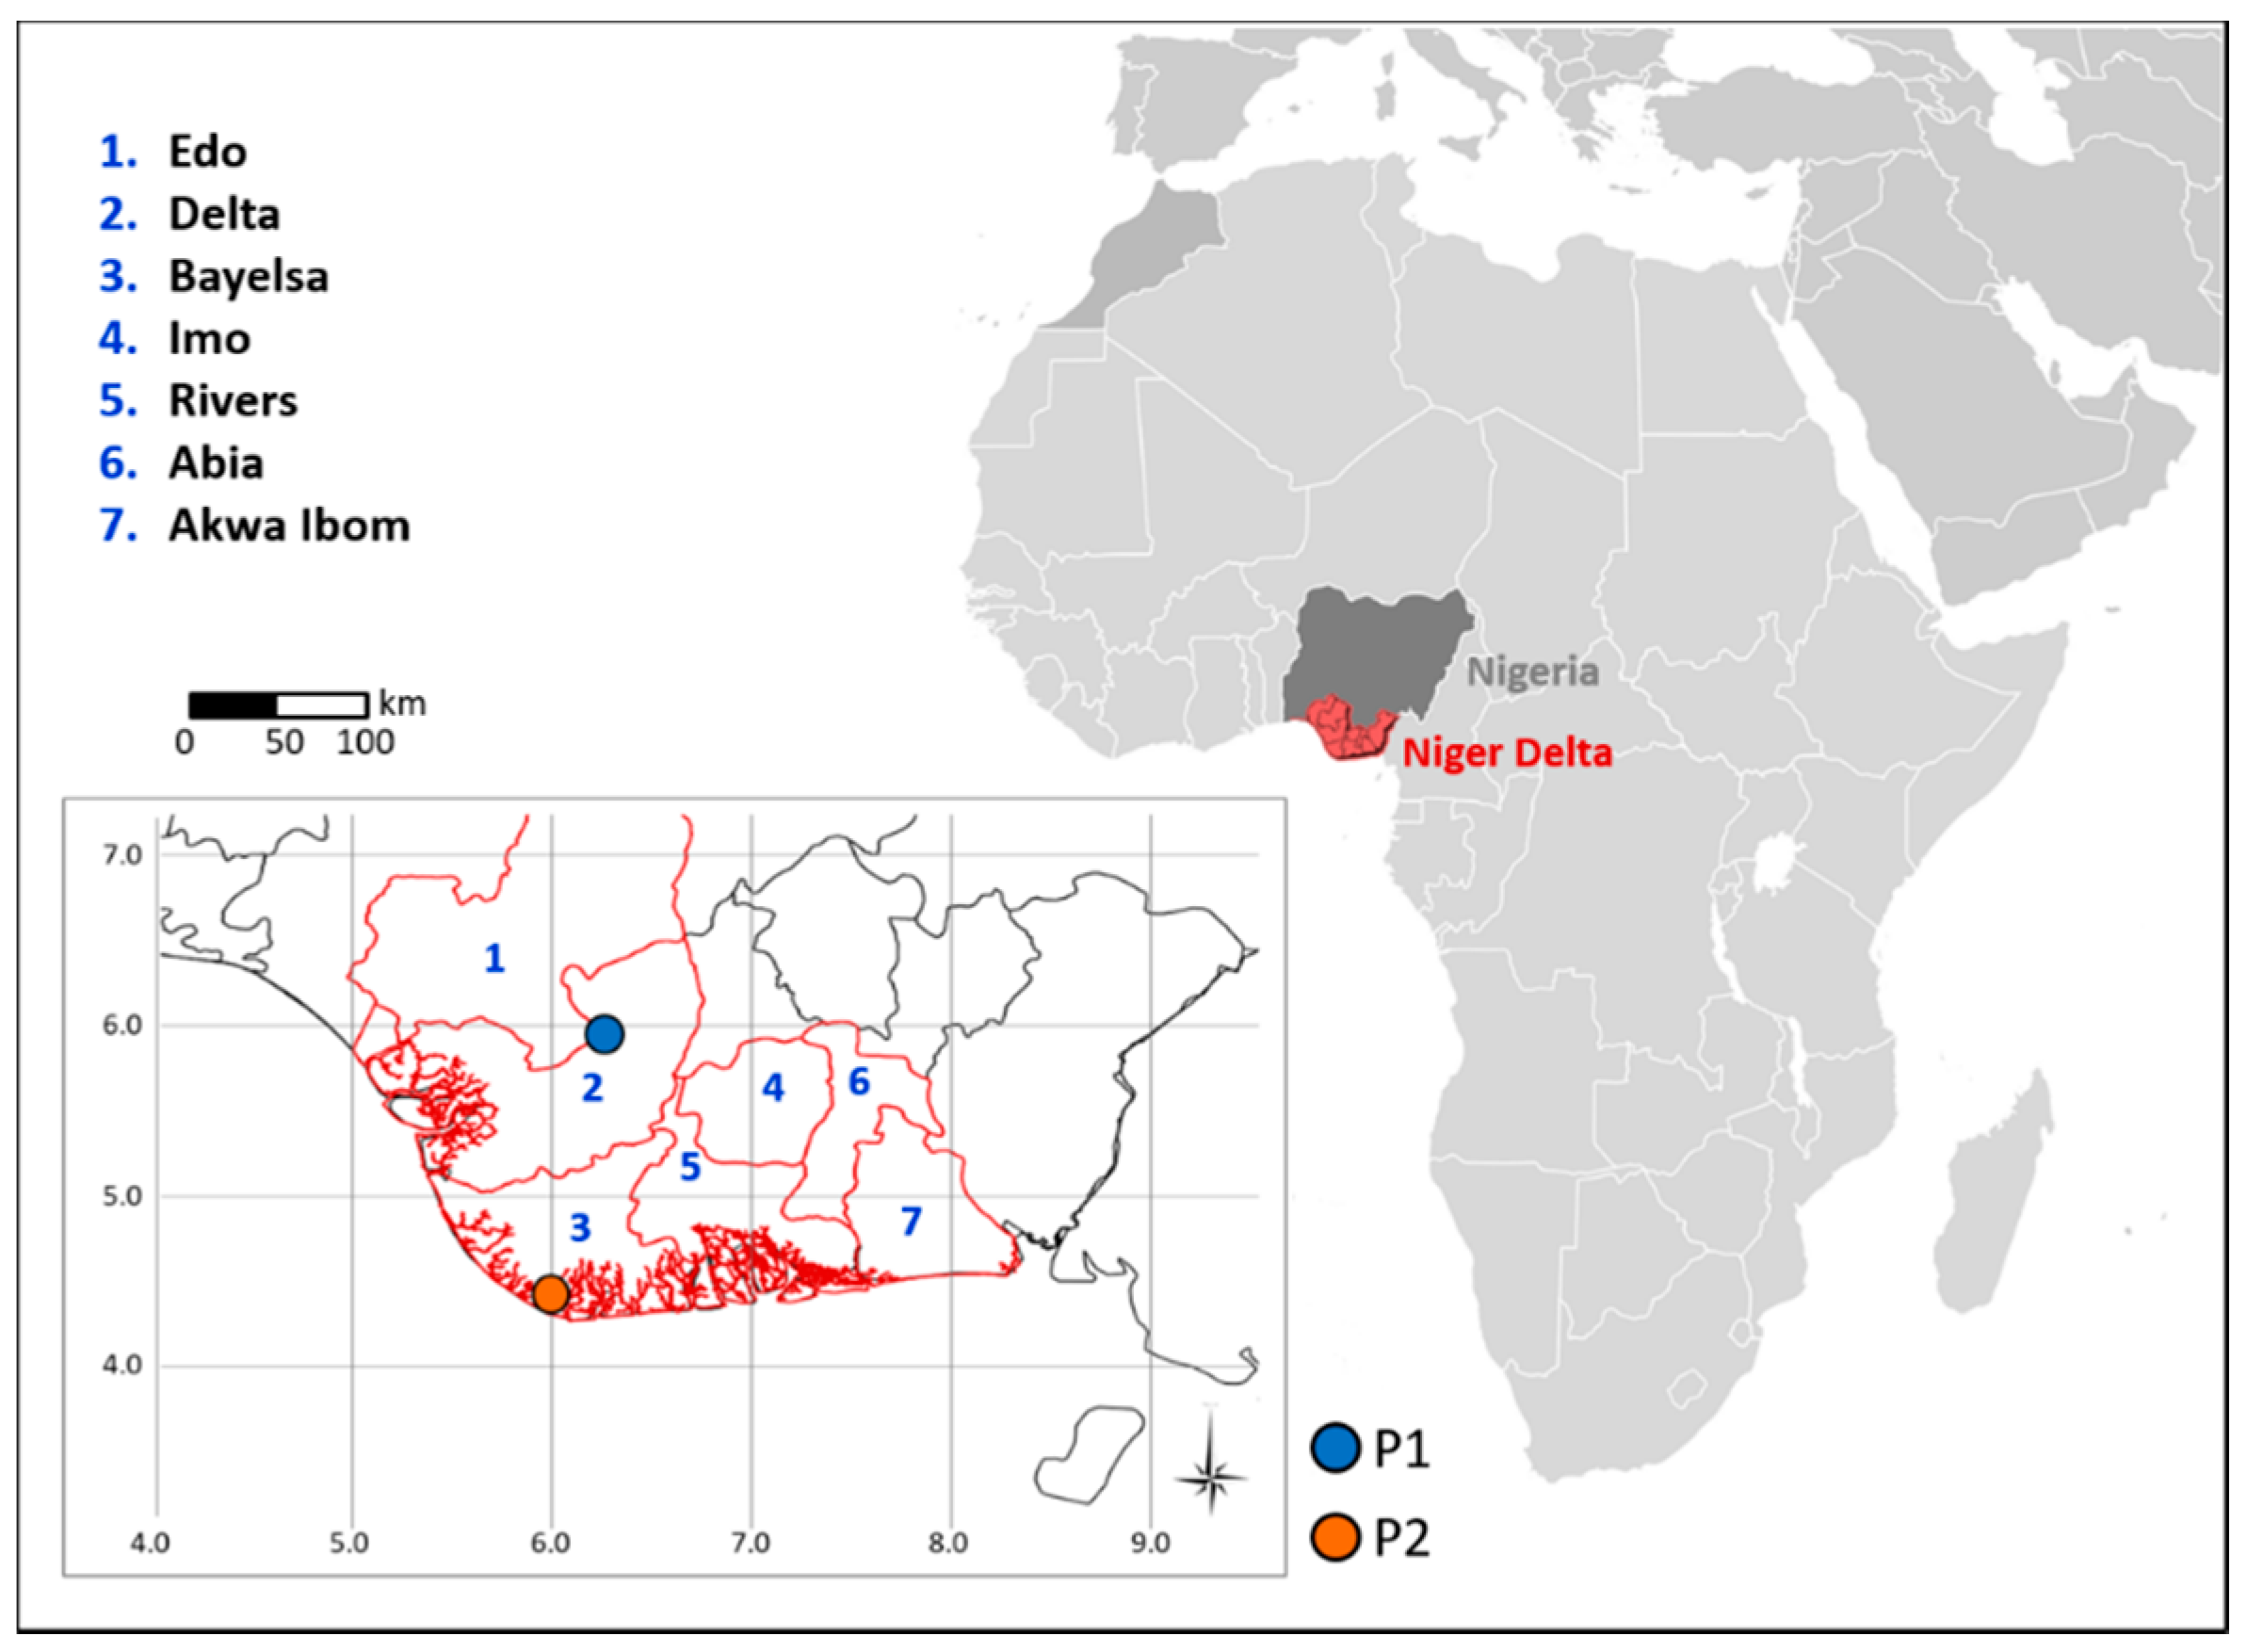
| 1. Edo | 19 | 0 | 19 |
| 2. Delta | 56 | 23 | 79 |
| 3. Bayelsa | 54 | 15 | 69 |
| 4. Imo | 12 | 0 | 12 |
| 5. Rivers | 70 | 34 | 104 |
| 6. Abia | 1 | 0 | 1 |
| 7. Akwa Ibom | 3 | 27 | 30 |
| Total | 215 | 99 | 314 |
| Source | Temporal Range | Regression Model Equation | R2 | p-Value | Year of Estimation | Gas Flared Volume [BCM] |
|---|---|---|---|---|---|---|
| OPEC | 2000–2013 | Gas flared [BCM] = 0.0005*BTE + 9.401 | 65% | <0.01 | 2014 | 14.3 |
| 2015 | 12.4 | |||||
| 2016 | 11.9 | |||||
| EIA | 2005–2013 | Gas flared [BCM] = 0.0008*BTE + 3.902 | 67% | <0.01 | 2014 | 13.4 |
| 2015 | 10.4 | |||||
| 2016 | 9.5 |
| State | Onshore | Offshore | ||
|---|---|---|---|---|
| RST-FLARE | MODET | RST-FLARE | MODET | |
| 1. Edo | 19 | 19 | 0 | 0 |
| 2. Delta | 56 | 51 | 23 | 19 |
| 3. Bayelsa | 54 | 41 | 15 | 12 |
| 4. Imo | 12 | 11 | 0 | 0 |
| 5. Rivers | 70 | 56 | 34 | 16 |
| 6. Abia | 1 | 1 | 0 | 0 |
| 7. Akwa Ibom | 3 | 6 | 27 | 30 |
| Total | 215 | 185 | 99 | 77 |
| Max Bias | Min Bias | Mean Bias | |
|---|---|---|---|
| RST-FLARE OPEC-based | 78.4% | 0.3% | 19.7% |
| RST-FLARE EIA-based | 67.0% | 0.8% | 15.9% |
| MOVET | 78.9% | 3.2% | 34.1% |
| VNF | 42.5% | 6.2% | 24.9% |
© 2018 by the authors. Licensee MDPI, Basel, Switzerland. This article is an open access article distributed under the terms and conditions of the Creative Commons Attribution (CC BY) license (http://creativecommons.org/licenses/by/4.0/).
Share and Cite
Faruolo, M.; Lacava, T.; Pergola, N.; Tramutoli, V. On the Potential of the RST-FLARE Algorithm for Gas Flaring Characterization from Space. Sensors 2018, 18, 2466. https://doi.org/10.3390/s18082466
Faruolo M, Lacava T, Pergola N, Tramutoli V. On the Potential of the RST-FLARE Algorithm for Gas Flaring Characterization from Space. Sensors. 2018; 18(8):2466. https://doi.org/10.3390/s18082466
Chicago/Turabian StyleFaruolo, Mariapia, Teodosio Lacava, Nicola Pergola, and Valerio Tramutoli. 2018. "On the Potential of the RST-FLARE Algorithm for Gas Flaring Characterization from Space" Sensors 18, no. 8: 2466. https://doi.org/10.3390/s18082466