Deep Autoencoder Neural Networks for Short-Term Traffic Congestion Prediction of Transportation Networks


Abstract
1. Introduction
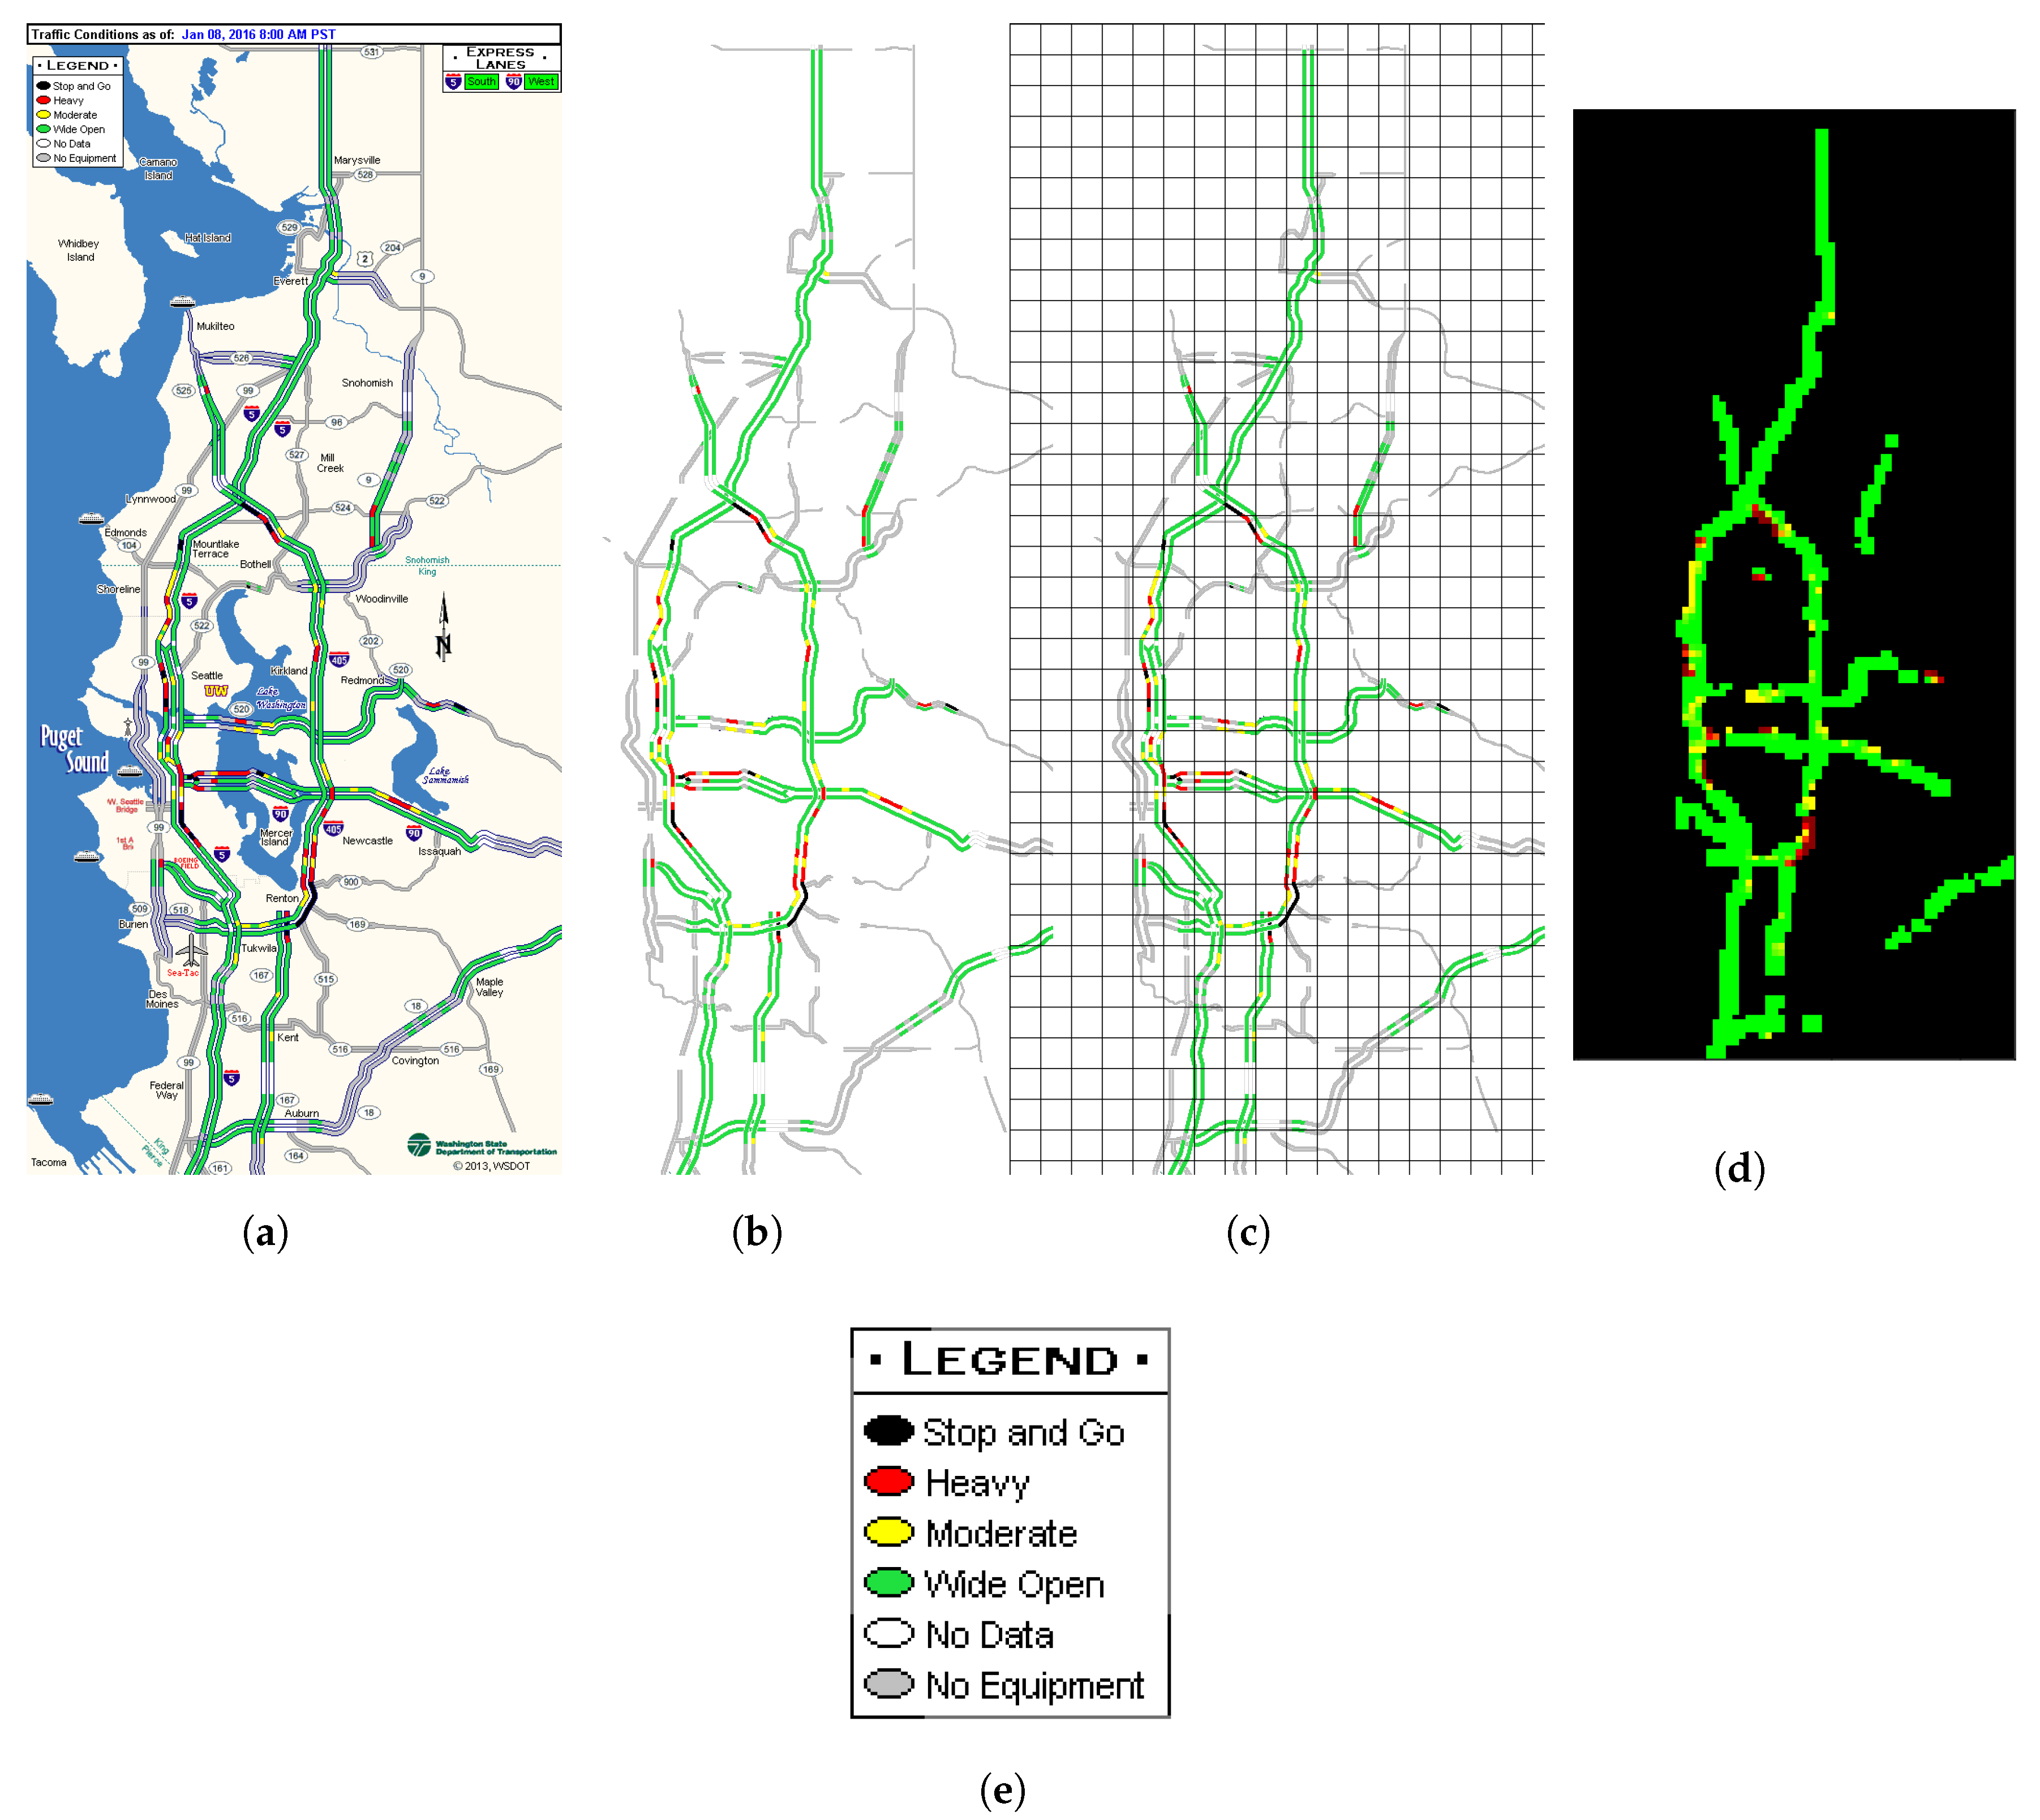
- We propose an accessible and general approach to collect, transform, and represent snapshots of transportation network maps marked with traffic congestion conditions for roads inside, which are publicly available from transportation administrative departments and online traffic map service providers. Based on this approach, we have built and released a long-span traffic congestion dataset.
- We develop a deep neural network model for efficient end-to-end prediction of transportation network congestion levels by using hierarchical feature extraction. Our end-to-end learning model directly outputs prediction results presented visually and intuitively in the same road network structure and form as inputs are, thus eliminating the need for manual feature selection and engineering.
- Our extensive experiments on a transportation network in the Seattle area demonstrates effectiveness and efficiency of the proposed approach.
2. Related Work
3. Methodology
3.1. Representation of Congestion Level of the Transportation Network
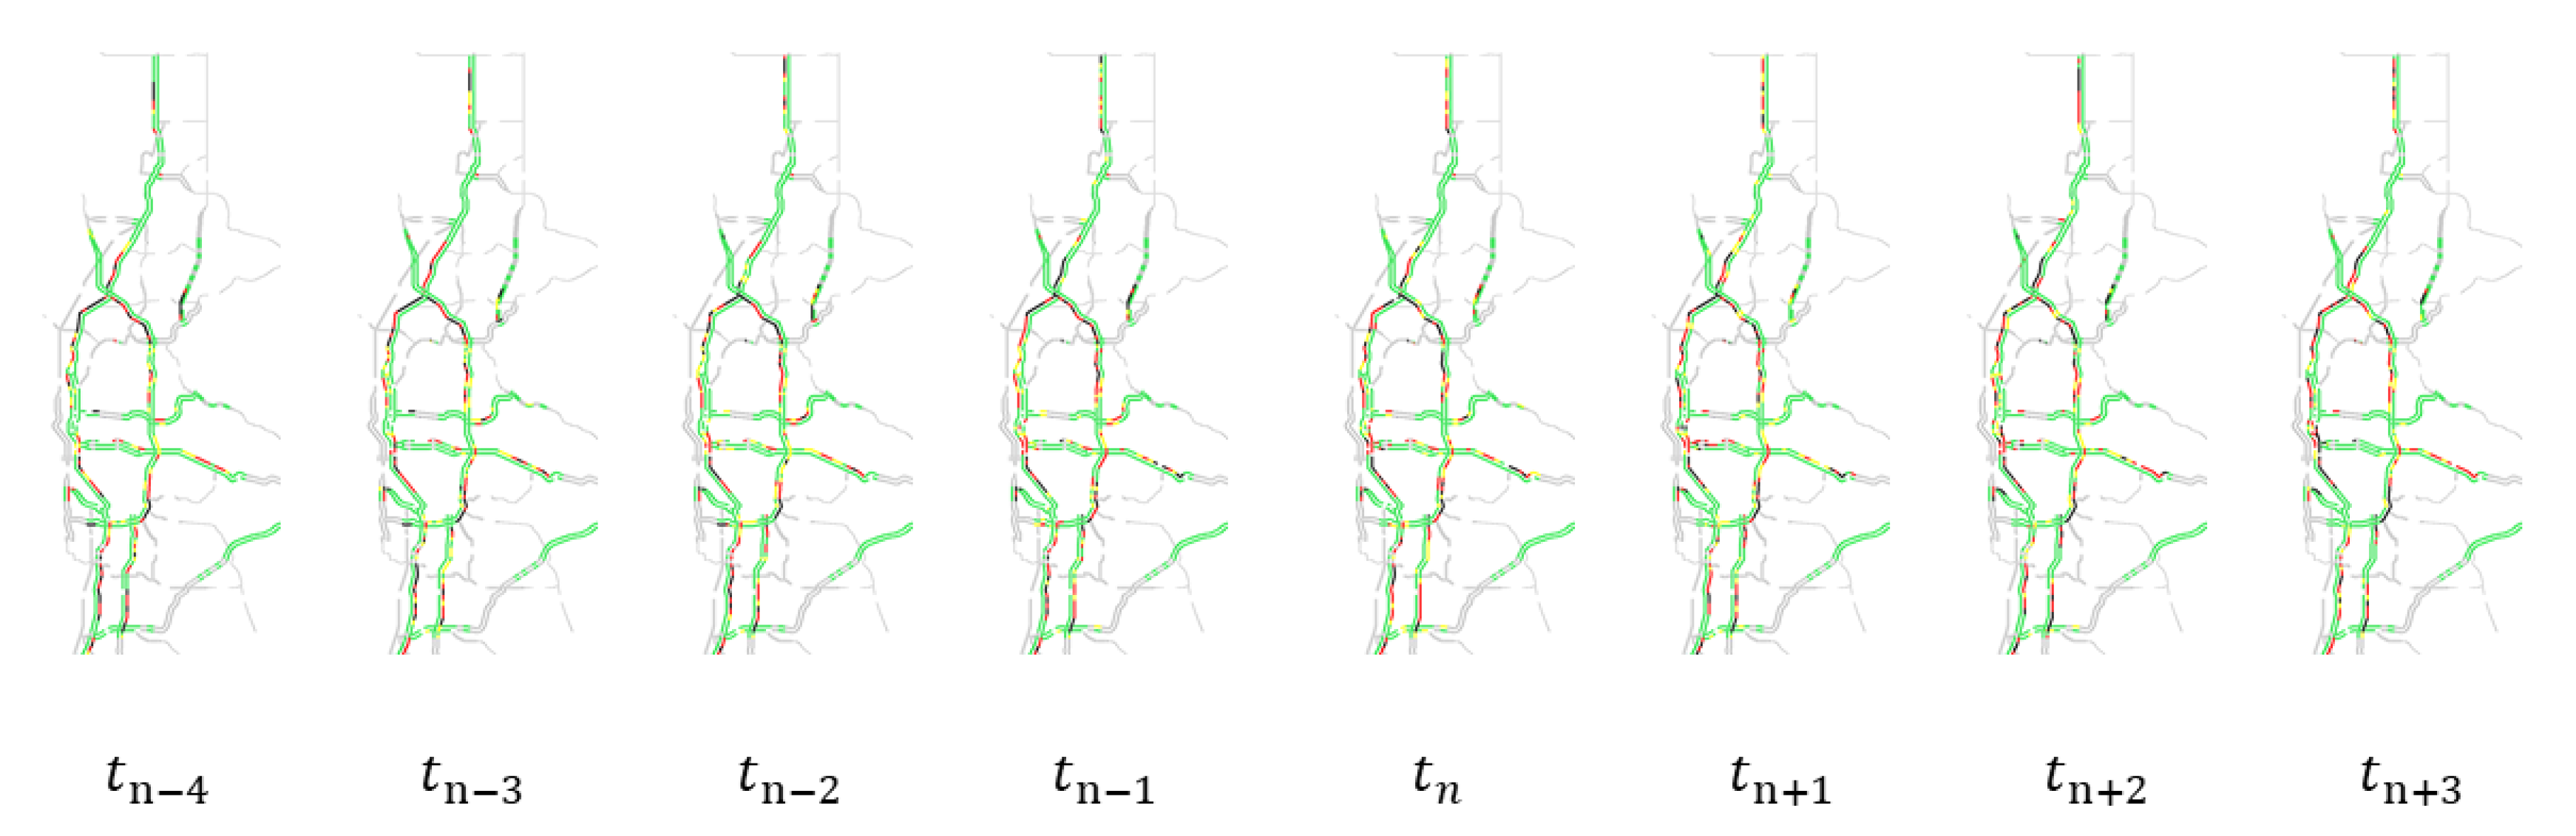
3.2. Temporal Features
3.3. Deep Congestion Prediction Network
4. Experiments and Results Analysis
4.1. Data Source
4.1.1. Data Comprehension, Preprocessing and Representation
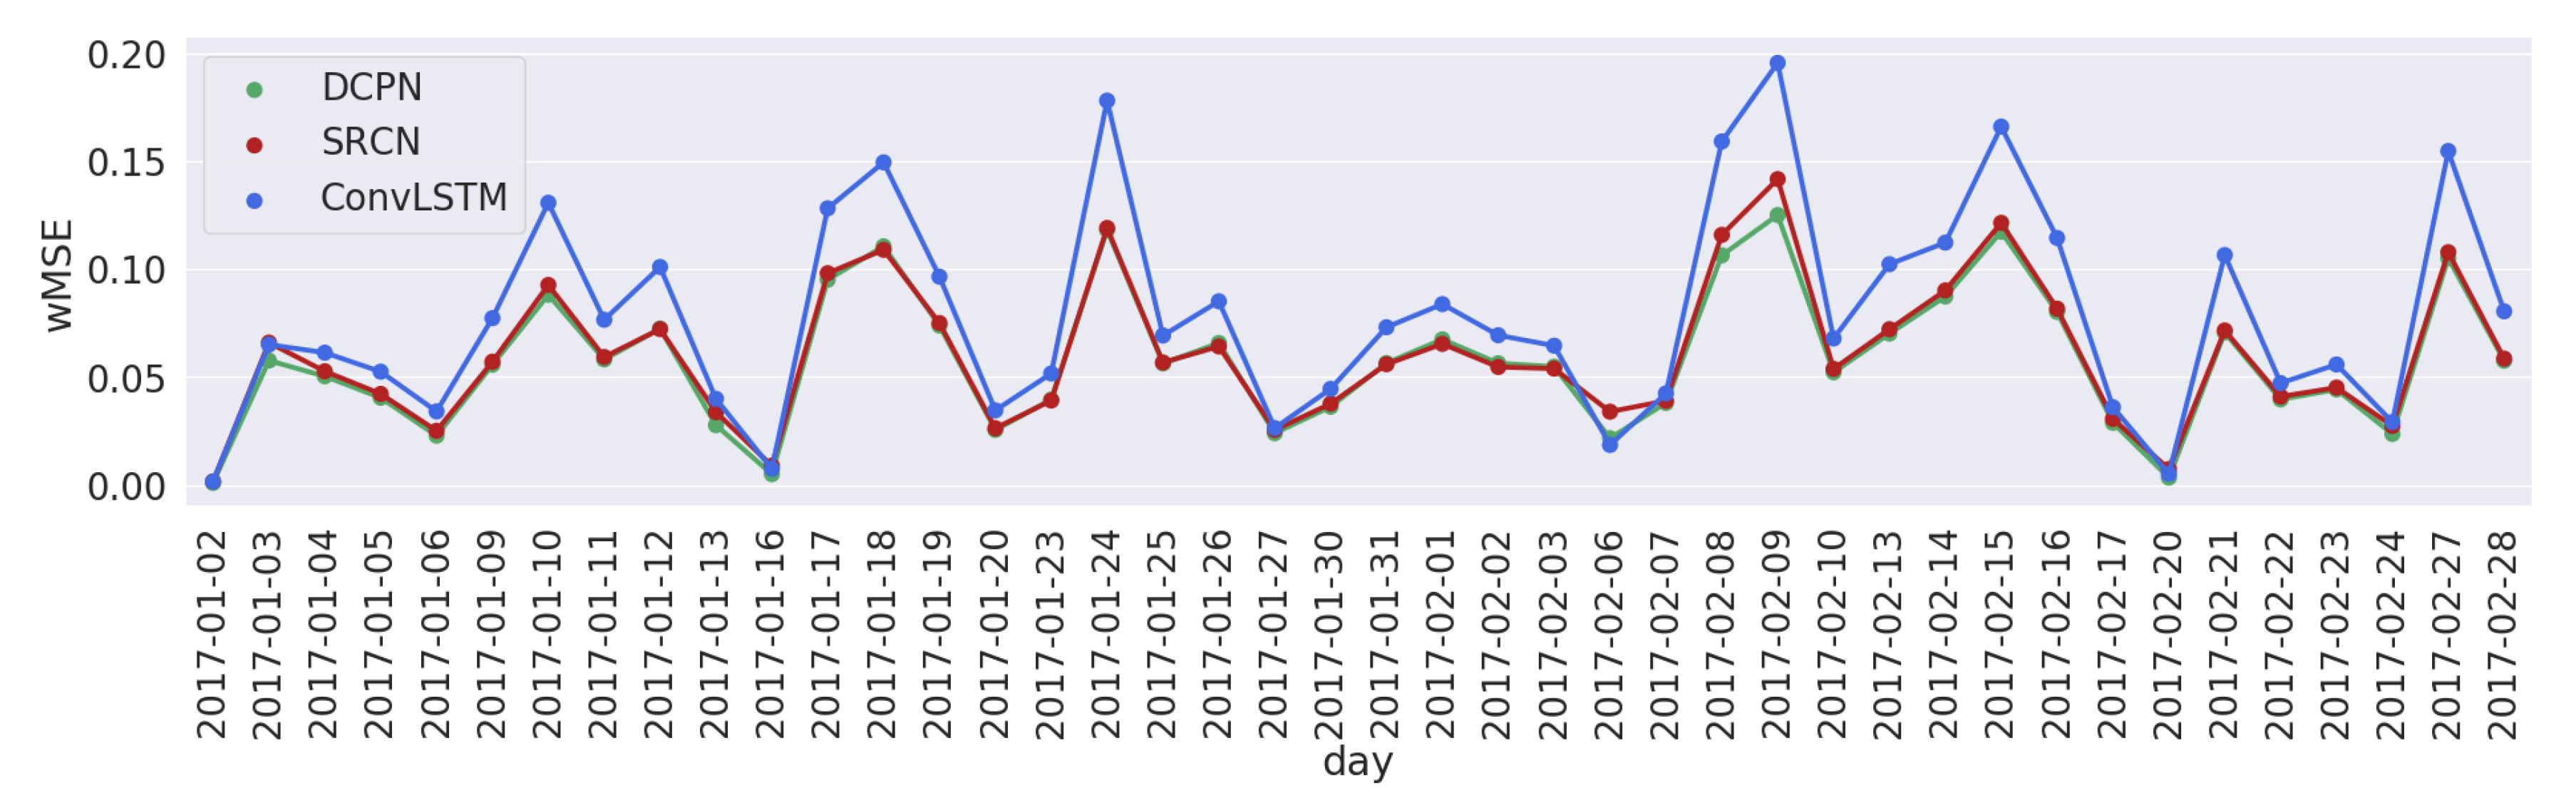
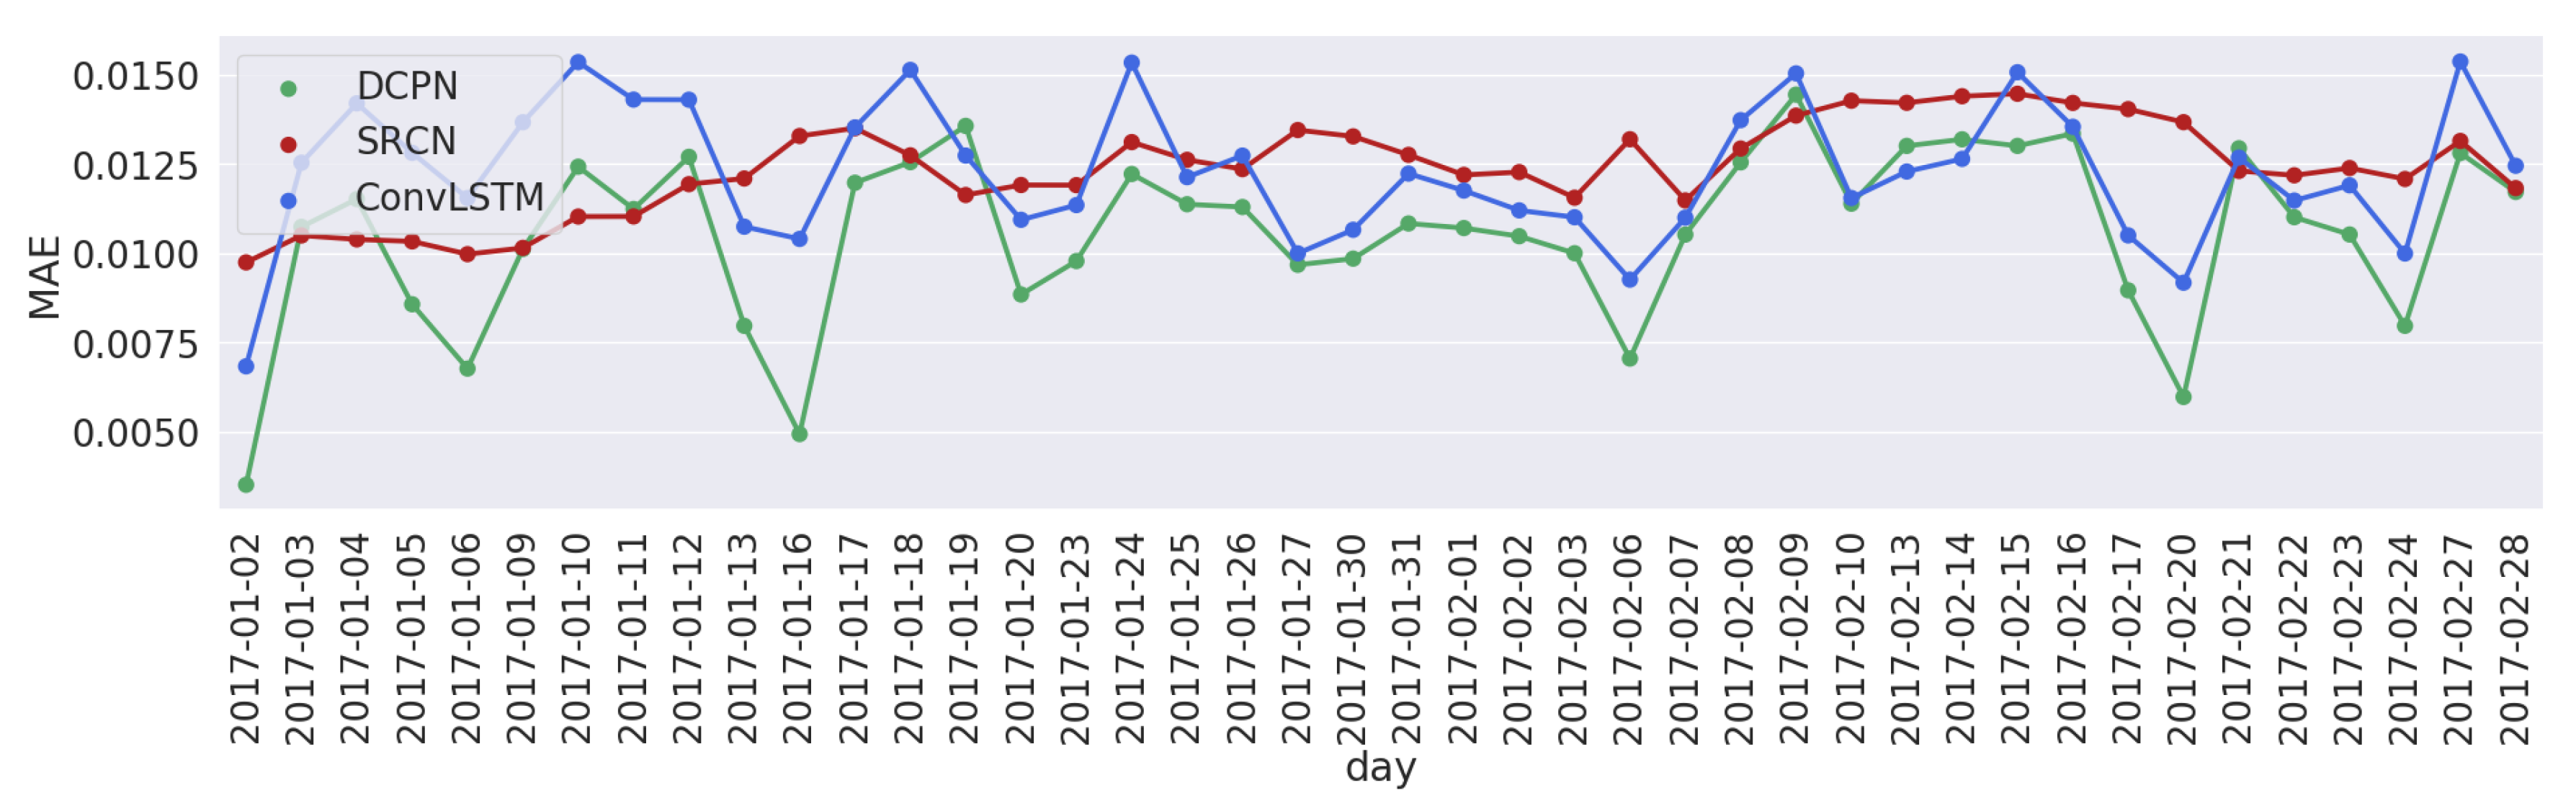
4.2. Performance Comparison and Metrics
4.3. Implementation of the DCPN Model
4.4. Back-Testing
4.5. Results and Analysis
5. Discussion
6. Conclusions
Author Contributions
Funding
Acknowledgments
Conflicts of Interest
References
- Tseng, F.; Hsueh, J.; Tseng, C.; Yang, Y.; Chao, H.; Chou, L. Congestion Prediction With Big Data for Real-Time Highway Traffic. IEEE Access 2018, 6, 57311–57323. [Google Scholar] [CrossRef]
- Chen, M.; Yu, X.; Liu, Y. PCNN: Deep Convolutional Networks for Short-Term Traffic Congestion Prediction. IEEE Trans. Intell. Transp. Syst. 2018, 19, 3550–3559. [Google Scholar] [CrossRef]
- Coifman, B. Freeway Detector Assessment: Aggregate Data from Remote Traffic Microwave Sensor. Transp. Res. Record J. Transp. Res. Board 2005, 1917, 149–163. [Google Scholar] [CrossRef]
- Fouladgar, M.; Parchami, M.; Elmasri, R.; Ghaderi, A. Scalable Deep Traffic Flow Neural Networks for Urban Traffic Congestion Prediction. In Proceedings of the 2017 International Joint Conference on Neural Networks (IJCNN), Anchorage, AK, USA, 14–19 May 2017; pp. 2251–2258. [Google Scholar]
- Lv, Y.; Duan, Y.; Kang, W.; Li, Z.; Wang, F.Y. Traffic Flow Prediction with Big Data: A Deep Learning Approach. IEEE Trans. Intell. Transp. Syst. 2015, 16, 865–873. [Google Scholar] [CrossRef]
- Yu, H.; Wu, Z.; Wang, S.; Wang, Y.; Ma, X. Spatiotemporal Recurrent Convolutional Networks for Traffic Prediction in Transportation Networks. Sensors 2017, 17, 1501. [Google Scholar] [CrossRef]
- Ma, X.; Yu, H.; Wang, Y.; Wang, Y. Large-Scale Transportation Network Congestion Evolution Prediction Using Deep Learning Theory. PLoS ONE 2015, 10, e0119044. [Google Scholar] [CrossRef]
- Zhang, X.; Onieva, E.; Perallos, A.; Osaba, E.; Lee, V.C. Hierarchical fuzzy rule-based system optimized with genetic algorithms for short term traffic congestion prediction. Transp. Res. Part C Emerg. Technol. 2014, 43, 127–142. [Google Scholar] [CrossRef]
- Lopez-Garcia, P.; Onieva, E.; Osaba, E.; Masegosa, A.D.; Perallos, A. A Hybrid Method for Short-Term Traffic Congestion Forecasting Using Genetic Algorithms and Cross Entropy. IEEE Trans. Intell. Transp. Syst. 2016, 17, 557–569. [Google Scholar] [CrossRef]
- Ben-Akiva, M.; Bierlaire, M.; Koutsopoulos, H.; Mishalani, R. DynaMIT: A Simulation-Based System for Traffic Prediction; DACCORD Short Term Forecasting Workshop: Delft, The Netherlands, 1998; pp. 1–12. [Google Scholar]
- Dailey, D.J.; Trepanier, T. The Use of Weather Data to Predict Non-Recurring Traffic Congestion; Technical Report; Washington Department of Transportation: Seattle, Washington, 2006. [Google Scholar]
- Lima, A.M.; Campos, J. Evaluating the Use of Traffic Information from Web Map Services to Analyze the Impact of Non-Recurrent Events. In Proceedings of the 2016 IEEE 19th International Conference on Intelligent Transportation Systems (ITSC), Rio de Janeiro, Brazil, 1–4 November 2016; pp. 2077–2082. [Google Scholar] [CrossRef]
- Ali, U.; Mahmood, T. Using Deep Learning to Predict Short Term Traffic Flow: A Systematic Literature Review. In First International Conference on Intelligent Transport Systems; Springer: Cham, Switzerland, 2017; pp. 90–101. [Google Scholar]
- Kahaki, S.M.; Nordin, M.J. Highway Traffic Incident Detection Using High-Resolution Aerial Remote Sensing Imagery. J. Comput. Sci. 2011, 7, 949. [Google Scholar] [CrossRef]
- Kahaki, S.M.M.; Nordin, M.J. Vision-Based Automatic Incident Detection System Using Image Sequences for Intersections. In Proceedings of the 2011 International Conference on Pattern Analysis and Intelligence Robotics, Putrajaya, Malaysia, 28–29 June 2011; Volume 1, pp. 3–7. [Google Scholar] [CrossRef]
- Beijing Traffic Management Bureau. Available online: http://eye.bjjtw.gov.cn/Web-T_bjjt_new/Main.html (accessed on 7 October 2018).
- WSDOT—Seattle Washington Cameras. Available online: http://www.wsdot.com/traffic/seattle/default.aspx (accessed on 23 June 2018).
- Google Maps. Available online: https://www.google.com/maps (accessed on 6 October 2018).
- AutoNavi Map. Available online: https://ditu.amap.com (accessed on 6 March 2018).
- Bing Maps. Available online: https://www.bing.com/maps (accessed on 6 October 2018).
- Ermagun, A.; Levinson, D. Spatiotemporal Traffic Forecasting: Review and Proposed Directions. Transp. Rev. 2018, 38, 786–814. [Google Scholar] [CrossRef]
- Hinton, G.E.; Salakhutdinov, R.R. Reducing the Dimensionality of Data with Neural Networks. Science 2006, 313, 504–507. [Google Scholar] [CrossRef]
- Goodfellow, I.; Bengio, Y.; Courville, A.; Bengio, Y. Deep Learning; MIT Press: Cambridge, UK, 2016; Volume 1. [Google Scholar]
- Krizhevsky, A.; Hinton, G.E. Using Very Deep Autoencoders for Content-Based Image Retrieval. In 19th European Symposium on Artificial Neural Networks, Computational Intelligence and Machine Learning; Ciaco: Bruges, Belgium, 2011. [Google Scholar]
- Feng, X.; Zhang, Y.; Glass, J. Speech Feature Denoising and Dereverberation via Deep Autoencoders for Noisy Reverberant Speech Recognition. In Proceedings of the 2014 IEEE International Conference on Acoustics, Speech and Signal Processing (ICASSP), Florence, Italy, 4–9 May 2014; pp. 1759–1763. [Google Scholar]
- Wang, D.; Yang, Y.; Ning, S. DeepSTCL: A Deep Spatio-Temporal ConvLSTM for Travel Demand Prediction. In Proceedings of the 2018 International Joint Conference on Neural Networks (IJCNN), Rio de Janeiro, Brazil, 8–13 July 2018; pp. 1–8. [Google Scholar] [CrossRef]
- Mori, U.; Mendiburu, A.; Álvarez, M.; Lozano, J.A. A Review of Travel Time Estimation and Forecasting for Advanced Traveller Information Systems. Transp. A Transp. Sci. 2015, 11, 119–157. [Google Scholar] [CrossRef]
- Smith, B.L.; Williams, B.M.; Oswald, R.K. Comparison of Parametric and Nonparametric Models for Traffic Flow Forecasting. Transp. Res. Part C Emerg. Technol. 2002, 10, 303–321. [Google Scholar] [CrossRef]
- Williams, B.M.; Hoel, L.A. Modeling and Forecasting Vehicular Traffic Flow as a Seasonal ARIMA Process: Theoretical Basis and Empirical Results. J. Transp. Eng. 2003, 129, 664–672. [Google Scholar] [CrossRef]
- Ghosh, B.; Basu, B.; O’Mahony, M. Time-Series Modelling for Forecasting Vehicular Traffic Flow in Dublin. In Proceedings of the 84th Annual Meeting of the Transportation Research Board, Washington, DC, USA, 9 January 2005. [Google Scholar]
- Tran, Q.T.; Ma, Z.; Li, H.; Hao, L.; Trinh, Q.K. A Multiplicative Seasonal ARIMA/GARCH Model in EVN Traffic Prediction. Int. J. Commun. Netw. Syst. Sci. 2015, 8, 43. [Google Scholar] [CrossRef]
- Van Der Voort, M.; Dougherty, M.; Watson, S. Combining Kohonen Maps with Arima Time Series Models to Forecast Traffic Flow. Transp. Res. Part C Emerg. Technol. 1996, 4, 307–318. [Google Scholar] [CrossRef]
- Williams, B. Multivariate Vehicular Traffic Flow Prediction: Evaluation of ARIMAX Modeling. Transp. Res. Record J. Transp. Res. Board 2001, 1776, 194–200. [Google Scholar] [CrossRef]
- Szeto, W.Y.; Ghosh, B.; Basu, B.; O’Mahony, M. Multivariate Traffic Forecasting Technique Using Cell Transmission Model and SARIMA Model. J. Transp. Eng. 2009, 135, 658–667. [Google Scholar] [CrossRef]
- Van Lint, J.W.C.; Van Hinsbergen, C. Short-Term Traffic and Travel Time Prediction Models. Artif. Intell. Appl. Crit. Transp. Issues 2012, 22, 22–41. [Google Scholar]
- Vlahogianni, E.I.; Karlaftis, M.G.; Golias, J.C. Short-Term Traffic Forecasting: Where We Are and Where We’re Going. Transp. Res. Part C Emerg. Technol. 2014, 43, 3–19. [Google Scholar] [CrossRef]
- Davis, G.A.; Nihan, N.L. Nonparametric Regression and Short-Term Freeway Traffic Forecasting. J. Transp. Eng. 1991, 117, 178–188. [Google Scholar] [CrossRef]
- Clark, S. Traffic Prediction Using Multivariate Nonparametric Regression. J. Transp. Eng. 2003, 129, 161–168. [Google Scholar] [CrossRef]
- Chang, H.; Lee, Y.; Yoon, B.; Baek, S. Dynamic Near-Term Traffic Flow Prediction: Systemoriented Approach Based on Past Experiences. IET Intell. Transp. Syst. 2012, 6, 292–305. [Google Scholar] [CrossRef]
- Liu, Z.; Du, W.; Yan, D.M.; Chai, G.; Guo, J.H. Short-Term Traffic Flow Forecasting Based on Combination of K-Nearest Neighbor and Support Vector Regression. J. Highway Transp. Res. Dev. (Engl. Ed.) 2018, 12, 89–96. [Google Scholar] [CrossRef]
- Zheng, L.; Zhu, C.; Zhu, N.; He, T.; Dong, N.; Huang, H. Feature Selection-Based Approach for Urban Short-Term Travel Speed Prediction. IET Intell. Transp. Syst. 2018, 12, 474–484. [Google Scholar] [CrossRef]
- Wu, C.H.; Ho, J.M.; Lee, D.T. Travel-Time Prediction with Support Vector Regression. IEEE Trans. Intell. Transp. Syst. 2004, 5, 276–281. [Google Scholar] [CrossRef]
- Castro-Neto, M.; Jeong, Y.S.; Jeong, M.K.; Han, L.D. Online-SVR for Short-Term Traffic Flow Prediction under Typical and Atypical Traffic Conditions. Expert Syst. Appl. 2009, 36, 6164–6173. [Google Scholar] [CrossRef]
- Hong, W.C.; Dong, Y.; Zheng, F.; Lai, C.Y. Forecasting Urban Traffic Flow by SVR with Continuous ACO. Appl. Math. Model. 2011, 35, 1282–1291. [Google Scholar] [CrossRef]
- Karlaftis, M.G.; Vlahogianni, E.I. Statistical Methods versus Neural Networks in Transportation Research: Differences, Similarities and Some Insights. Transp. Res. Part C Emerg. Technol. 2011, 19, 387–399. [Google Scholar] [CrossRef]
- Kumar, K.; Parida, M.; Katiyar, V.K. Short Term Traffic Flow Prediction in Heterogeneous Condition Using Artificial Neural Network. Transport 2015, 30, 397–405. [Google Scholar] [CrossRef]
- Kashi, S.O.M.; Akbarzadeh, M. A Framework for Short-Term Traffic Flow Forecasting Using the Combination of Wavelet Transformation and Artificial Neural Networks. J. Intell. Transp. Syst. 2018, 1–12. [Google Scholar] [CrossRef]
- Donoho, D.L. High-Dimensional Data Analysis: The Curses and Blessings of Dimensionality. AMS Math Chall. Lecture 2000, 1, 32. [Google Scholar]
- Verleysen, M.; François, D. The Curse of Dimensionality in Data Mining and Time Series Prediction. In International Work-Conference on Artificial Neural Networks; Springer: Barcelona, Spain, 2005; pp. 758–770. [Google Scholar]
- Huang, W.; Song, G.; Hong, H.; Xie, K. Deep Architecture for Traffic Flow Prediction: Deep Belief Networks With Multitask Learning. IEEE Trans. Intell. Transp. Syst. 2014, 15, 2191–2201. [Google Scholar] [CrossRef]
- Duan, Y.; Lv, Y.; Wang, F.Y. Performance Evaluation of the Deep Learning Approach for Traffic Flow Prediction at Different Times. In Proceedings of the 2016 IEEE International Conference on Service Operations and Logistics, and Informatics (SOLI), Beijing, China, 10–12 July 2016; pp. 223–227. [Google Scholar]
- Tian, Y.; Pan, L. Predicting Short-Term Traffic Flow by Long Short-Term Memory Recurrent Neural Network. In Proceedings of the 2015 IEEE International Conference on Smart City/SocialCom/SustainCom (SmartCity), Chengdu, China, 19–21 December 2015; pp. 153–158. [Google Scholar] [CrossRef]
- Ma, X.; Tao, Z.; Wang, Y.; Yu, H.; Wang, Y. Long Short-Term Memory Neural Network for Traffic Speed Prediction Using Remote Microwave Sensor Data. Transp. Res. Part C Emerg. Technol. 2015, 54, 187–197. [Google Scholar] [CrossRef]
- Chen, Y.y.; Lv, Y.; Li, Z.; Wang, F.Y. Long Short-Term Memory Model for Traffic Congestion Prediction with Online Open Data. In Proceedings of the 2016 IEEE 19th International Conference on Intelligent Transportation Systems (ITSC), Rio de Janeiro, Brazil, 1–4 November 2016; pp. 132–137. [Google Scholar]
- Ma, X.; Dai, Z.; He, Z.; Ma, J.; Wang, Y.; Wang, Y. Learning Traffic as Images: A Deep Convolutional Neural Network for Large-Scale Transportation Network Speed Prediction. Sensors 2017, 17, 818. [Google Scholar] [CrossRef]
- Koesdwiady, A.; Soua, R.; Karray, F. Improving Traffic Flow Prediction with Weather Information in Connected Cars: A Deep Learning Approach. IEEE Trans. Veh. Technol. 2016, 65, 9508–9517. [Google Scholar] [CrossRef]
- Soua, R.; Koesdwiady, A.; Karray, F. Big-Data-Generated Traffic Flow Prediction Using Deep Learning and Dempster-Shafer Theory. In Proceedings of the 2016 International Joint Conference on Neural Networks (IJCNN), Vancouver, BC, Canada, 24–29 July 2016; pp. 3195–3202. [Google Scholar] [CrossRef]
- Yildirimoglu, M.; Geroliminis, N. Experienced travel time prediction for congested freeways. Transp. Res. Part B Methodol. 2013, 53, 45–63. [Google Scholar] [CrossRef]
- Lv, L.; Chen, M.; Liu, Y.; Yu, X. A plane moving average algorithm for short-term traffic flow prediction. In Advances in Knowledge Discovery and Data Mining; Springer: Ho Chi Minh City, Vietnam, 2015; pp. 357–369. [Google Scholar]
- Habtemichael, F.G.; Cetin, M. Short-term traffic flow rate forecasting based on identifying similar traffic patterns. Transp. Res. Part C Emerg. Technol. 2016, 66, 61–78. [Google Scholar] [CrossRef]
- Yao, B.; Chen, C.; Cao, Q.; Jin, L.; Zhang, M.; Zhu, H.; Yu, B. Short-Term Traffic Speed Prediction for an Urban Corridor. Comput.-Aided Civ. Infrastruct. Eng. 2017, 32, 154–169. [Google Scholar] [CrossRef]
- Lu, C.; Hirsch, M.; Schölkopf, B. Flexible Spatio-Temporal Networks for Video Prediction. In Proceedings of the IEEE Conference on Computer Vision and Pattern Recognition, Honolulu, HI, USA, 21–26 July 2017; pp. 6523–6531. [Google Scholar]
- Liu, Y.; Yan, X.; Wang, Y.; Yang, Z.; Wu, J. Grid Mapping for Spatial Pattern Analyses of Recurrent Urban Traffic Congestion Based on Taxi GPS Sensing Data. Sustainability 2017, 9, 533. [Google Scholar] [CrossRef]
- Custom Colormaps. Available online: https://github.com/CSlocumWX/custom_colormap (accessed on 9 June 2018).
- Tostes, A.I.J.; de LP Duarte-Figueiredo, F.; Assunção, R.; Salles, J.; Loureiro, A.A. From Data to Knowledge: City-Wide Traffic Flows Analysis and Prediction Using Bing Maps. In Proceedings of the 2nd ACM SIGKDD International Workshop on Urban Computing, Chicago, IL, USA, 11 August 2013; p. 12. [Google Scholar]
- Shi, X.; Chen, Z.; Wang, H.; Yeung, D.Y.; Wong, W.K.; Woo, W.C. Convolutional LSTM Network: A Machine Learning Approach for Precipitation Nowcasting. In Advances in Neural Information Processing Systems; Curran Associates: Montreal, QC, Canada, 2015; pp. 802–810. [Google Scholar]
- Tieleman, T.; Hinton, G. Lecture 6.5-Rmsprop: Divide the Gradient by a Running Average of Its Recent Magnitude. COURSERA Neural Netw. Mach. Learn. 2012, 4, 26–31. [Google Scholar]
- Srivastava, N.; Hinton, G.; Krizhevsky, A.; Sutskever, I.; Salakhutdinov, R. Dropout: A Simple Way to Prevent Neural Networks from Overfitting. J. Mach. Learn. Res. 2014, 15, 1929–1958. [Google Scholar]
- Available online: https://github.com/fchollet/keras (accessed on 22 June 2018).
- Internet Archive Wayback Machine. Available online: https://web.archive.org (accessed on 9 May 2018).


| # | Prediction Horizon Averaged Metric Model Config | 10 min wMSE | MAE | 30 min wMSE | MAE | 60 min wMSE | MAE |
|---|---|---|---|---|---|---|---|
| 1st | 512_384_256_128 | 0.058873 | 0.010635 | 0.054298 | 0.010028 | 0.045638 | 0.009572 |
| 2nd | 640_512_384_256 | 0.058357 | 0.010737 | 0.054314 | 0.010125 | 0.045414 | 0.009245 |
| 3rd | 768_640_512_384 | 0.061818 | 0.012796 | 0.058384 | 0.012838 | 0.049112 | 0.011893 |
| 4th | 896_768_640_512 | 0.069279 | 0.016329 | 0.064761 | 0.016280 | 0.055138 | 0.016076 |
| 5th | 1024_896_768_640 | 0.069227 | 0.016338 | 0.064663 | 0.016229 | 0.054909 | 0.015983 |
| Prediction Horizon Averaged Metric Test Results | 10 min wMSE | MAE | 30 min wMSE | MAE | 60 min wMSE | MAE |
|---|---|---|---|---|---|---|
| t stat | 0.073076 | −0.220181 | −0.002431 | −0.186772 | 0.038266 | 0.734073 |
| p-value | 0.941928 | 0.826291 | 0.998067 | 0.852313 | 0.969571 | 0.465075 |
| Prediction Horizon Averaged Metric Time Lag (minutes) | 10 min wMSE | MAE | 30 min wMSE | MAE | 60 min wMSE | MAE |
|---|---|---|---|---|---|---|
| 110 | 0.058730 | 0.010705 | 0.054224 | 0.010130 | 0.045305 | 0.009293 |
| 120 | 0.058873 | 0.010635 | 0.054298 | 0.010028 | 0.045638 | 0.009572 |
| Layer | Name | Channels | Shape |
|---|---|---|---|
| 0 | Inputs | 1 | (11, 149, 69) |
| 1 | Flattern | 1 | 113,091 |
| 2 | Dense (ReLU) | 1 | 512 |
| 3 | Dense (ReLU) | 1 | 384 |
| 4 | Dense (ReLU) | 1 | 256 |
| 5 | Dense (ReLU) | 1 | 128 |
| 6 | Dense (ReLU) | 1 | 128 |
| 7 | Dense (ReLU) | 1 | 256 |
| 8 | Dense (ReLU) | 1 | 384 |
| 9 | Dense (ReLU) | 1 | 512 |
| 10 | Dense (Sigmoid) | 1 | |
| 11 | Dropout (0.1) | —— | —— |
| 12 | Dense (Sigmoid) | 1 | |
| 13 | Reshape | 1 | (149, 69) |
| 10 min | 30 min | 60 min | ||||||||||||||||
|---|---|---|---|---|---|---|---|---|---|---|---|---|---|---|---|---|---|---|
| MAE | wMSE | MAE | wMSE | MAE | wMSE | |||||||||||||
| Day | SRCN | ConvLSTM | DCPN | SRCN | ConvLSTM | DCPN | SRCN | ConvLSTM | DCPN | SRCN | ConvLSTM | DCPN | SRCN | ConvLSTM | DCPN | SRCN | ConvLSTM | DCPN |
| 2017-01-02 | 0.0097 | 0.0068 | 0.0035 | 0.0017 | 0.0016 | 0.0010 | 0.0083 | 0.0069 | 0.0034 | 0.0014 | 0.0016 | 0.0009 | 0.0104 | 0.0072 | 0.0067 | 0.0037 | 0.0023 | 0.0025 |
| 2017-01-03 | 0.0105 | 0.0125 | 0.0107 | 0.0660 | 0.0651 | 0.0576 | 0.0115 | 0.0124 | 0.0109 | 0.0550 | 0.0590 | 0.0543 | 0.0103 | 0.0120 | 0.0088 | 0.0490 | 0.0500 | 0.0483 |
| 2017-01-04 | 0.0104 | 0.0142 | 0.0115 | 0.0527 | 0.0613 | 0.0504 | 0.0103 | 0.0123 | 0.0104 | 0.0460 | 0.0640 | 0.0471 | 0.0093 | 0.0137 | 0.0088 | 0.0387 | 0.0476 | 0.0382 |
| 2017-01-05 | 0.0103 | 0.0128 | 0.0086 | 0.0422 | 0.0525 | 0.0404 | 0.0112 | 0.0127 | 0.0089 | 0.0388 | 0.0491 | 0.0381 | 0.0110 | 0.0149 | 0.0086 | 0.0329 | 0.0405 | 0.0315 |
| 2017-01-06 | 0.0100 | 0.0116 | 0.0068 | 0.0251 | 0.0341 | 0.0228 | 0.0103 | 0.0111 | 0.0071 | 0.0274 | 0.0385 | 0.0234 | 0.0111 | 0.0131 | 0.0077 | 0.0264 | 0.0258 | 0.0214 |
| 2017-01-09 | 0.0102 | 0.0137 | 0.0101 | 0.0571 | 0.0773 | 0.0557 | 0.0110 | 0.0122 | 0.0085 | 0.0577 | 0.0787 | 0.0531 | 0.0120 | 0.0128 | 0.0093 | 0.0516 | 0.0538 | 0.0447 |
| 2017-01-10 | 0.0110 | 0.0154 | 0.0124 | 0.0927 | 0.1307 | 0.0881 | 0.0158 | 0.0141 | 0.0118 | 0.1051 | 0.1302 | 0.0814 | 0.0127 | 0.0146 | 0.0115 | 0.0917 | 0.1057 | 0.0676 |
| 2017-01-11 | 0.0110 | 0.0143 | 0.0112 | 0.0593 | 0.0765 | 0.0582 | 0.0167 | 0.0121 | 0.0108 | 0.0704 | 0.0795 | 0.0508 | 0.0108 | 0.0138 | 0.0111 | 0.0468 | 0.0534 | 0.0395 |
| 2017-01-12 | 0.0119 | 0.0143 | 0.0127 | 0.0722 | 0.1010 | 0.0725 | 0.0130 | 0.0146 | 0.0124 | 0.0900 | 0.1122 | 0.0724 | 0.0115 | 0.0131 | 0.0117 | 0.0812 | 0.0879 | 0.0683 |
| 2017-01-13 | 0.0121 | 0.0107 | 0.0080 | 0.0337 | 0.0399 | 0.0277 | 0.0100 | 0.0113 | 0.0087 | 0.0364 | 0.0375 | 0.0259 | 0.0103 | 0.0140 | 0.0081 | 0.0385 | 0.0391 | 0.0285 |
| 2017-01-16 | 0.0133 | 0.0104 | 0.0049 | 0.0089 | 0.0075 | 0.0050 | 0.0107 | 0.0093 | 0.0058 | 0.0089 | 0.0064 | 0.0048 | 0.0097 | 0.0122 | 0.0044 | 0.0067 | 0.0087 | 0.0036 |
| 2017-01-17 | 0.0135 | 0.0135 | 0.0120 | 0.0981 | 0.1282 | 0.0951 | 0.0124 | 0.0132 | 0.0118 | 0.1118 | 0.1262 | 0.0912 | 0.0110 | 0.0128 | 0.0106 | 0.0907 | 0.0983 | 0.0752 |
| 2017-01-18 | 0.0127 | 0.0151 | 0.0126 | 0.1089 | 0.1495 | 0.1106 | 0.0132 | 0.0162 | 0.0122 | 0.1318 | 0.1621 | 0.1024 | 0.0134 | 0.0142 | 0.0107 | 0.1169 | 0.1243 | 0.0866 |
| 2017-01-19 | 0.0116 | 0.0127 | 0.0136 | 0.0750 | 0.0965 | 0.0738 | 0.0110 | 0.0132 | 0.0112 | 0.0807 | 0.0943 | 0.0665 | 0.0112 | 0.0124 | 0.0094 | 0.0679 | 0.0755 | 0.0533 |
| 2017-01-20 | 0.0119 | 0.0109 | 0.0088 | 0.0263 | 0.0346 | 0.0255 | 0.0079 | 0.0124 | 0.0083 | 0.0292 | 0.0308 | 0.0257 | 0.0072 | 0.0108 | 0.0085 | 0.0208 | 0.0242 | 0.0179 |
| 2017-01-23 | 0.0119 | 0.0114 | 0.0098 | 0.0391 | 0.0517 | 0.0396 | 0.0094 | 0.0120 | 0.0098 | 0.0455 | 0.0519 | 0.0373 | 0.0079 | 0.0108 | 0.0088 | 0.0314 | 0.0337 | 0.0264 |
| 2017-01-24 | 0.0131 | 0.0153 | 0.0122 | 0.1191 | 0.1780 | 0.1182 | 0.0131 | 0.0146 | 0.0136 | 0.1330 | 0.1735 | 0.1118 | 0.0114 | 0.0141 | 0.0117 | 0.1261 | 0.1262 | 0.0850 |
| 2017-01-25 | 0.0126 | 0.0121 | 0.0114 | 0.0568 | 0.0693 | 0.0563 | 0.0097 | 0.0124 | 0.0123 | 0.0614 | 0.0691 | 0.0546 | 0.0082 | 0.0115 | 0.0092 | 0.0480 | 0.0512 | 0.0397 |
| 2017-01-26 | 0.0124 | 0.0127 | 0.0113 | 0.0642 | 0.0851 | 0.0658 | 0.0100 | 0.0122 | 0.0108 | 0.0697 | 0.0884 | 0.0605 | 0.0093 | 0.0118 | 0.0090 | 0.0578 | 0.0595 | 0.0433 |
| 2017-01-27 | 0.0135 | 0.0100 | 0.0097 | 0.0255 | 0.0264 | 0.0240 | 0.0079 | 0.0099 | 0.0082 | 0.0243 | 0.0300 | 0.0219 | 0.0079 | 0.0105 | 0.0075 | 0.0242 | 0.0253 | 0.0187 |
| 2017-01-30 | 0.0133 | 0.0107 | 0.0099 | 0.0377 | 0.0445 | 0.0363 | 0.0085 | 0.0105 | 0.0094 | 0.0312 | 0.0399 | 0.0310 | 0.0079 | 0.0103 | 0.0073 | 0.0262 | 0.0281 | 0.0224 |
| 2017-01-31 | 0.0128 | 0.0122 | 0.0108 | 0.0560 | 0.0731 | 0.0565 | 0.0093 | 0.0111 | 0.0107 | 0.0598 | 0.0693 | 0.0493 | 0.0073 | 0.0097 | 0.0085 | 0.0450 | 0.0527 | 0.0403 |
| 2017-02-01 | 0.0122 | 0.0118 | 0.0107 | 0.0654 | 0.0838 | 0.0675 | 0.0105 | 0.0116 | 0.0105 | 0.0723 | 0.0901 | 0.0619 | 0.0086 | 0.0109 | 0.0099 | 0.0618 | 0.0685 | 0.0500 |
| 2017-02-02 | 0.0123 | 0.0112 | 0.0105 | 0.0547 | 0.0694 | 0.0564 | 0.0095 | 0.0112 | 0.0105 | 0.0582 | 0.0662 | 0.0518 | 0.0085 | 0.0113 | 0.0093 | 0.0484 | 0.0502 | 0.0408 |
| 2017-02-03 | 0.0116 | 0.0110 | 0.0100 | 0.0539 | 0.0645 | 0.0548 | 0.0095 | 0.0107 | 0.0100 | 0.0550 | 0.0618 | 0.0469 | 0.0084 | 0.0103 | 0.0079 | 0.0401 | 0.0408 | 0.0331 |
| 2017-02-06 | 0.0132 | 0.0093 | 0.0071 | 0.0340 | 0.0185 | 0.0217 | 0.0123 | 0.0095 | 0.0097 | 0.0212 | 0.0189 | 0.0108 | 0.0127 | 0.0134 | 0.0061 | 0.0225 | 0.0308 | 0.0208 |
| 2017-02-07 | 0.0115 | 0.0110 | 0.0105 | 0.0390 | 0.0424 | 0.0380 | 0.0096 | 0.0102 | 0.0079 | 0.0361 | 0.0391 | 0.0324 | 0.0096 | 0.0106 | 0.0074 | 0.0299 | 0.0307 | 0.0245 |
| 2017-02-08 | 0.0129 | 0.0137 | 0.0126 | 0.1159 | 0.1591 | 0.1064 | 0.0121 | 0.0142 | 0.0125 | 0.1313 | 0.1812 | 0.1046 | 0.0113 | 0.0133 | 0.0122 | 0.1333 | 0.1674 | 0.0943 |
| 2017-02-09 | 0.0139 | 0.0150 | 0.0144 | 0.1417 | 0.1955 | 0.1251 | 0.0136 | 0.0157 | 0.0133 | 0.1562 | 0.2183 | 0.1221 | 0.0130 | 0.0139 | 0.0123 | 0.1464 | 0.1698 | 0.1097 |
| 2017-02-10 | 0.0143 | 0.0116 | 0.0114 | 0.0538 | 0.0679 | 0.0522 | 0.0103 | 0.0120 | 0.0105 | 0.0576 | 0.0718 | 0.0488 | 0.0090 | 0.0111 | 0.0101 | 0.0472 | 0.0546 | 0.0411 |
| 2017-02-13 | 0.0142 | 0.0123 | 0.0130 | 0.0722 | 0.1023 | 0.0702 | 0.0110 | 0.0124 | 0.0122 | 0.0809 | 0.0949 | 0.0612 | 0.0095 | 0.0118 | 0.0117 | 0.0694 | 0.0795 | 0.0532 |
| 2017-02-14 | 0.0144 | 0.0126 | 0.0132 | 0.0901 | 0.1123 | 0.0873 | 0.0122 | 0.0133 | 0.0134 | 0.1054 | 0.1381 | 0.0891 | 0.0112 | 0.0120 | 0.0115 | 0.1011 | 0.1137 | 0.0815 |
| 2017-02-15 | 0.0145 | 0.0151 | 0.0130 | 0.1214 | 0.1660 | 0.1173 | 0.0142 | 0.0152 | 0.0124 | 0.1366 | 0.1676 | 0.1099 | 0.0125 | 0.0141 | 0.0120 | 0.1213 | 0.1428 | 0.0943 |
| 2017-02-16 | 0.0142 | 0.0135 | 0.0134 | 0.0817 | 0.1144 | 0.0802 | 0.0118 | 0.0135 | 0.0116 | 0.0888 | 0.1150 | 0.0733 | 0.0100 | 0.0124 | 0.0112 | 0.0783 | 0.0895 | 0.0643 |
| 2017-02-17 | 0.0140 | 0.0105 | 0.0090 | 0.0306 | 0.0360 | 0.0288 | 0.0074 | 0.0101 | 0.0083 | 0.0308 | 0.0340 | 0.0265 | 0.0072 | 0.0100 | 0.0089 | 0.0289 | 0.0301 | 0.0244 |
| 2017-02-20 | 0.0137 | 0.0092 | 0.0060 | 0.0074 | 0.0052 | 0.0034 | 0.0101 | 0.0091 | 0.0049 | 0.0065 | 0.0070 | 0.0041 | 0.0112 | 0.0116 | 0.0060 | 0.0083 | 0.0096 | 0.0048 |
| 2017-02-21 | 0.0123 | 0.0127 | 0.0129 | 0.0716 | 0.1065 | 0.0707 | 0.0101 | 0.0125 | 0.0111 | 0.0769 | 0.1067 | 0.0640 | 0.0090 | 0.0109 | 0.0108 | 0.0630 | 0.0785 | 0.0515 |
| 2017-02-22 | 0.0122 | 0.0115 | 0.0110 | 0.0410 | 0.0472 | 0.0396 | 0.0094 | 0.0113 | 0.0096 | 0.0435 | 0.0519 | 0.0341 | 0.0078 | 0.0107 | 0.0089 | 0.0307 | 0.0363 | 0.0274 |
| 2017-02-23 | 0.0124 | 0.0119 | 0.0105 | 0.0451 | 0.0558 | 0.0443 | 0.0097 | 0.0114 | 0.0094 | 0.0435 | 0.0513 | 0.0365 | 0.0075 | 0.0102 | 0.0082 | 0.0306 | 0.0348 | 0.0269 |
| 2017-02-24 | 0.0121 | 0.0100 | 0.0080 | 0.0274 | 0.0291 | 0.0236 | 0.0081 | 0.0097 | 0.0085 | 0.0249 | 0.0308 | 0.0218 | 0.0075 | 0.0096 | 0.0113 | 0.0195 | 0.0235 | 0.0206 |
| 2017-02-27 | 0.0132 | 0.0154 | 0.0128 | 0.1078 | 0.1547 | 0.1051 | 0.0127 | 0.0166 | 0.0120 | 0.1142 | 0.1672 | 0.0937 | 0.0110 | 0.0134 | 0.0119 | 0.0910 | 0.1231 | 0.0753 |
| 2017-02-28 | 0.0118 | 0.0125 | 0.0117 | 0.0586 | 0.0804 | 0.0576 | 0.0096 | 0.0120 | 0.0113 | 0.0606 | 0.0800 | 0.0522 | 0.0082 | 0.0111 | 0.0118 | 0.0485 | 0.0604 | 0.0427 |
| Average | 0.0124 | 0.0123 | 0.0106 | 0.0603 | 0.0785 | 0.0579 | 0.0108 | 0.0121 | 0.0102 | 0.0647 | 0.0806 | 0.0536 | 0.0099 | 0.0120 | 0.0095 | 0.0558 | 0.0631 | 0.0449 |
| 10 min | |||
| SRCN | ConvLSTM | DCPN | |
| metric description | |||
| total number of epochs to converge | 876 | 719 | 823 |
| total training time (s) | 30,646.517 | 70,125.471 | 21,450.032 |
| 30 min | |||
| SRCN | ConvLSTM | DCPN | |
| metric description | |||
| total number of epochs to converge | 757 | 631 | 845 |
| total training time (s) | 26,572.629 | 61,677.397 | 22,235.832 |
| 60 min | |||
| SRCN | ConvLSTM | DCPN | |
| metric description | |||
| total number of epochs to converge | 769 | 690 | 795 |
| total training time (s) | 27,585.755 | 66,646.381 | 20,299.434 |
© 2019 by the authors. Licensee MDPI, Basel, Switzerland. This article is an open access article distributed under the terms and conditions of the Creative Commons Attribution (CC BY) license (http://creativecommons.org/licenses/by/4.0/).
Share and Cite
Zhang, S.; Yao, Y.; Hu, J.; Zhao, Y.; Li, S.; Hu, J. Deep Autoencoder Neural Networks for Short-Term Traffic Congestion Prediction of Transportation Networks. Sensors 2019, 19, 2229. https://doi.org/10.3390/s19102229
Zhang S, Yao Y, Hu J, Zhao Y, Li S, Hu J. Deep Autoencoder Neural Networks for Short-Term Traffic Congestion Prediction of Transportation Networks. Sensors. 2019; 19(10):2229. https://doi.org/10.3390/s19102229
Chicago/Turabian StyleZhang, Sen, Yong Yao, Jie Hu, Yong Zhao, Shaobo Li, and Jianjun Hu. 2019. "Deep Autoencoder Neural Networks for Short-Term Traffic Congestion Prediction of Transportation Networks" Sensors 19, no. 10: 2229. https://doi.org/10.3390/s19102229
APA StyleZhang, S., Yao, Y., Hu, J., Zhao, Y., Li, S., & Hu, J. (2019). Deep Autoencoder Neural Networks for Short-Term Traffic Congestion Prediction of Transportation Networks. Sensors, 19(10), 2229. https://doi.org/10.3390/s19102229