Denoising Method for Passive Photon Counting Images Based on Block-Matching 3D Filter and Non-Subsampled Contourlet Transform


Abstract
:1. Introduction
2. Overall Framework
3. Methodology
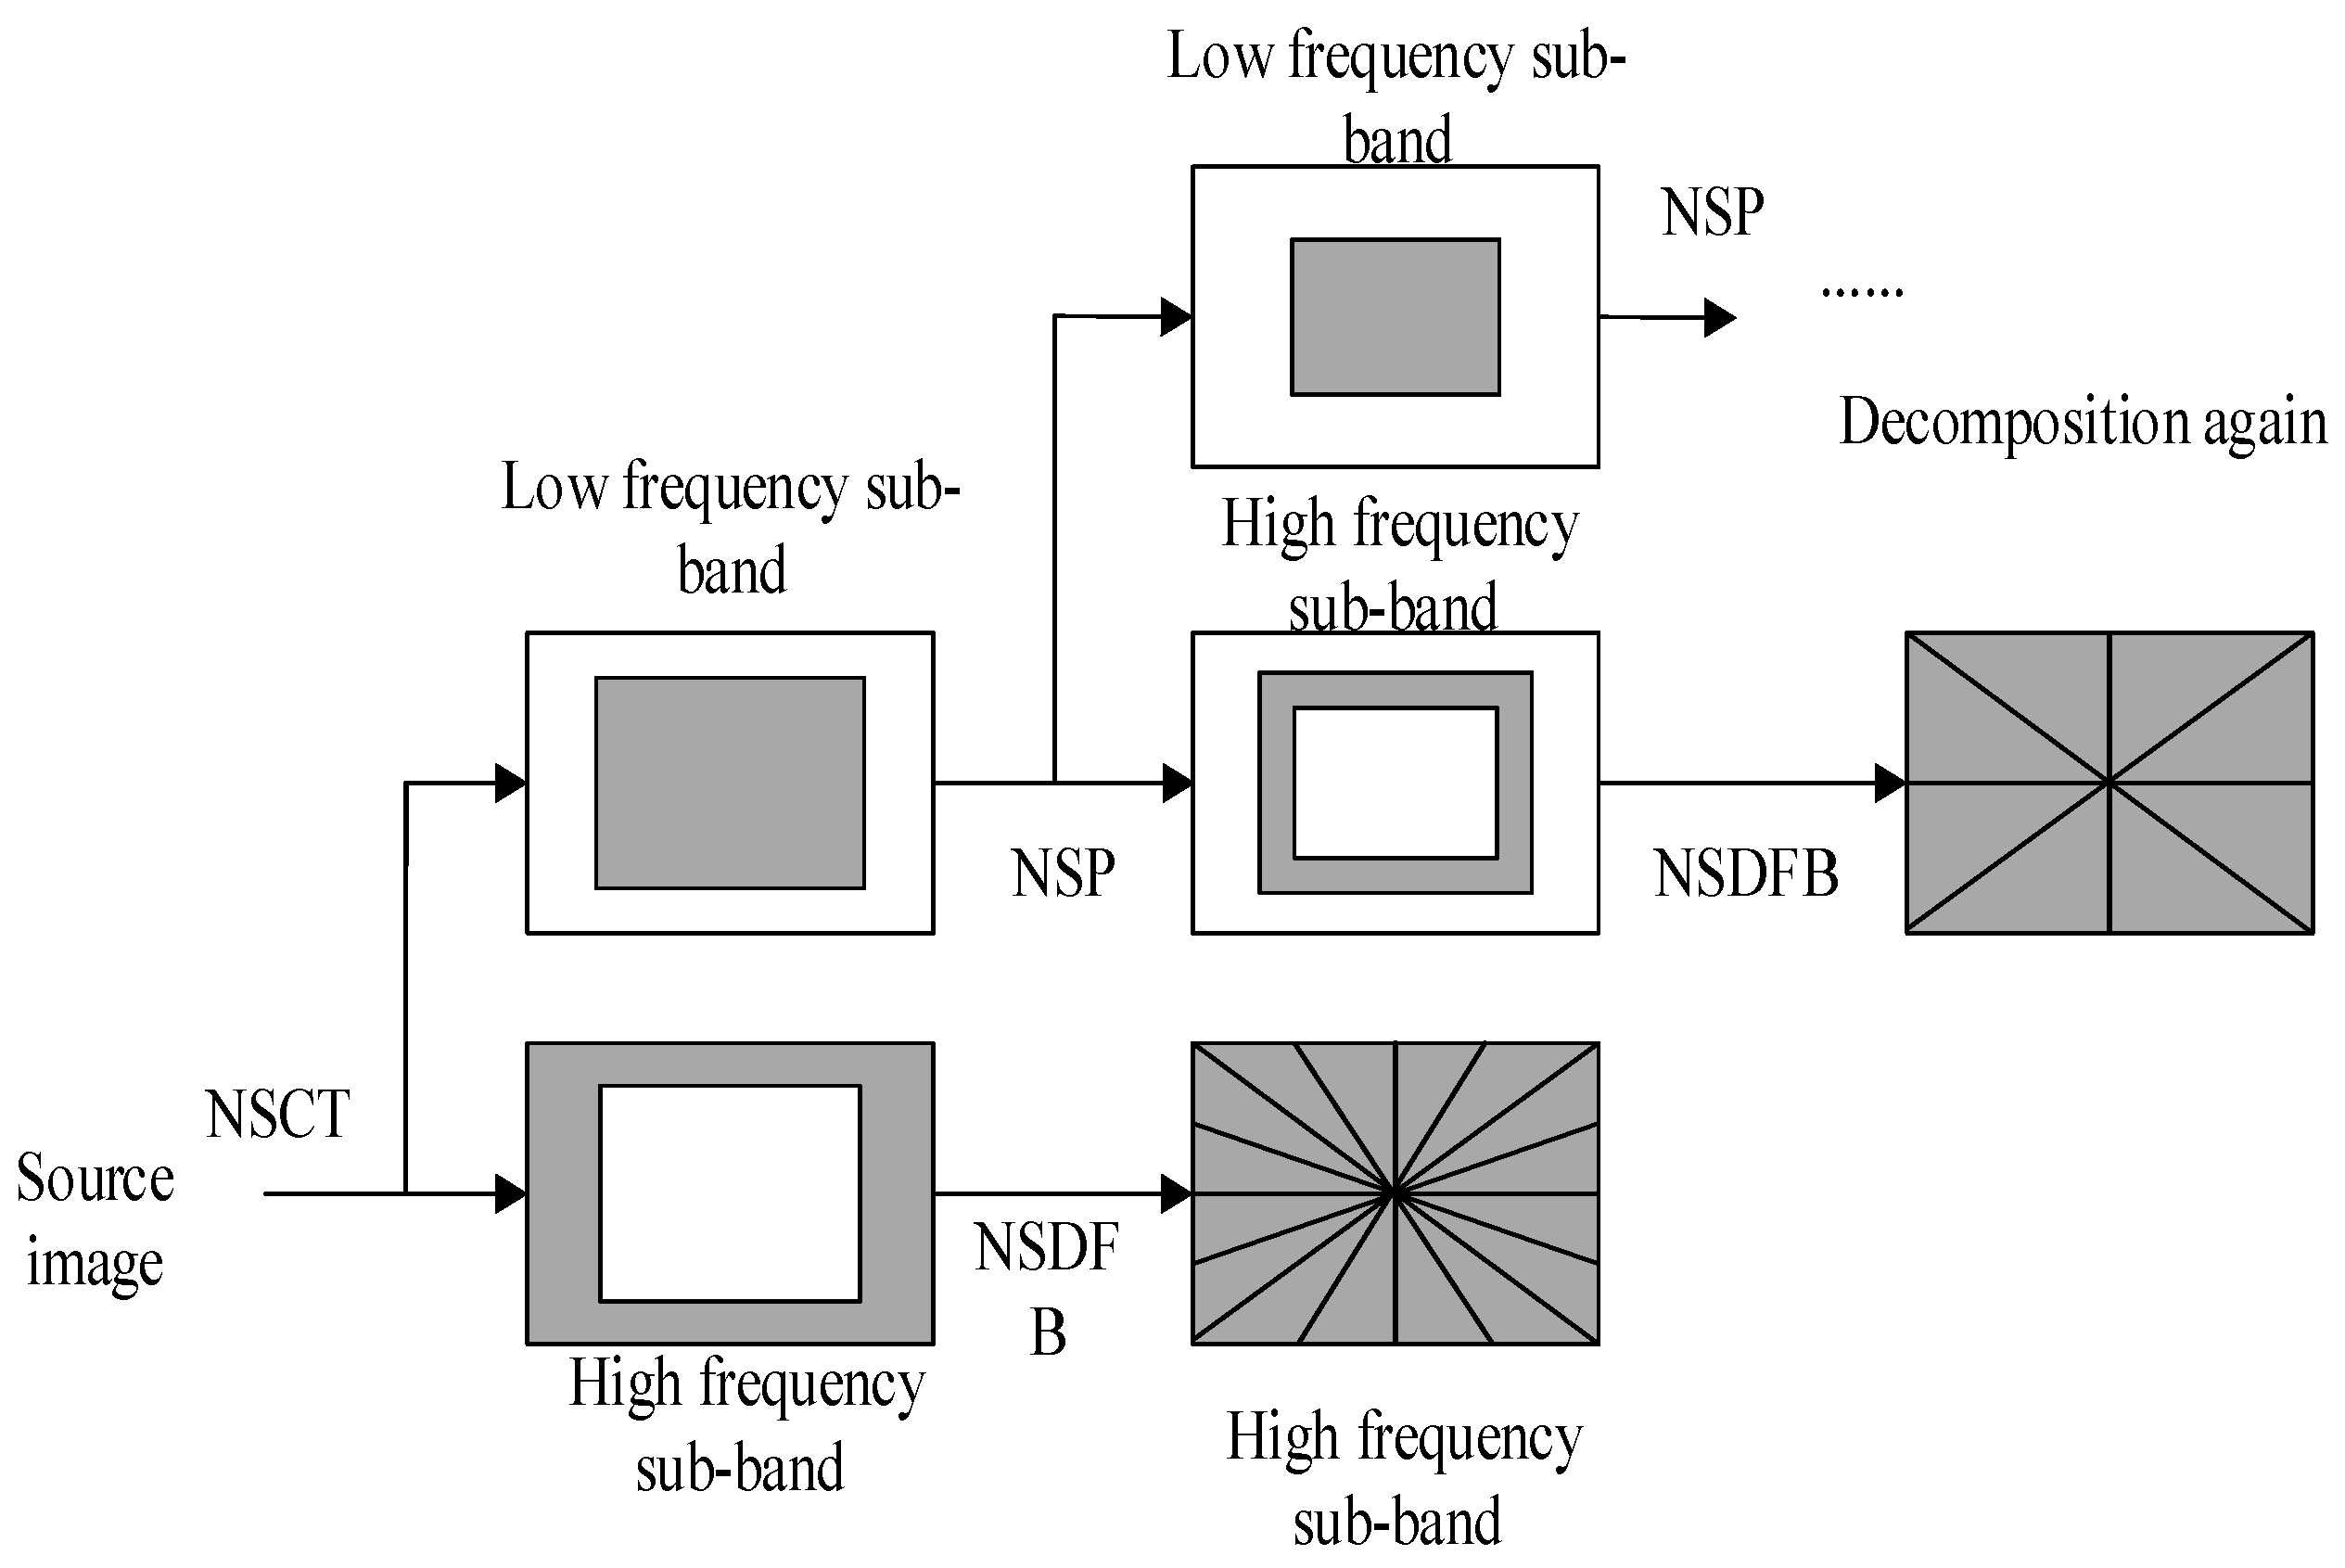
3.1. NSCT
3.2. Determining Sub-Band Coefficients
3.2.1. High-Frequency Sub-Band Coefficients
3.2.2. Low-Frequency Sub-Band Coefficients
3.3. Block-Matching 3D Filter
4. Experimental Introduction
4.1. Experimental Setting
4.2. Experiment Simulation and Analysis
5. Conclusions
Author Contributions
Funding
Conflicts of Interest
Abbreviations
| NSCT | non-subsampled contourlet transform |
| CT | contourlet transform |
| 3L | low light level |
| MPPC | multi-pixel photon counting detector |
| SSR | single-scale retinex |
| APD | avalanche photodiode |
References
- Nakaema, W.M.; Hao, Z.Q.; Rohwetter, P.; Wöste, L.; Stelmaszczyk, K. Pcf-based cavity enhanced spectroscopic sensors for simultaneous multicomponent trace gas analysis. Sensors 2011, 11, 1620–1640. [Google Scholar] [CrossRef]
- Wang, F.; Wang, Y.; Yang, M.; Zhang, X.; Zheng, N. A denoising scheme for randomly clustered noise removal in ICCD sensing Image. Sensors 2017, 17, 233. [Google Scholar] [CrossRef] [PubMed]
- Kim, C.L.; Wang, G.C.; Dolinsky, S. Multi-pixel photon counters for TOF PET detector and its challenges. IEEE Trans. Nucl. Sci. 2009, 56, 2580–2585. [Google Scholar] [CrossRef]
- Orme, D.; Nagai, N.; Minamino, A.; Nakaya, T.; Yokoyama, M.; Nakadaira, T.; Murakami, T.; Tanaka, M.; Retiere, F.; Vacheret, A.; et al. Development of multi-pixel photon counters for T2K long baseline neutrino experiment. In Proceedings of the IEEE Nuclear Science Symposium Conference Record, Dresden, Germany, 19–25 October 2009; pp. 1082–3654. [Google Scholar]
- Gottlich, M.; Garutti, E.; Kozlov, V.; Schultz-Coulon, H.C.; Tadday, A.; Terkulov, A. Application of multi-pixel photon counter to positron emission tomography. In Proceedings of the IEEE Nuclear Science Symposium Conference Record, Dresden, Germany, 19–25 October 2008; pp. 3119–3122. [Google Scholar]
- Retiere, F.; Du, Y.; Foreman, S.; Kitching, P.; Kostin, A.; Lindner, T.; Low, M.; Masliah, P.; Moult, I.; Oser, S.; et al. Characterization of multi -pixel photon counters for T2K near detector. Nucl. Inst. Methods Phys. Res. A 2009, 610, 378–380. [Google Scholar] [CrossRef]
- Henseler, D.; Grazioso, R.; Zhang, N.; Schmand, M. SIPM Performance in PET applications: An experimental and theoretical analysis. In Proceedings of the IEEE Nuclear Science Symposium Conference Record, Orlando, FL, USA, 24 October–1 November 2009; pp. 1941–1948. [Google Scholar]
- Zhang, H.Y.; Zhao, S.; Guo, J.; Wang, T. Analysis of signal to laser heterodyne with weak local oscillator based on multi-pixel photon counter. Chin. J. Lasers 2013, 40, 1–11. [Google Scholar]
- Zhang, J.; Thew, R.; Barreiro, C.; Zbinden, H. Practical fast gate rate InGaAs/InP single-photon avalanche photodiodes. Appl. Phys. Lett. 2009, 95, 1–4. [Google Scholar] [CrossRef]
- Oh, M.S.; Kong, H.J. An improvement on accuracy of laser radar using a Geiger-mode avalanche photodiode by time-of-flight analysis with Poisson statistics. Proc. SPIE Int. Soc. Opt. Eng. 2010, 93, 291–296. [Google Scholar]
- Zhao, S.; Guo, J.; Liu, H.B.; Feng, Q. Application of multi-pixel photon counters to single photon detection. Opt. Precis. Eng. 2011, 18, 973–976. [Google Scholar]
- Tian, Y.Z.; Zhao, S.; Guo, J. Analysis of non-cooperative target photon counting laser ranging. Acta Opt. Sin. 2011, 31, 1–8. [Google Scholar]
- Chang, C. Noise Characteristic of ALGaN Avalanche Photodiodes Measurement and Analysis. Master’s Thesis, Graduate School of Chinese Academy of Science (Shanghai Institute of Technical Physics), Shanghai, China, 2015. [Google Scholar]
- Wang, F. Research on the Measurement and Application of Avalanche Photondiodes Noise. Master’s Thesis, Xi’an University, Xi’an, China, 2011. [Google Scholar]
- Liu, J.Y. Research on Contour Grouping for Low-Light Images. Master’s Thesis, Beijing Jiaotong University, Beijing, China, 2010. [Google Scholar]
- Lou, X.; Jia, Z.; Yang, J.; Kasabov, N. Change detection in SAR images based on the ROF model semi-Implicit denoising method. Sensors 2019, 19, 1170. [Google Scholar] [CrossRef]
- Lefkimmiatis, S.; Papandreou, G.; Maragos, P. Photon-limited image denoising by inference on multiscale models. In Proceedings of the IEEE International Conference on Image Processing, San Diego, CA, USA, 12–15 October 2008; pp. 2332–2335. [Google Scholar]
- Ye, H.J.; Bao, C.; Liu, H.F. A denoising technique for ultraweak photon images using cross-validation. Acta Opt. Sin. 2003, 32, 179–181. [Google Scholar]
- Goy, A.; Arthur, K.; Li, S.; Barbastathis, G. Low photon count phase retrieval using deep learning. Phys. Rev. Lett. 2018, 121, 1–8. [Google Scholar] [CrossRef]
- Chen, D.; Chu, X.; Ma, F.; Teng, X. A variational approach for adaptive underwater sonar image denoising. In Proceedings of the 2017 4th International Conference on Transportation Information and Safety (ICTIS), Banff, AB, Canada, 8–10 August 2017; pp. 1177–1181. [Google Scholar]
- Xu, T.F.; Su, C.; Luo, X.; Bian, X. Underwater range-gated image denoising based on gradient and wavelet transform. Chin. Opt. 2016, 9, 302–311. [Google Scholar]
- Song, M.Z.; Qu, H.S.; Zhang, G.X.; Tao, S.P.; Jin, G. Low-illumination image denoising method for wide-area search of nighttime sea surface. Optoelectron. Lett. 2018, 14, 226–231. [Google Scholar] [CrossRef]
- Coupé, P.; Hellier, P.; Kervrann, C.; Barillot, C. Nonlocal means-based speckle filtering for ultrasound images. IEEE Trans. Image Process. 2009, 18, 2221–2229. [Google Scholar] [CrossRef] [PubMed]
- Kwan, C.; Zhou, J. Method for Image Denoising. U.S. Patent No. US9159121B2, 13 October 2015. [Google Scholar]
- Eslami, R.; Radha, H. Translation-invariant contourlet transform and its application to image denoising. IEEE Trans. Image Process. 2006, 15, 3362–3374. [Google Scholar] [CrossRef]
- Candes, E.J.; Donoho, D.L. Ridgelets: The key to high-dimensional intermittency. Philos. Trans. R. Soc. Lond. A 1999, 357, 2495–2509. [Google Scholar] [CrossRef]
- Cunha, A.L.; Do, M.N.; Zhou, J.P. The nonsubsampled contourlet transform: Theory, design and application. IEEE Trans. Image Process. 2005, 15, 3089–3101. [Google Scholar] [CrossRef]
- Jian, J.; Jiao, L.C.; Xiang, H.L. Using bivariate threshold function for image denoising in NSCT domain. J. Electron. Inf. Technol. 2009, 31, 532–536. [Google Scholar]
- Yin, M.; Liu, W. Image denoising using mixed statistical model in nonsubsampled contourlet transform domain. Acta Photonica Sin. 2012, 41, 752–756. [Google Scholar]
- Sadreazami, H.; Ahmad, M.O.; Swamy, M.N.S. A study on image denoising in contourlet domain using the alpha-stable family of distributions. Signal Process. 2016, 128, 459–473. [Google Scholar] [CrossRef]
- Wang, J.; Lai, S.Y; Li, M.D. Improved image fusion method based on NSCT and accelerated NMF. Sensors 2012, 12, 5872–5887. [Google Scholar] [CrossRef]
- Yang, D.S; Hu, S.H; Liu, S.; Ma, X.; Su, Y. Multi-focus image fusion based on block matching in 3D transform domain. J. Syst. Eng. Electron. 2018, 29, 415–428. [Google Scholar] [CrossRef]
- Jang, J.H.; Bae, Y.; Ra, J.B. Contrast-enhancement fusion of multi-sensor images using sub-band decomposed multiscale retinex. IEEE Trans. Image Process. 2012, 21, 3479–3490. [Google Scholar] [CrossRef]
- Liu, H.B.; Tang, Q.F; Yang, J. Application of improved histogram equalization and retinex algorithm in gray image enhancement. Chin. J. Quantum Electron. 2014, 31, 526–532. [Google Scholar]
- Shin, K.; Park, Y.; Nguyen, D.; Park, K. Finger-Vein image enhancement using a fuzzy-based fusion method with gabor and retinex filtering. Sensors 2014, 14, 3095–3129. [Google Scholar] [CrossRef]
- Land, E.H. An alternative technique for the computation of the designator in the retinex theory of color vision. Proc. Natl. Acad. Sci. USA 1986, 83, 3078–3080. [Google Scholar] [CrossRef]
- Obson, D.J.; Rahman, Z.; Woodell, G.A. Properties and performance of a center/surround retinex. IEEE Trans. Image Process. A 1997, 6, 451–462. [Google Scholar] [CrossRef]
- Rahman, Z.U.; Jobson, D.J.; Woodell, G.A. Multi-scale retinex for color image enhancement. In Proceedings of the 3rd IEEE International Conference on Image Processing, Lausanne, Switzerland, 19 September 1996; pp. 1003–1006. [Google Scholar]
- Dabov, K.; Foi, A.; Katkovnik, V.; Egiazarian, K. Image denoising by sparse 3D transform-domain collaborative filtering. IEEE Trans. Image Process. 2007, 16, 2080–2095. [Google Scholar] [CrossRef]
- Lebrun, M. An analysis and implementation of the BM3D image denoising method. Image Process. Line 2012, 2, 175–213. [Google Scholar] [CrossRef]
- Ling, X.L.; Feng, X.C. Image denoising by mixing wavelet transformation with sparse 3D collaborative filtering. Comput. Eng. Appl. 2010, 46, 185–187. [Google Scholar]
- Kwan, C.; Budavari, B.; Bovik, A.C.; Marchisio, G. Blind quality assessment of fused worldview-3 images by using the combinations of pansharpening and hypersharpening paradigms. IEEE Geosci. Remote Sens. Lett. 2017, 14, 1–5. [Google Scholar] [CrossRef]
- Mittal, A.; Soundararajan, R.; Bovik, A.C. Making a completely blind image quality analyzer. IEEE Signal Process. Lett. 2013, 20, 209–212. [Google Scholar] [CrossRef]
- Mittal, A.; Moorthy, A.K.; Bovik, A.C. No-reference image quality assessment in the spatial domain. IEEE Trans. Image Process. 2012, 21, 4695–4708. [Google Scholar] [CrossRef]


| Parameter | Setting |
|---|---|
| Tower decomposition | “maxflat” |
| Directional filter bank | “dmaxflat” |
| Decomposition layers | 3 |
| Choice of direction number in high-frequency Case | 4, 8, 16 |
| Photon Counting Image (Figure 7) | The Comparison of Different Algorithms | ||||
|---|---|---|---|---|---|
| Objective criteria | WA | WA-FICA | NSCT | BM3D | Proposed method |
| Information entropy | 7.4156 | 7.3231 | 7.7722 | 7.8351 | 7.9878 |
| NIQE (Figure 7b: 9.7321) | 10.6395 | 11.2090 | 11.2686 | 10.1233 | 9.6569 |
| BRISQUE (Figure 7b: 72.9922) | 74.7423 | 77.0459 | 77.3150 | 73.4175 | 71.3675 |
| Photon Counting Image (Figure 8) | The Comparison of Different Algorithms | ||||
|---|---|---|---|---|---|
| Objective criteria | WA | WA-FICA | NSCT | BM3D | Proposed method |
| Information entropy | 7.7314 | 7.6729 | 7.8332 | 7.8609 | 7.8758 |
| NIQE (Figure 8b: 11.2209) | 11.3358 | 12.0218 | 11.6670 | 11.1077 | 10.6329 |
| BRISQUE (Figure 8b: 78.9403) | 83.2024 | 81.6526 | 81.7108 | 77.9424 | 73.1561 |
© 2019 by the authors. Licensee MDPI, Basel, Switzerland. This article is an open access article distributed under the terms and conditions of the Creative Commons Attribution (CC BY) license (http://creativecommons.org/licenses/by/4.0/).
Share and Cite
Wang, X.; Yin, L.; Gao, M.; Wang, Z.; Shen, J.; Zou, G. Denoising Method for Passive Photon Counting Images Based on Block-Matching 3D Filter and Non-Subsampled Contourlet Transform. Sensors 2019, 19, 2462. https://doi.org/10.3390/s19112462
Wang X, Yin L, Gao M, Wang Z, Shen J, Zou G. Denoising Method for Passive Photon Counting Images Based on Block-Matching 3D Filter and Non-Subsampled Contourlet Transform. Sensors. 2019; 19(11):2462. https://doi.org/10.3390/s19112462
Chicago/Turabian StyleWang, Xuan, Liju Yin, Mingliang Gao, Zhenzhou Wang, Jin Shen, and Guofeng Zou. 2019. "Denoising Method for Passive Photon Counting Images Based on Block-Matching 3D Filter and Non-Subsampled Contourlet Transform" Sensors 19, no. 11: 2462. https://doi.org/10.3390/s19112462
APA StyleWang, X., Yin, L., Gao, M., Wang, Z., Shen, J., & Zou, G. (2019). Denoising Method for Passive Photon Counting Images Based on Block-Matching 3D Filter and Non-Subsampled Contourlet Transform. Sensors, 19(11), 2462. https://doi.org/10.3390/s19112462