Article

Research on the Frequency-Dependent Halfwave Voltage of a Multifunction Integrated Optical Chip in an Interferometric Fiber Optic Gyroscope

1
State Key Laboratory of Modern Optical Instrumentation, Zhejiang University, No. 38 Zheda Road, Hangzhou 310027, China
2
State Grid Zhejiang Electric Power Research Institute, Hangzhou 310014, China
*
Author to whom correspondence should be addressed.
Sensors 2019, 19(13), 2851; https://doi.org/10.3390/s19132851
Submission received: 28 May 2019 / Revised: 16 June 2019 / Accepted: 19 June 2019 / Published: 27 June 2019
(This article belongs to the Section Optical Sensors)

Abstract

:
The multifunction integrated optical chip (MIOC) is one of the most critical parts of the interferometric fiber optic gyroscope (IFOG), and research on the halfwave voltage of the MIOC is meaningful for a high-precision IFOG. In this paper, the correlation between the frequency and halfwave voltage, which affects the interference light intensity of IFOG, is presented theoretically. A widespread measurement method for frequency dependence of the halfwave voltage, based on lock-in amplification and sinusoidal modulation, is proposed. Further, the measurement result and the oscillation of interference light intensity in the Sagnac interferometer are presented, which are in great agreement with the theory. This paper proposes the frequency dependence of the halfwave voltage and provides a new error research direction for the improvement of the MIOC in a high-precision IFOG.

1. Introduction

The interferometric fiber optic gyroscope (IFOG) is a rotation sensor based on the optical common path interferometer, which is widely applied in navigation and positioning [1,2]. According to application requirements, such as a long-haul time, high precision is one of the main directions for the development of the IFOG in the future.
The multifunction integrated optical chip (MIOC) is the crucial component in the IFOG, which acts as a beam split/combination, a light polarizer, and a reciprocal phase modulator [1]. The optical polarization error and phase error of the MIOC place a non-ignorable restriction on the precision of the IFOG. Thereby, the study of the MIOC could lead to significant improvement in the IFOG accuracy characteristics.
Common characteristics of the MIOC, such as insertion loss [3], the polarization extinction ratio [4], residual intensity modulation [5], etc., have been studied in detail. However, research on the MIOC response error is still preliminary, such as phase drift [6], center wavelength stability [7], etc. Considering the voltage-phase conversion, some reports have focused on the halfwave voltage, especially a lower working voltage [8,9], temperature fluctuation [10,11,12], and wavelength correlation [12]. For example, Ran Ding et al. reported a sub-1 V halfwave voltage by a better radio frequency design and more active polymer doping [8]. Xianhui Mao et al. presented a halfwave voltage reduction when the temperature was increased [10]. Additionally, Fuling Yang et al. described the positive correlation between the halfwave voltage and wavelength [12]. However, as far as we know, there are no published works focused on the frequency dependence of halfwave voltage, due to nonlinear effects and structural resonance.
Herein, the frequency-dependent halfwave voltage and its specific effect on the IFOG is studied. Section 2 analyzes the origin of frequency dependence of the halfwave voltage and the oscillation of interference light intensity theoretically. In Section 3, a measurement method for frequency dependence of the halfwave voltage is proposed and the measurement result shows a great agreement with the theory. Section 4 is the discussion on the experimental results. Section 5 presents the conclusion, followed by the acknowledgments.

2. Theory and Simulation

2.1. Origin

The voltage-phase conversion of the MIOC is based on the electro-optical (EO) effects of LiNbO3, of which the Pockels effect is the most widely studied. However, in the high-precision IFOG, the additional EO effects will cause the distortion of electro-optic conversion.
Herein, the EO effect in the MIOC is considered as a combination of the following three effects: (1) The intrinsic EO effect, (2) the change of light path due to piezoelectric displacement, and (3) the photo-elastic effect due to the piezoelectric strain. Further, the optical retardation caused by the effects above can be defined as [13,14]
R 1 = π n e 3 γ c E l λ R 2 = 2 π Δ n λ Δ l R 3 = π n e 3 l λ i , j , k , l p i , j , k , l S k , l
where ne is the extraordinary refractive index; γc is the intrinsic EO coefficient; E is the E-field intensity; l is the light pass length; λ is the wavelength; Δn is the initial birefringence independent of the E-field; Δl is the change of light path length; and pi,j,k,l and Sk,l are the photo-elastic coefficient and elastic strain, respectively.
Considering these effects, the equivalent EO coefficient can be expressed as [13,14]
γ c I I = λ π n e 3 E l [ π n e 3 γ c λ E l + 2 π Δ n λ Δ l ( f ) + π n e 3 l λ i , j , k , l p i , j , k , l S k , l ( f ) ] ,
where Δl and Sk,l are considered a function of frequency.
In order to better match the reality, a phase-lag between the E-field and piezoelectric displacement is introduced, and the overall EO coefficient is represented by [13,14]
γ c I I I = λ π n e 3 E l [ R 1 + ( R 2 + R 3 ) cos δ ] 2 + [ ( R 2 + R 3 ) sin δ ] 2 ,
where δ is the phase-lag.
In Reference [13], the piezoelectric displacement and its phase-lag to the E-field were measured, as illustrated in Figure 1a. Figure 1b shows the EO coefficient calculated by Equation (3) and the experimentally observed data, which presents the consistency between the simulation and measurement [13].
In terms of the MIOC, the halfwave voltage, and the key parameter during voltage-phase converting, can be expressed as [15]
V π = G λ 2 π n e 3 γ c I I I Γ L ,
where γ c I I I is the overall EO coefficient, G is the one-arm two-electrode spacing in the MIOC, and Γ is the overlap factor between the electric field and the light field, L is the length of modulation electrode.
Further, the frequency dependence of γ c I I I , G, and L results in the differences of the halfwave voltage at different frequencies. The halfwave voltage frequency dependence can be represented by
V π ( ω ) = V π s [ 1 σ ( ω ) ] ,
where Vπs is the reference halfwave voltage, σ(ω) is the deviation ratio at different frequencies and can be expressed as
σ ( ω ) = 1 G ( ω ) / G 0 γ c I I I ( ω ) / γ c 0 I I I * L ( ω ) / L 0 ,
where γ c I I I ( ω ) , G(ω), and L(ω) are the overall EO coefficient, one-arm two electrode spacing, and the length of modulation electrode at frequency ω; γ c 0 I I I , G0, and L0 are the corresponding reference value.
Reference [13] is based on the LiNbO3 crystal, and the results in Figure 1a were measured by a laser doppler vibrometer connected to a lock-in amplifier. However, the actual MIOC structure is intricate and has many constraints, and the halfwave voltage frequency dependence is too complicated to be measured from the structural deformation. The measurement in Reference [13] cannot be used for MIOC devices. Thereby, a feasible method for the frequency dependence of the MIOC halfwave voltage, especially MIOC devices, hasn’t been proposed.

2.2. Effect on Interference Light Intensity
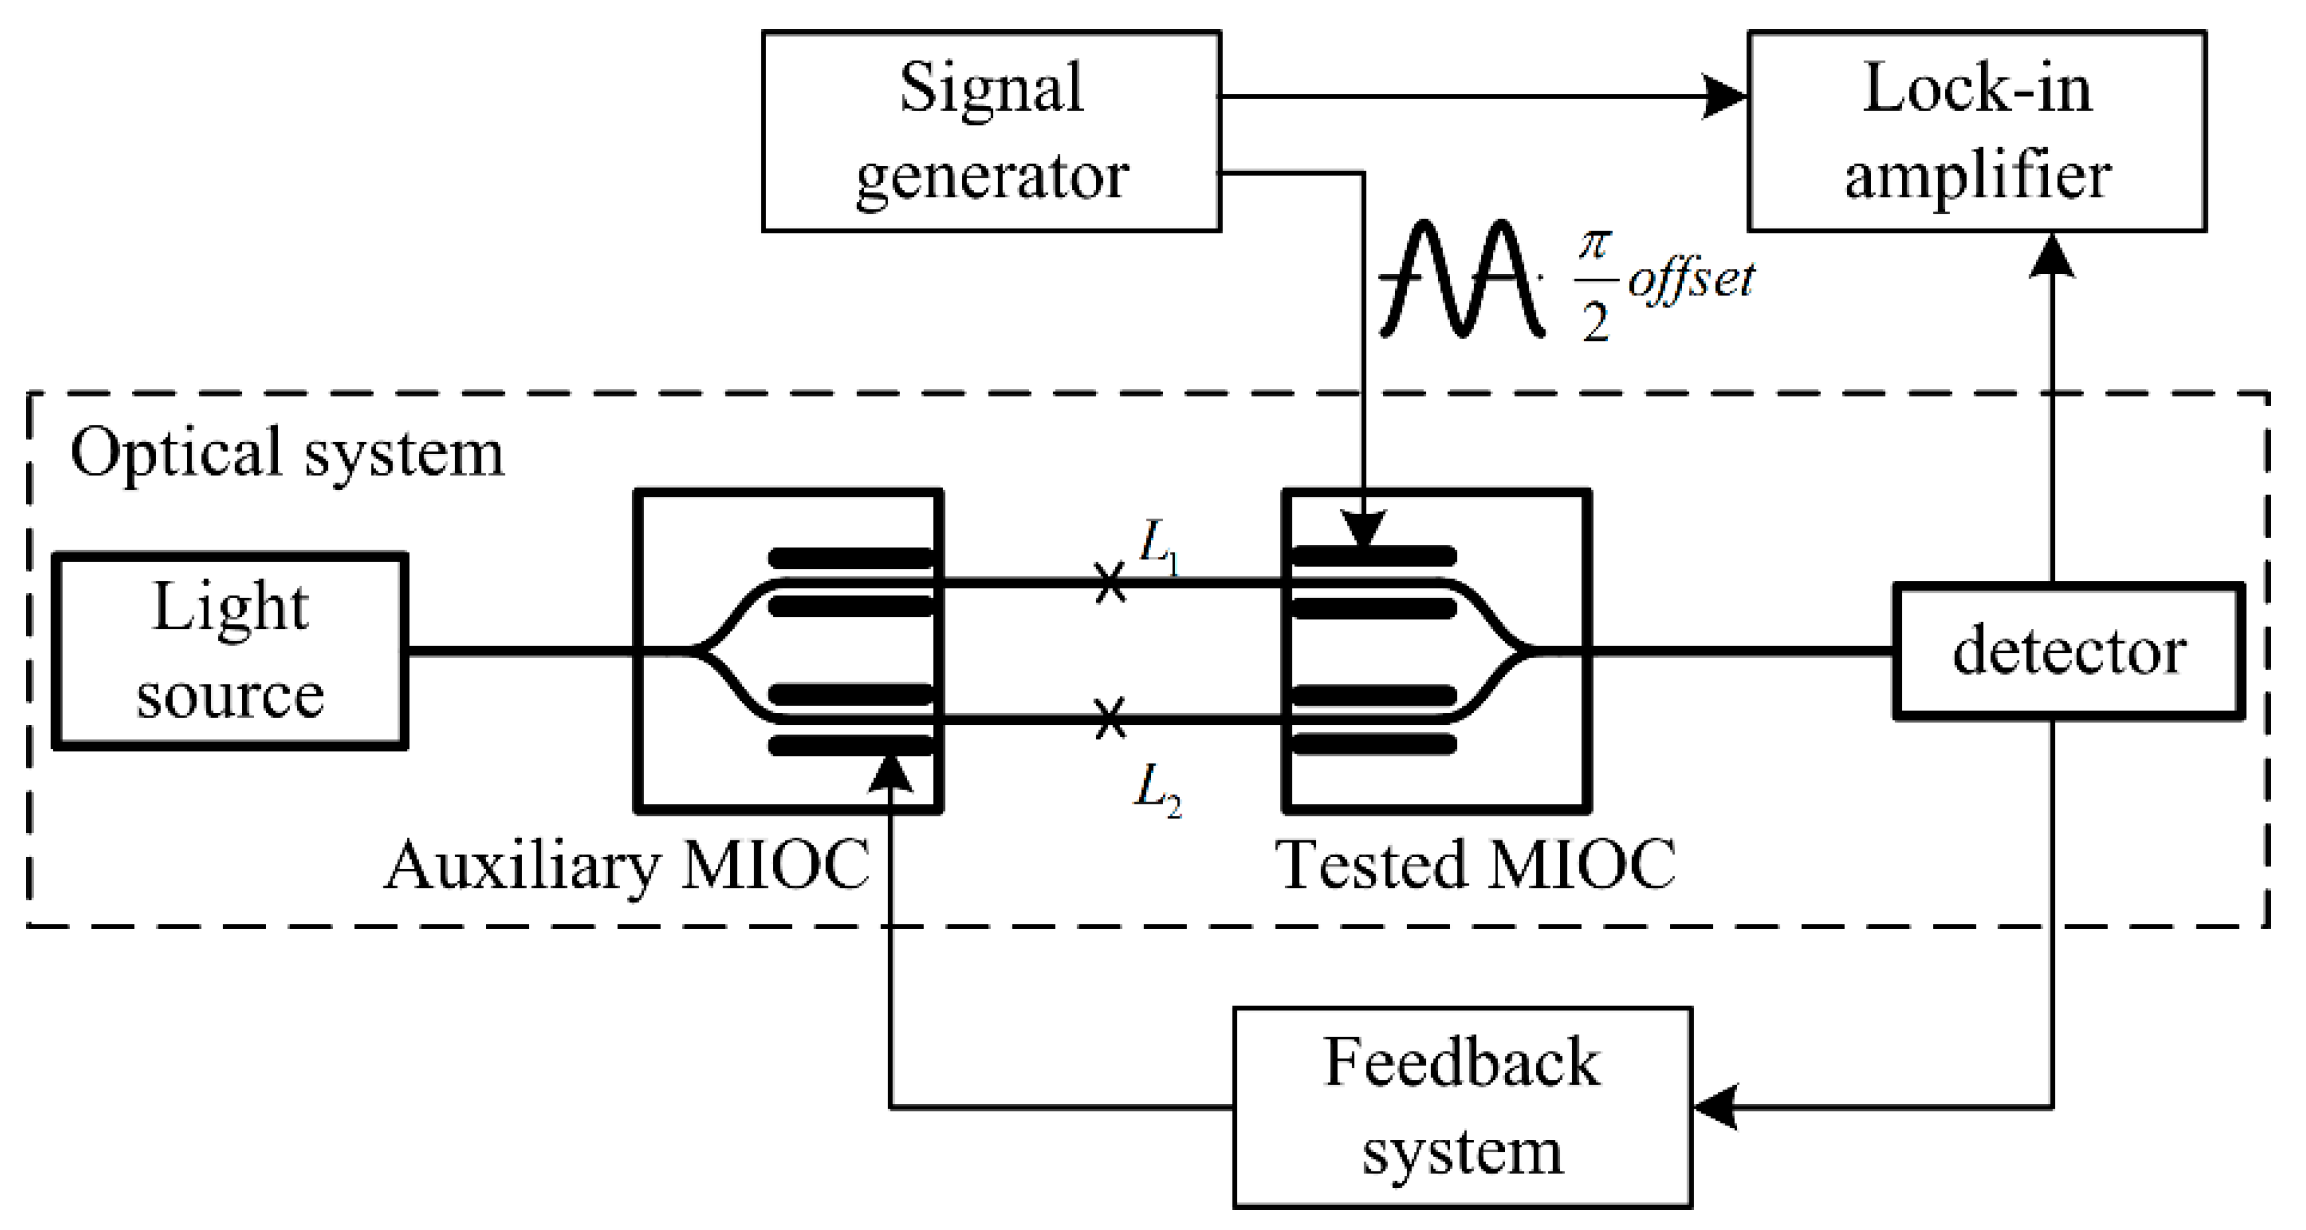
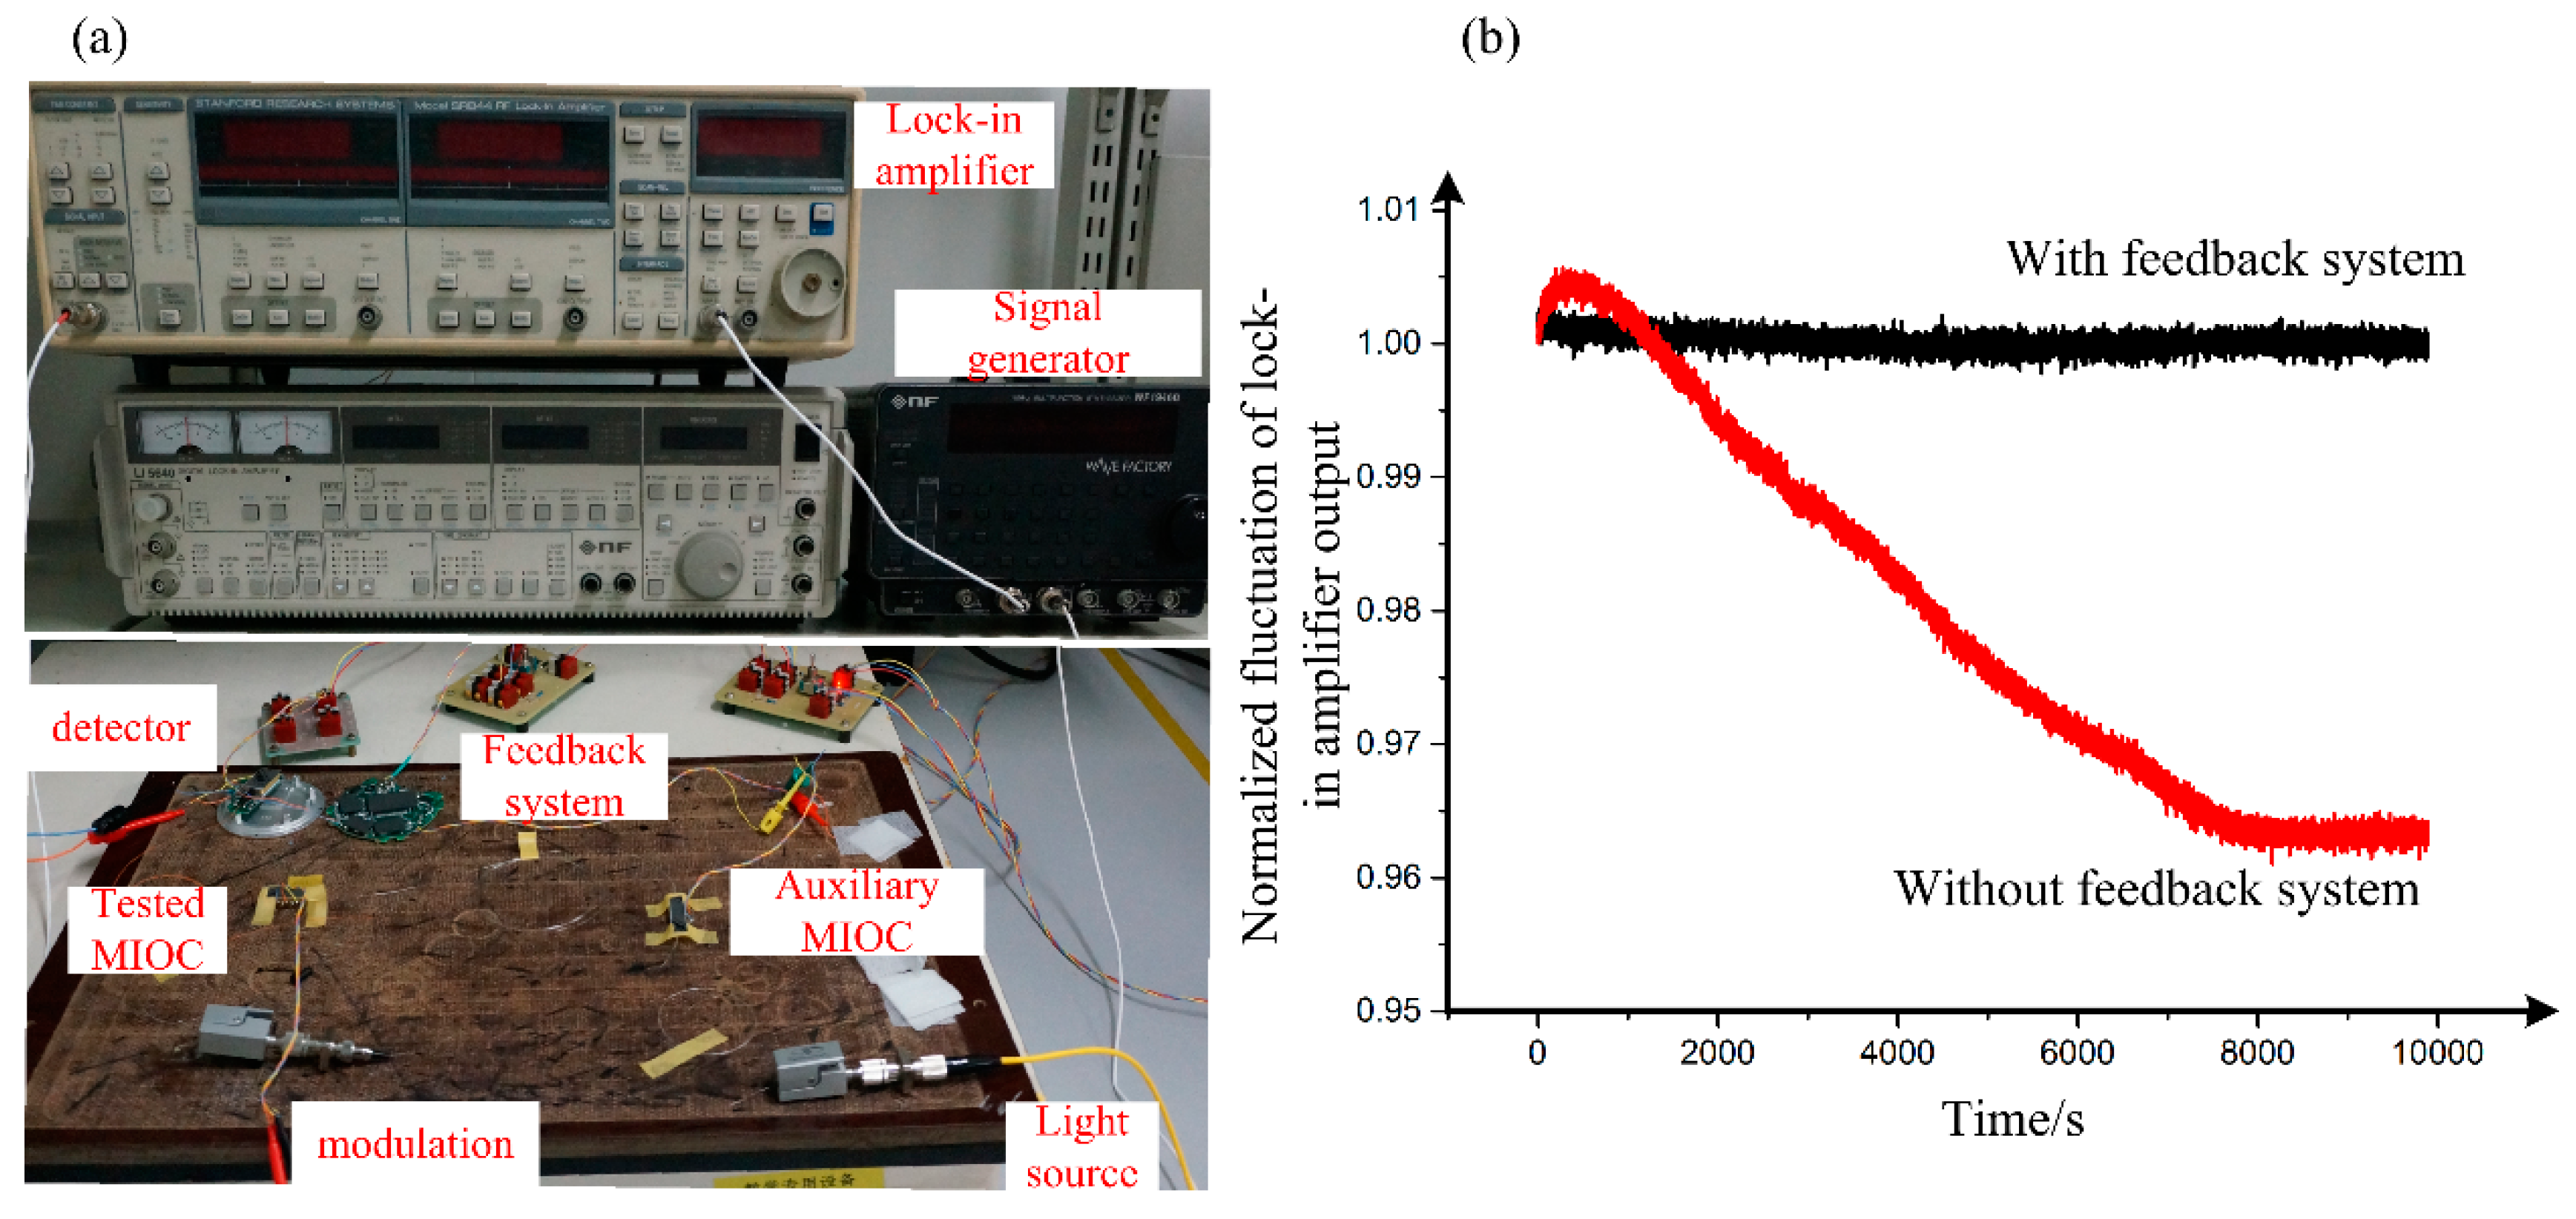
In the IFOG, the square wave modulation is one of the most commonly used modulation schemes, and the modulation waveform can be expressed as [1]
U b ( t ) = { U 0 2 0 t < τ U 0 2 τ t < 2 τ ,
where τ is the transit time when the light wave propagates along the fiber ring, and U0 is the amplitude of the modulation wave.
After the Fourier transform, the square wave can be represented by a superposition of multiple sinusoidal signals whose frequencies are odd multiples of the fundamental frequency, which can be expressed as
U b ( t ) = 2 U 0 π i = 1 1 2 i 1 sin [ ( 2 i 1 ) ω 0 t ] ,
where i is a positive integer.
Due to the time delay difference modulation and interference response principle in the IFOG, the interference intensity can be expressed as
I = I 0 { 1 + cos [ Δ ϕ R + 2 U b ( t ) * π V π ( ω ) ] } = I 0 { 1 + cos { Δ ϕ R + 4 U 0 i = 1 sin [ ( 2 i 1 ) ω 0 t ] ( 2 i 1 ) * V π [ ( 2 i 1 ) ω 0 ] } } = I 0 { 1 + cos { Δ ϕ R + ϕ B 4 U 0 i = 1 sin [ ( 2 i 1 ) ω 0 t ] 2 i 1 σ [ ( 2 i 1 ) ω 0 ] V π [ ( 2 i 1 ) ω 0 ] } } I 0 + I 0 cos ( Δ ϕ R + ϕ B ) I 0 sin ( Δ ϕ R + ϕ B ) i = 1 4 σ [ ( 2 i 1 ) ω 0 ] U 0 ( 2 i 1 ) V π s sin [ ( 2 i 1 ) ω 0 t ]
where Vπ(ω) and σ(ω) are the halfwave voltage and its deviation ratio when the modulation frequency is ω, respectively; I0 is the light source intensity; ΔϕR is the Sagnac phase; and ϕB is the ideal modulation phase, which is
ϕ B = ± π U 0 V π s .
The first two terms of Equation (9) are a theoretical interference expression when Vπ is not a function of frequency, and the remaining one is the “oscillation” in the interference light intensity, whose frequencies are the odd multiple of the modulation fundamental frequency. Considering the linear superposition in Equation (9), the total oscillation is the sum of oscillation at different frequencies. By randomly selecting one frequency term, the interference oscillation can be presented as
I o s c , m = I 0 sin ( Δ ϕ R + ϕ B ) 4 σ [ ( 2 m 1 ) ω 0 ] U 0 ( 2 m 1 ) V π s sin [ ( 2 m 1 ) ω 0 t ] ,
where (2m − 1)ω0 is the selected oscillation frequency and Iosc,m is the oscillation at (2m − 1)ω0 frequency.
When considering one frequency, from Equation (11), the oscillation amplitude is related to the halfwave voltage deviation ratio and modulation voltage amplitude. For a MIOC device, the frequency dependence of the halfwave voltage is fixed in a stable environment, which means σ(ω) is fixed. Thereby, the peak-to-peak value of interference oscillation is a function of modulation voltage, which can be expressed as
I p p = | I 0 8 σ [ ( 2 m 1 ) ω 0 ] U 0 ( 2 m 1 ) V π s sin ( Δ ϕ R + U 0 π V π s ) | .
Considering the linear superposition in Equation (9), when the modulation amplitude is an integer multiple of Vπs, the total interference oscillation is eliminated, but the sensitivity of the IFOG is also suppressed [1].

3. Experiment

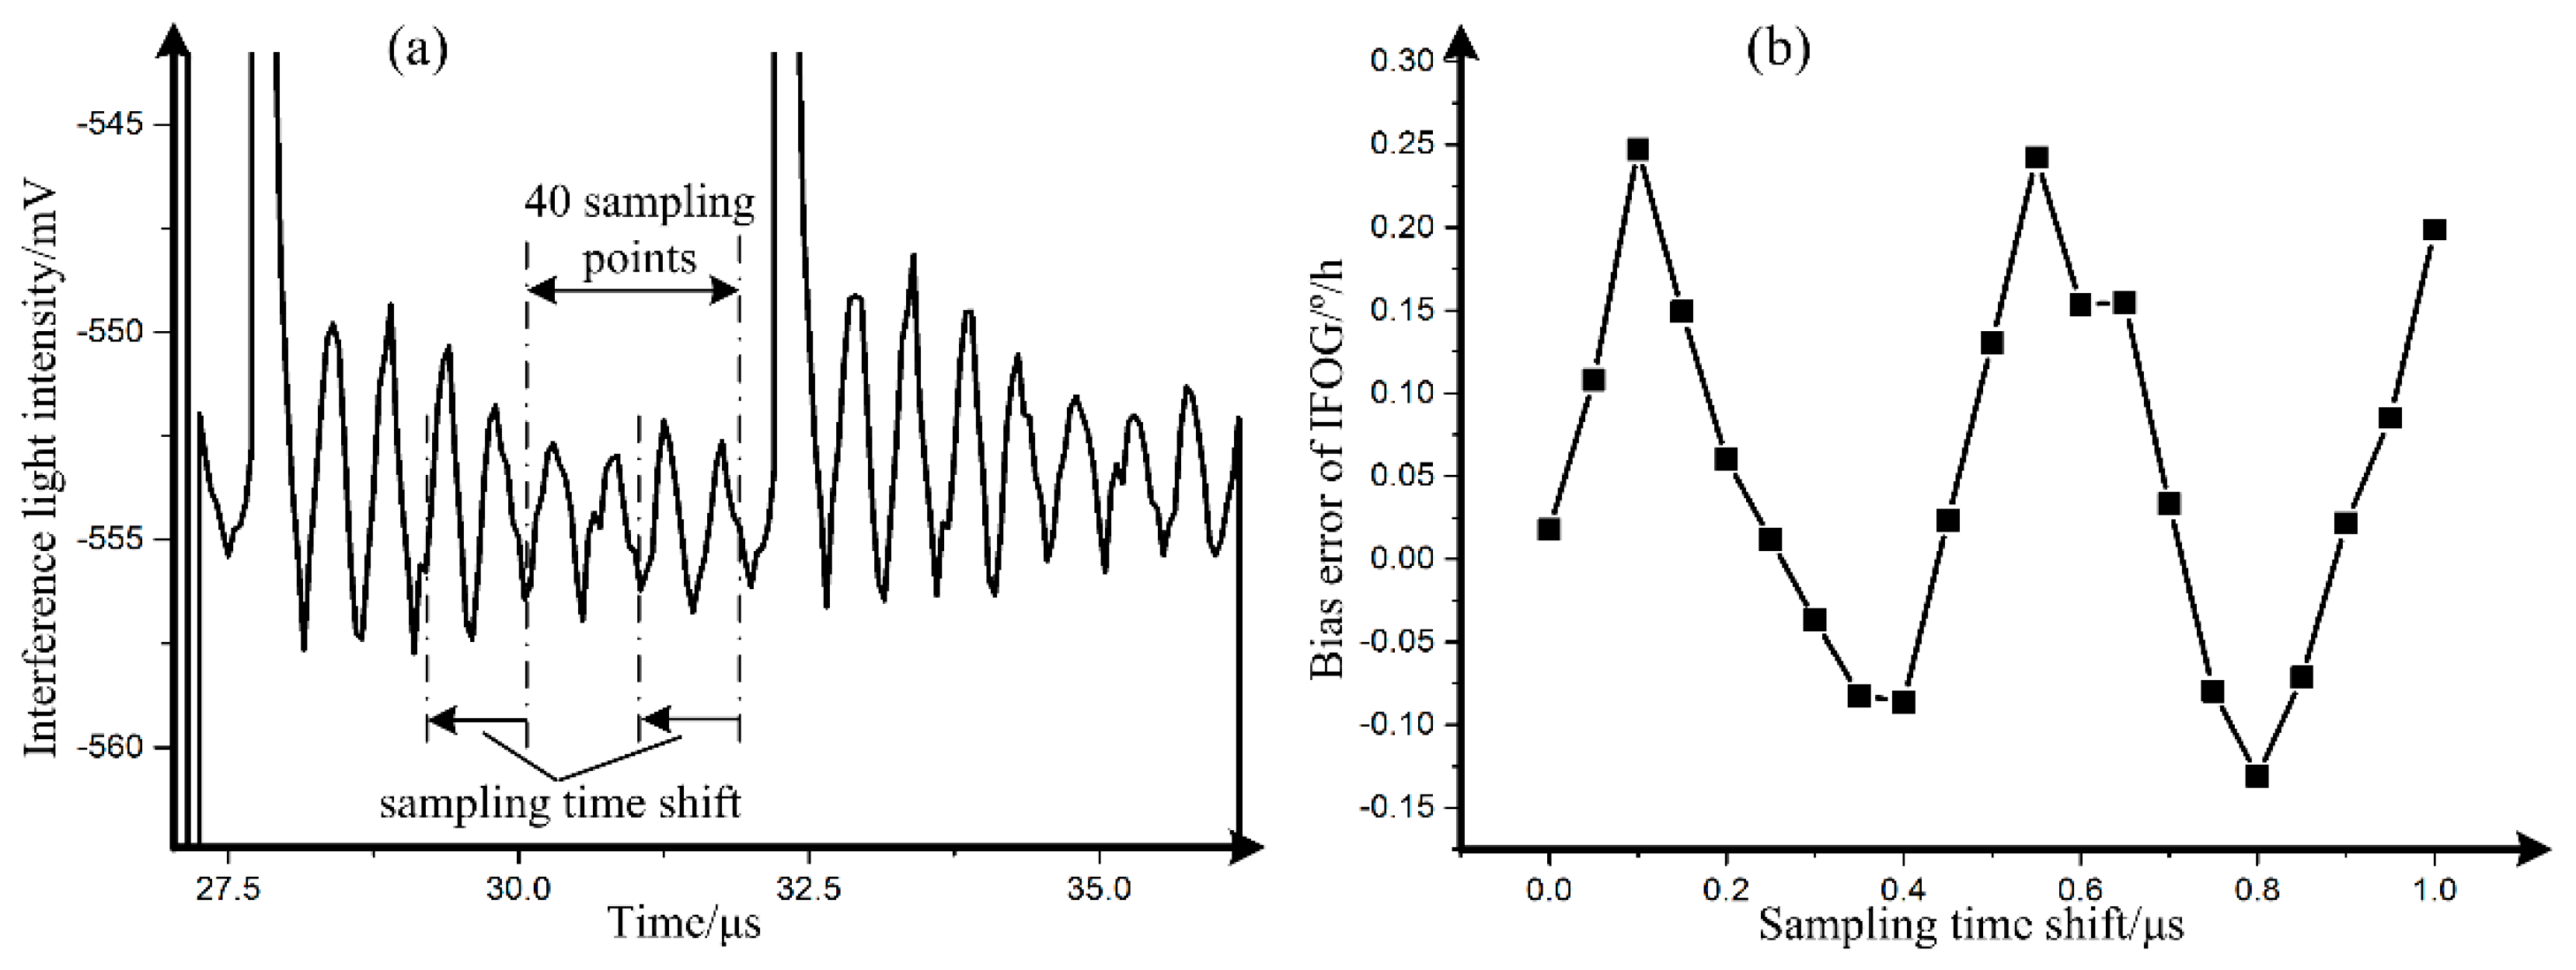
3.1. Measurement Method

For accurate measurement of the MIOC halfwave voltage [16] at different frequencies, it is necessary to adopt a single frequency modulation wave. Based on the sinusoidal modulation scheme, the measurement method is shown in Figure 2, where the feedback system is used to suppress the slow phase shift introduced by the influence of environment and stress. The feedback system tests the average phase of the interference intensity. Additionally, when the average phase isn’t π/2, the feedback system will adjust the voltage on the auxiliary MIOC to make the average phase back to π/2.
In Figure 2, it is not necessary to apply a common path interference structure. The auxiliary MIOC, whose splitting ratio is approximately 50:50, acts as a splitter. Moreover, the auxiliary MIOC and tested MIOC are interchangeable, and the pigtails of MIOCs are spliced at a zero angle. Furthermore, considering the short coherence length of a wide-spectrum light source, a laser light source is used in Figure 2.
A sinusoidal modulation signal, whose frequency is ω and amplitude is U0, is applied to the tested MIOC by the signal generator, and an offset modulation signal, which is half of the halfwave voltage, is applied on the auxiliary MIOC. Referring to the relevant theory of sinusoidal modulation, the interference light intensity can be expressed as
I = I 0 { 1 + cos [ U 0 π V π ( ω ) sin ( ω t ) + π 2 ] } = I 0 { 1 sin [ U 0 π V π ( ω ) sin ( ω t ) ] } = I 0 2 I 0 i = 1 J 2 i 1 ( U 0 π V π ( ω ) ) cos [ ( 2 i 1 ) ω t ]
where, I0 is the light source intensity, Vπ(ω) is the halfwave voltage as a function of frequency, and Jn is the n-order Bessel function.
Using a lock-in amplifier to detect its first harmonic, the output can be obtained as
I f = 2 I 0 J 1 ( U 0 π V π ( ω ) ) .
Based on Equation (14) and the lock-in amplifier output, the halfwave voltage at a modulation frequency can be calculated.
In this method, fluctuations of the external environment will cause instability of the lock-in amplifier output. Thereby, for optimization, a voltage feedback system is applied for suppressing the fluctuations. In addition, the lengths of fibers, L1 and L2, in Figure 2, need to be approximately the same. Moreover, the splitting ratios of the MIOCs are approximately 50:50. When considering the deviation of the splitting ratio, Equation (14) can be written as
I f = 4 ξ 1 ξ 2 ( ξ 1 + ξ 2 ) 2 I 0 J 1 ( U 0 π V π ( ω ) ) ,
where ξ1:ξ2 is the splitting ratio of MIOC.
By testing the extremum of the interference light intensity, the effect of splitting ratio on the measurement results can be eliminated.

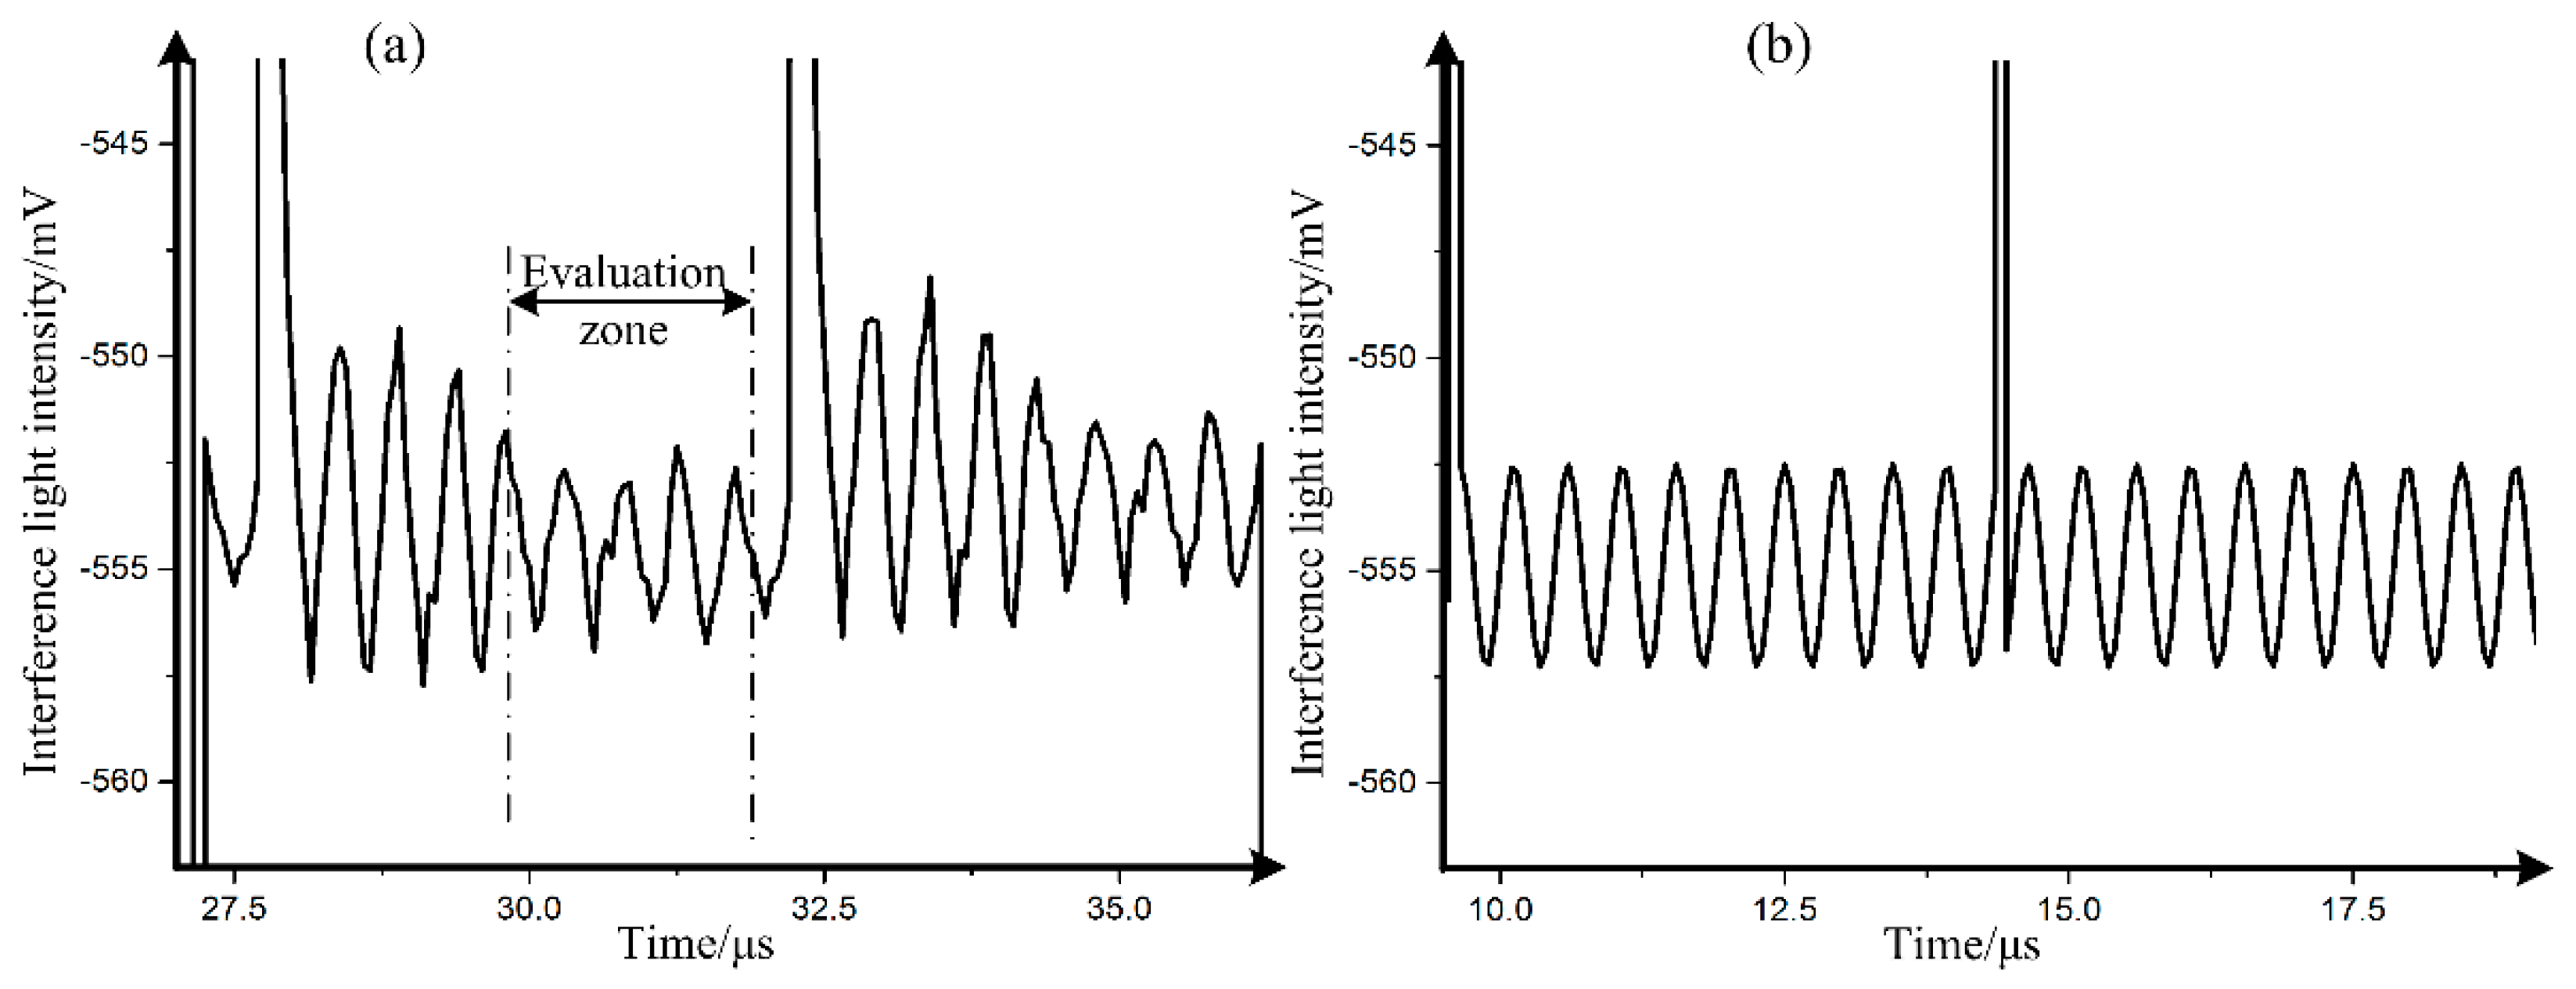
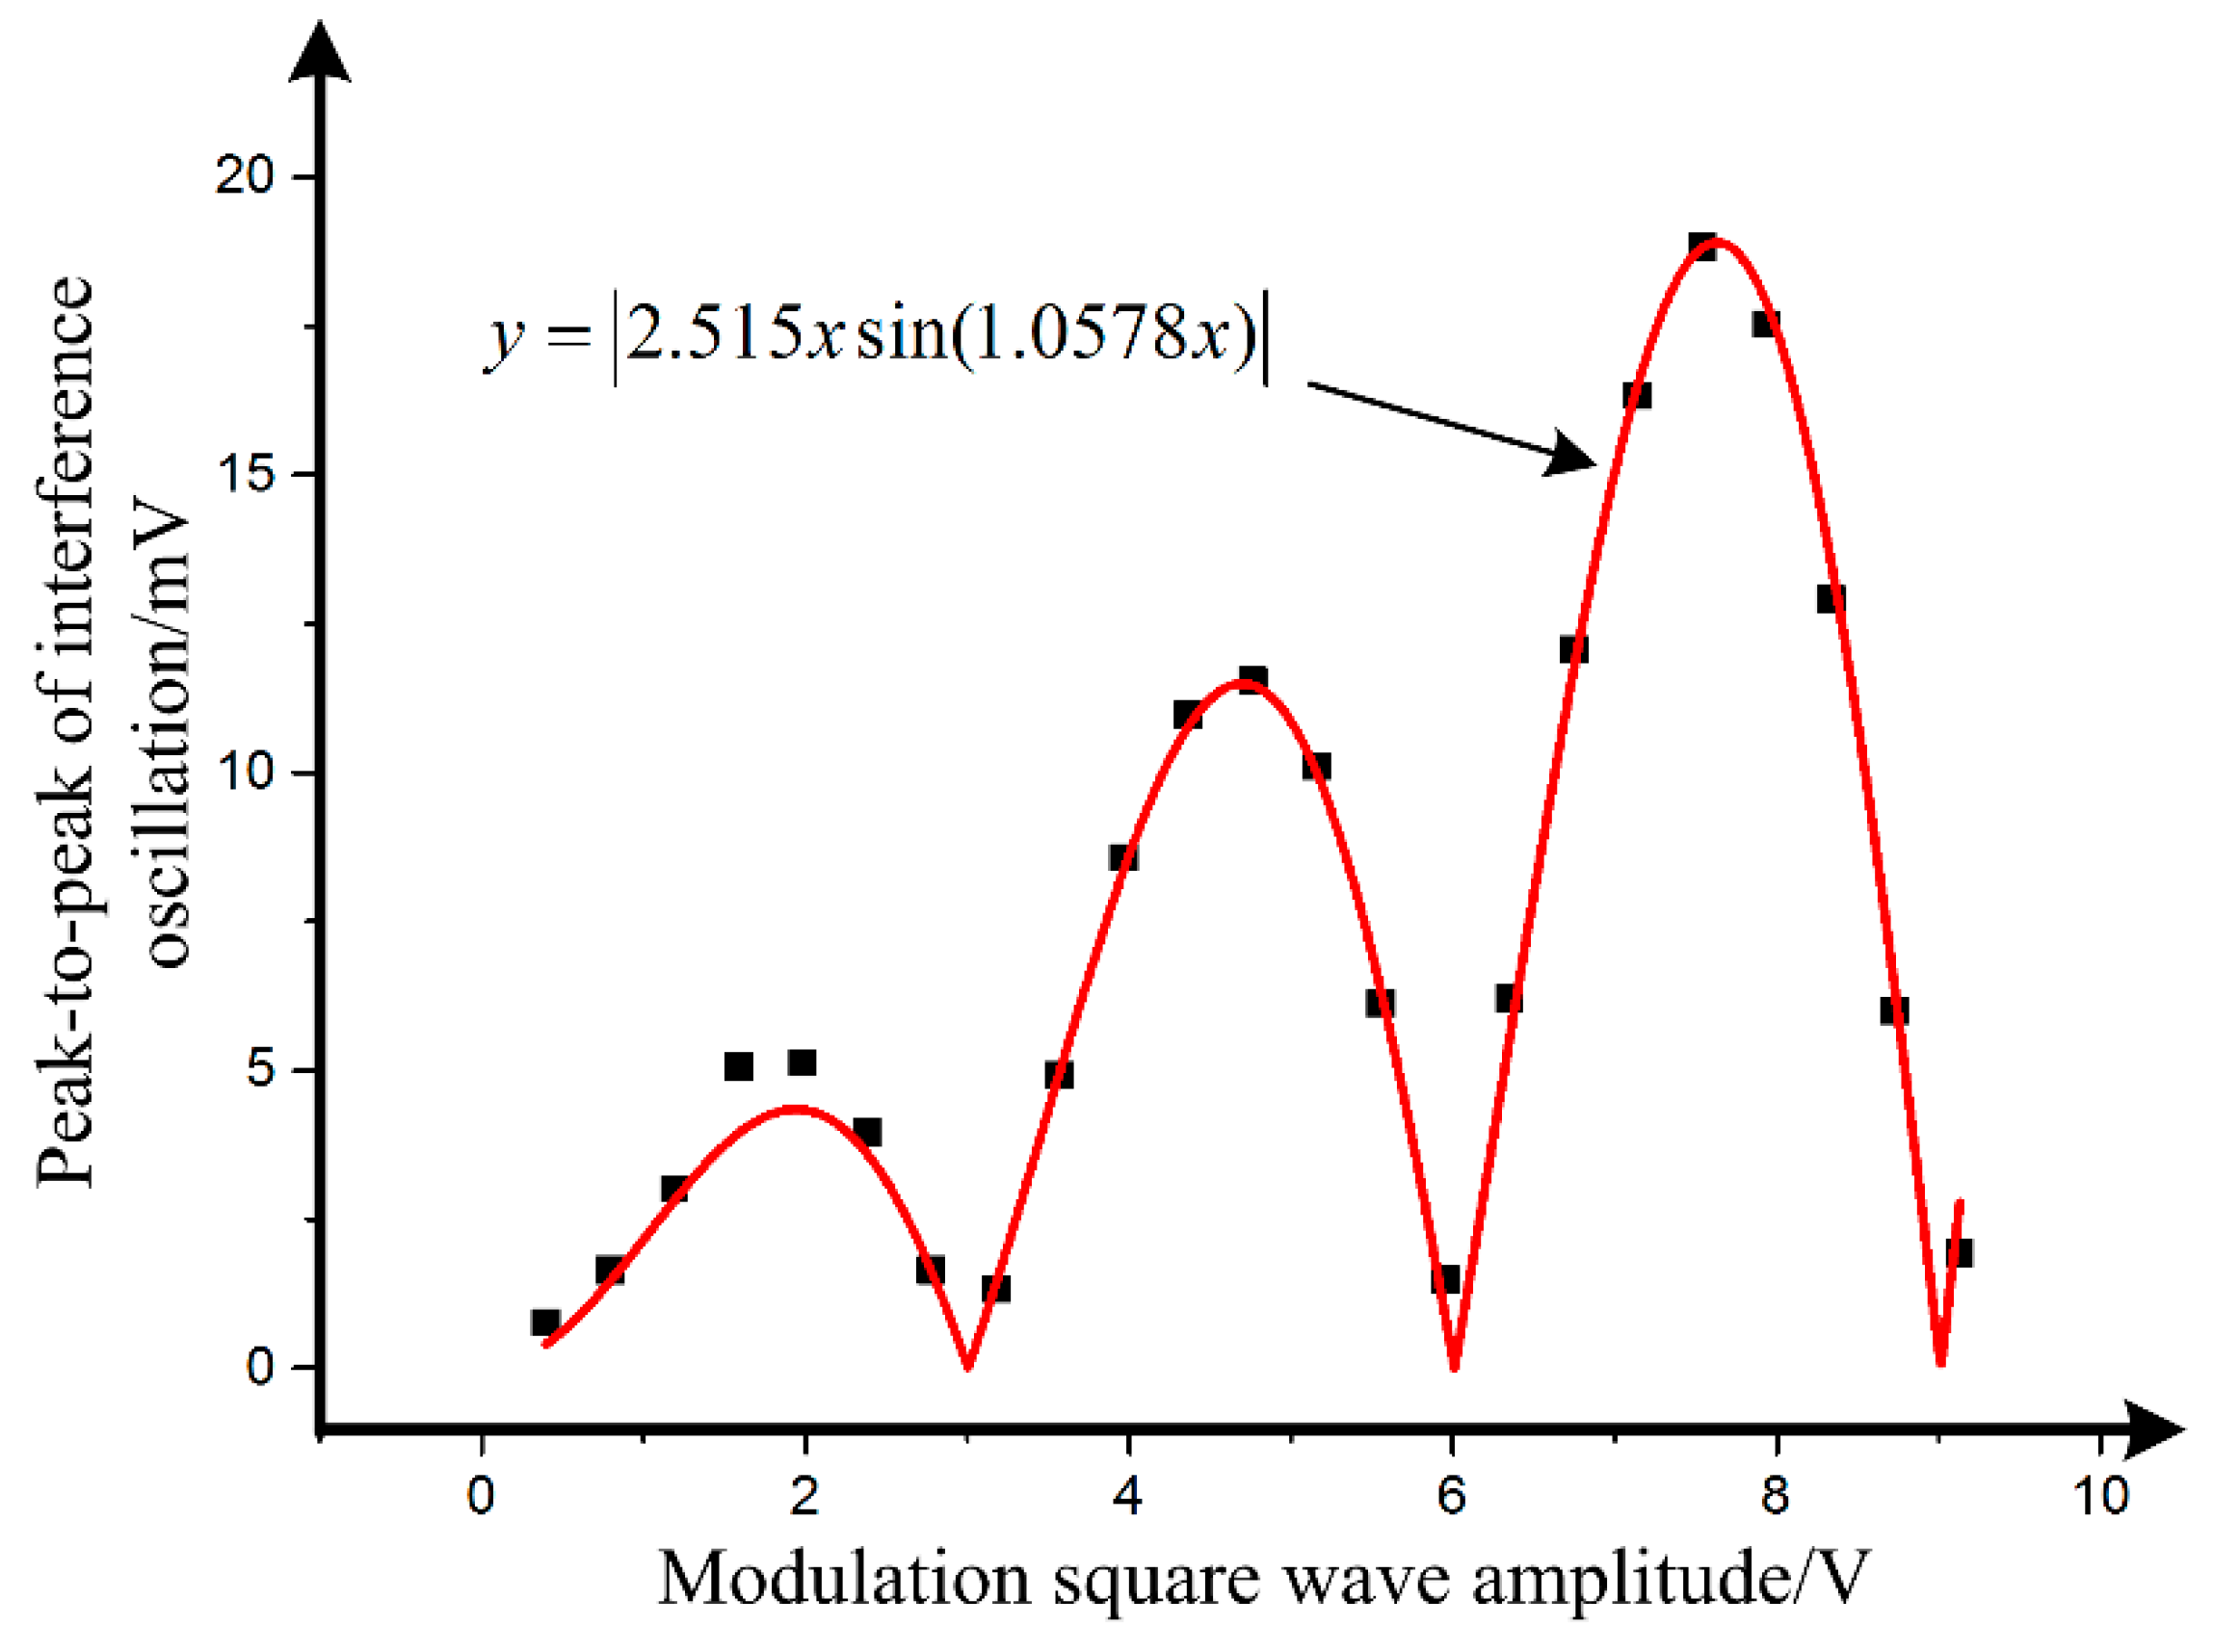
3.2. Experiment Result

The actual measurement system for the frequency dependence of the MIOC halfwave voltage is illustrated in Figure 3a, while the suppression effect of the feedback system on the output fluctuation of lock-in amplifier is in Figure 3b. Additionally the halfwave voltage of different frequencies is shown in Figure 4.
In the measurement, the amplitude of the modulation sinusoidal wave is fixed at 1 V, and the scanning frequency range is 1.8 MHz to 2.3 MHz. As can be seen from Figure 4, the halfwave voltage of the MIOC is about 3.007 V when the modulation frequency ranges from 2.18 MHz to 2.2 MHz, while it is about 2.973 V at 1.9 MHz and below. Further calculation indicates that the halfwave voltage deviation ratio at 2.18 MHz is 1.14%. The measurement result verifies the existence of the frequency-dependent halfwave voltage.
In order to study the effect of the frequency-dependent halfwave voltage on the IFOG, the Sagnac interferometer, whose parameters are shown in the Table 1, is built using the MIOC device, as illustrated in Figure 5. From Table 1, it can be seen that if there is no modulation on MIOC, then the output after the detector is 2.01 V. In Figure 5, the eigen frequency modulating square wave with a 1.5 V amplitude is applied on the MIOC. Then, the interference light intensity signal after the detector, whose time average (40 ms) is shown in Figure 6a, is obtained by the A/D converter, whose resolution is 1.22 mV and sample rate is 20 MHz. A 2.18 MHz oscillation dominates the interference light intensity, which is 21 times the modulation frequency. Considering the parameters in Table 1 and the measured results above, the simulation of interference light intensity by Equation (11) is shown in Figure 6b. The difference between Figure 6a,b is caused by the distortion of the interference [6].
By selecting the second half of the stable segment of the curve as the evaluation area, a 5 mV peak-to-peak value of interference oscillation is calculated. Subsequently, by changing the amplitude of the modulation square wave, the measured relationship between the peak-to-peak value of interference oscillation and modulation amplitude is shown in Figure 7. The black points are the measurement results when the modulation amplitude changes, and the red line in Figure 7 is the model fitting using Equation (12).
The result of model fitting can be written as
V π = 2.97   V σ ( 2.18   MHz ) = 0.98 % ,
which is in good agreement with the theory in Section 2 and the experimental result, 1.14%, in Figure 4.

4. Discussion

The performance of the IFOG is directly limited by the interference light intensity signal [1]. In Reference [14], the effect of interference oscillation on the performance of IFOG was presented. Herein, based on the IFOG system in Section 3, the 40 sampling points average is adopted, as shown in Figure 8a. When the sampling time is shifted, the bias error, also called an angular velocity error of the IFOG, is shown in Figure 8b, which was tested in the Earth’s rotation rate (7.56 °/h at laboratory location). The angular random walk and bias drift, calculated by the Allan deviation [1], were unchanged with the sampling time shift.
The most fundamental solution is the sinusoidal modulation scheme, but there are other issues that need to be addressed [1], which needs further studies. Moreover, after sampling the interference light intensity in IFOG, a digital notch filter, whose stop frequency is the same with the interference oscillation, can be adopted for suppression.
Compared with Reference [14], a new performance for the MIOC resonant effect, the frequency dependence of the halfwave voltage, is presented, which is more comprehensive for the evaluation of MIOC. This paper is focused on LiNbO3 based MIOCs, but the study, the theory and the measurement method are suitable for all types of MIOCs, which might have more than one harmonic frequency. If the measurement method is used for another MIOC, the frequency dependence of the halfwave voltage might be another, due to the different materials and structures.

5. Conclusions

This article focuses on the frequency dependence of the MIOC halfwave voltage in the IFOG. The significant effect of the frequency-dependent halfwave voltage on the interference light intensity, which affects the performance of the IFOG, is presented theoretically. Subsequently, a method based on lock-in amplification is found to measure the halfwave voltage of the MIOC at different frequencies. The measurement result shows that the peak halfwave voltage deviation ratio at resonance frequency is 1.14%. Finally, based on the Sagnac interferometer, the interference oscillation is demonstrated. This research proposes new requirements for the MIOC, and provides a new idea for the development of a high-precision IFOG.

Author Contributions

R.B. designed and performed the experiments and analyzed the data in the paper; L.M. helped to analyze the data and write the paper; T.H. and G.Y. offered the hardware platform and revised the manuscript; and S.C. and X.S. provided guidance and financial support throughout the research work.

Funding

This research was funded by the National Key R&D Program of China (No. 2017YFF0204901), Zhejiang Natural Science Foundation Project (No. Y19F050039), Aerospace Science and Technology Fund (No. 1809KM20190019), and Fundamental Research Funds for the Central Universities (No. 2019FZA5001).

Conflicts of Interest

The authors declare no conflict of interest.

References

  1. Lefèvre, H.C. The Fiber-Optic Gyroscope, 2nd ed.; Artech House: Boston, MA, USA, 2014. [Google Scholar]
  2. Lefèvre, H.C. Potpourri of comments about the fiber optic gyro for its 40th anniversary, and how fascinating it was and it still is! Proc. SPIE 2016, 9852, 985203. [Google Scholar]
  3. Christova, K.; Kuneva, M.; Tonchev, S. Stress in LiNbO3 proton-exchanged waveguide layers. J. Phys. Conf. Ser. 2010, 253, 012057. [Google Scholar] [CrossRef]
  4. Yang, J.; Yuan, Y.; Zhou, A.; Cai, J.; Li, C.; Yan, D.; Huang, S.; Peng, F.; Wu, B.; Zhang, Y.; et al. Full evaluation of polarization characteristics of multifunctional integrated optic chip with high accuracy. J. Lightw. Technol. 2014, 32, 4243–4252. [Google Scholar] [CrossRef]
  5. Sathian, J.; Jaatinen, E. Reducing residual amplitude modulation in electro-optic phase modulators by erasing photorefractive scatter. Opt. Express 2013, 21, 12309–12317. [Google Scholar] [CrossRef] [PubMed]
  6. Bi, R.; She, X.; Shu, X.; Liu, C. Influence of the modulation phase error on bias error in interferometric fiber optic gyroscope. Opt. Eng. 2018, 57, 087104. [Google Scholar]
  7. Yao, J.; Li, K.; Li, B.; Wang, C.; Chen, K.; She, X.; Shu, X. Study of wavelength temperature stability of multifunctional integrated optical chips applied on fiber optic gyroscopes. J. Lightw. Technol. 2018, 36, 5528–5535. [Google Scholar] [CrossRef]
  8. Ding, R.; Jones, T.B.; Kim, W.J.; Spott, A.; Fournier, M.; Fedeli, J.; Huang, S.; Luo, J.; Jen, A.K.Y.; Dalton, L.; et al. Sub-volt silicon-organic electro-optic modulator with 500 MHz bandwidth. J. Lightw. Technol. 2011, 29, 1112–1117. [Google Scholar] [CrossRef]
  9. Ding, R.; Baehr-Jones, T.; Liu, Y.; Bojko, R.; Witzens, J.; Huang, S.; Luo, J.; Benight, S.; Sullivan, P.; Fournier, M.; et al. Demonstration of a low VπL modulator with GHz bandwidth based on electro-optic polymer-clad silicon slot waveguides. Opt. Express 2010, 18, 15618–15623. [Google Scholar] [CrossRef] [PubMed]
  10. Mao, X.; Tian, Q.; Zhang, E.; Sun, L.; Teng, Y.; Liu, J. Research on multiple-integrated optic-chip of re-entrant fiber optic gyro. Int. Opt. Sens. Spectrosc. 2005, 5826, 635–644. [Google Scholar]
  11. Liu, Y.; Li, Y.; Ji, Z.; Xu, J. Research on the half-wave voltage stability of Y waveguide in FOG. Chin. J. Sci. Instrum. 2010, 31, 449–453. [Google Scholar]
  12. Yang, F.; Yang, Y.; Han, Z.; Cao, Y. Correlation of wavelength and temperature with the half-wave voltage for Y branch optical modulator. Chin. J. Lasers 2016, 43, 0606002. [Google Scholar] [CrossRef]
  13. Takeda, K.; Hoshina, T.; Takeda, H.; Tsurumi, T. Electro-optic effect of lithium niobate in piezoelectric resonance. J. Appl. Phys. 2012, 112, 124105. [Google Scholar] [CrossRef]
  14. Nikitenko, A.N.; Volkovskiy, S.A.; Mikheev, M.V.; Aleynik, A.S.; Kikilich, N.E. Influence of acousto-optic resonances in electro-optical modulator on fiber optic gyro performance and method for its compensation. IEEE Sens. J. 2018, 18, 273–280. [Google Scholar] [CrossRef]
  15. Alferness, R.C. Waveguide electrooptic modulators. IEEE Tans. Microw. Theory Tech. 1982, 30, 1121–1137. [Google Scholar] [CrossRef]
  16. Tran, M.A.; Komljenovic, T.; Hulme, J.C.; Kennedy, M.J.; Blumenthal, D.J.; Bowers, J.E. Integrated optical diver for interferometric optical gyroscopes. Opt. Express 2017, 25, 3826–3840. [Google Scholar] [CrossRef] [PubMed]
Figure 1. (a) Piezoelectric displacement and phase-lag between the E-field and piezoelectric displacement as a function of frequency; (b) calculated and observed electro-optical (EO)-coefficients as a function of frequency. Reprinted from [13], with the permission of AIP Publishing.
Sensors 19 02851 g001
Figure 2. Schematic of the measurement method for frequency dependence of the multifunction integrated optical chip (MIOC) halfwave voltage.
Sensors 19 02851 g002
Figure 3. (a) Measurement setup for the halfwave voltage as a function of frequency; (b) normalized output of lock-in amplifier with and without the feedback system.
Sensors 19 02851 g003
Figure 4. Measurement result of the frequency-dependent halfwave voltage.
Sensors 19 02851 g004
Figure 5. Schematic of the Sagnac interferometer.
Sensors 19 02851 g005
Figure 6. (a) Interference light intensity signal obtained by the A/D convertor; (b) interference light intensity signal by simulation with the measurement results.
Sensors 19 02851 g006
Figure 7. Measured peak-to-peak value of interference oscillation as a function of modulation square wave amplitude and its model fitting.
Sensors 19 02851 g007
Figure 8. (a) Schematic diagram of sampling points; (b) measured results between the bias error of IFOG and sampling time shift.
Sensors 19 02851 g008
Table 1. Parameters of interferometric fiber optic gyroscope (IFOG).
ParameterValue
Source optical power 470 μW
Total optical losses18 dB
Detector responsivity270 V/mW
Radius of fiber coil0.1 m
Transit time4.8 μs
Eigen frequency104.1 kHz
Detector output when no light input−2.533 V

