Support Vector Machine for Regional Ionospheric Delay Modeling
Abstract
:1. Introduction
2. Materials and Methods
2.1. Ionosphere Polynomial Model
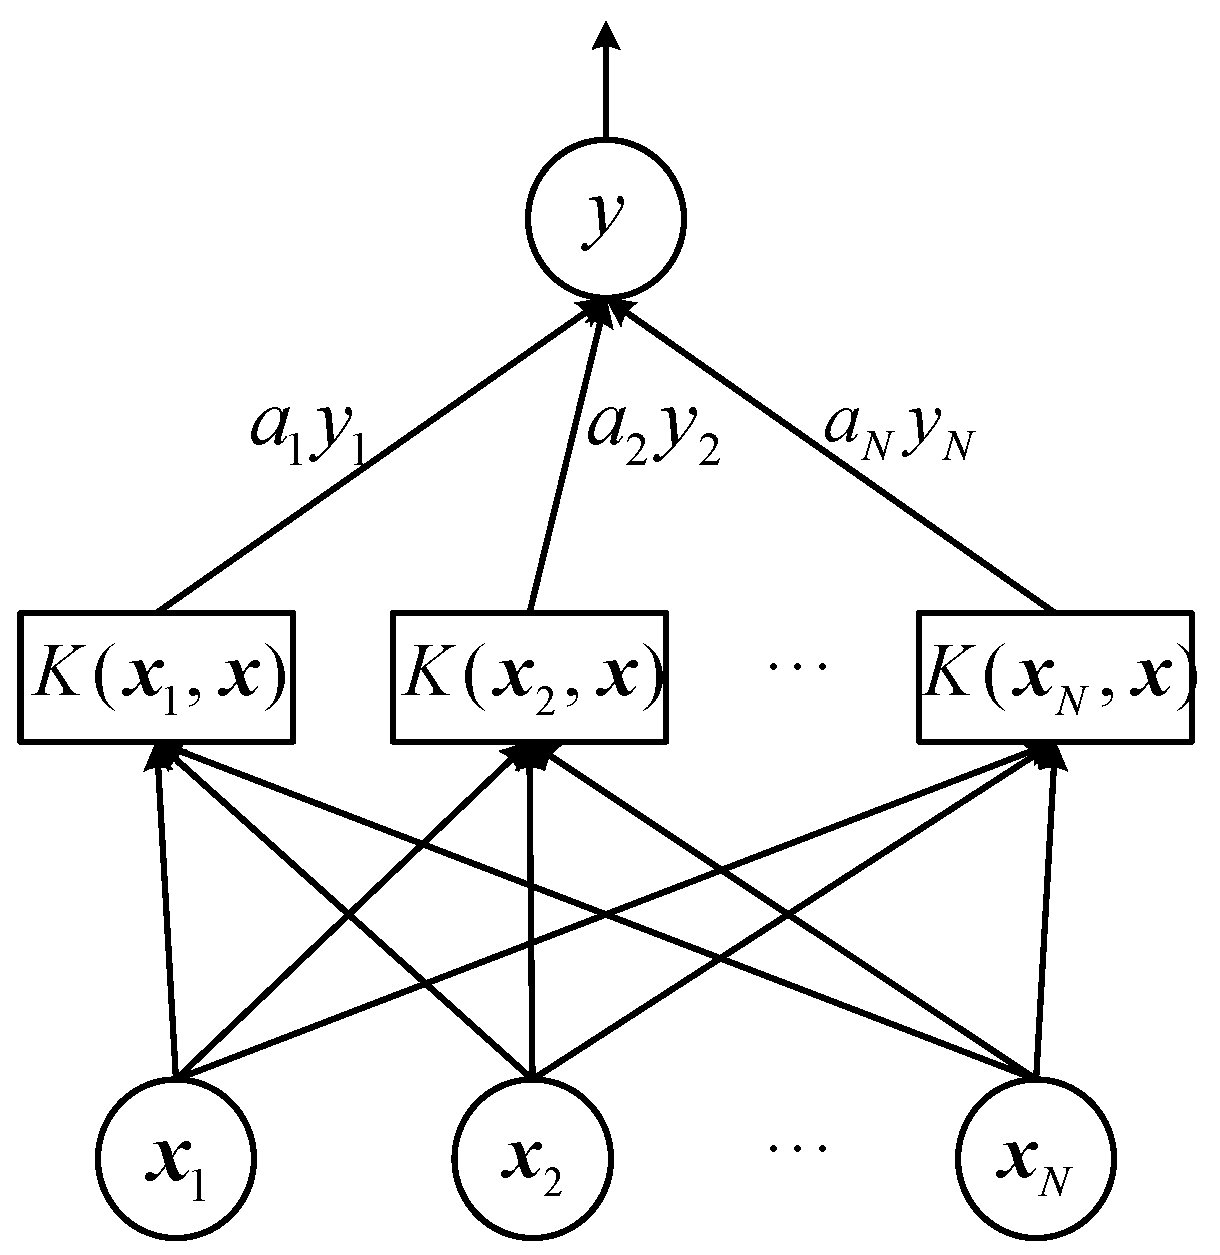
2.2. Support Vector Machine
2.3. Support Vector Machine (SVM) for Ionosphere Model Correction
2.3.1. Establish the Ionosphere Polynomial Model
2.3.2. Support Vector Machine (SVM) Regression for Residuals
2.3.3. Support Vector Machine Polynomial (SVM-P) for Ionospheric Delay Correction
3. Experiments and Results
3.1. Data Processing
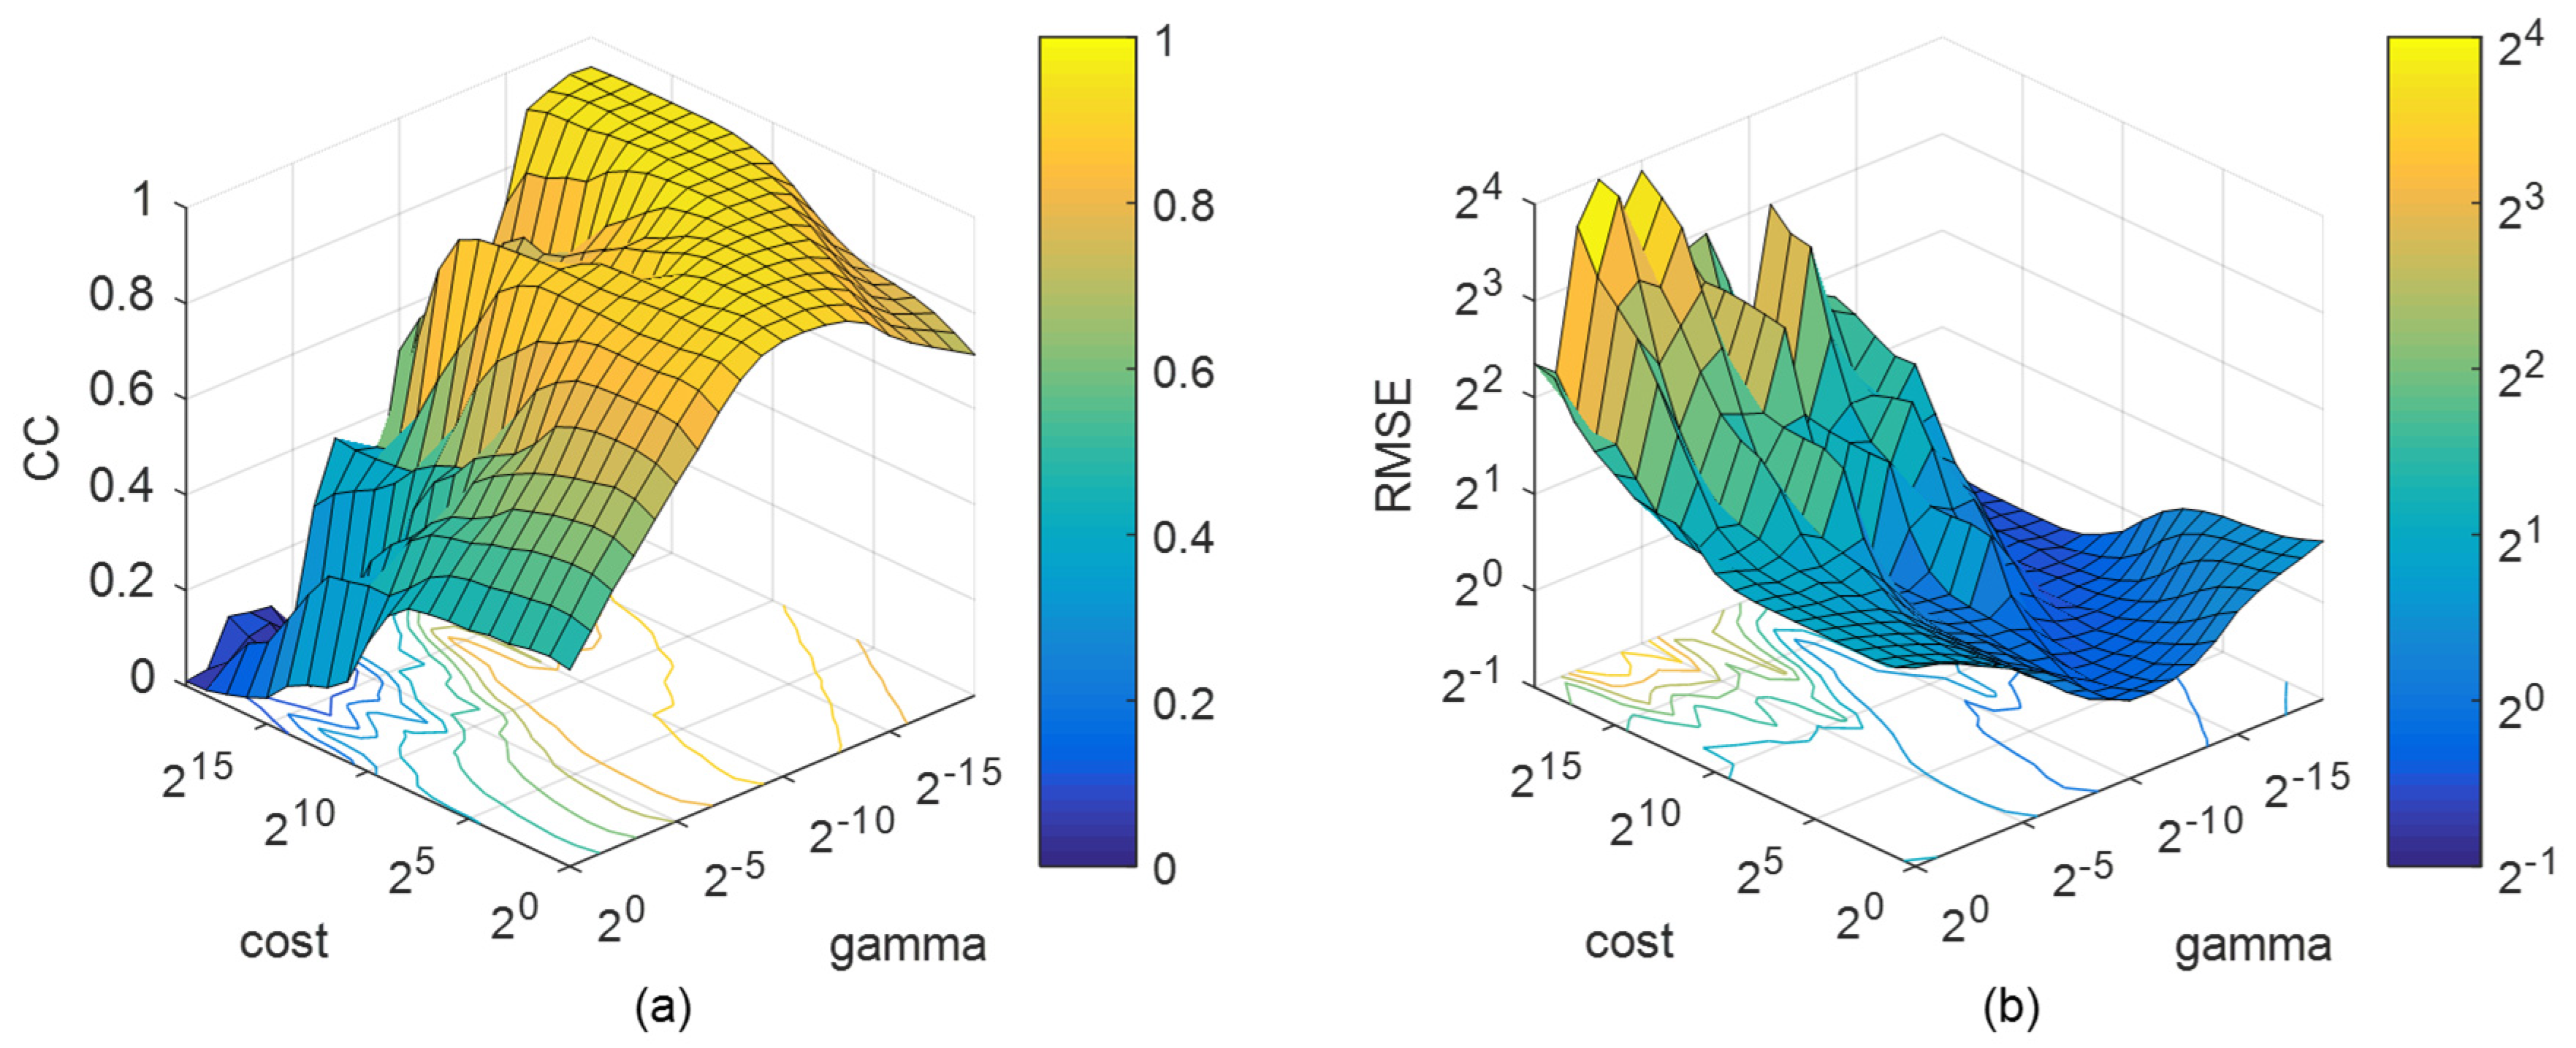
3.2. Parameters Selection of Support Vector Machine (SVM)
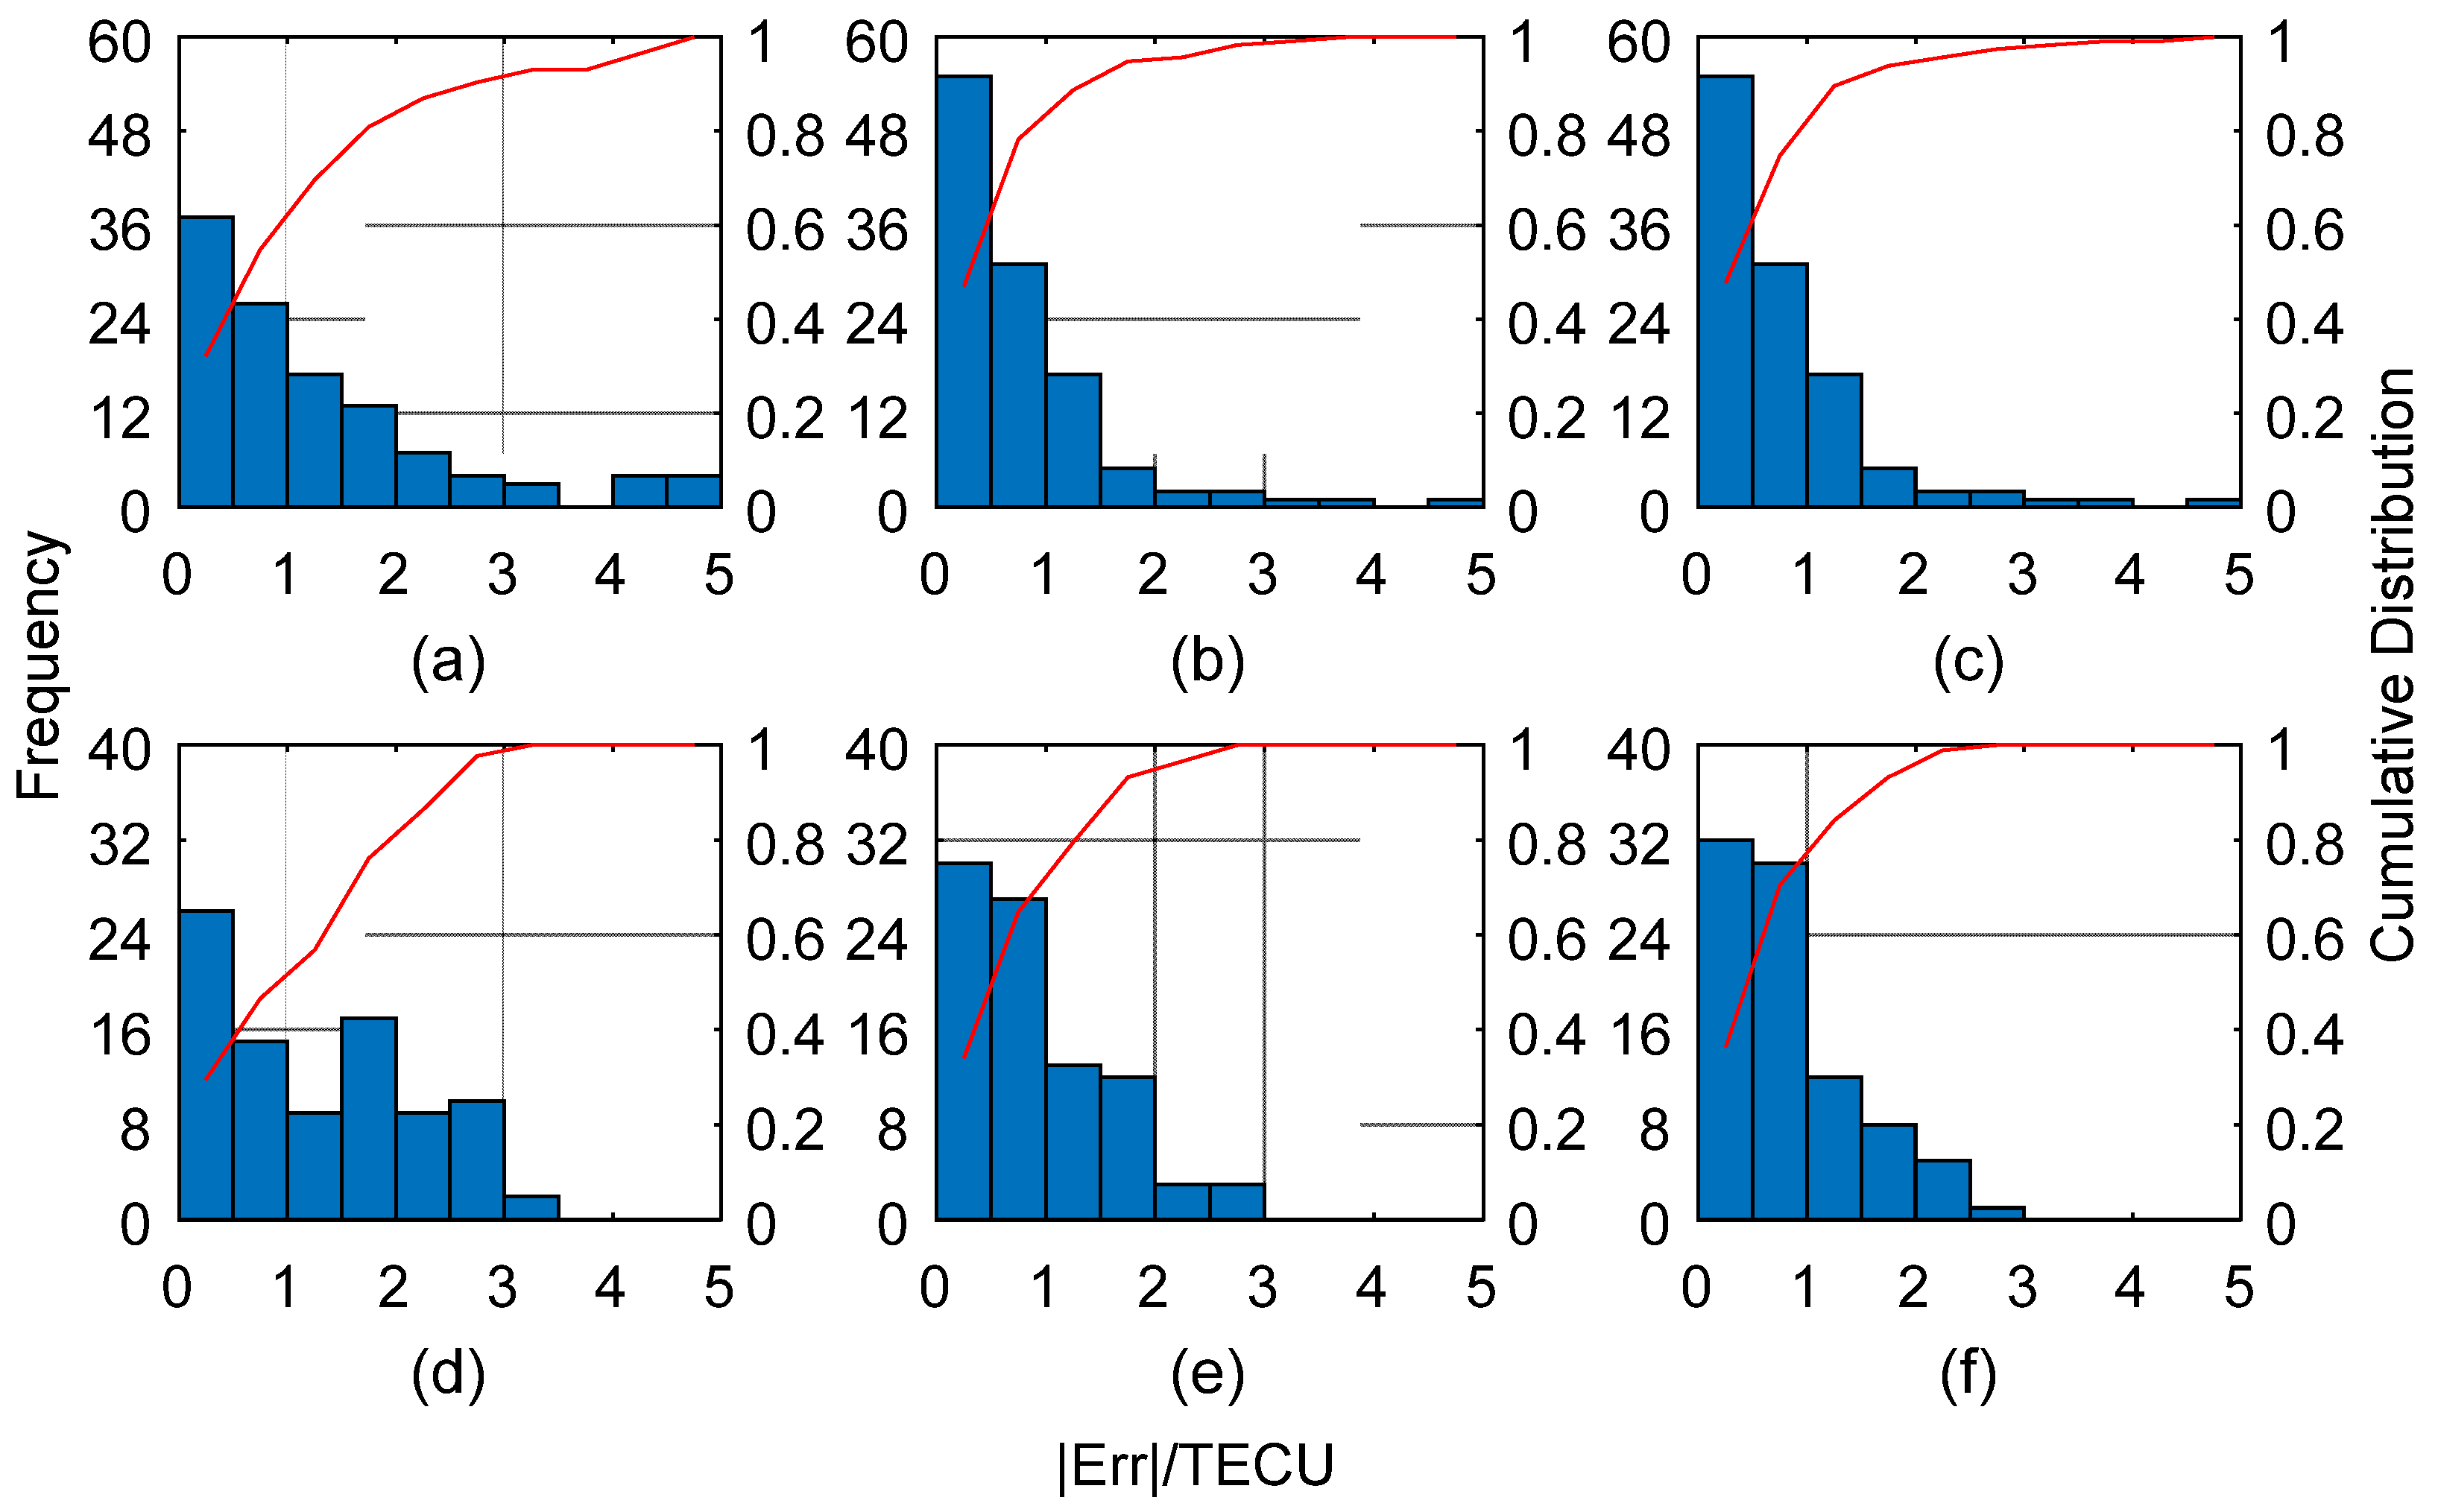
3.3. Comparisons of Model Accuracies
3.4. Single-Frequency PPP
4. Discussion
5. Conclusions
Author Contributions
Funding
Acknowledgments
Conflicts of Interest
References
- Chen, L.; Yi, W.; Song, W.; Shi, C.; Lou, Y.; Cao, C. Evaluation of three ionospheric delay computation methods for ground-based GNSS receivers. GPS Solut. 2018, 22, 125. [Google Scholar] [CrossRef]
- Su, K.; Jin, S.; Hoque, M.M. Evaluation of Ionospheric Delay Effects on Multi-GNSS Positioning Performance. Remote Sens. 2019, 11, 171. [Google Scholar] [CrossRef]
- Liu, J.; Chen, R.; Wang, Z.; Zhang, H. Spherical cap harmonic model for mapping and predicting regional TEC. GPS Solut. 2011, 15, 109–119. [Google Scholar] [CrossRef]
- Feng, J.; Han, B.; Zhao, Z.; Wang, Z. A New Global Total Electron Content Empirical Model. Remote Sens. 2019, 11, 706. [Google Scholar] [CrossRef]
- Jiang, H.; Liu, J.; Wang, Z.; An, J.; Ou, J.; Liu, S.; Wang, N. Assessment of spatial and temporal TEC variations derived from ionospheric models over the polar regions. J. Geod. 2019, 93, 455–471. [Google Scholar] [CrossRef]
- Akir, R.M.; Chellappan, K.; Abdullah, M. Total Electron Content Forecasting using Artificial Neural Network. Pertanika J. Sci. Technol. 2017, 25, 19–27. [Google Scholar]
- Ivanov, V.B.; Zatolokin, D.A.; Gorbachev, O.A. Comparing models of total electron content in the ionosphere for GLONASS. Gyroscopy Navig. 2017, 8, 295–299. [Google Scholar] [CrossRef]
- Orus Perez, R. Using TensorFlow-based Neural Network to estimate GNSS single frequency ionospheric delay (IONONet). Adv. Space Res. 2019, 63, 1607–1618. [Google Scholar] [CrossRef]
- Zheng, D.; Hu, W.; Li, P. Predicting ionospheric critical frequency of the F2 layer over Lycksele using the neural network improved by error compensation technology. Surv. Rev. 2016, 48, 130–139. [Google Scholar] [CrossRef]
- Sabzehee, F.; Farzaneh, S.; Sharifi, M.A.; Akhoondzadeh, M. TEC Regional Modeling and prediction using ANN method and single frequency receiver over IRAN. Ann. Geophys. 2018, 61, 103. [Google Scholar] [CrossRef] [Green Version]
- Habarulema, J.B.; McKinnell, L.-A.; Cilliers, P.J. Prediction of global positioning system total electron content using Neural Networks over South Africa. J. Atmos. Sol. Terr. Phys. 2007, 69, 1842–1850. [Google Scholar] [CrossRef]
- McKinnell, L.-A.; Friedrich, M. A neural network-based ionospheric model for the auroral zone. J. Atmos. Sol. Terr. Phys. 2007, 69, 1459–1470. [Google Scholar] [CrossRef]
- Fan, G.; Wang, W.; Xi, X. Modeling of ionosphere VTEC using generalized regression neural network. Acta Geod. Cartogr. Sin. 2010, 39, 16–21. [Google Scholar]
- Hu, W.S.; Zheng, D.Y.; Nie, W.F. Research on methods of regional ionospheric delay correction based on neural network technology. Surv. Rev. 2014, 46, 167–174. [Google Scholar] [CrossRef]
- Ghaffari Razin, M.-R.; Voosoghi, B. Ionosphere tomography using wavelet neural network and particle swarm optimization training algorithm in Iranian case study. GPS Solut. 2017, 21, 1301–1314. [Google Scholar] [CrossRef]
- Vapnik, V. The Nature of Statistical Learning Theory; Springer Science & Business Media: Berlin, Germany, 2013. [Google Scholar]
- Thissen, U.; Van Brakel, R.; De Weijer, A.P.; Melssen, W.J.; Buydens, L.M.C. Using support vector machines for time series prediction. Chemom. Intell. Lab. Syst. 2003, 69, 35–49. [Google Scholar] [CrossRef]
- Chang, C.-C.; Lin, C.-J. LIBSVM: A library for support vector machines. ACM Trans. Intell. Syst. Technol. 2011, 2, 27. [Google Scholar] [CrossRef]
- Wei, J.; Jian-qi, Z.; Xiang, Z. Face recognition method based on support vector machine and particle swarm optimization. Expert Syst. Appl. 2011, 38, 4390–4393. [Google Scholar] [CrossRef]
- Kim, M.; Kim, J. Extending the coverage area of regional ionosphere maps using a support vector machine algorithm. Ann. Geophys. 2019, 37, 77–87. [Google Scholar] [CrossRef] [Green Version]
- Huang, C.-L.; Wang, C.-J. A GA-based feature selection and parameters optimization for support vector machines. Expert Syst. Appl. 2006, 31, 231–240. [Google Scholar] [CrossRef]
- Ban, P.-P.; Sun, S.-J.; Chen, C.; Zhao, Z.-W. Forecasting of low-latitude storm-time ionospheric foF2 using support vector machine: Forecasting of ionospheric foF2. Radio Sci. 2011, 46, RS6008. [Google Scholar] [CrossRef]
- Akhoondzadeh, M. Support vector machines for TEC seismo-ionospheric anomalies detection. Ann. Geophys. 2013, 31, 173–186. [Google Scholar] [CrossRef] [Green Version]
- Liu, Y.; Jin, S. Ionospheric Rayleigh Wave Disturbances Following the 2018 Alaska Earthquake from GPS Observations. Remote Sens. 2019, 11, 901. [Google Scholar] [CrossRef]
- Hernández-Pajares, M.; Roma-Dollase, D.; Garcia-Fernàndez, M.; Orus-Perez, R.; García-Rigo, A. Precise ionospheric electron content monitoring from single-frequency GPS receivers. GPS Solut. 2018, 22, 102. [Google Scholar] [CrossRef] [Green Version]
- Xiang, Y.; Gao, Y. Improving DCB Estimation Using Uncombined PPP: Improving DCB Estimation Using Uncombined PPP. Navigation 2017, 64, 463–473. [Google Scholar] [CrossRef]
- Chen, P.; Yao, Y.; Yao, W. Global ionosphere maps based on GNSS, satellite altimetry, radio occultation and DORIS. GPS Solut. 2017, 21, 639–650. [Google Scholar] [CrossRef]
- Wild, U. Ionosphere and Geodetic Satellite Systems: Permanent GPS Tracking Data for Modelling and Monitoring. Available online: https://ui.adsabs.harvard.edu/abs/1994GGAS...48.....W/exportcitation (accessed on 3 July 2019).
- Gunn, S.R. Support vector machines for classification and regression. ISIS Tech. Rep. 1998, 14, 5–16. [Google Scholar]
- Yang, F.; White, M.A.; Michaelis, A.R.; Ichii, K.; Hashimoto, H.; Votava, P.; Zhu, A.-X.; Nemani, R.R. Prediction of continental-scale evapotranspiration by combining MODIS and AmeriFlux data through support vector machine. IEEE Trans. Geosci. Remote Sens. 2006, 44, 3452–3461. [Google Scholar] [CrossRef]
- Scholkopf, B.; Smola, A.J. Learning with Kernels: Support Vector Machines, Regularization, Optimization, and Beyond; MIT Press: Cambridge, MA, USA, 2001. [Google Scholar]
- Schaer, S.; Beutler, G.; Rothacher, M. Mapping and predicting the ionosphere. In Proceedings of the 1998 IGS Analysis Center Workshop, Darmstadt, Germany, 9–11 February 1998. [Google Scholar]


| No. | Target | Input Parameters | ||||||||
|---|---|---|---|---|---|---|---|---|---|---|
| 1 | −2.585 | 15.570 | −0.075 | −1.434 | 0.006 | 2.055 | 0.107 | −0.008 | −0.153 | 0.011 |
| 2 | 1.470 | 17.096 | −1.473 | 1.628 | 2.171 | 2.651 | −2.399 | 3.535 | −3.906 | 5.755 |
| 3 | −0.377 | 13.025 | 2.168 | 6.113 | 4.699 | 37.373 | 13.252 | 28.727 | 81.015 | 175.620 |
| 4 | −1.372 | 15.359 | −0.364 | 3.887 | 0.133 | 15.112 | −1.415 | 0.515 | −5.502 | 2.003 |
| 5 | 0.361 | 12.802 | 3.166 | −2.952 | 10.025 | 8.712 | −9.345 | −29.589 | 27.583 | 87.332 |
| 6 | −0.825 | 16.234 | −1.208 | −1.319 | 1.459 | 1.739 | 1.593 | −1.924 | −2.101 | 2.537 |
| 7 | −0.225 | 13.928 | 1.640 | −2.500 | 2.688 | 6.248 | −4.098 | −6.718 | 10.243 | 16.793 |
| 8 | 2.427 | 16.083 | 0.283 | 0.578 | 0.080 | 0.335 | 0.164 | 0.046 | 0.095 | 0.027 |
| 9 | 0.313 | 12.459 | 3.919 | 5.080 | 15.360 | 25.804 | 19.909 | 78.027 | 101.131 | 396.357 |
| 10 | −0.262 | 15.005 | 1.413 | 2.878 | 1.998 | 8.282 | 4.067 | 5.749 | 11.705 | 16.543 |
| 11 | 0.162 | 11.574 | 4.701 | −3.926 | 22.095 | 15.413 | −18.454 | −86.742 | 72.450 | 340.549 |
| 12 | −0.691 | 17.145 | −3.044 | −1.110 | 9.264 | 1.233 | 3.379 | −10.285 | −3.752 | 11.419 |
| 13 | 0.407 | 14.961 | −0.223 | −2.317 | 0.050 | 5.370 | 0.516 | −0.115 | −1.196 | 0.267 |
| 14 | 1.585 | 17.264 | −1.592 | 0.720 | 2.535 | 0.518 | −1.146 | 1.825 | −0.825 | 1.314 |
| 15 | 0.264 | 13.575 | 2.122 | 5.224 | 4.502 | 27.294 | 11.085 | 23.521 | 57.913 | 122.881 |
| 16 | 0.292 | 16.030 | −0.464 | 2.978 | 0.215 | 8.867 | −1.381 | 0.641 | −4.113 | 1.908 |
| 17 | −0.177 | 12.502 | 2.972 | −3.837 | 8.833 | 14.725 | −11.405 | −33.895 | 43.764 | 130.068 |
| 18 | −1.153 | 16.146 | −1.886 | −1.744 | 3.557 | 3.041 | 3.289 | −6.202 | −5.735 | 10.816 |
| 19 | −1.420 | 13.952 | 0.934 | −2.940 | 0.873 | 8.642 | −2.746 | −2.566 | 8.074 | 7.543 |
| 20 | 0.787 | 16.471 | −0.410 | 0.111 | 0.168 | 0.012 | −0.045 | 0.019 | −0.005 | 0.002 |
| UTC | POLY | BPNN-P | SVM-P | ||
|---|---|---|---|---|---|
| RMSE | RMSE | Improvement | RMSE | Improvement | |
| 1:00 | 1.154 | 1.123 | 2.7% | 1.019 | 11.7% |
| 2:00 | 1.424 | 1.156 | 18.8% | 1.161 | 18.5% |
| 3:00 | 1.670 | 1.009 | 39.6% | 0.964 | 42.3% |
| 4:00 | 1.605 | 1.229 | 23.5% | 1.301 | 19.0% |
| 5:00 | 1.206 | 1.235 | −2.4% | 1.112 | 7.8% |
| 6:00 | 1.552 | 1.297 | 16.4% | 1.240 | 20.1% |
| 7:00 | 1.117 | 0.987 | 11.7% | 0.931 | 16.7% |
| 8:00 | 0.897 | 0.801 | 10.7% | 0.738 | 17.7% |
| 9:00 | 0.977 | 0.918 | 6.0% | 0.838 | 14.2% |
| 10:00 | 1.032 | 0.917 | 11.1% | 0.912 | 11.6% |
| 11:00 | 0.907 | 0.928 | −2.3% | 0.817 | 9.9% |
| 12:00 | 0.902 | 0.835 | 7.3% | 0.803 | 10.9% |
| 13:00 | 0.937 | 0.970 | −3.5% | 0.832 | 11.2% |
| 14:00 | 1.031 | 1.044 | −1.2% | 0.918 | 11.0% |
| 15:00 | 1.272 | 1.164 | 8.5% | 1.076 | 15.4% |
| 16:00 | 1.189 | 1.282 | −7.8% | 1.103 | 7.2% |
| 17:00 | 0.972 | 0.971 | 0.1% | 0.879 | 9.6% |
| 18:00 | 1.377 | 1.326 | 3.7% | 1.050 | 23.8% |
| 19:00 | 1.575 | 1.138 | 27.8% | 1.095 | 30.5% |
| 20:00 | 1.420 | 1.311 | 7.7% | 1.072 | 24.5% |
| 21:00 | 0.886 | 0.927 | −4.6% | 0.828 | 6.6% |
| 22:00 | 1.233 | 1.055 | 14.4% | 0.996 | 19.2% |
| 23:00 | 0.908 | 0.995 | −9.6% | 0.853 | 6.1% |
| Mean | 1.185 | 1.070 | 9.6% | 0.980 | 17.3% |
| Station | Model | North | East | Up | 3D | Improvement |
|---|---|---|---|---|---|---|
| BTRD | None | 0.680 | 0.176 | 0.256 | 0.747 | - |
| POLY | 0.020 | 0.067 | 0.259 | 0.269 | 64.0% | |
| SVM-P | 0.082 | 0.019 | 0.113 | 0.141 | 81.2% | |
| GTBH | None | 0.599 | 0.100 | 0.385 | 0.719 | - |
| POLY | 0.060 | 0.074 | 0.204 | 0.225 | 68.7% | |
| SVM-P | 0.032 | 0.091 | 0.094 | 0.135 | 81.3% |
© 2019 by the authors. Licensee MDPI, Basel, Switzerland. This article is an open access article distributed under the terms and conditions of the Creative Commons Attribution (CC BY) license (http://creativecommons.org/licenses/by/4.0/).
Share and Cite
Zhang, Z.; Pan, S.; Gao, C.; Zhao, T.; Gao, W. Support Vector Machine for Regional Ionospheric Delay Modeling. Sensors 2019, 19, 2947. https://doi.org/10.3390/s19132947
Zhang Z, Pan S, Gao C, Zhao T, Gao W. Support Vector Machine for Regional Ionospheric Delay Modeling. Sensors. 2019; 19(13):2947. https://doi.org/10.3390/s19132947
Chicago/Turabian StyleZhang, Zhengxie, Shuguo Pan, Chengfa Gao, Tao Zhao, and Wang Gao. 2019. "Support Vector Machine for Regional Ionospheric Delay Modeling" Sensors 19, no. 13: 2947. https://doi.org/10.3390/s19132947
APA StyleZhang, Z., Pan, S., Gao, C., Zhao, T., & Gao, W. (2019). Support Vector Machine for Regional Ionospheric Delay Modeling. Sensors, 19(13), 2947. https://doi.org/10.3390/s19132947


