1. Introduction
The fundamental competence of sound source localization has received much attention during the past decades, and has become an important part of navigation systems [
1,
2]. Direction-of-arrival (DOA) estimation in particular plays a critical role in navigation systems for the exploration of sources in widespread applications, including in acoustic signal processing [
3,
4,
5,
6,
7,
8]. Several approaches have been proposed as a potential way to estimate DOA. For instance, the time-difference-of-arrival-based DOA estimation is one of the most frequently used approaches, which is widely known as the generalized cross-correlation with phase transform (GCC-PHAT) [
9]. In addition to this approach, a low computational requirement makes it attractive for practical applications; however, the major drawback is its low robustness in noisy and multipath environments. Another relevant approach is adopted from the independent component analysis (ICA) in blind source separation [
10,
11]. ICA searches independent components by measuring deviations from Gaussian distributions, such as maximization of negentropy or kurtosis. DOAs are estimated easily by using the separated components for all frequency bins, but it should be noted that the estimation accuracy of such a method is highly sensitive to the non-Gaussianity measures.
In an alternative approach to estimate narrowband DOAs, the subspace method has been proposed in an effort to improve estimation performance. The most prominent methods observe the signal and noise subspace for achieving more robust results, such as multiple signal classification (MUSIC) [
12], estimation of signal parameters via rotational invariance techniques (ESPRIT) [
13], and propagator method [
14,
15], which have been used frequently for one-dimensional (1D) DOA estimation along with the uniform linear array (ULA) of sensors. In case of a two-dimensional (2D) DOA estimation, a new geometrical structure of a sensor array is required, and it was previously found that the structure of an L-shaped array is considerably effective for estimating 2D DOAs [
16]. Additionally, the L-shaped array allows for simple implementation, because it consists of two ULAs connected orthogonally at one end of each ULA. For these reasons, the L-shaped array is widely applied to the 2D DOA estimation method [
17,
18,
19,
20,
21,
22,
23,
24,
25,
26], and its practical applications can be found in the past researches [
27,
28]. Although the narrowband subspace method may be unable to directly estimate wideband DOAs, one possible way to solve this problem is to employ the narrowband subspace method in each temporal frequency intensively, and then the wideband DOA results can be estimated by interpolating the narrowband DOA results all frequency bins [
29,
30]. It should be noted again that intensive computational costs encountered in the above solution may be limited by practical considerations.
Several approaches were proposed to solve the problem of estimating wideband DOAs, for example, the incoherent MUSIC (IMUSIC) is one of the simplest methods for estimating wideband DOA [
31]. There are two steps in IMUSIC: Firstly, a noise subspace model each temporal frequency is constructed. Then, wideband DOAs are obtained by minimizing the norm of orthogonal relation between a steering vector and the noise subspace of all frequency bins. Although accuracy performance of IMUSIC was demonstrated to be an effective method for estimating DOAs of multiple wideband signals in the high signal-to-noise ratio (SNR) region, a single small distortion of the noise subspace at any frequency can affect the whole DOA results. Many attempts were made recently to overcome this problem. For instance, the test of orthogonality of frequency subspaces (TOFS) was proposed to overcome this difficulty [
32], but performance degradation caused by the small distortion still remains challenging. Another relevant approach is called the test of orthogonality of projected subspaces (TOPS) [
33]. TOPS estimate DOA by constructing signal subspace of one reference frequency, and then measuring orthogonality of the previous signal subspace and noise subspace for all frequency bins. The simulations showed that TOPS is able to achieve higher accuracy than IMUSIC in mid SNR range, however, the undesirable false peaks still remain. The revised and greatly improved version of TOPSs were proposed recently to reduce these false peaks [
34,
35]. Obviously, computational complexities increased dramatically compared to the classical TOPS.
Another notable approach of wideband DOA estimation is the coherent signal subspace method (CSS) [
36,
37]. CSS specifically focuses a correlation matrix of received signals of each temporal frequency into a single matrix, which is called a universal correlation, associated with one focusing frequency via linear transformation procedure. Wideband DOAs are estimated by applying a single scheme of any narrowband subspace method on the universal correlation matrix. In addition to the transformation procedure of CSS [
38,
39,
40], a process of DOA preliminary estimation is required before the wideband DOAs can be estimated. Therefore, a common shortcoming is clearly recognized as a requirement of DOA preliminary estimation, which means that any inferior initiation can lead to biased estimates. According to the literature [
31,
32,
33,
41], CSS demonstrates deficient performance than others such as TOPS; this is because the solutions of transformation procedure in CSS are solely focused on subspace between a temporal frequency and focusing frequency; to the best knowledge of the authors, it means that a fundamental component of the transformation matrix across all frequency bins may exhibit the different core component, which is clearly apparent when a narrowband DOA result at some frequency is not close enough to the true DOA. A single component distortion can definitely affect the whole DOA results. Therefore, the solutions have to exhibit the exact component even though power present in a received signal at that frequency is very weak; in other words, the solution of transformation matrix have to be focused across all frequency bins instead of the pair of different frequencies.
Therefore, the purpose of this paper is to investigate an alternative for estimating wideband 2D DOAs in a more efficient way. We consider wideband sources as sound sources, such as human speeches and musical sounds. In order to estimate the wideband DOAs, we address the issue of transforming multiple narrowband cross-correlation matrices for all frequency bins into a wideband cross-correlation matrix. Additionally, our study is inspired by a computational model of CSS with further improvement of a linear transformation procedure [
36,
37,
38,
39,
40]. Since the transformation procedures of CSS are only focused on subspace between current and reference frequency as previously mentioned, we propose a new transformation procedure which focus all frequency bins simultaneously and efficiently. The higher-order generalized singular value decomposition (HOGSVD) is firstly used to achieve this important issue [
42]. By employing HOGSVD of arrays of the new unique cross-correlation matrix, where elements in the row and column positions are a sample cross-correlation matrix between received signal and itself on two distinct frequencies, the new transformation procedure no longer require any process of DOA preliminary estimation. Finally, the wideband cross-correlation matrix is constructed via the proposed transformation procedure, and the wideband DOAs can be estimated by employing any subspace-based technique for estimating narrowband DOAs, but using this wideband correlation matrix instead of the narrowband correlation matrix. Therefore, the proposed framework enables cutting-edge studies in the recent narrowband subspace methods to estimate DOA of the wideband sources directly, which result in reducing computational complexity and facilitating the estimation algorithm. Practical examples, such as 2D-MUSIC and ESPRIT with an L-shaped array, are presented to showcase its applicability and effectiveness.
The rest of this paper is organized as follows.
Section 2 presents the array signal model, basic assumptions and problem formulation for transforming narrowband sample cross-correlation matrices for all frequency bins into a single matrix, which is called wideband cross-correlation matrix. Description of the new transformation procedure is introduced in
Section 3.1 and its effective solution via HOGSVD in
Section 3.2.
Section 3.3 provide a description of the proposed framework for estimating wideband DOAs by combining the proposed transformation procedure along with a scheme of estimating DOAs in a recent narrowband subspace method, and its practical examples are presented in
Section 3.3.1 and
Section 3.3.2. The simulation and experimental results are compared with the several existing methods in
Section 4 and
Section 5. Finally,
Section 6 concludes this paper.
4. Numerical Simulations
In this section, performances of fusion methods by using the proposed framework are demonstrated in four types of the following scenarios: (1) a performance of selected method and the proposed methods with respect to source types, (2) the performance with respect to the number of microphone elements, (3) the performance with considering automatic pairing of the
x and
z subarray angles, and (4) the performance under a reverberation environment. Scenarios 1, 2 and 4 have to find DOA of
x and
z subarray angles separately by using the data model in Equation (
2). Whereas Scenario 3 has to find DOA of
x and
z subarray angles simultaneously with considering automatic pairing, by using the data model in Equation (
1). We provided the simulation tests of the proposed methods in comparison to following methods: IMUSIC [
31], TOFS [
32], TOPS [
33], Squared-TOPS [
34], WS-TOPS [
35]. Note that the CSS-based methods are excluded in these tests; this is because unintended biases, causing by a process of DOA preliminary estimation, should be taken into consideration to other candidate methods as discussed in the literature [
31,
32,
33,
41].
To measure the overall performance of estimating the
x and
z subarray angles for each scenario, the root-mean-square-error (RMSE) and standard division (SD) are defined as the following equations;
where
K is the source number,
J is the number of trials,
represent the estimated
x and
z subarray angles each trial,
represent an average of the estimated
x and
z subarray angles, and
represent true
x and
z subarray angles.
Computer simulations were carried out in Matlab® R2017a, using PC with Debian GNU/Linux 9.4 × 86_64, Intel® Core™ i5-4590 CPU 3.30 GHz, 16G RAM, Intel® Math Kernel Library 11.3.1 on BLAS and LAPACK 3.5.0. Each scenario is repeated 100 times, and simulation parameters are chosen as follows: sampling frequency is 48 kHz, an output of each microphone is captured at 1 s, speed of sound c is 343 m/s, the spacing of microphone elements d is 5 cm, STFT focusing frequency range is from 0.1 to 16 kHz, the reference frequency is 3.43 kHz. Note that we used perturbations of the true angles by adding Gaussian random noise.
4.1. Scenario 1: Performance with Respect to Source Types
Figure 2 and
Figure 3 showed performance comparisons of the selected methods and the proposed methods in term of RMSE and SD over a range of SNR. The proposed methods are the modified MUSIC in Equation (
45) and ESPRIT in Equations (
50)–(
52). The number of microphone elements each subarray is six, and the three uncorrelated source angles
are placed at
,
and
. In
Figure 2a and
Figure 3a, sources are human speeches. Sources in
Figure 2b and
Figure 3b are recorded sound on a piano comprising various monochromatic notes and containing sampling frequency range up to 48 kHz. Note that all sources are not stationary signals. The results in
Figure 2 and
Figure 3 showed that the proposed method with ESPRIT can efficiently handle both source types compared to other candidate methods with acceptable SNR ranges. Subsequently, it is interesting to take a close look at 40 dB SNR in
Figure 2 and
Figure 3 where IMUSIC, TOFS, the proposed method with MUSIC and ESPRIT showed very low RMSE, which could attest to good DOA estimation. When decreasing the SNR to 25 dB, IMUSIC and TOFS begin to demonstrate worse RMSE quality, which is much higher than the proposed methods, and it is clearly seen when decreasing the SNR to 10 dB that all tested methods are significantly dominated, but the proposed method with ESPRIT is still associated with more satisfactory results compared to using other methods. It should be mentioned that IMUSIC and TOFS require the number of sensor elements to be much higher than the number of sources to achieve fairly good results [
31,
32,
33,
41]. Hence, the simulation results in
Figure 2 and
Figure 3 are able to provide evidence that the proposed methods perform better in estimation than other candidate methods when the incident sources are wideband and non-stationary signals. Although the performances of the proposed method with MUSIC is also dominated by the noises, the overall performances is still more effective than other methods.
4.2. Scenario 2: Performance with Respect to the Number of Microphone Elements
Figure 4 and
Figure 5 illustrates performance comparisons of the selected methods and the proposed methods in term of RMSE and SD over a range of SNR. The three uncorrelated source angles are human speeches, and are placed as previously used. Firstly, let us start by looking at the case of twelve microphones in
Figure 4c and
Figure 5c. IMUSIC, TOFS and WS-TOPS exhibited remarkably low levels of RMSE in the SNR range from 15 to 30 dB; this is because their performances dramatically depend on the number of sensor elements more than the number of sources [
31,
32,
33,
41]. Likewise, the proposed method with MUSIC and ESPRIT also demonstrated very low RMSE, which may imply that the performance of the proposed methods, IMUSIC, TOFS and WS-TOPS are especially effective for a wideband DOA estimation. However, the low number of microphone elements should be considered for providing more practical applications. In the case of eight microphones in each subarray, the performances of the selected methods are dominated by the number of microphone elements as illustrated in
Figure 4b and
Figure 5b. Furthermore, the performances of selected methods are dramatically degraded when employing four microphones as illustrated in
Figure 4a and
Figure 5a. The relevant reason is that an undesirable false peak in the spatial spectrum of the selected methods occurred, caused by the perturbation of noise; when power of the noise at some frequency is high or grater than source power, the orthogonality between the noise subspace and search space at that frequency may be not sufficient to prevent the false-alarm peaks [
41]. On the contrary, RMSE performance of the proposed methods are also dominated, but less than the other methods, by exhibiting the subspace for all frequency bins simultaneously as shown in
Section 3. Therefore, the proposed methods provide substantially better RMSE performance than the other methods, which implies that dependency between the number of microphone elements and sources can be relaxed. This substantial ability is more meaningful for many practical applications.
4.3. Scenario 3: Performance with Considering Automatic Pairing
This scenario estimated the DOA of
x and
z subarray angles simultaneously with considering automatic pairing and following the data model in Equation (
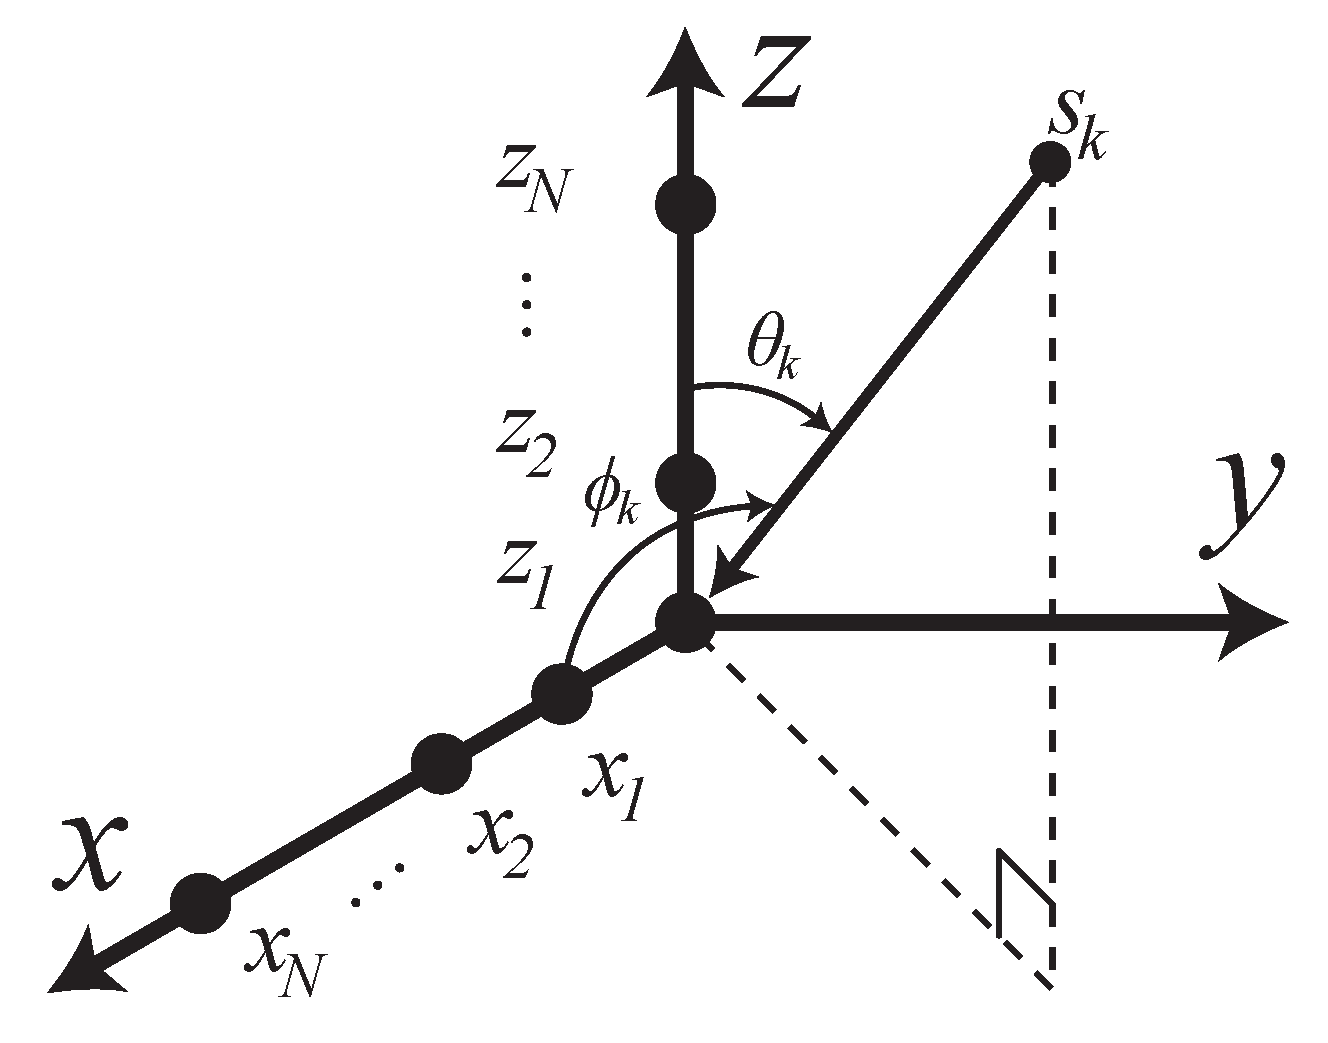
1). As the L-shaped array structure consisting of two ULAs as illustrated in
Figure 1, some research works estimate the DOA of
x and
z subarray angles separately by implementing 1D DOA estimation for each ULA [
17,
18,
19,
20,
21,
22,
23,
24,
25,
26]. When utilizing more than one source, these algorithms require an additional angle pair matching procedure to map the relationship between the two independent subarray angles. For instance, finding the corresponding angle pairs by rearranging the alignment of
with a fixed right-hand side of the array manifolds of the
z-subarray in the sample cross-covariance matrix [
52]. It should be noted that a pair-matching procedure may results in a performance degradation caused by pair-matching error. In order to achieve the automatic pairing without the pair-matching procedure, we selected the modified 2D-MUSIC in Equation (
44) as the proposed method in this scenario. Furthermore, TOPS, Squared-TOPS, WS-TOPS are excluded in these tests by the fact that the methods have only supported the ULA model. Note that the 2D peak finding algorithm was employed on 2D-IMUSIC, 2D-TOFS and the proposed method.
Figure 6 and
Figure 7 showed performance comparisons of 2D-IMUSIC, 2D-TOFS and the proposed method in term of RMSE and SD over a range of SNR, where the number of microphone elements including all subarray is eight, the three uncorrelated source angles are human speeches, and are placed as previously used.
Figure 6 indicates that the proposed method with 2D-MUSIC exhibits extremely similar overall performances to 2D-IMUSIC and 2D-TOFS when the SNR increases to more than 10 dB; however, computational burden of the proposed method can be significantly lower than those of the other methods, which
Section 4.5 will reveal further insight.
4.4. Scenario 4: Performance under Reverberation Environment
In this scenario, we compared RMSE and SD performances of the proposed methods to other methods with respect to reverberation time. This scenario estimated DOA of
x and
z subarray angles separately by using the data model in Equation (
2) without considering automatic pairing. The proposed methods in this scenario are the modified MUSIC in Equation (
45) and ESPRIT on Equations (
50)–(
52). The reverberations were simulated by the following procedure [
53], and its simulated wall absorption coefficients are shown in
Table 3, where the dimensions of enclosure room is
m, a measurement protocol of reverberation time is RT60, and the reverberation time is from 200 to 1000 ms. The three uncorrelated source angles are employed in the same way as previously used, and the number of microphone elements in each subarray is twelve.
Figure 8 illustrated performance comparisons of the selected methods and the proposed methods, where a color of the graph on
Figure 8a denotes RMSE, whereas a color of the graph on
Figure 8b denotes SD estimation performance. The vertical axis is represented as the reverberation time and horizontal axis is represented as a range of SNR. Simulation results in
Figure 8 indicated that reverberation has strong effects on RMSE and SD performances in both of the selected methods and the proposed methods, and the performances decreased more significantly at the high noise levels and the long reverberation times. Since the reverberation time is decreasing, all selected methods begin to demonstrate low RMSE. It means that the trade-off between the robustness of reverberation and SNR should be considered deeply in actual applications, for instance, applying a reverberation cancellation technique or a noise cancellation technique to provide much more reliable estimation performances of both RMSE and SD. The proposed methods, however, largely outperform the other methods with respect to the reverberation time index and SNR level range between 10 and 40 dB without considering the trade-off. This can support that the performance of the proposed methods can be especially effective for a wideband DOA estimation under a reverberant environment.
4.5. Computational Complexity
Computational complexity of the proposed methods was evaluated using execution time measurement under a stable environment. We provided a computational complexity in comparison with the following cases: (1) calculating DOAs of
x and
z subarray angles separately as shown in
Figure 9a, and (2) calculating the DOAs of both subarray angles simultaneously as shown in
Figure 9b. Note that computational burdens of a peak searching algorithm are relevant in this study, where the number of searching angle in each subarray is 180. It is apparently seen in
Figure 9 that computation time of the other methods presented higher growth rates than the proposed methods. This is because the peak searching algorithm execution time is potentially high, and almost all selected methods require intensive computations by testing the orthogonality of subspace and search space of narrowband sample cross-correlation matrices for all frequency bins, which results in high computation costs. On the contrary, the proposed methods transform all narrowband sample cross-correlation matrices across all frequency bins into a single matrix as shown in Equations (
33)–(
35), and this matrix contains useful information of source cross-correlation matrices across all frequency bins as
; in other words, the orthogonality testing of subspace and search space can be done by using the wideband cross-correlation matrix in Equations (
33)–(
35) instead of narrowband sample cross-correlation matrices for all frequency bins. Therefore, the computational complexity of the proposed methods remarkably less than the other methods, which is confirmed by the test results in
Figure 9.
5. Experimental Results
In this section, experiments were carried out to examine the performance of the proposed methods. Experimental parameters were chosen as the previous simulations, except as follows: We used human speakers as sources of the original speech with random sentences. Their speeches were recorded for 20 runs continuously, and each record signal, approximating 1 min long, was cut into 3 s epochs. Structure of the microphone was followed by
Figure 1 and
Figure 10, and the specifications of the microphone and its recording device were followed on
Table 4. The experiment was performed in an indoor meeting room, and its dimensions are shown in
Figure 11, where sound pressure level in the meeting room in a normal situation is 46.6 dBA, and the estimated reverberation time is based on RT60 is 219 ms.
Two scenarios are considered: (1) estimating DOA of
x and
z subarray angles separately, and (2) estimating DOA of
x and
z subarray angles simultaneously while considering automatic pairing. In case of Experiment 1, the proposed methods are the modified MUSIC in Equation (
45) and ESPRIT in Equations (
50)–(
52), comparing with the following methods: IMUSIC [
31], TOFS [
32], TOPS [
33], Squared-TOPS [
34], WS-TOPS [
35]. In case of Experiment 2, the proposed method is the modified 2D-MUSIC in Equation (
44), comparing with 2D-IMUSIC [
31], and 2D-TOFS [
32].
Table 5 and
Table 6 showed performance comparisons of the selected methods and the proposed method in term of RMSE over the range of source number, where
Table 5 is for Experiment 1, and
Table 6 is for Experiment 2. The boldfaced results highlight the optimal minimum RMSE in each problem. As highlighted in
Table 5, the performance of IMUSIC exhibited the lowest RMSE when a single source was used, but the performance of the other methods including the proposed methods also exhibited similarly low RMSE in an acceptable error range. When the two sources are performed, the performance of TOPS, Squared-TOPS and WS-TOPS are directly dominated, whereas IMUSIC, TOFS and the proposed methods are slightly dominated, but still maintained sufficiently good performance. When the incident sources are increasing to three, we clearly see that the performance of IMUSIC, TOFS, TOPS, Squared-TOPS and WS-TOPS are significantly dominated by the number of incident sources, because those methods require the number of sensor elements to be much more higher than the number of sources to achieve reasonably good results, which can be verified by referring to the simulation results in
Section 4 and
Figure 4 and
Figure 5. The proposed methods, however, are able estimate the DOA of three sources effectively and better than the selected methods. The reason is that the proposed methods focus on the subspace across all frequency bins simultaneously instead of focusing each frequency band individually, which is stated in
Section 3.2. In case of Experiment 2 in
Table 6, the experiment results indicate that the proposed method with 2D-MUSIC exhibit extremely similar overall performances to 2D-IMUSIC and 2D-TOFS. As already stated in
Section 4.5, the computational complexity of the proposed method is definitely lower than 2D-IMUSIC and 2D-TOFS by the fact that those methods check the orthogonality of subspace and search space of narrowband sample cross-correlation matrices for all frequency bins, resulting in very high computation requirement. The proposed method tests the orthogonality of subspace and search space by using the wideband sample cross-correlation matrix in Equation (
33) instead of using the subspace of narrowband sample cross-correlation matrices for all frequency bins, but it is sufficient to exhibit significant effects as well as using the subspace of narrowband sample cross-correlation matrices for all frequency bins. In the end, the experimental results from
Table 5 and
Table 6 are able to provide evidence that the proposed methods have better estimating performance than other methods with respect to the number of incident sources.
Since the sound source directions are static in
Table 5 and
Table 6, it is necessary to consider moving sound sources for more practical use. In future work, we will extend the proposed method for moving sound sources, and further develop the prototype to support more realistic tasks.


