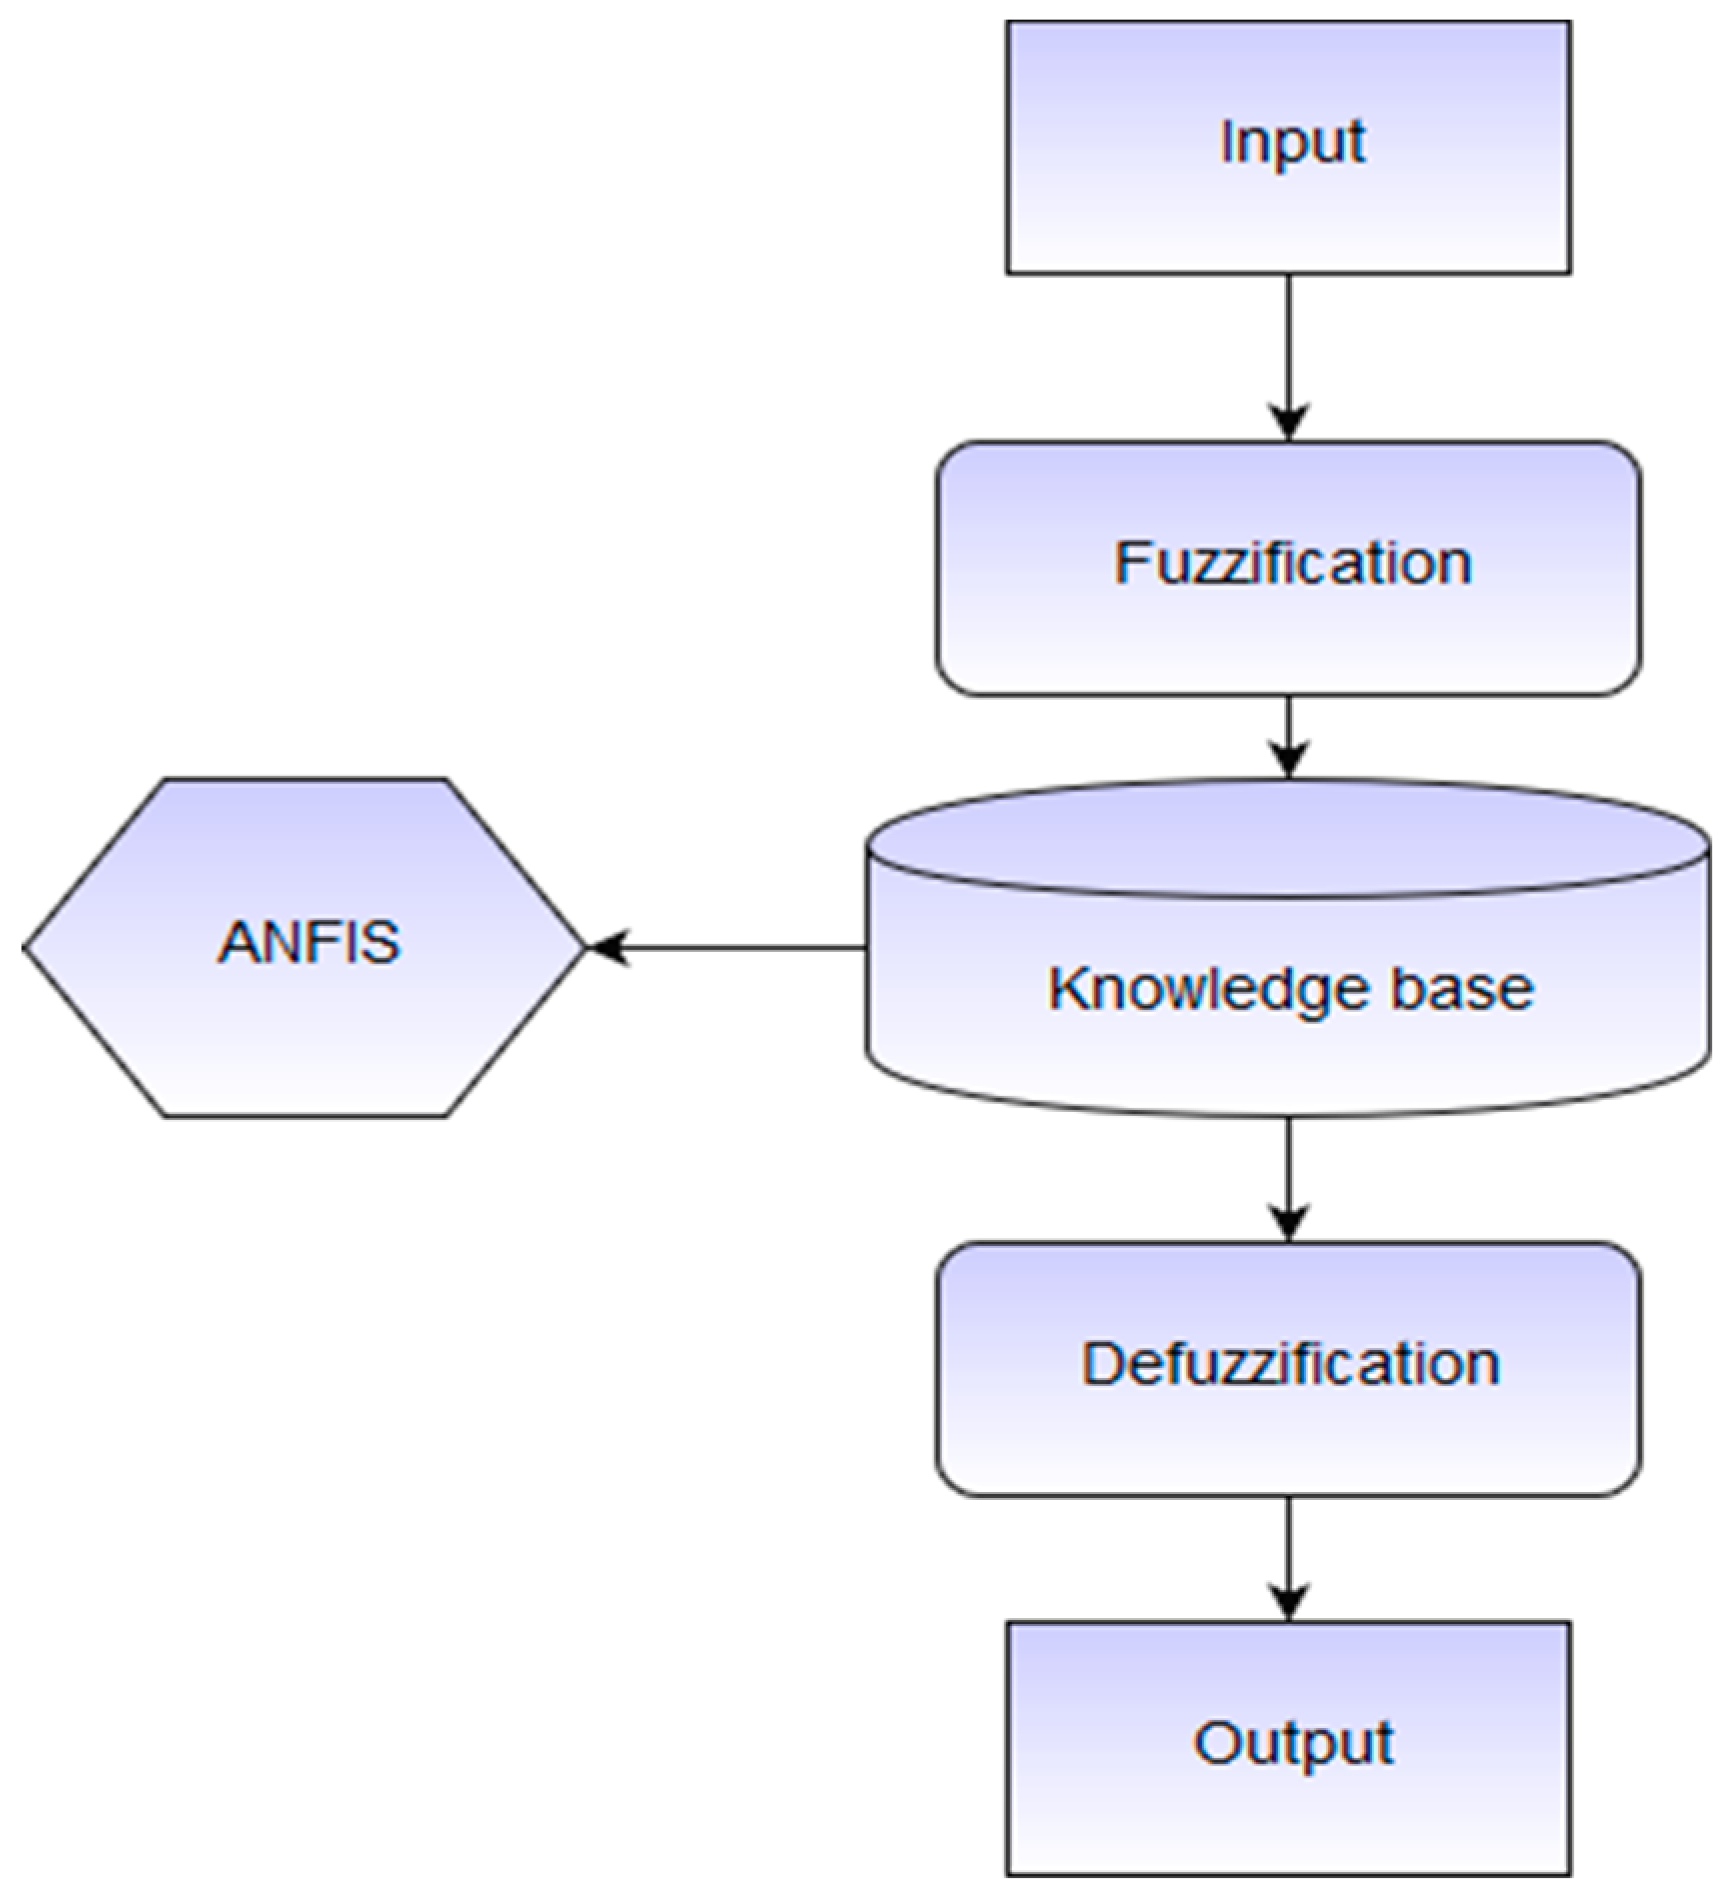
Figure 1.
Typical Adaptive neuro-fuzzy Inference System (ANFIS) units.
Figure 1.
Typical Adaptive neuro-fuzzy Inference System (ANFIS) units.
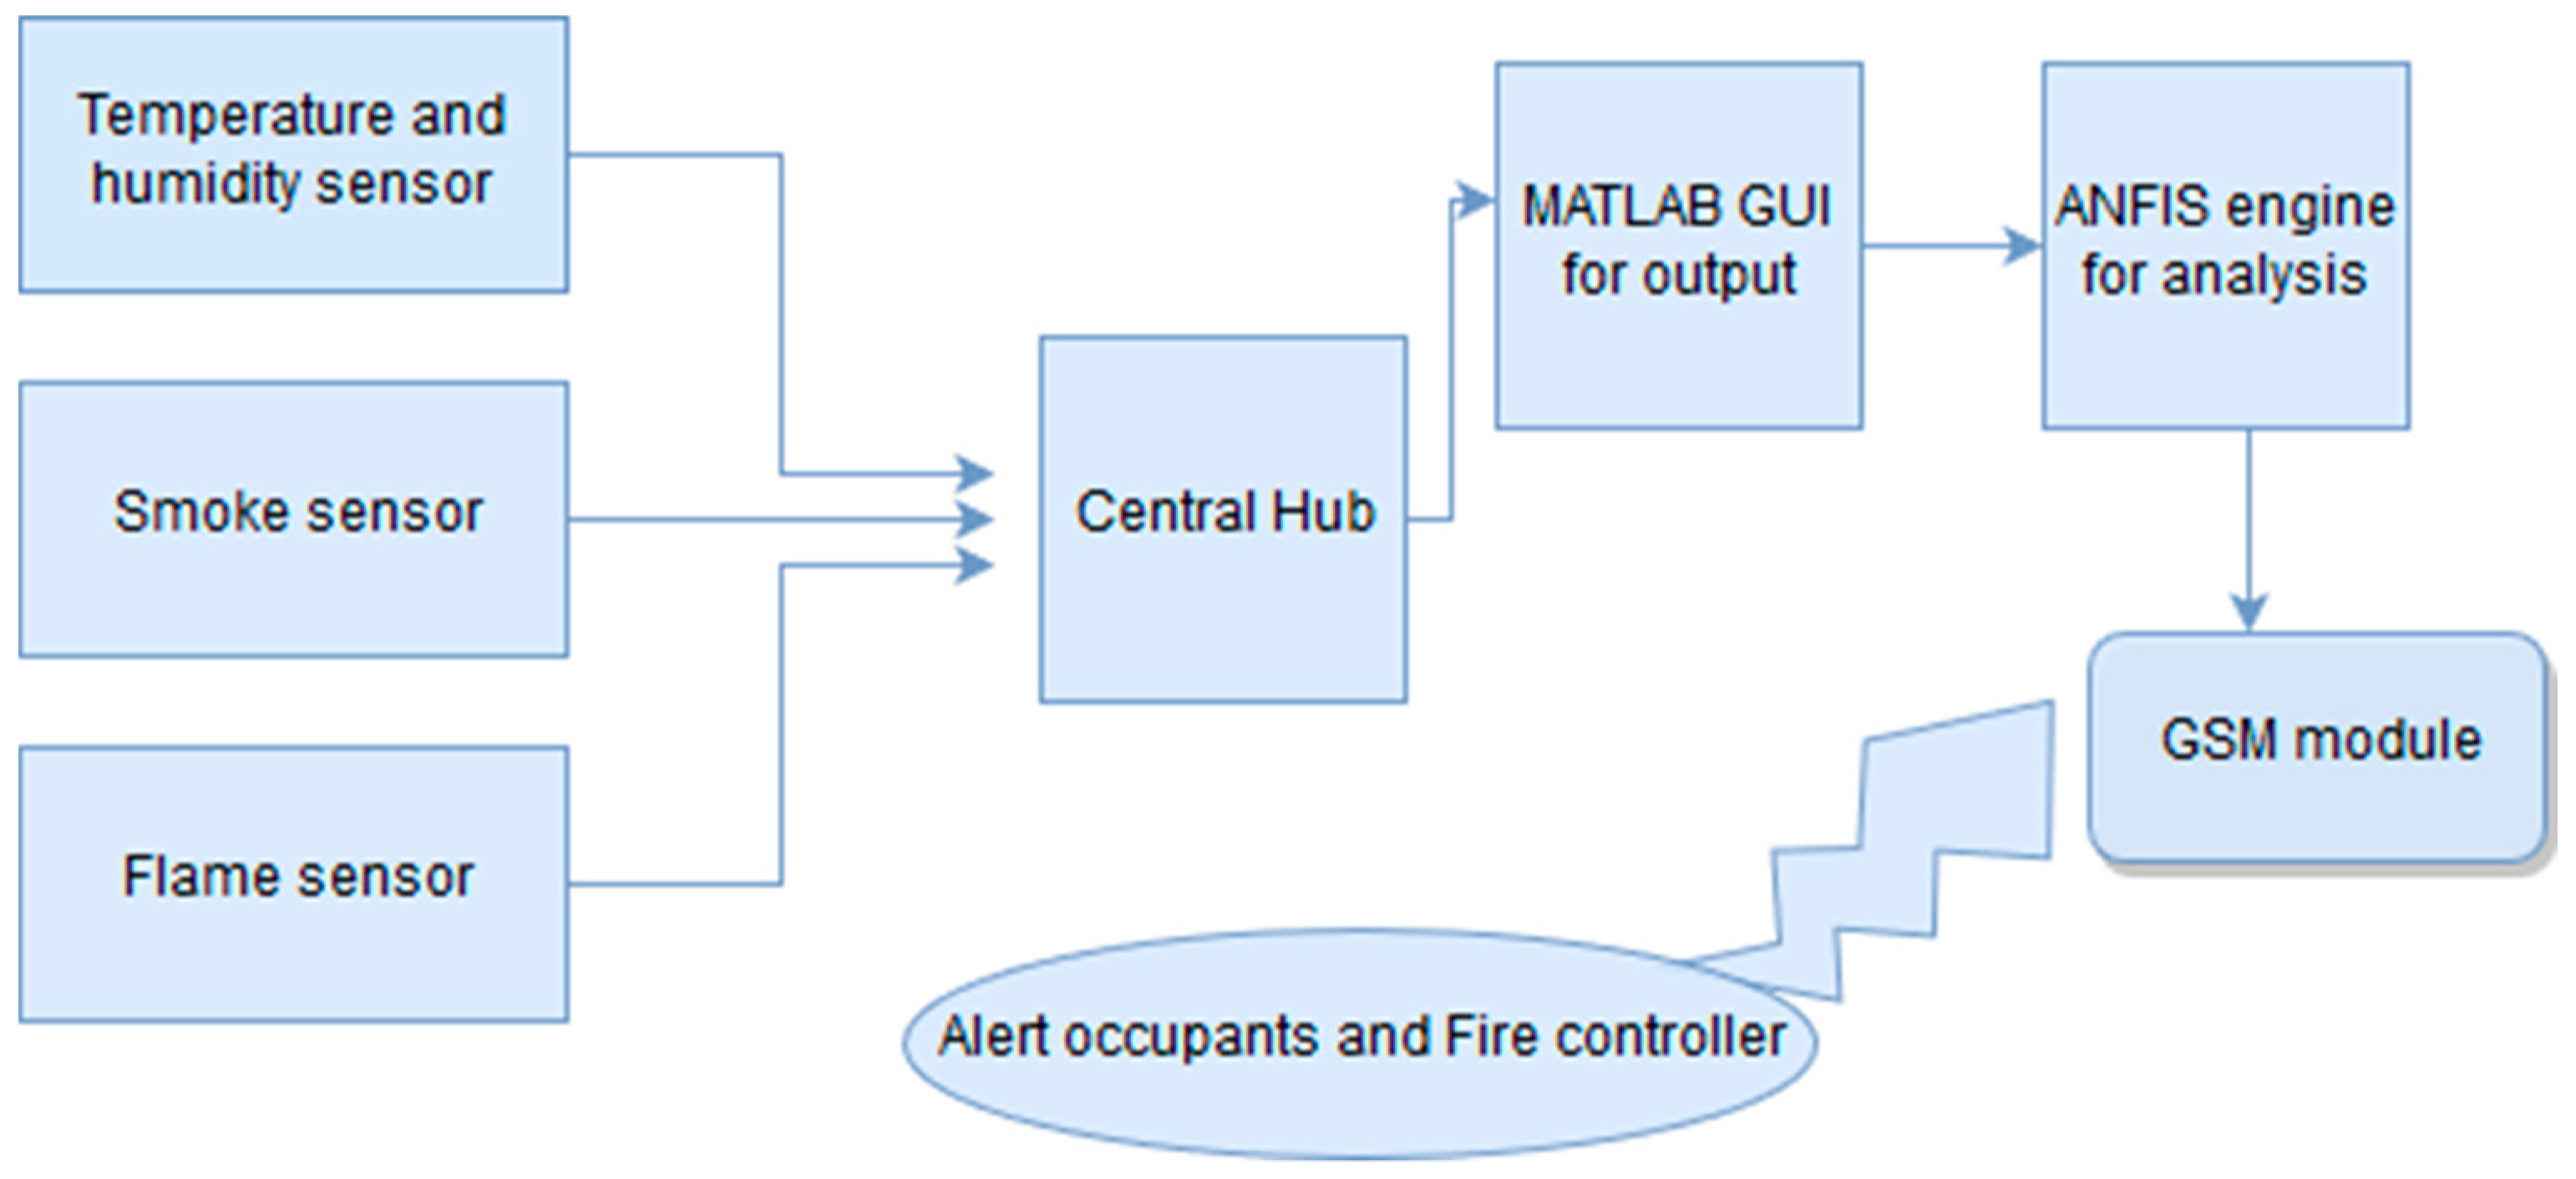
Figure 2.
The architecture of the fire alarm system.
Figure 2.
The architecture of the fire alarm system.
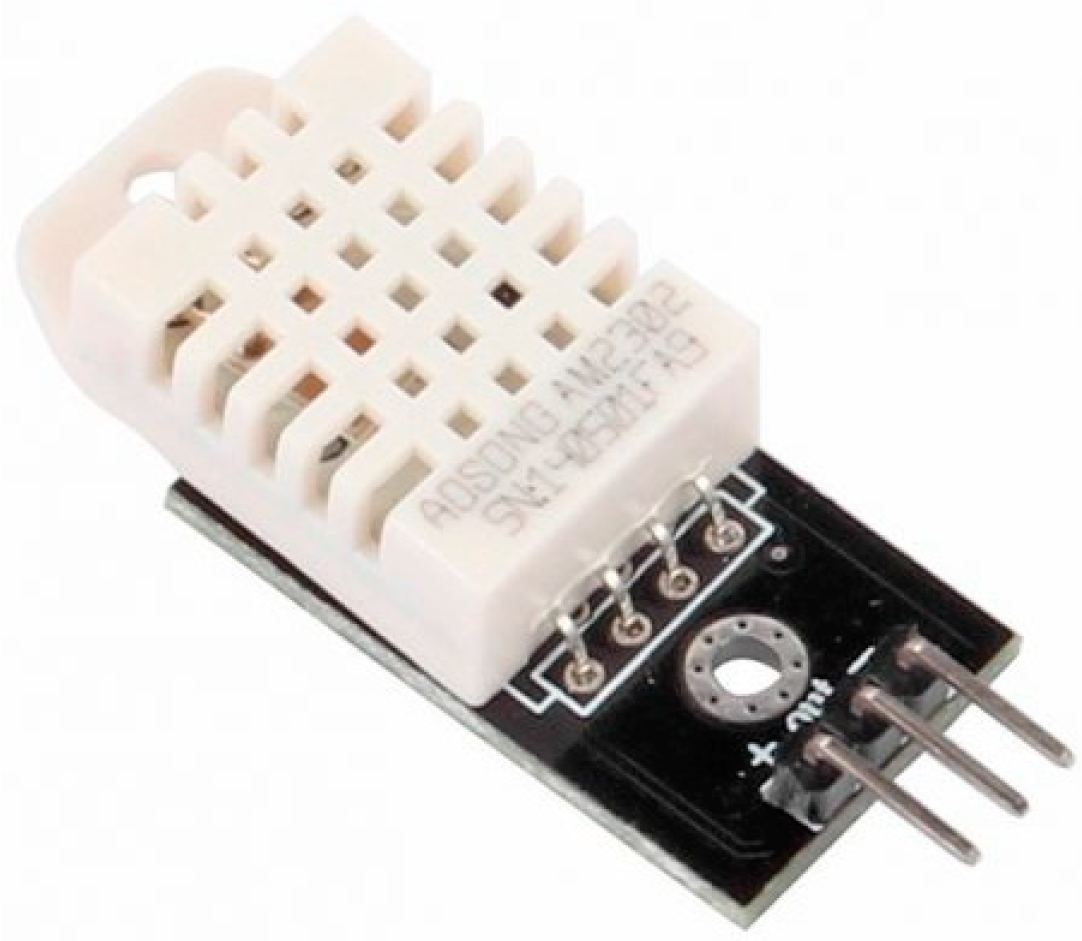
Figure 3.
Temperature and humidity sensor used in the proposed system.
Figure 3.
Temperature and humidity sensor used in the proposed system.
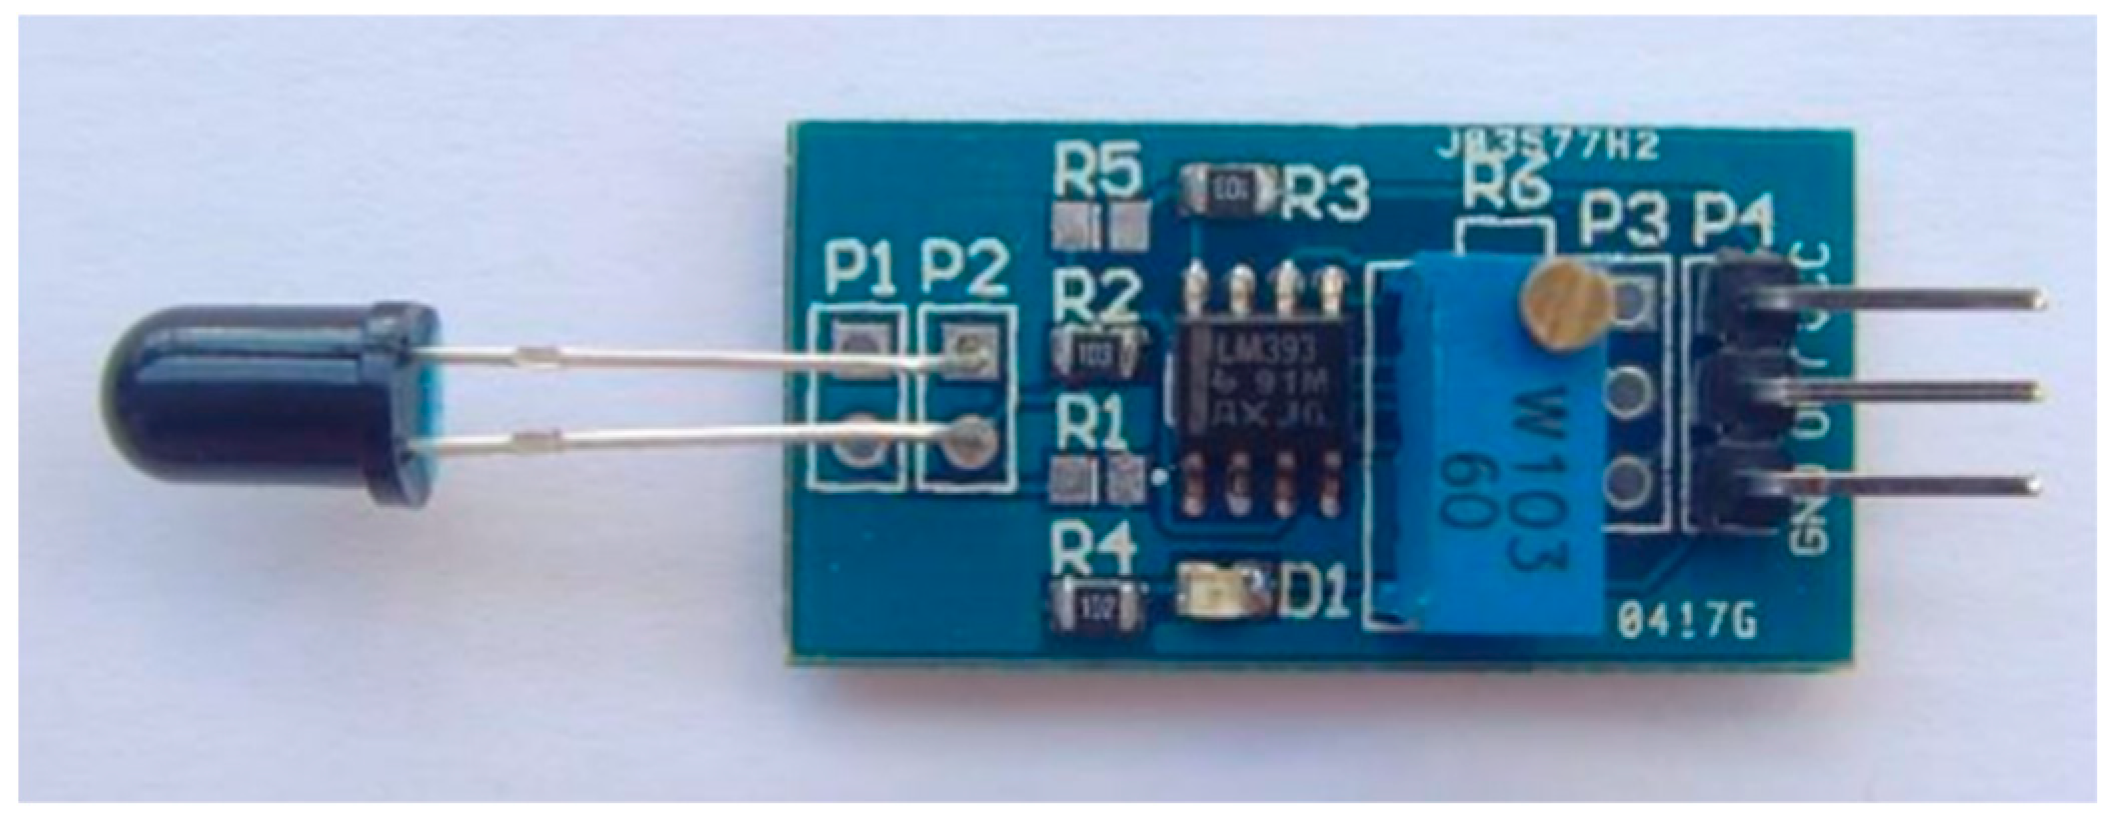
Figure 4.
Flame sensor used in the proposed system.
Figure 4.
Flame sensor used in the proposed system.
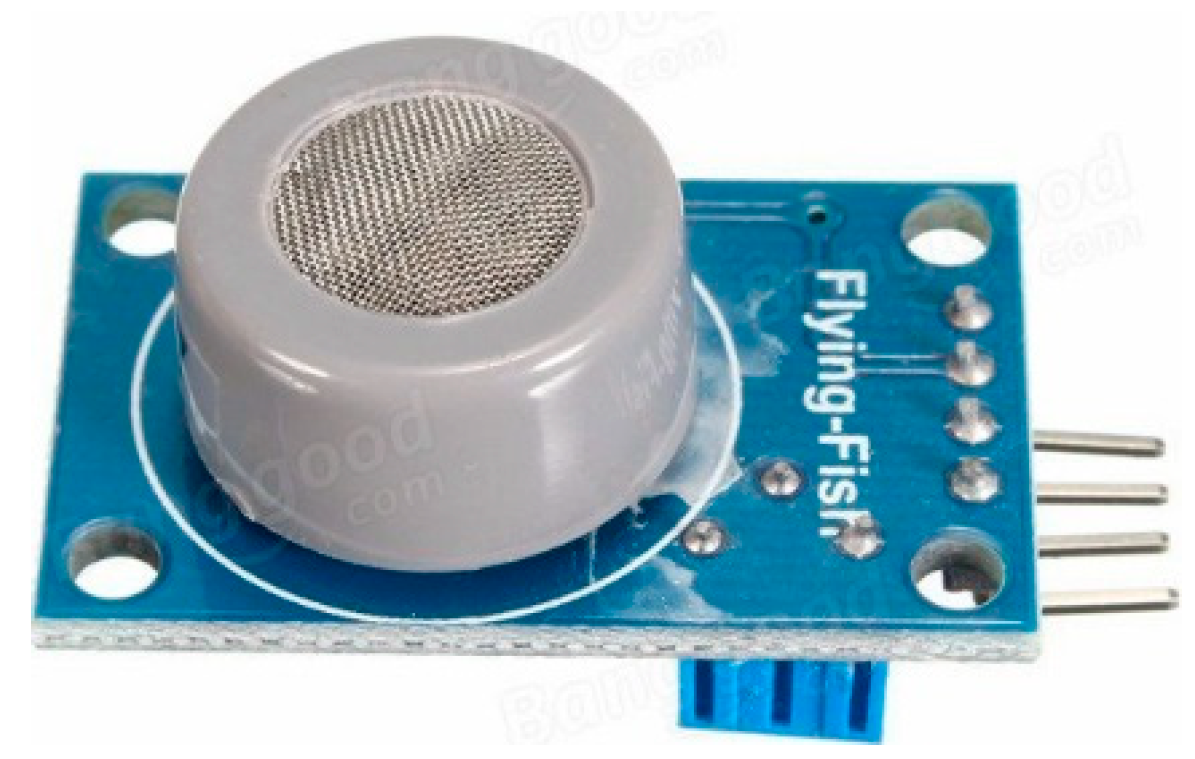
Figure 5.
Smoke sensor used in the proposed system.
Figure 5.
Smoke sensor used in the proposed system.
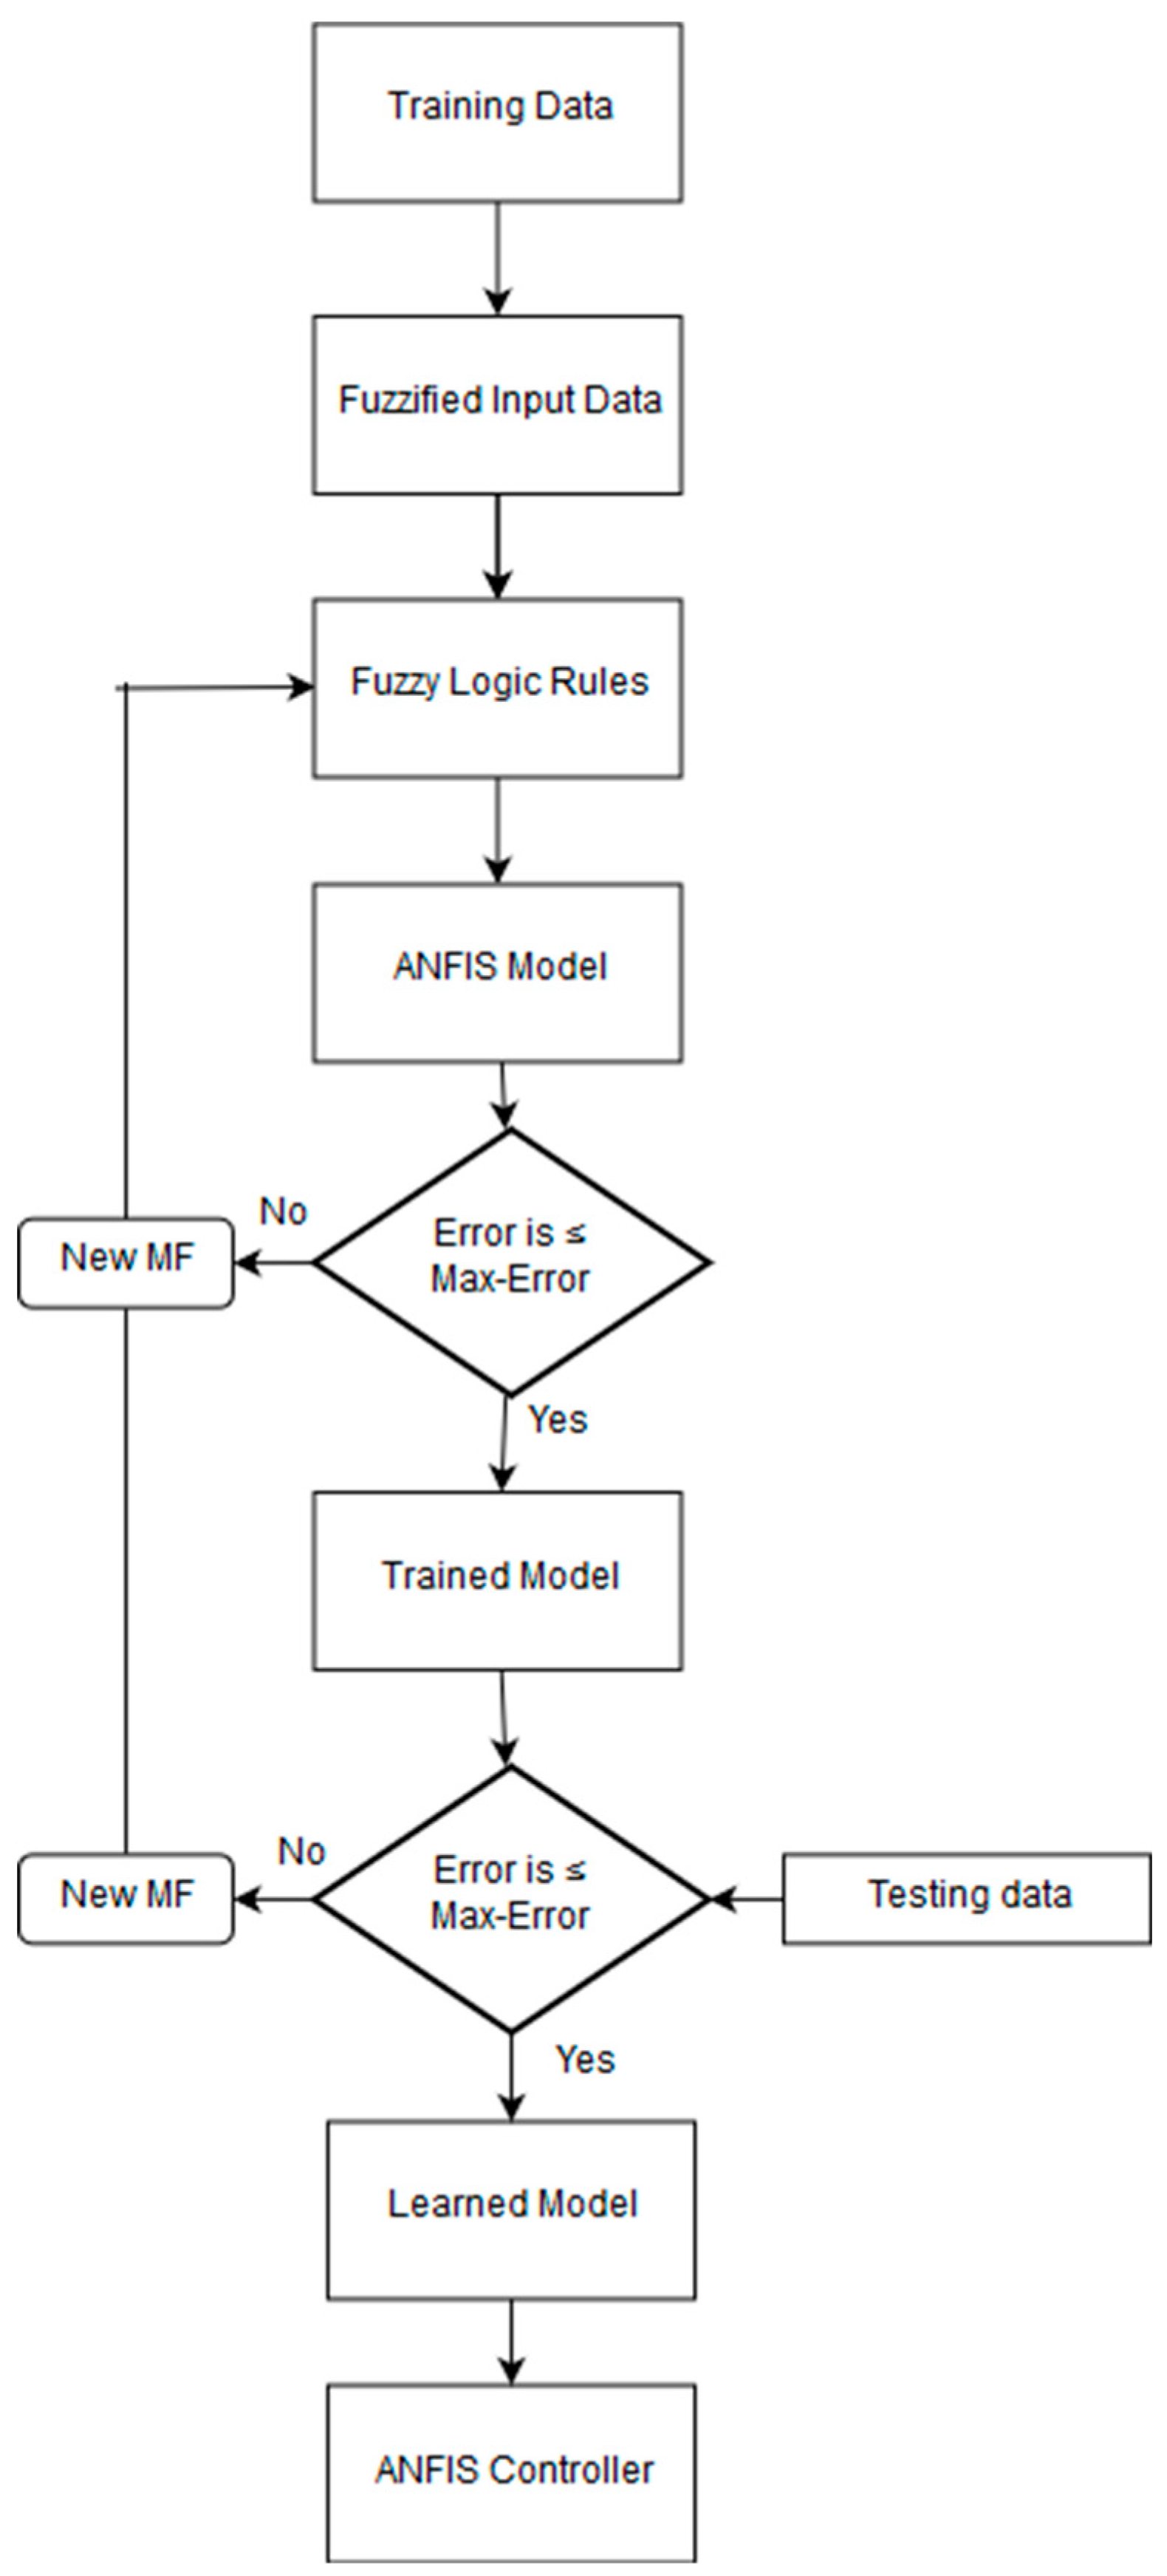
Figure 6.
Training process.
Figure 6.
Training process.
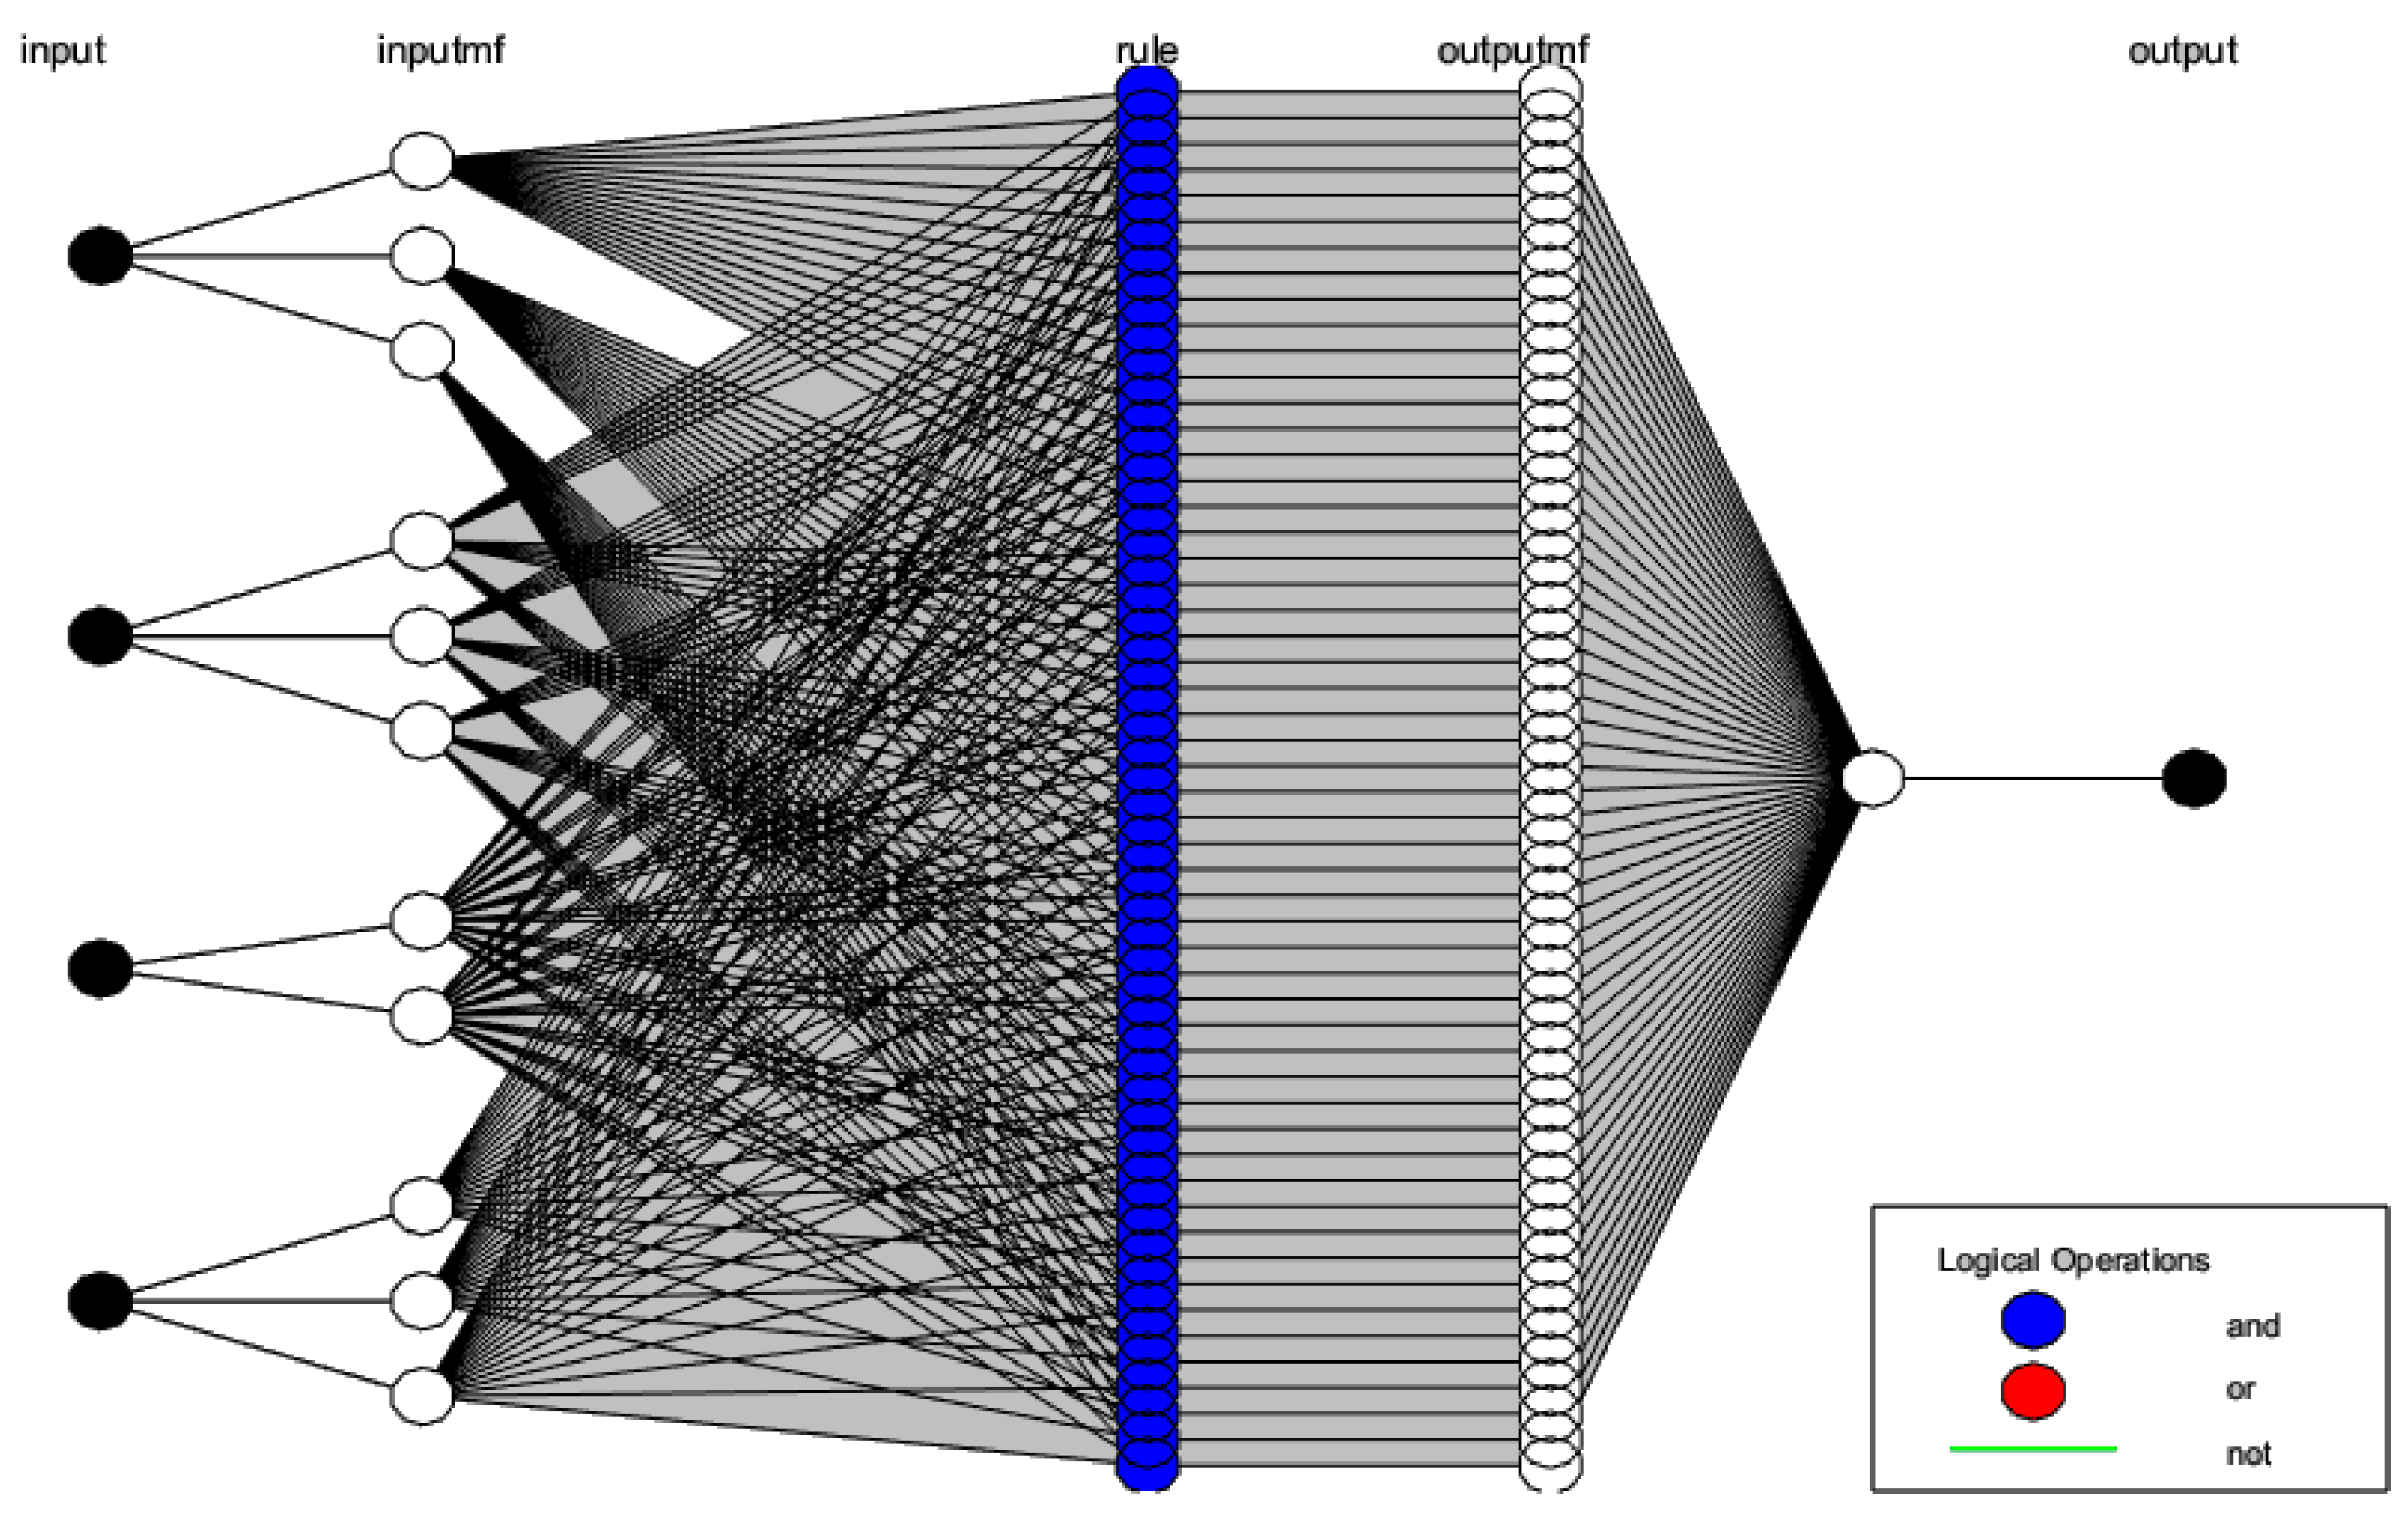
Figure 7.
The ANFIS structure.
Figure 7.
The ANFIS structure.
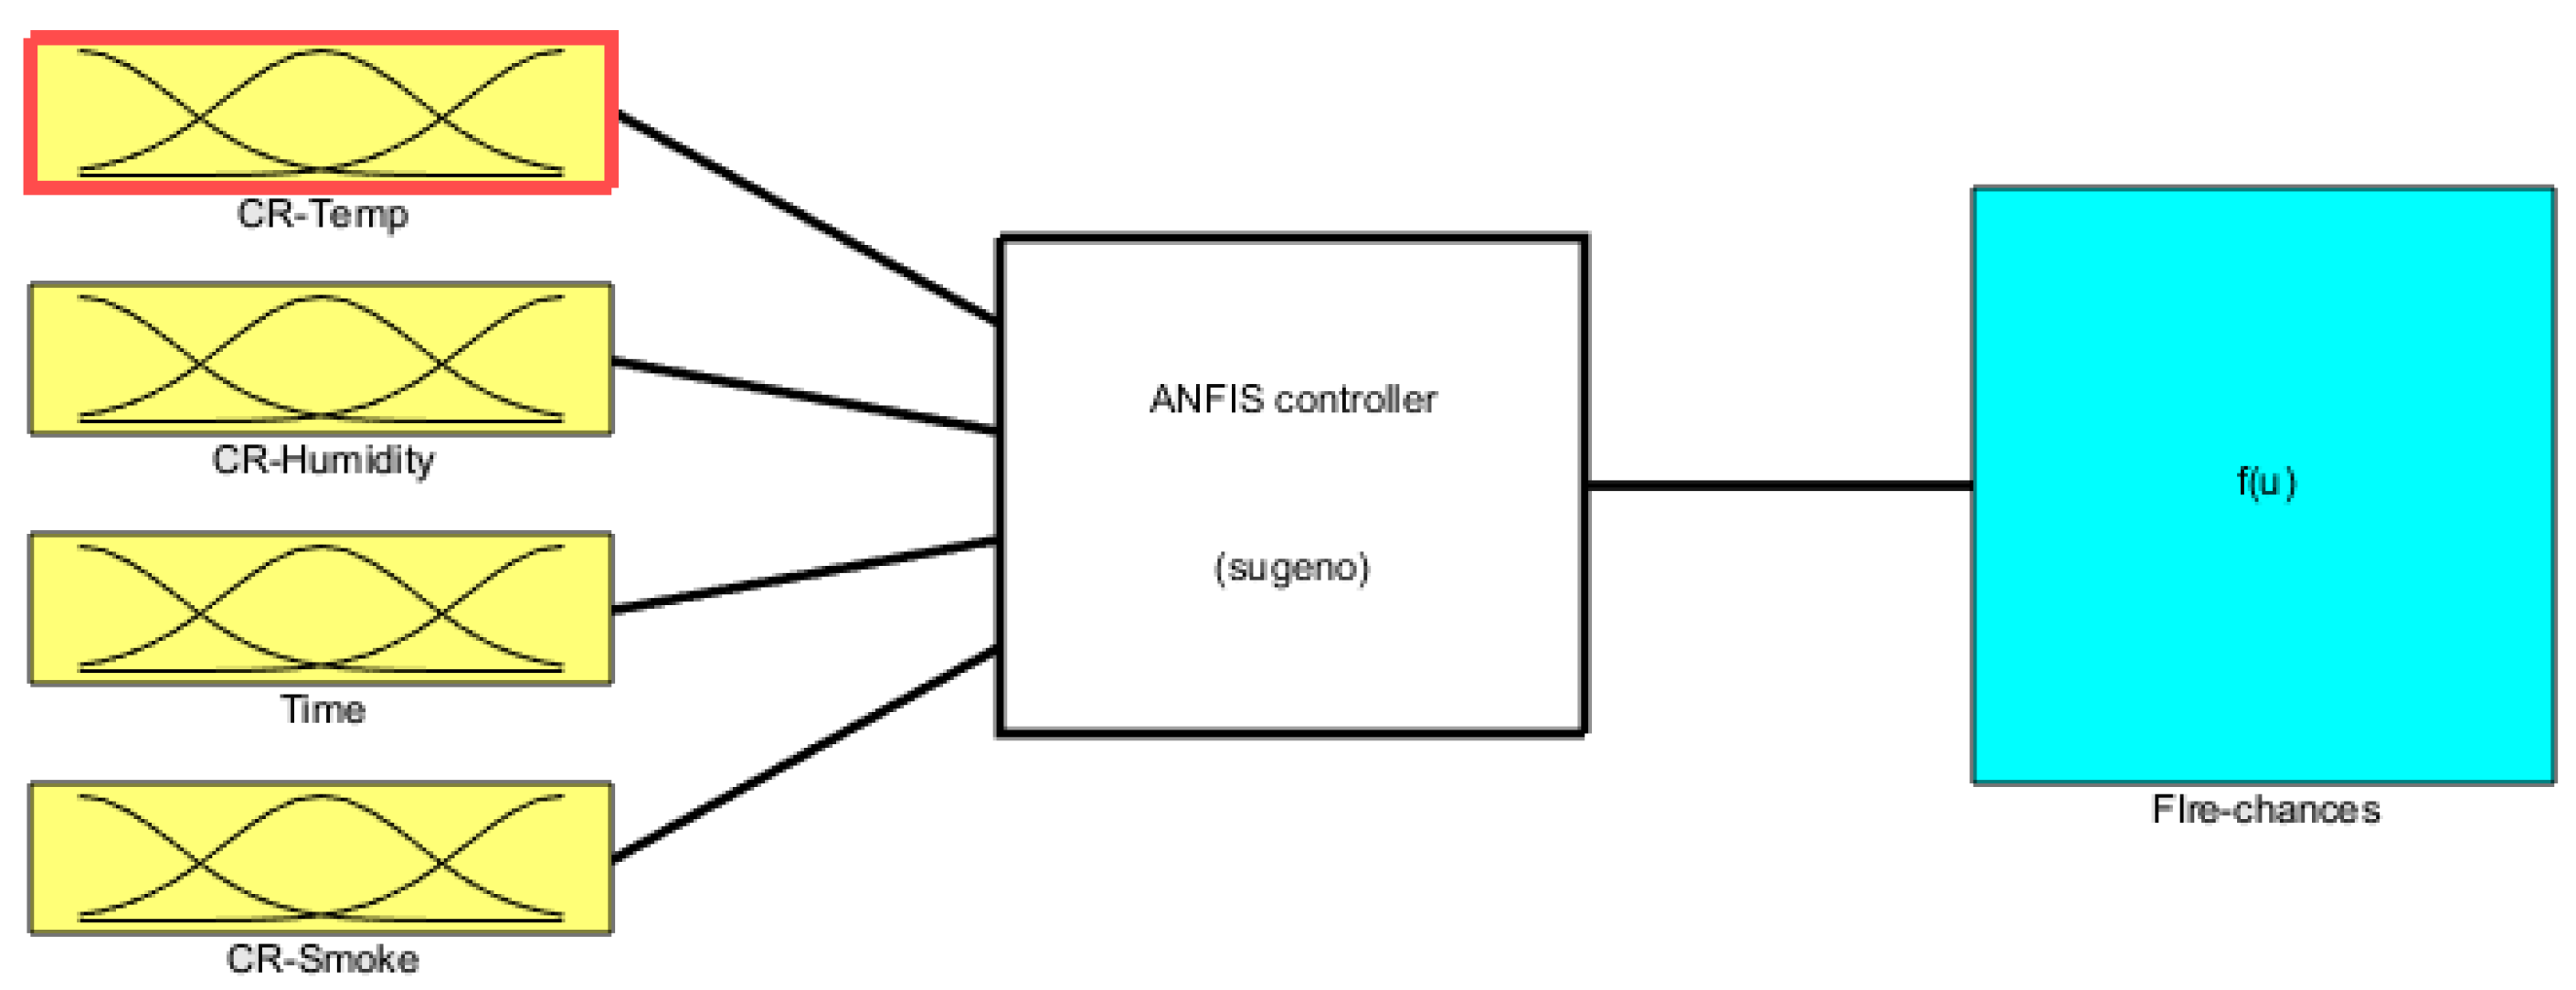
Figure 8.
ANFIS Sugeno engine.
Figure 8.
ANFIS Sugeno engine.
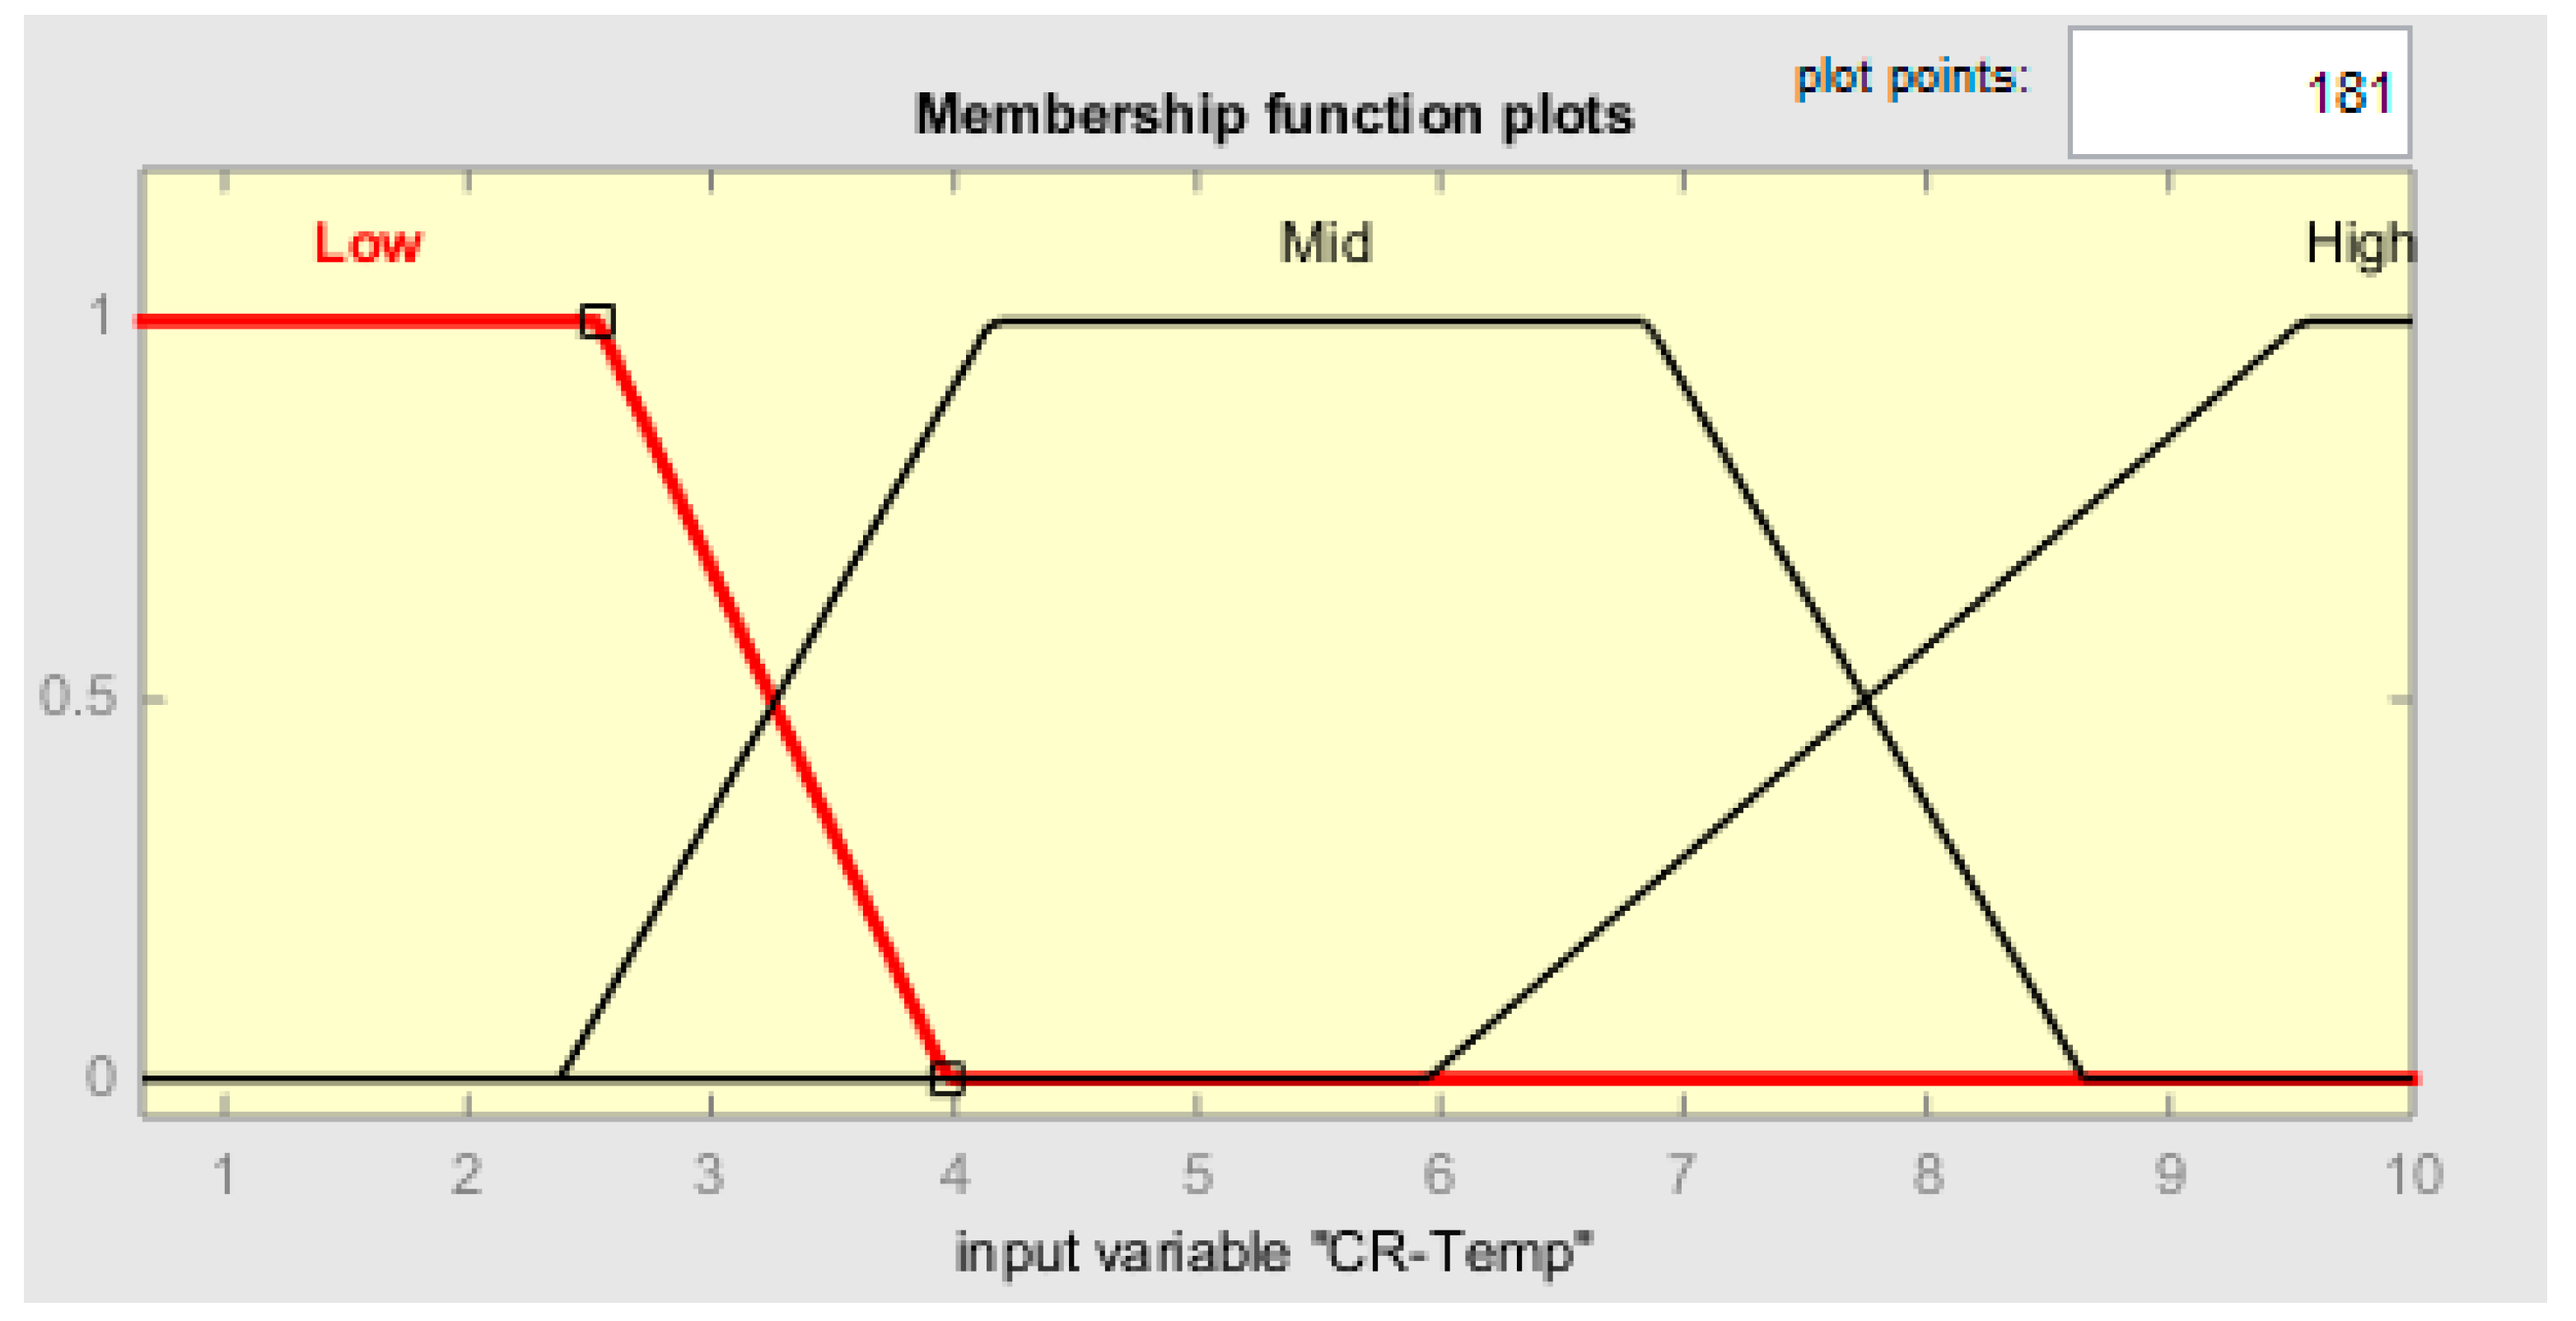
Figure 9.
CR-Temp MF plot.
Figure 9.
CR-Temp MF plot.
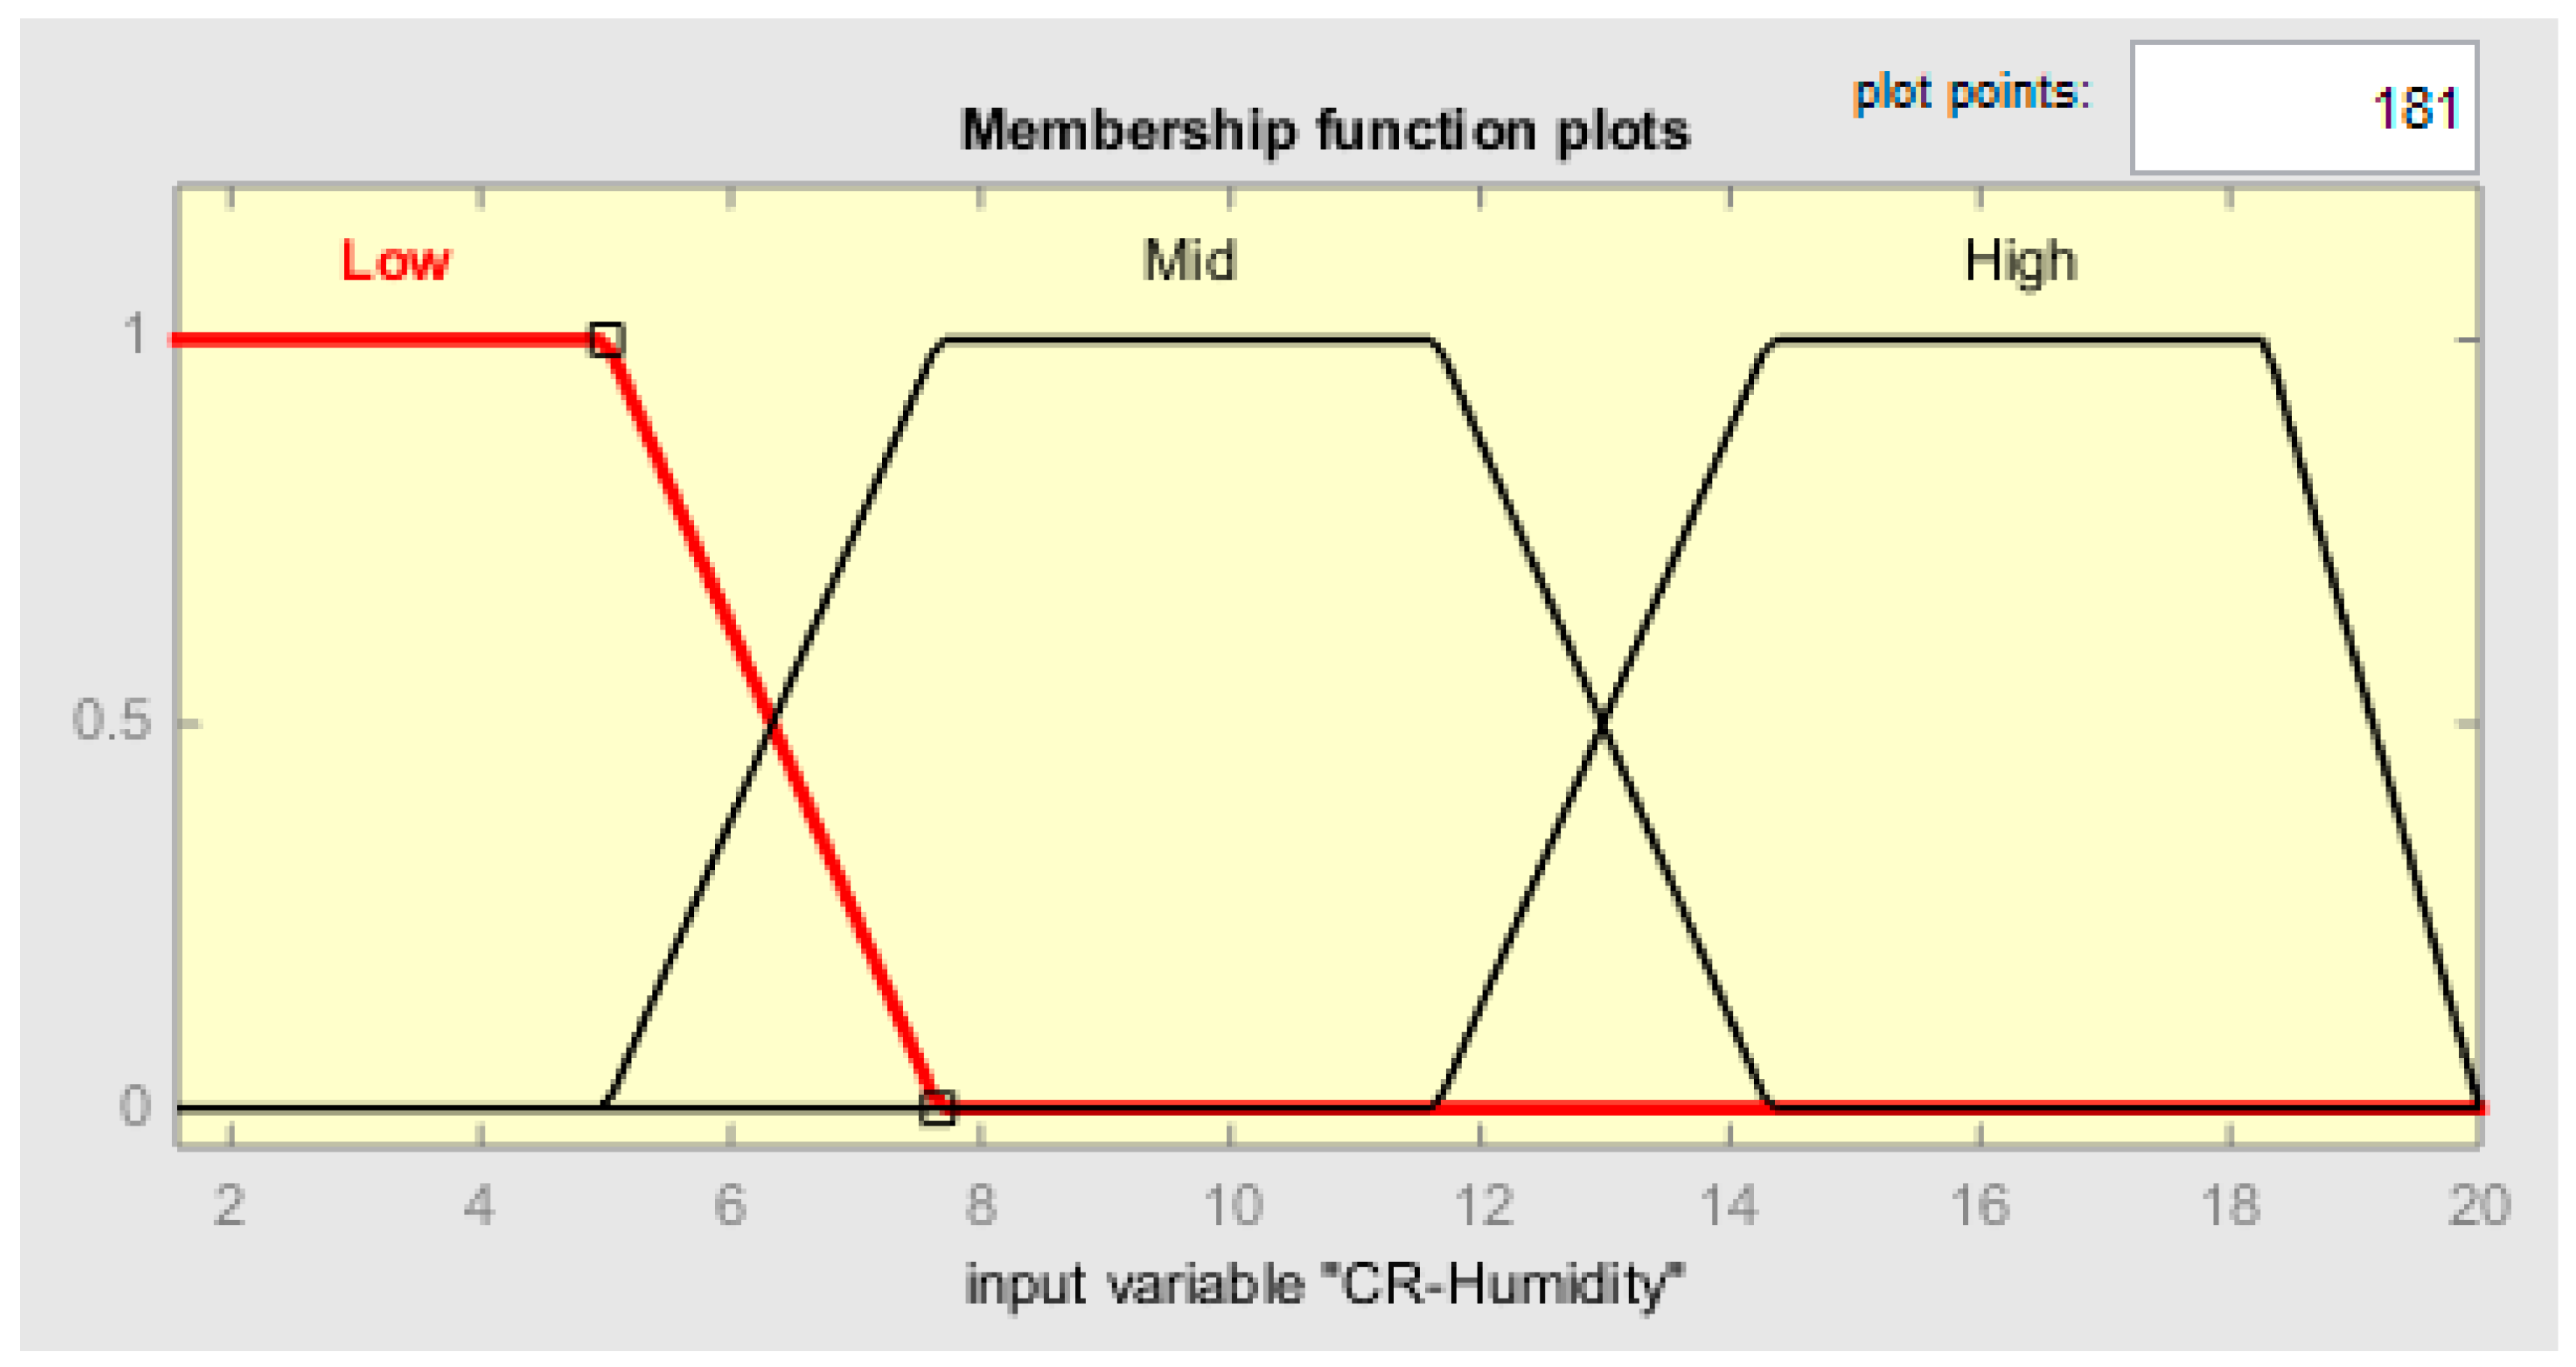
Figure 10.
MF plot for CR-Humidity.
Figure 10.
MF plot for CR-Humidity.
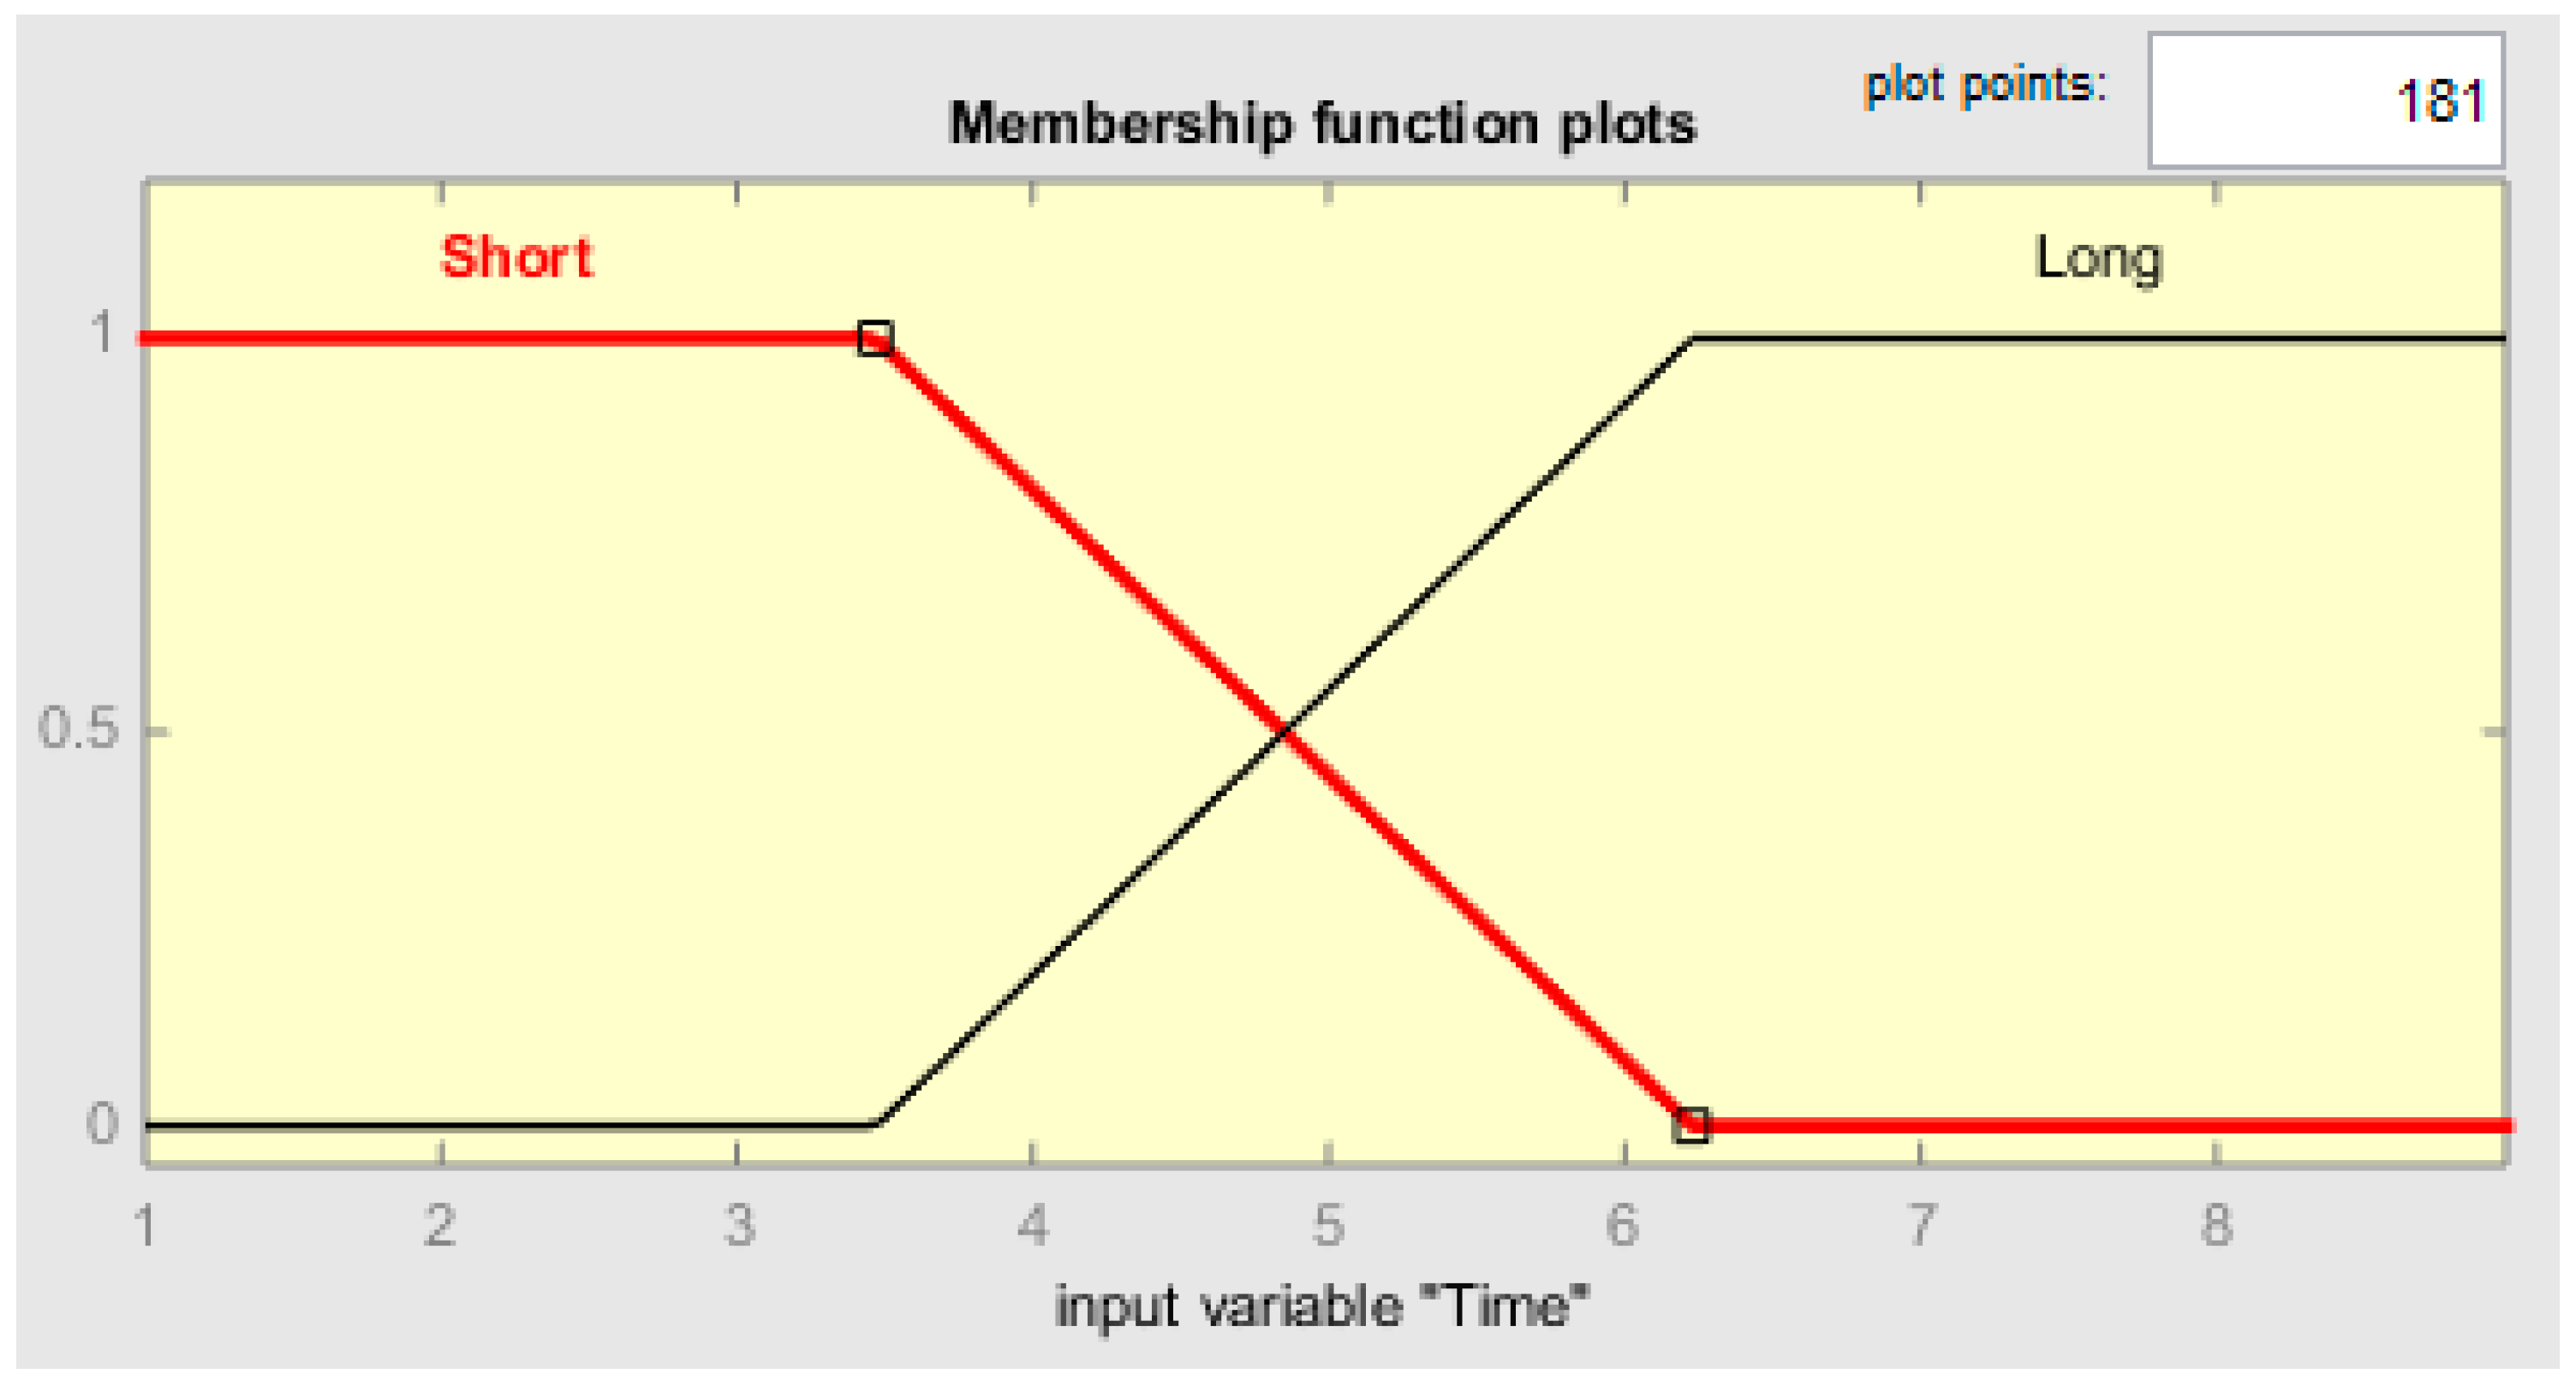
Figure 11.
MF plot for TIME.
Figure 11.
MF plot for TIME.
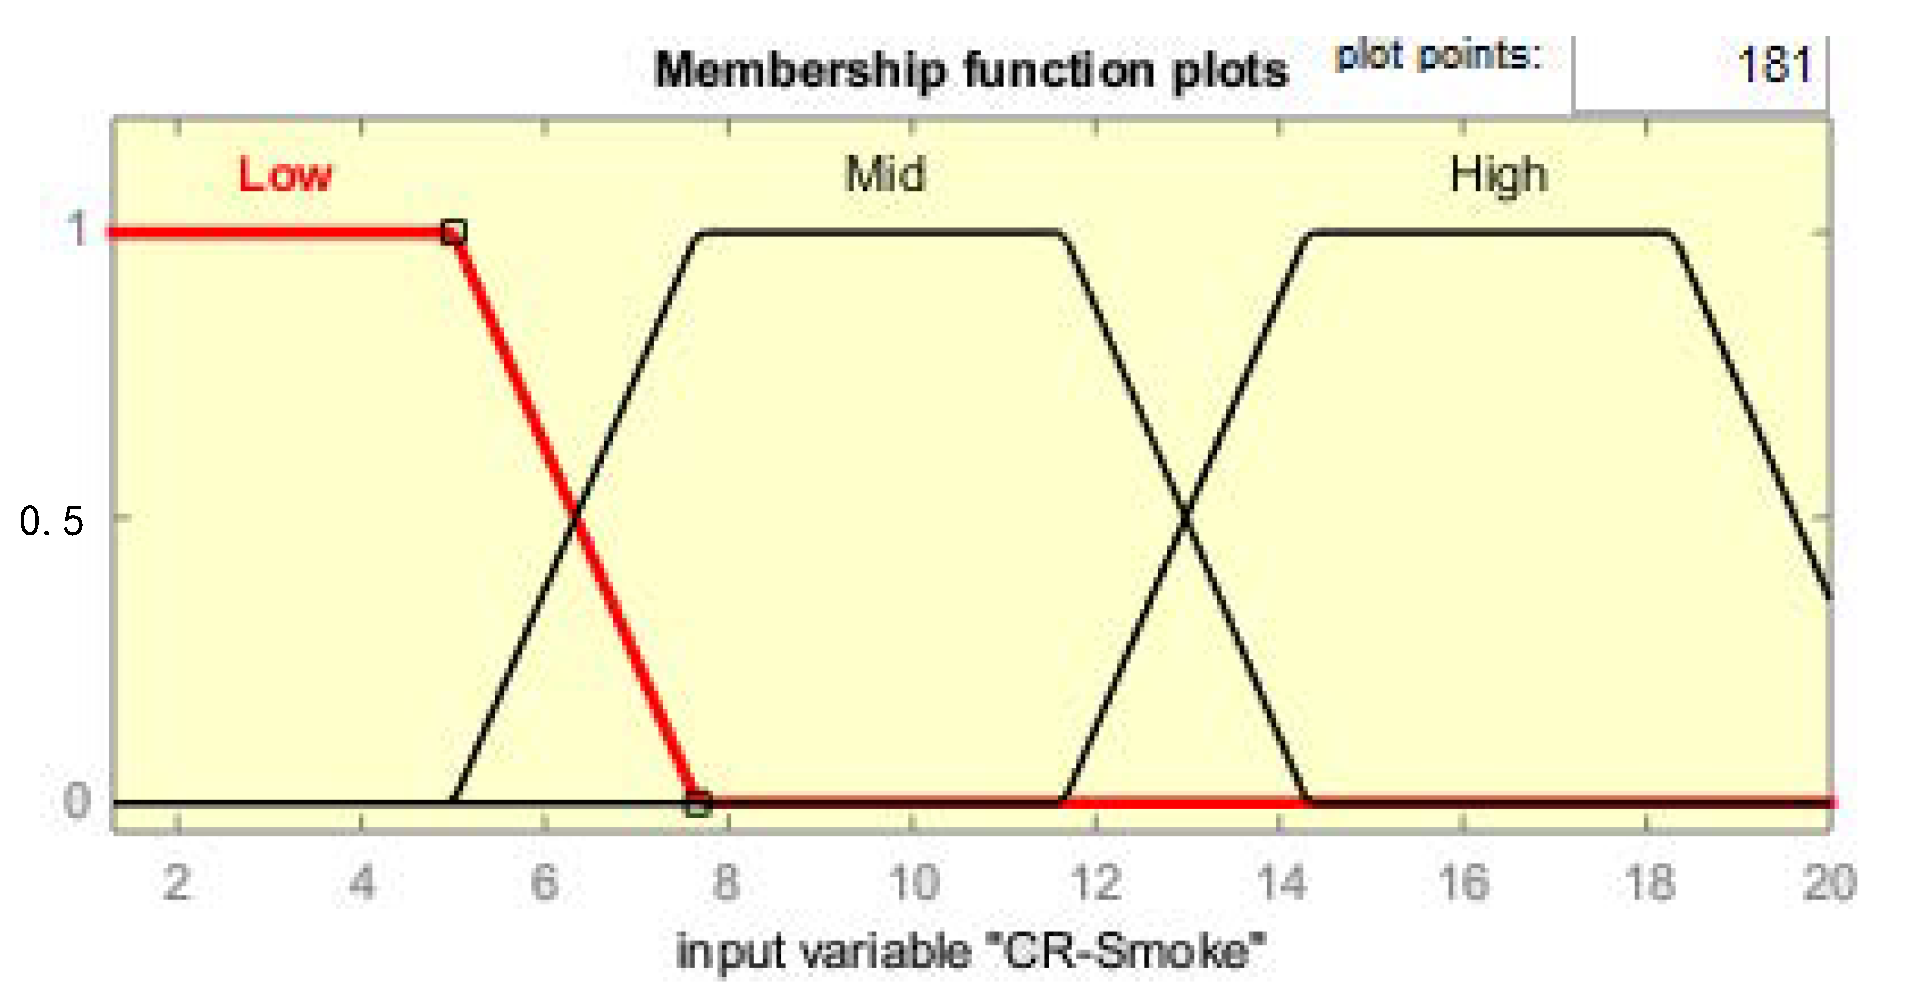
Figure 12.
MF plot for Smoke.
Figure 12.
MF plot for Smoke.
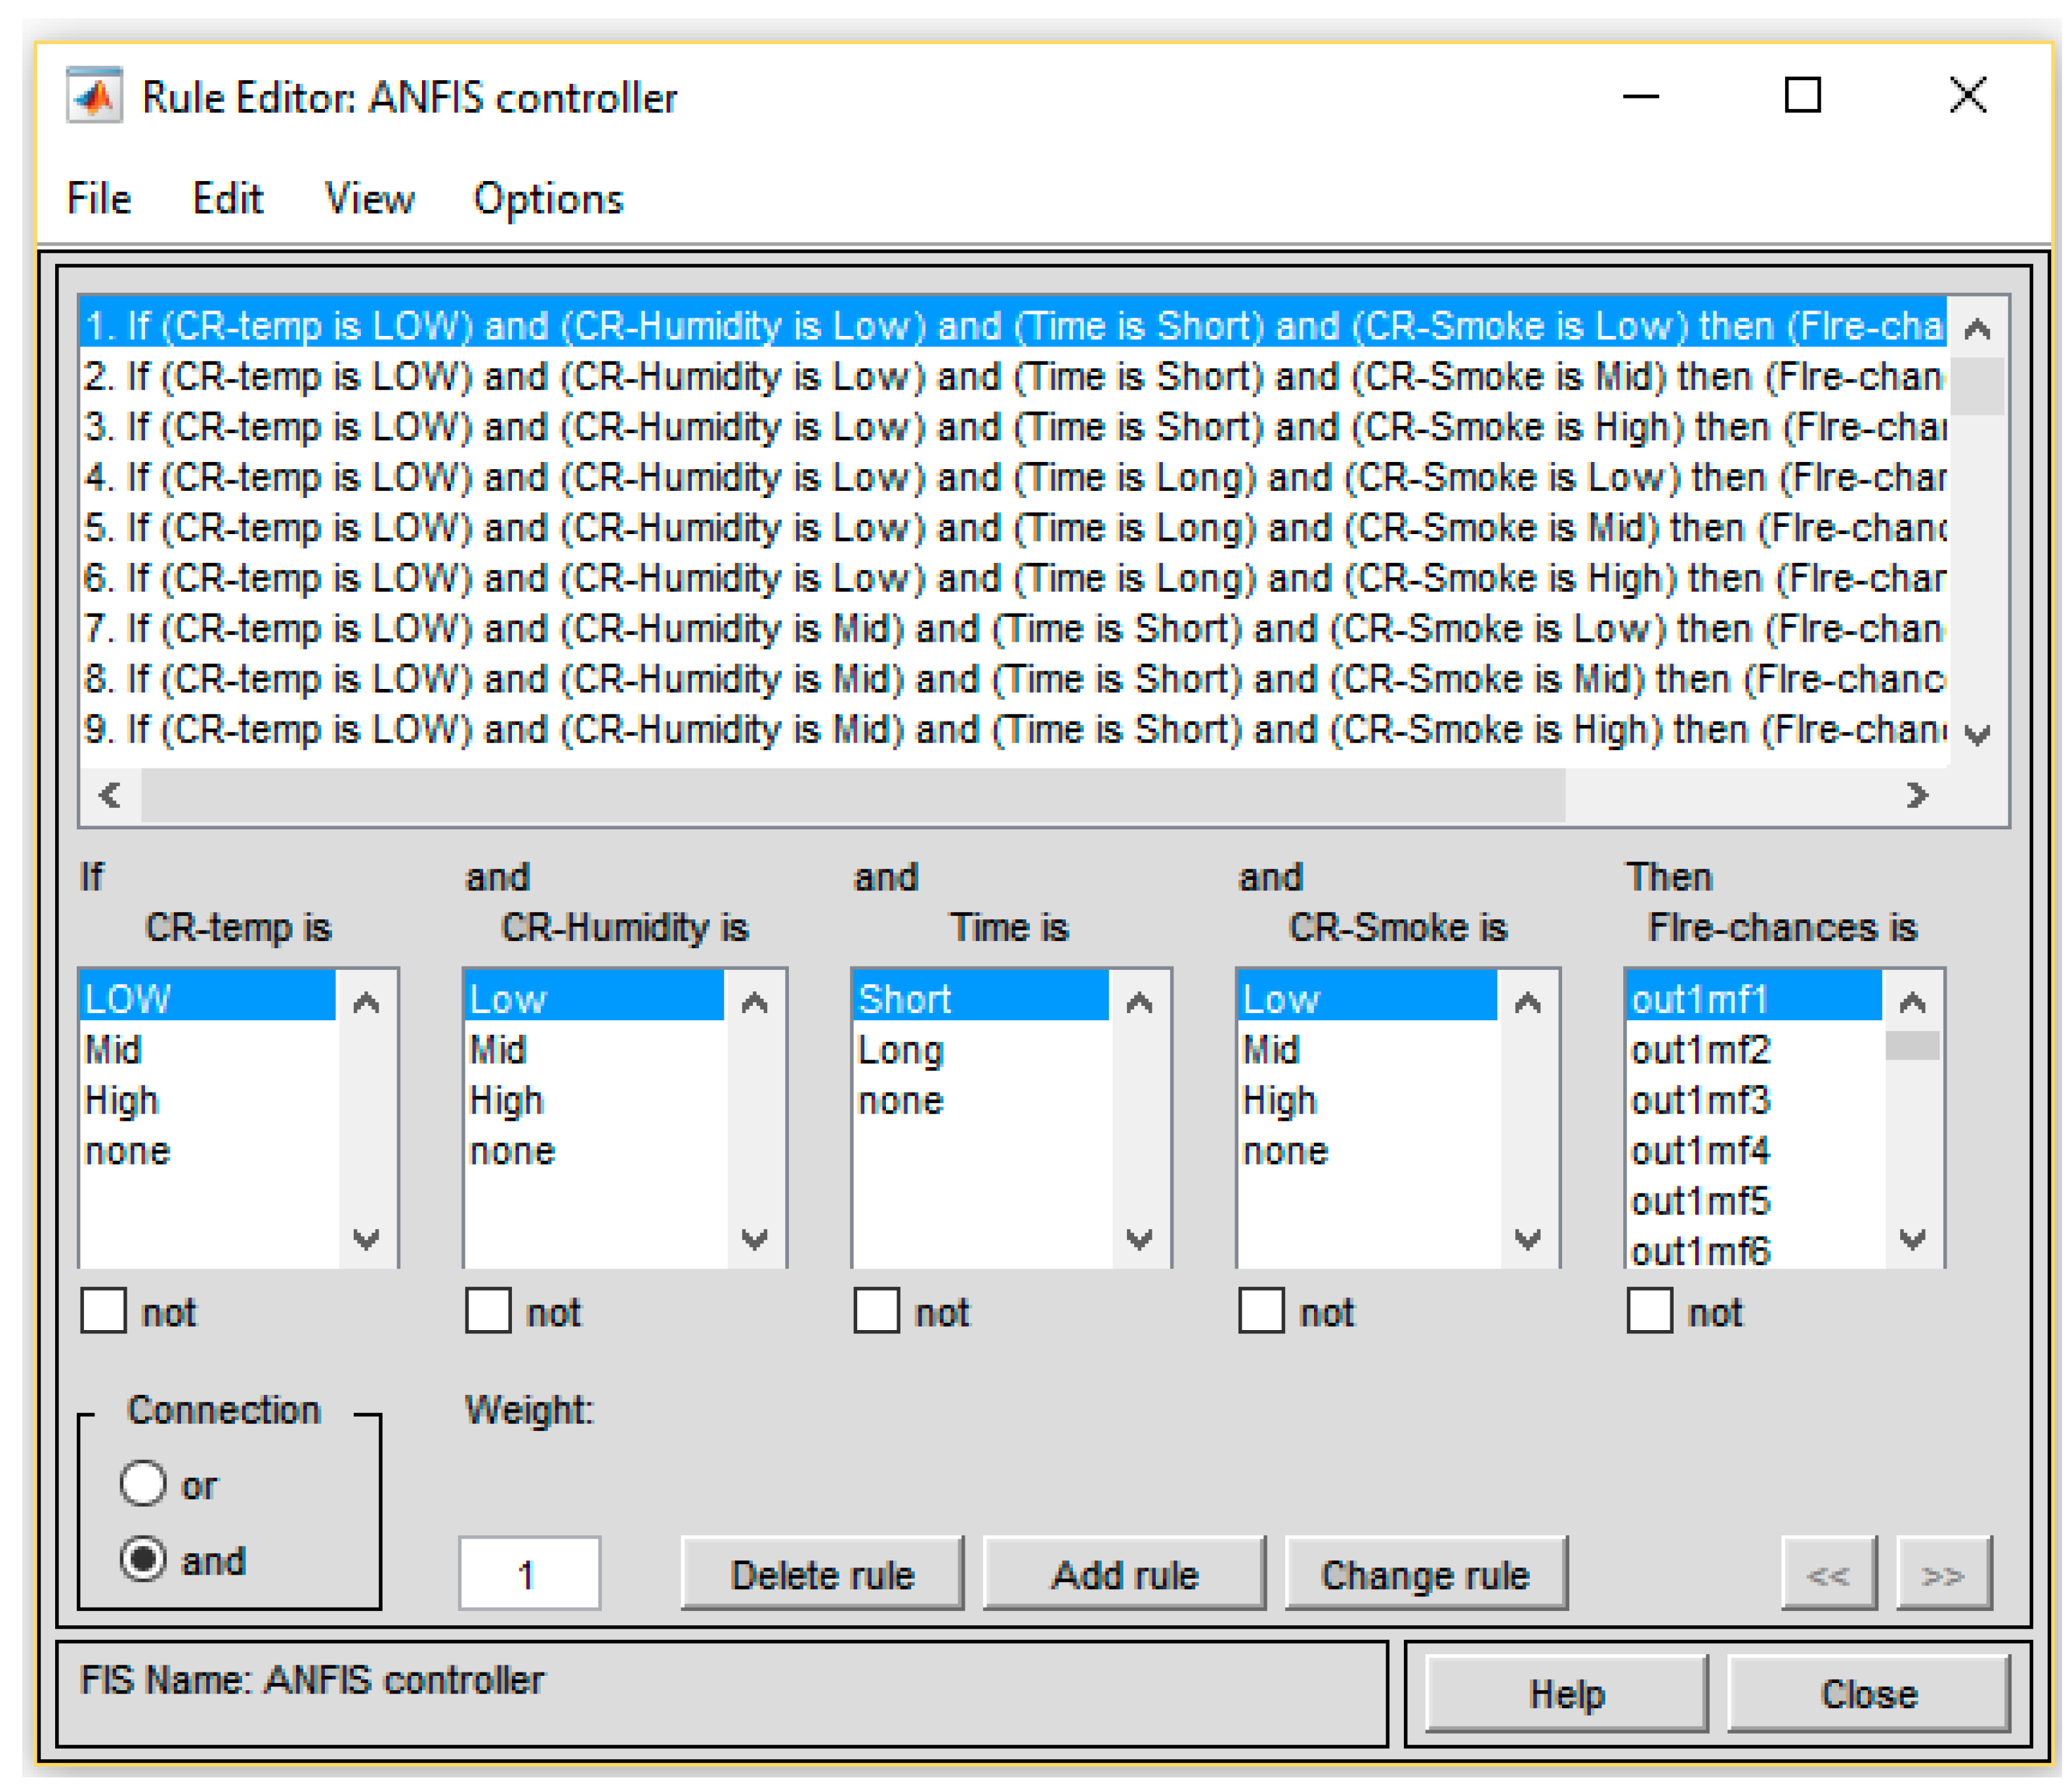
Figure 13.
ANFIS generated rules.
Figure 13.
ANFIS generated rules.
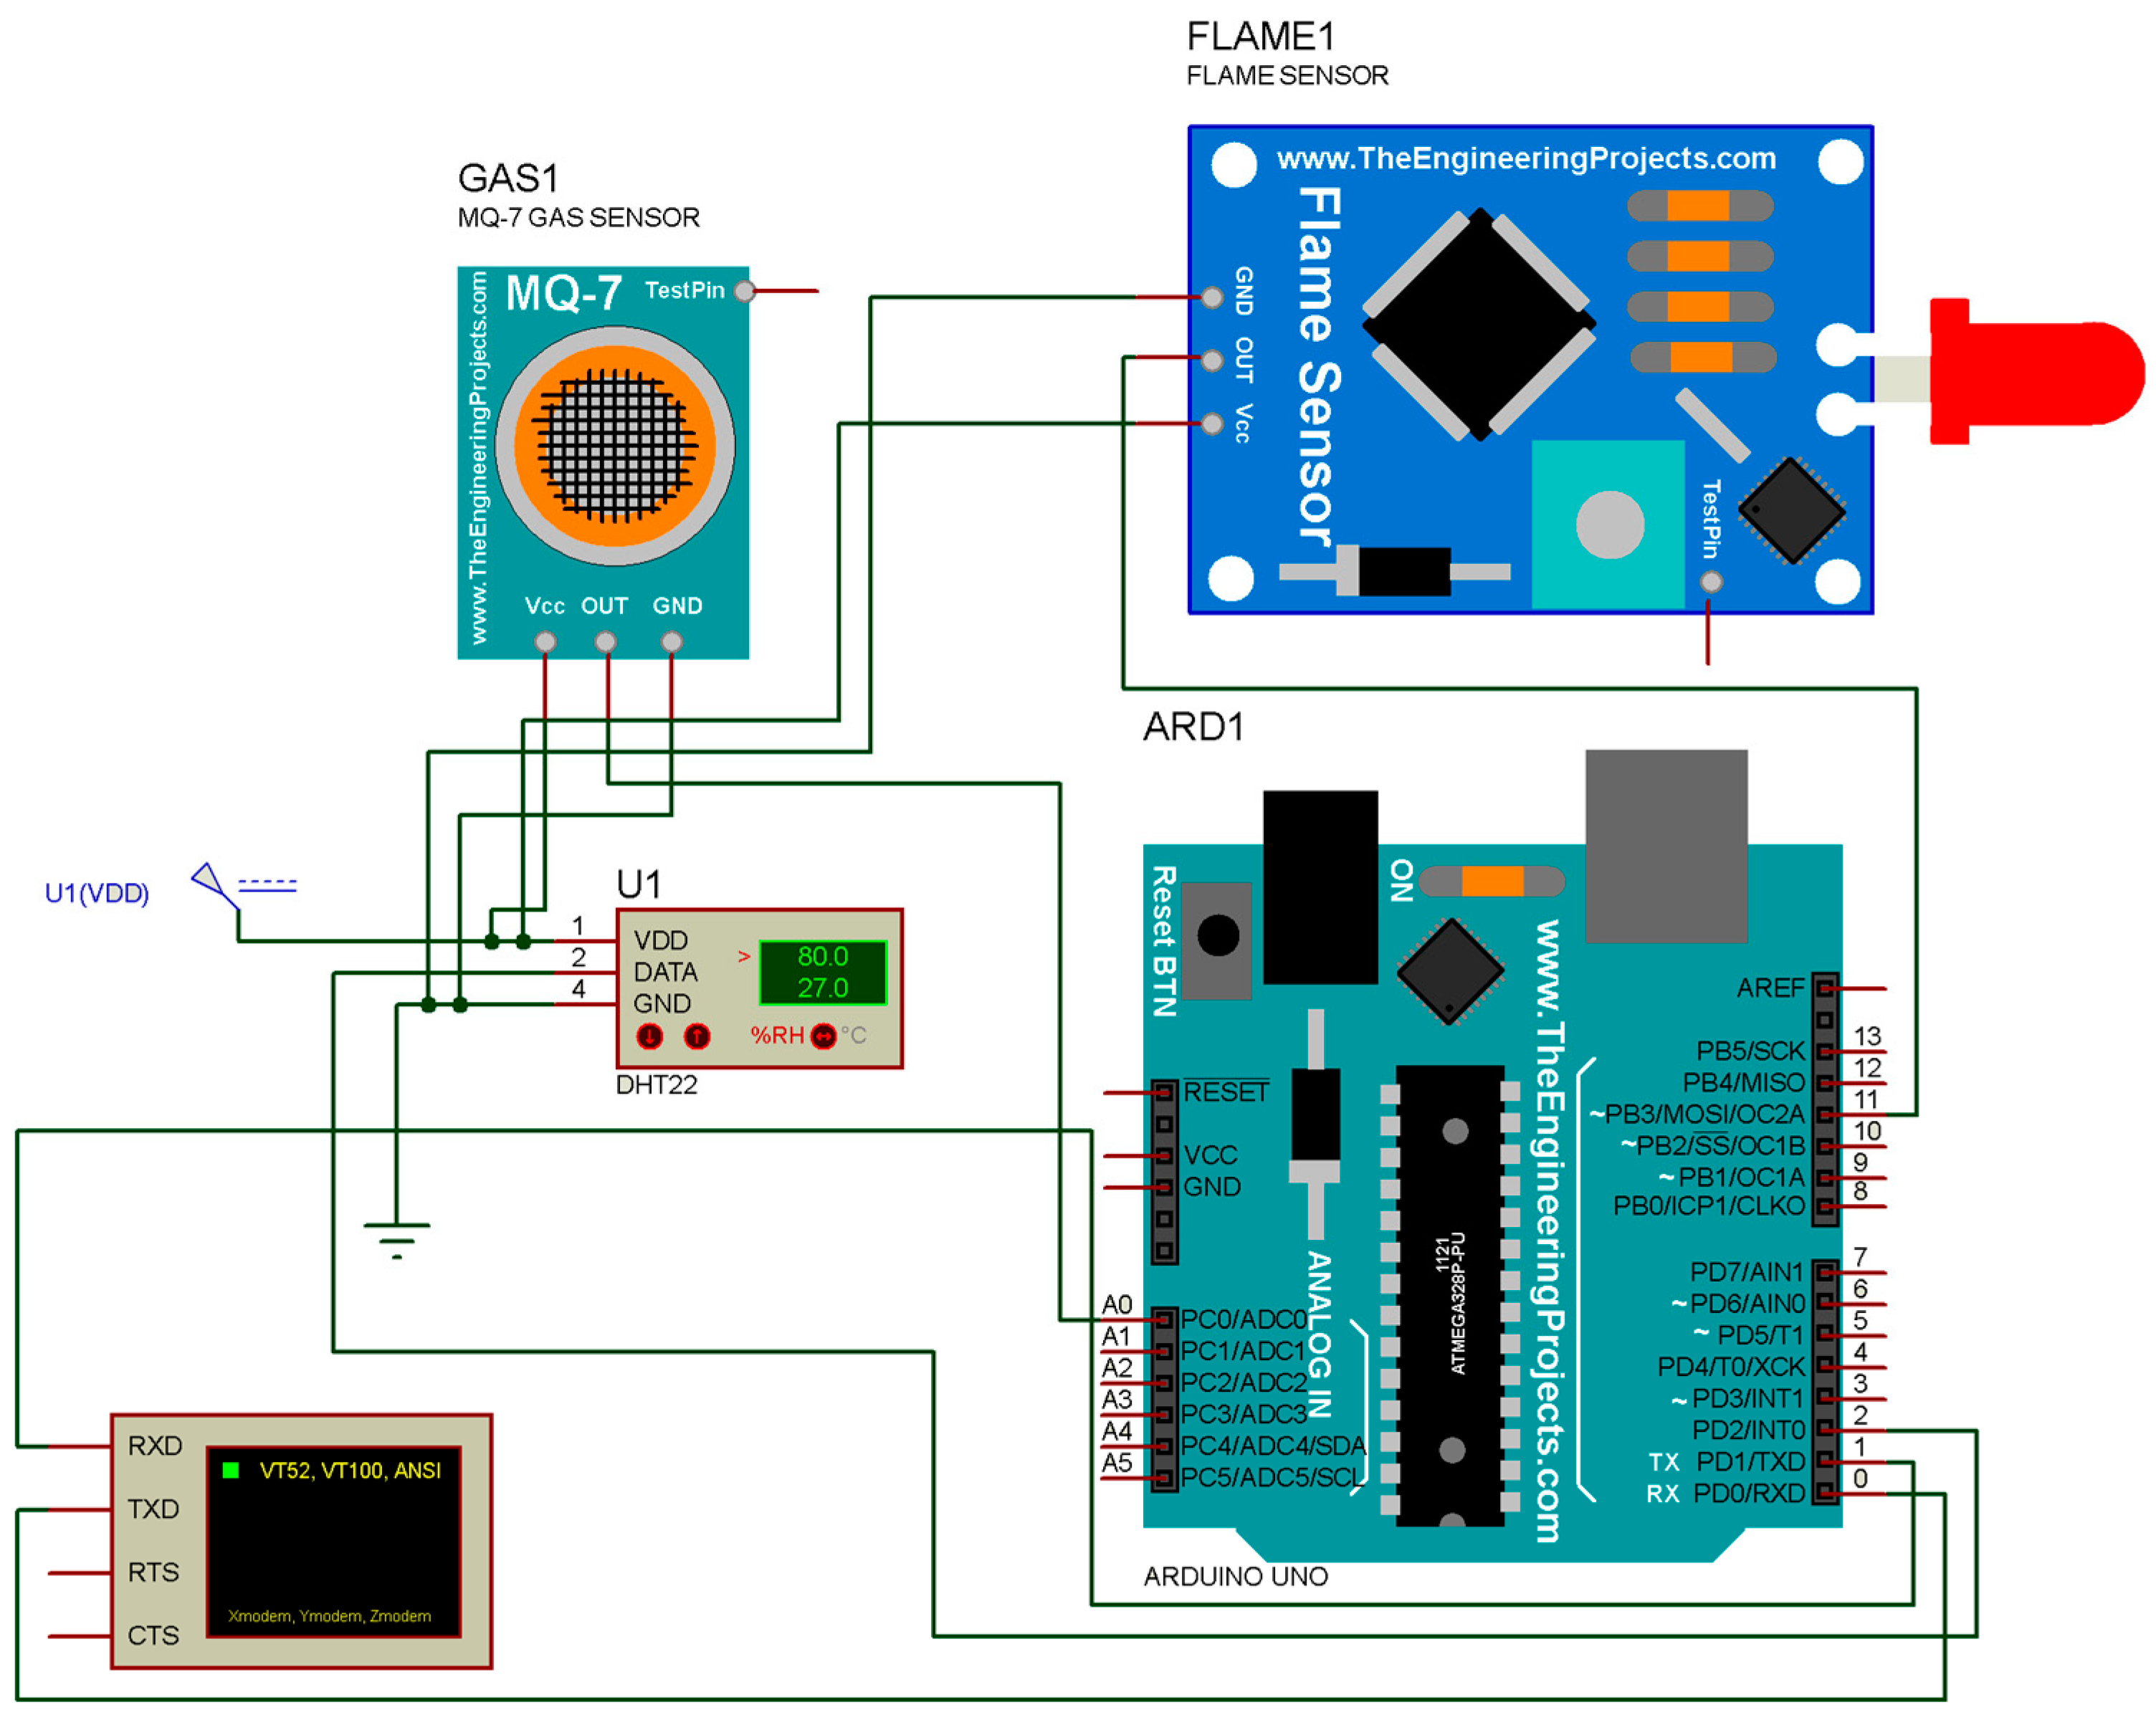
Figure 14.
Proteus simulation.
Figure 14.
Proteus simulation.
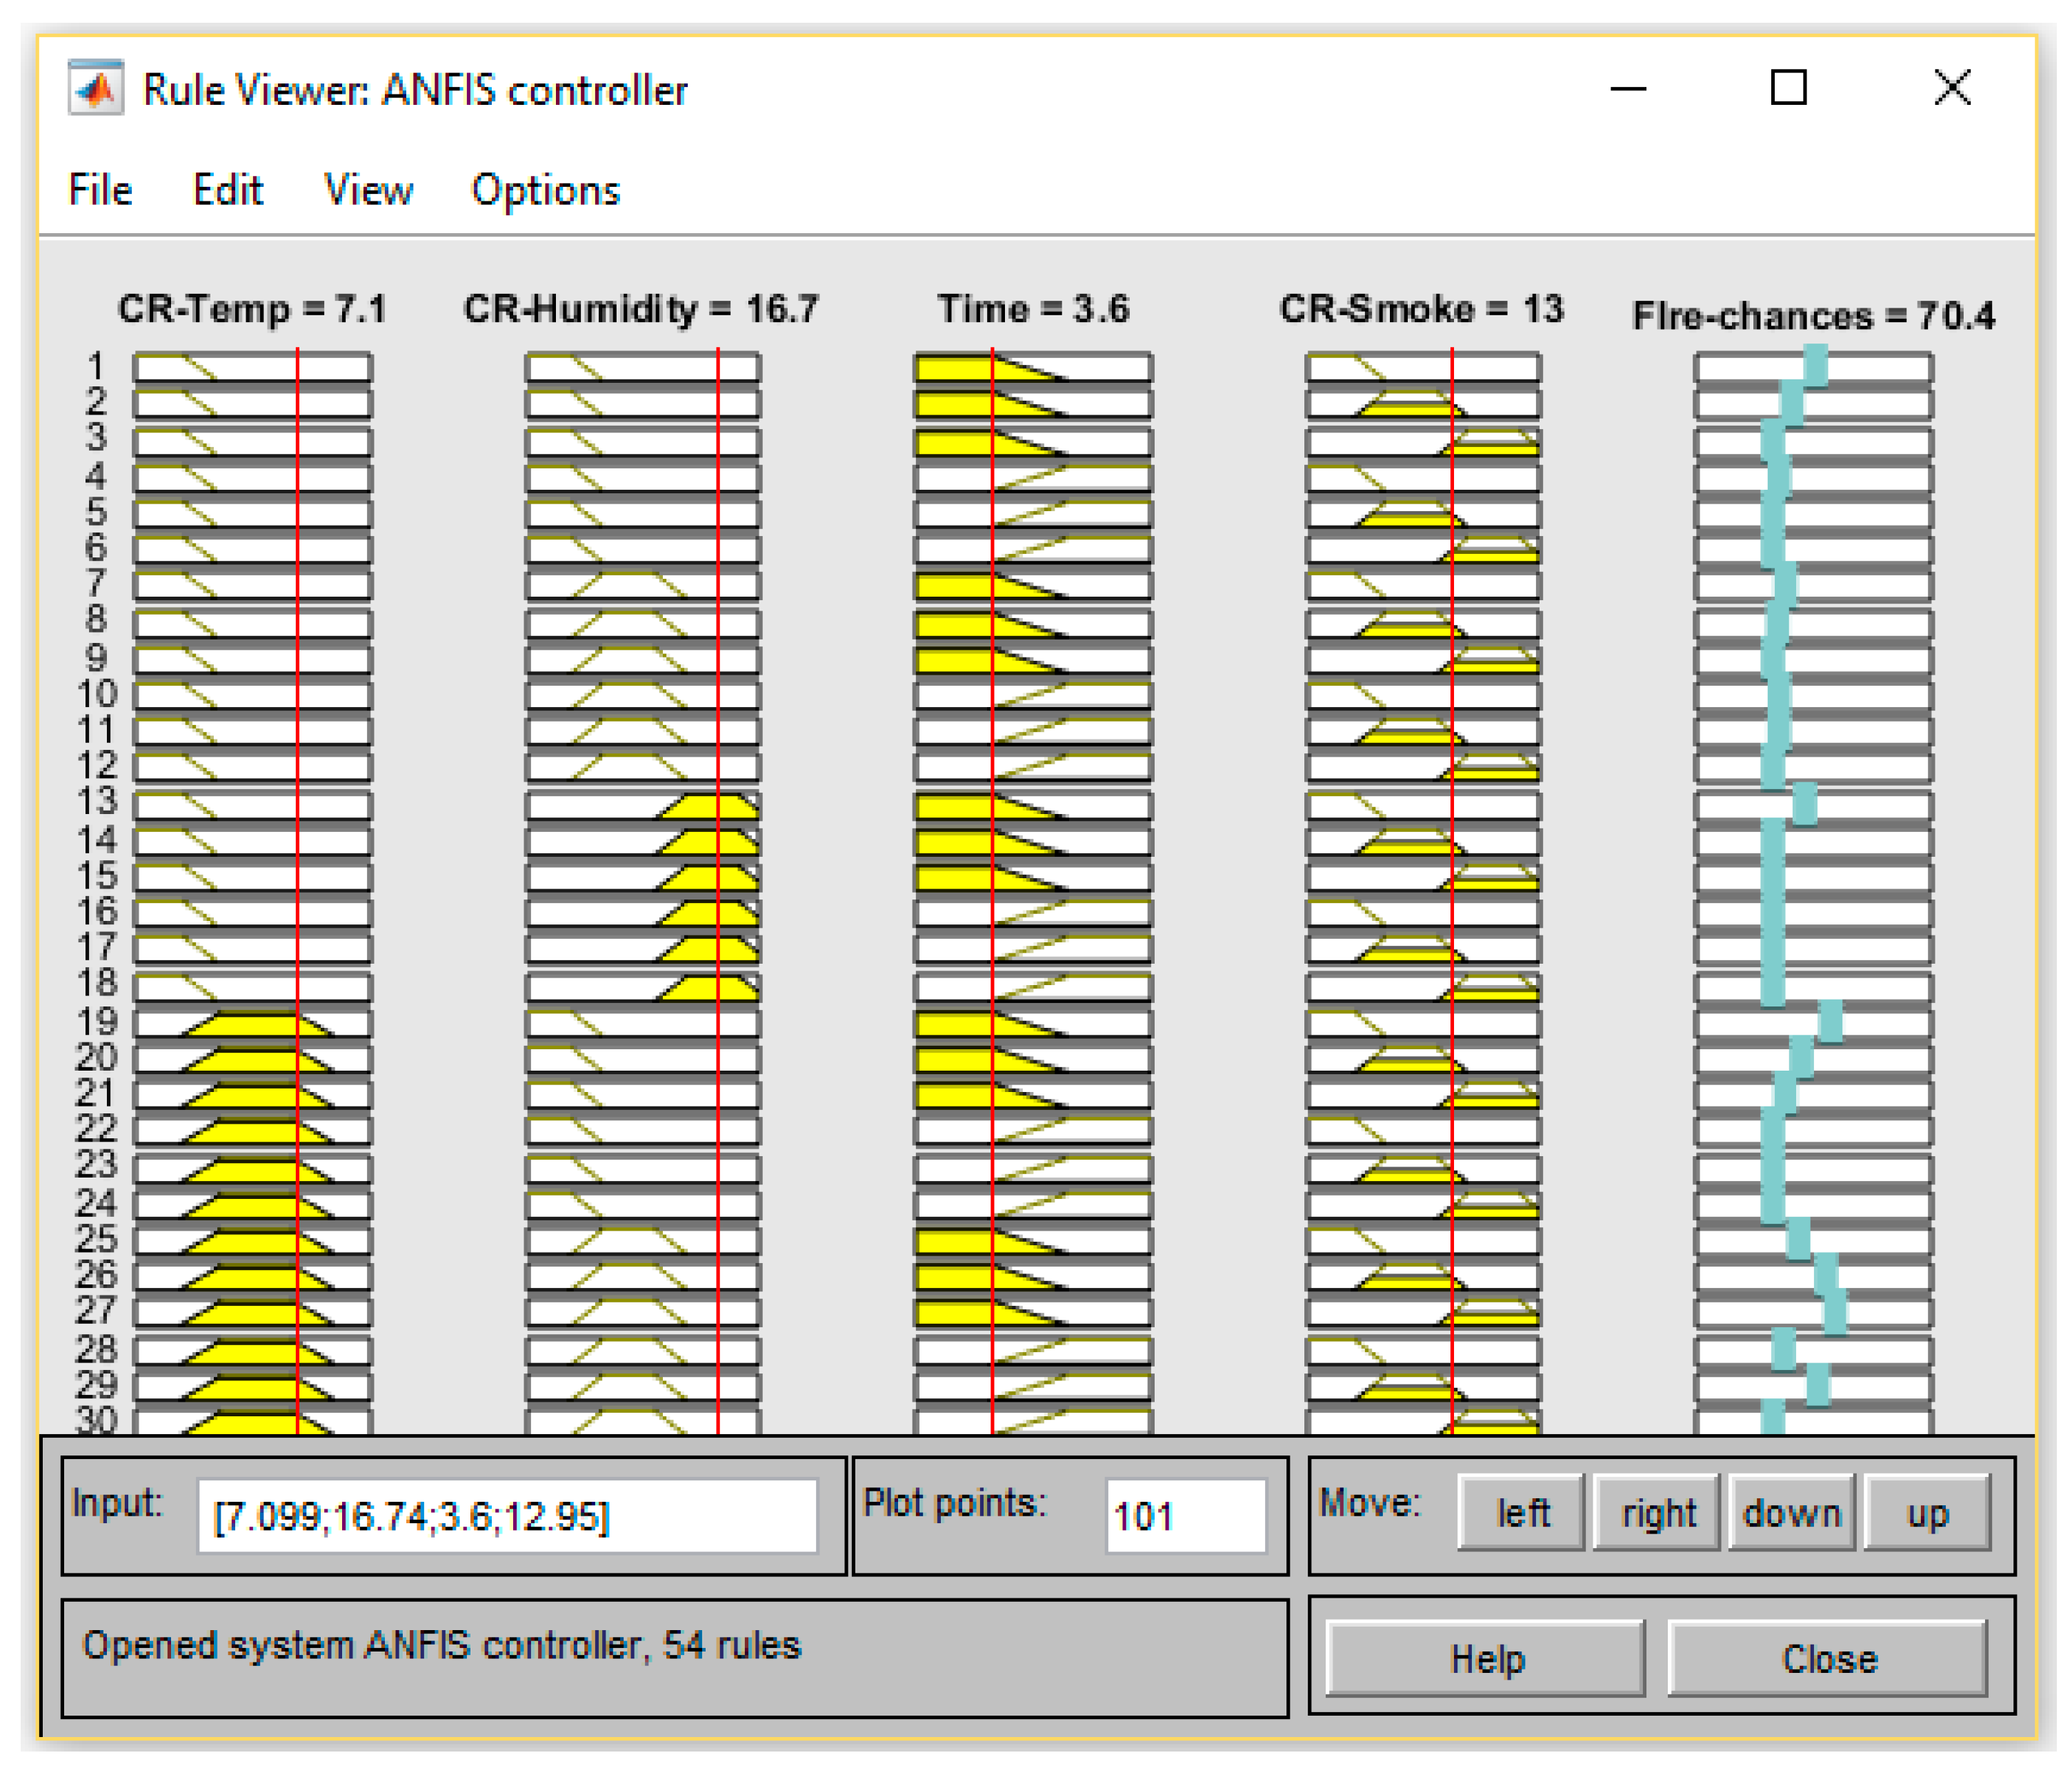
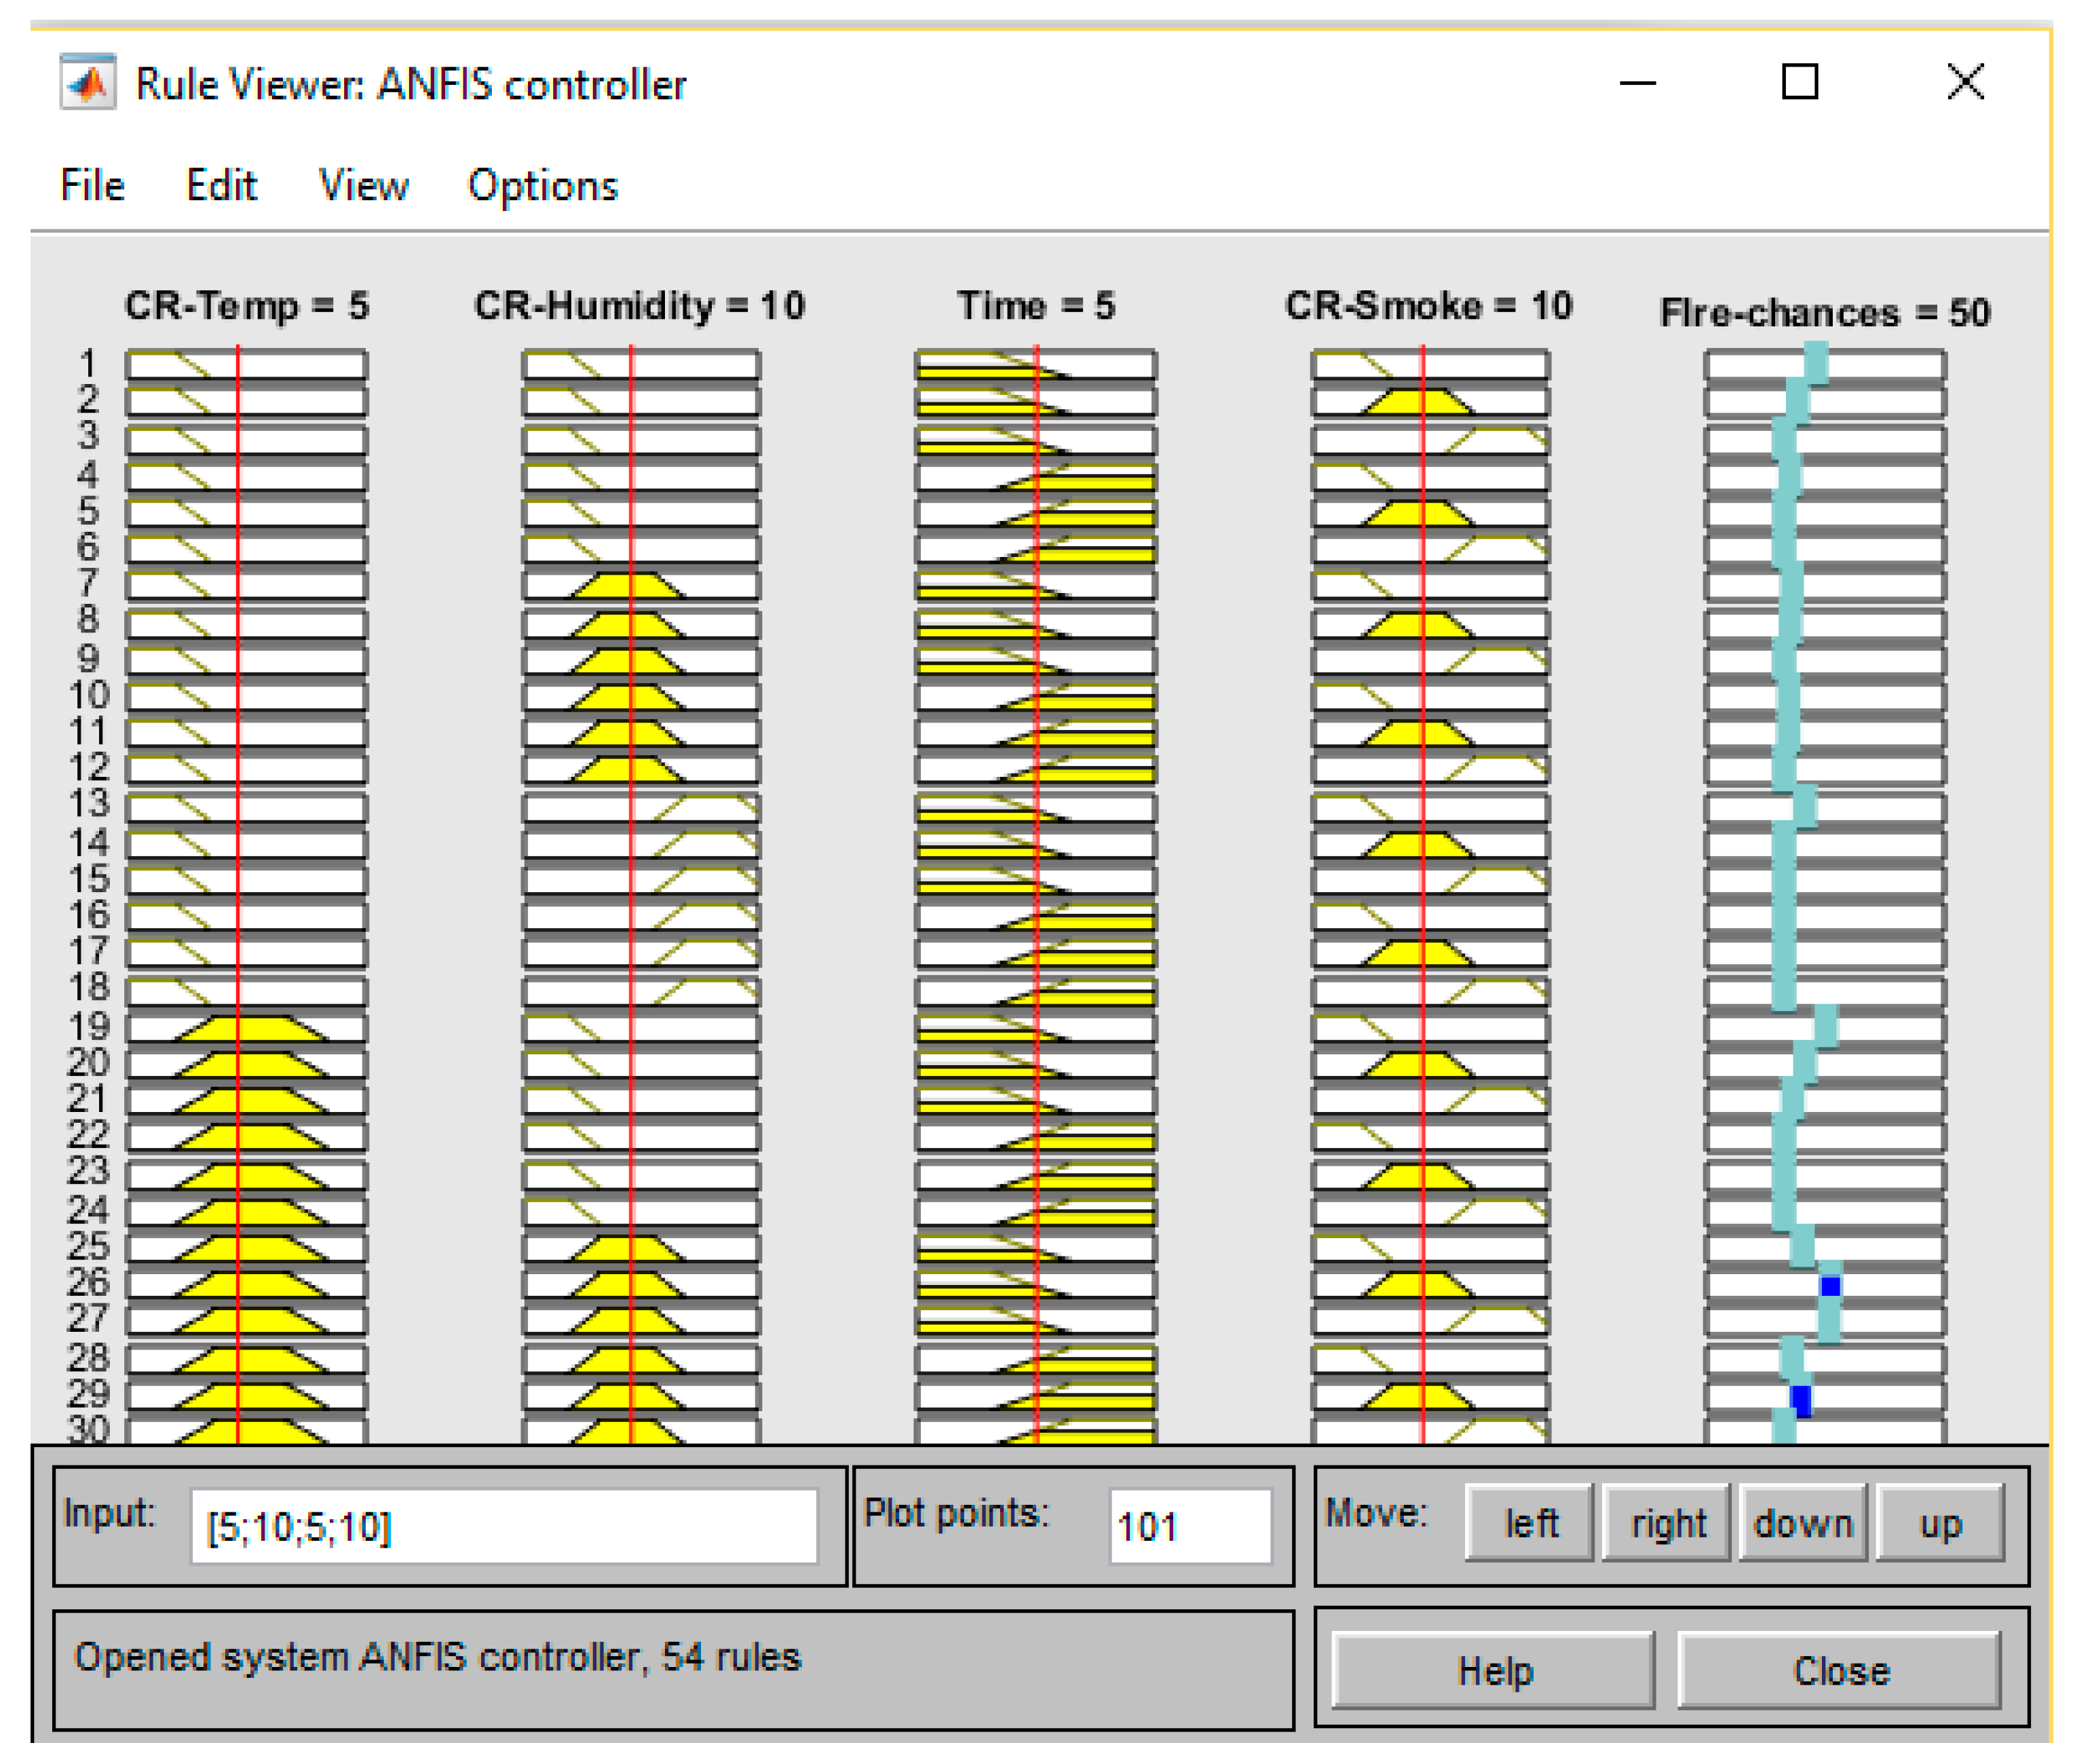
Figure 15.
ANFIS rules viewer.
Figure 15.
ANFIS rules viewer.
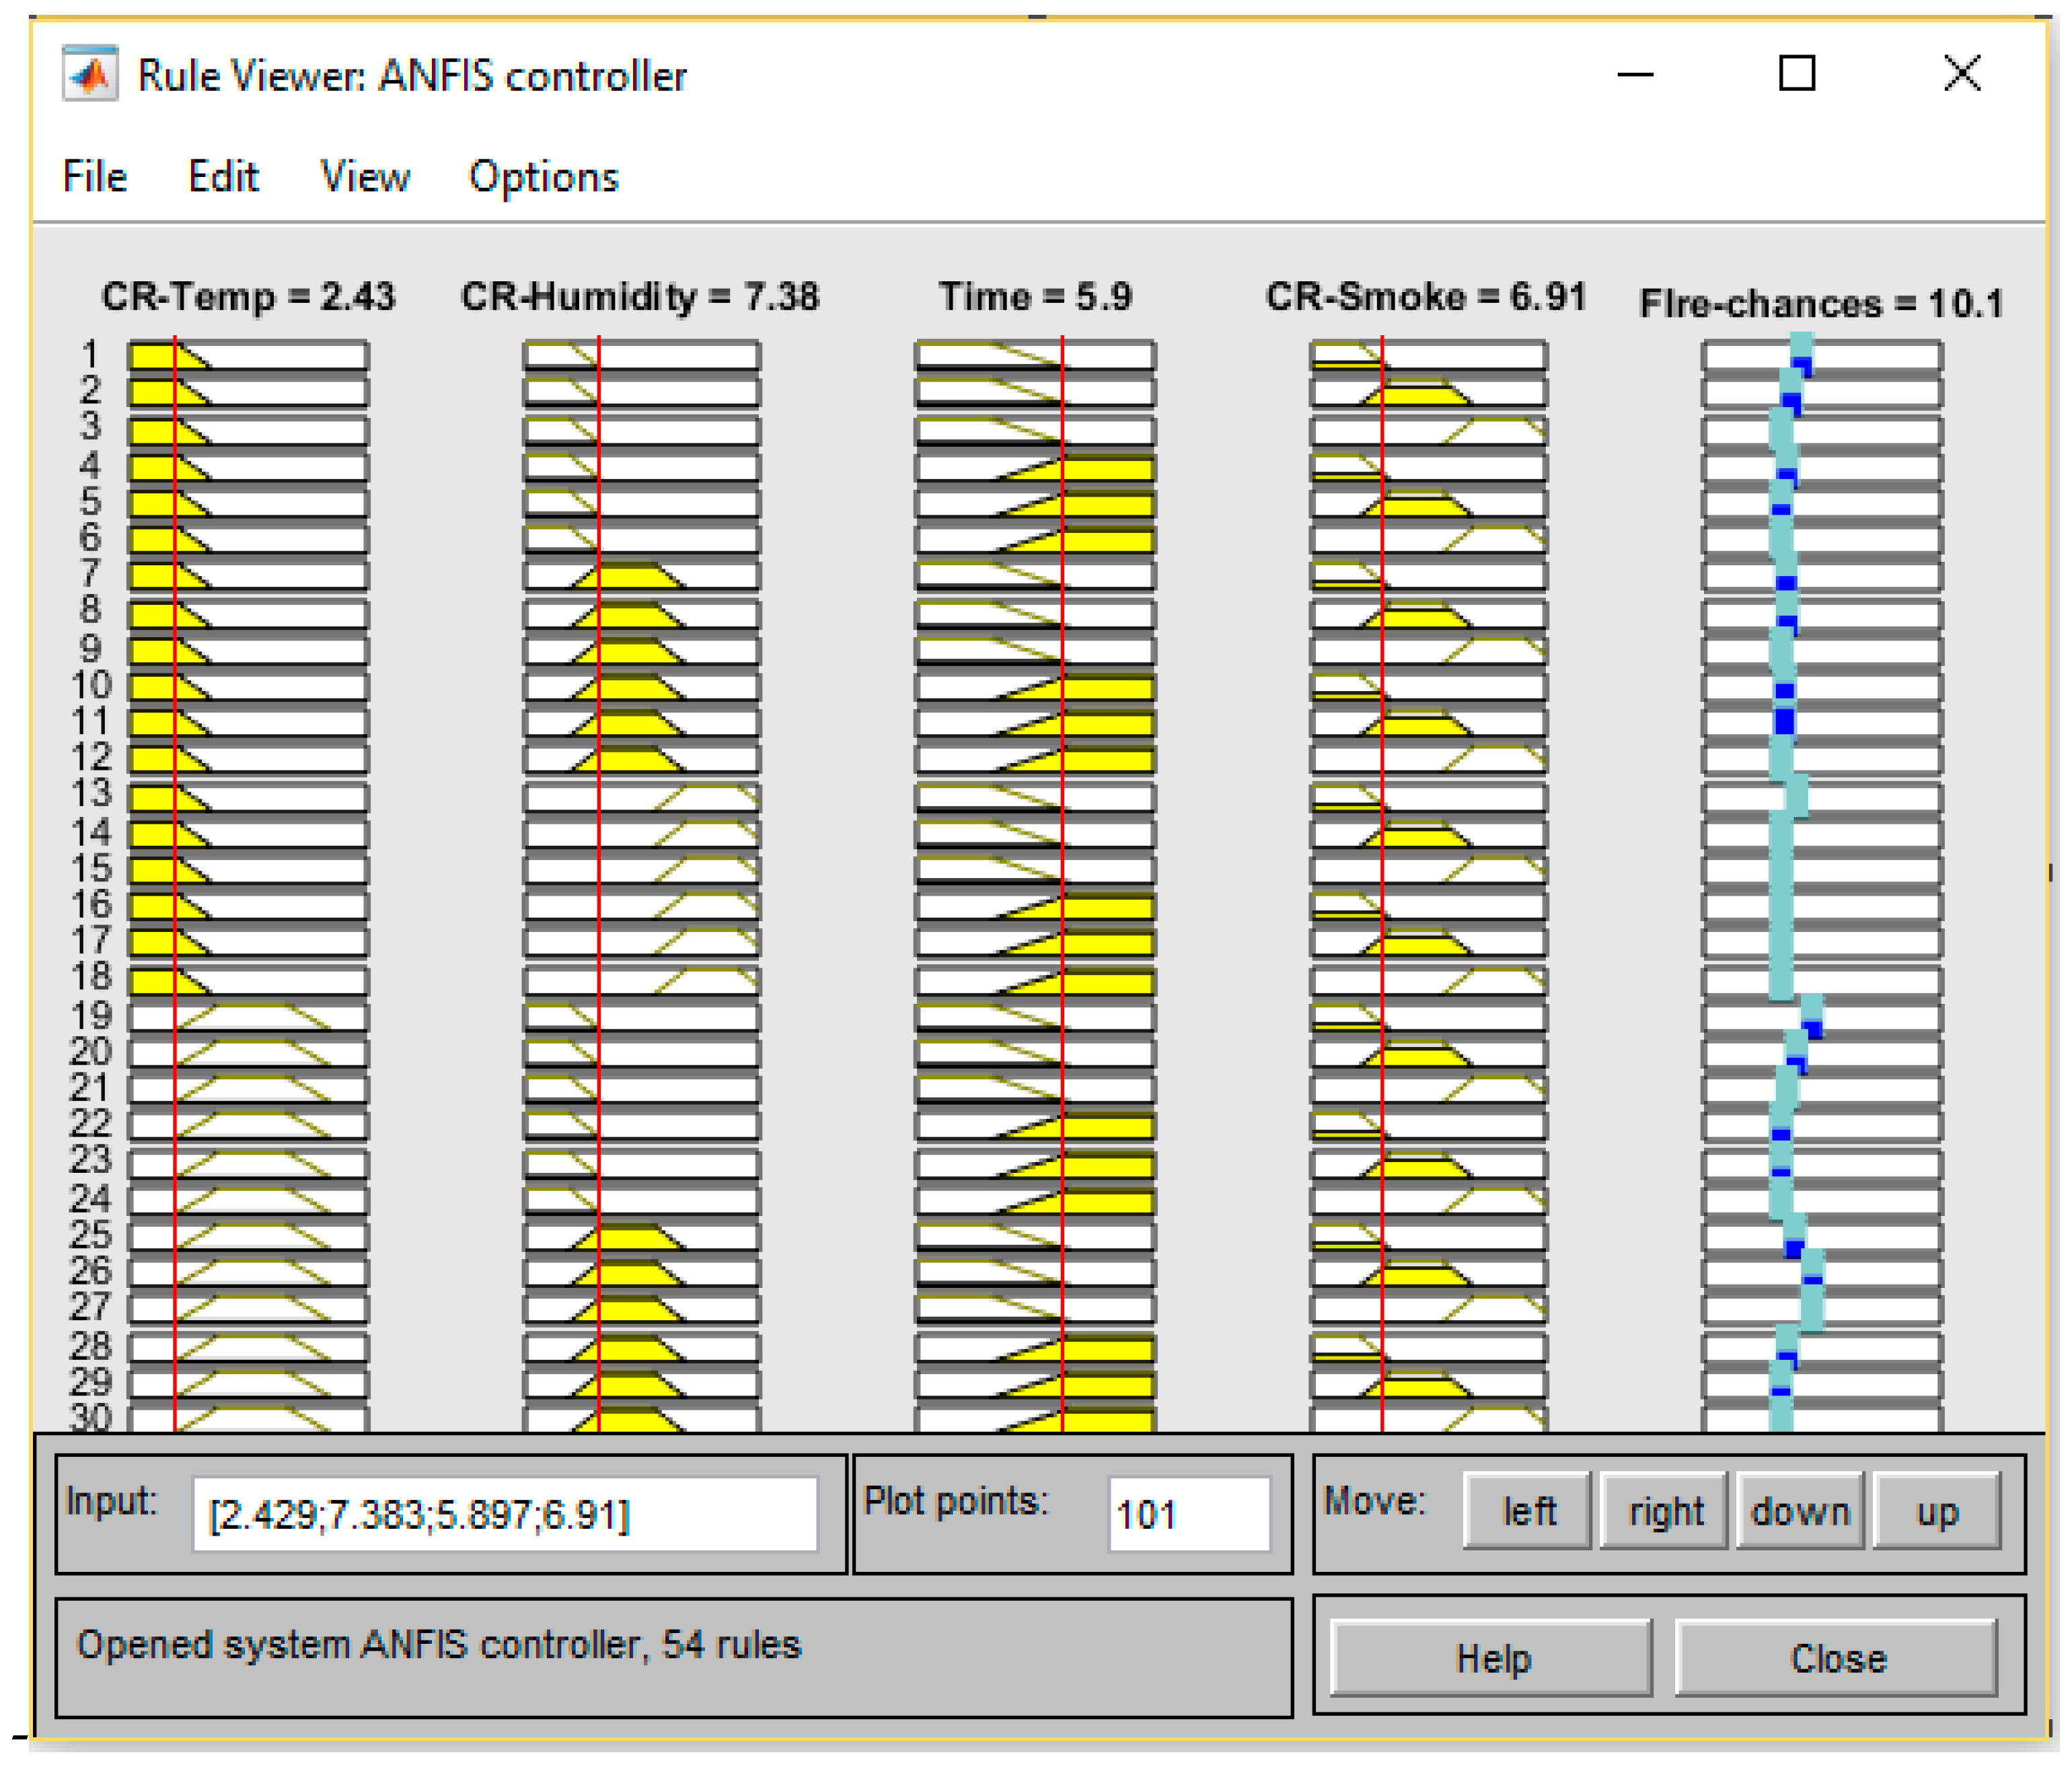
Figure 16.
ANFIS output for different inputs.
Figure 16.
ANFIS output for different inputs.
Figure 17.
Fire-Chances with input variations.
Figure 17.
Fire-Chances with input variations.
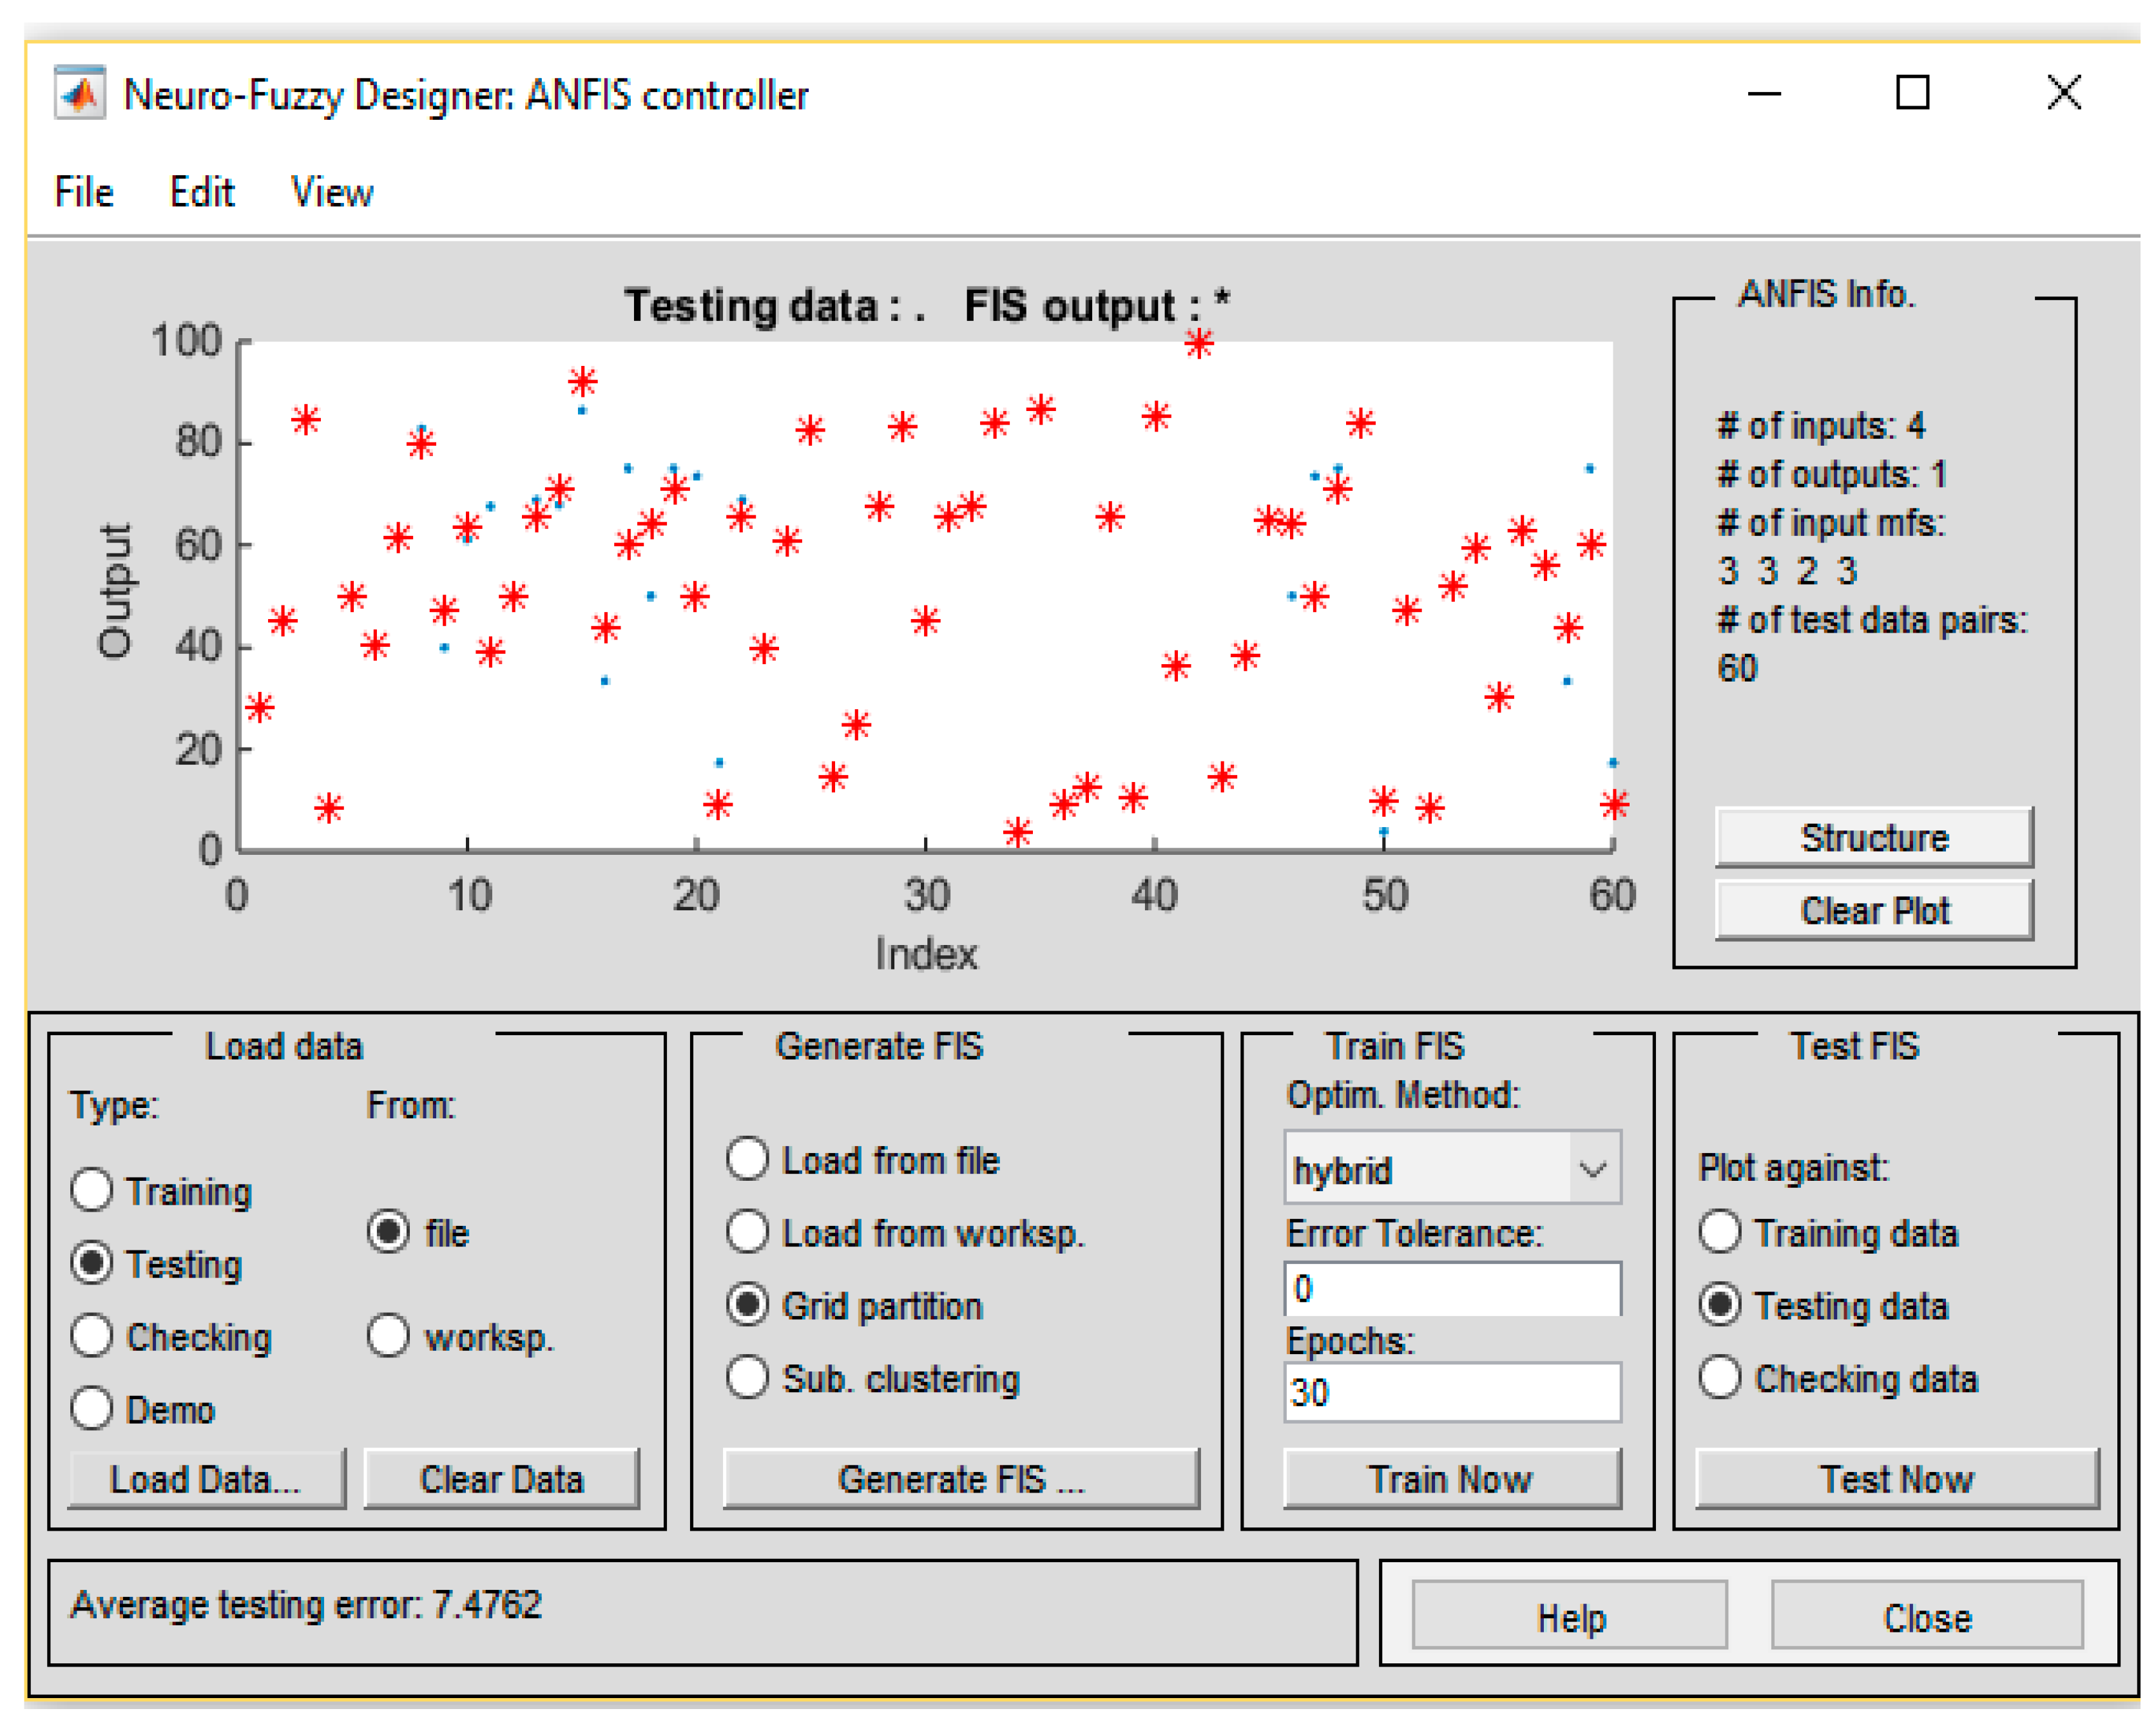
Figure 18.
Average testing results.
Figure 18.
Average testing results.
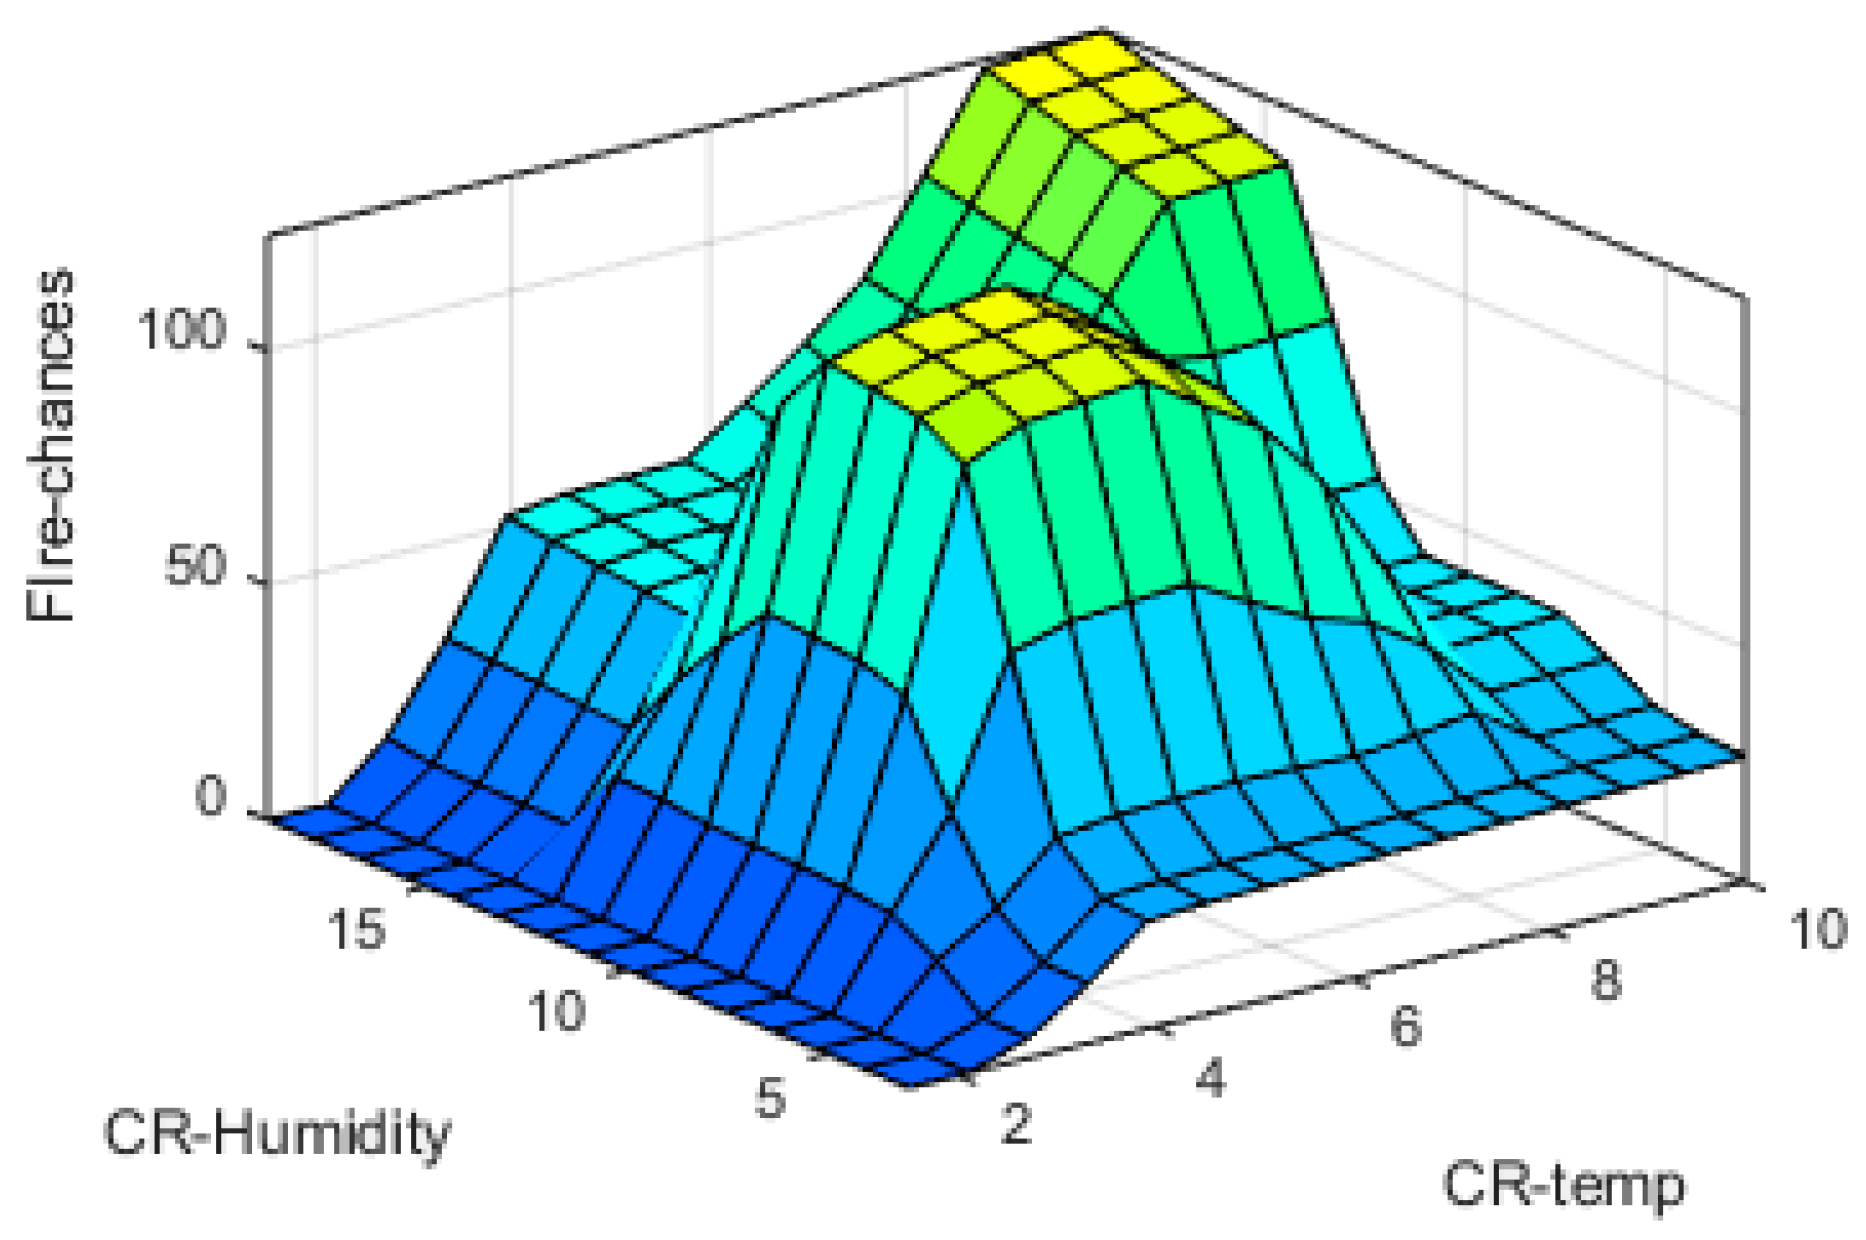
Figure 19.
CR-Humidity v/s CR-Temp surface plot.
Figure 19.
CR-Humidity v/s CR-Temp surface plot.
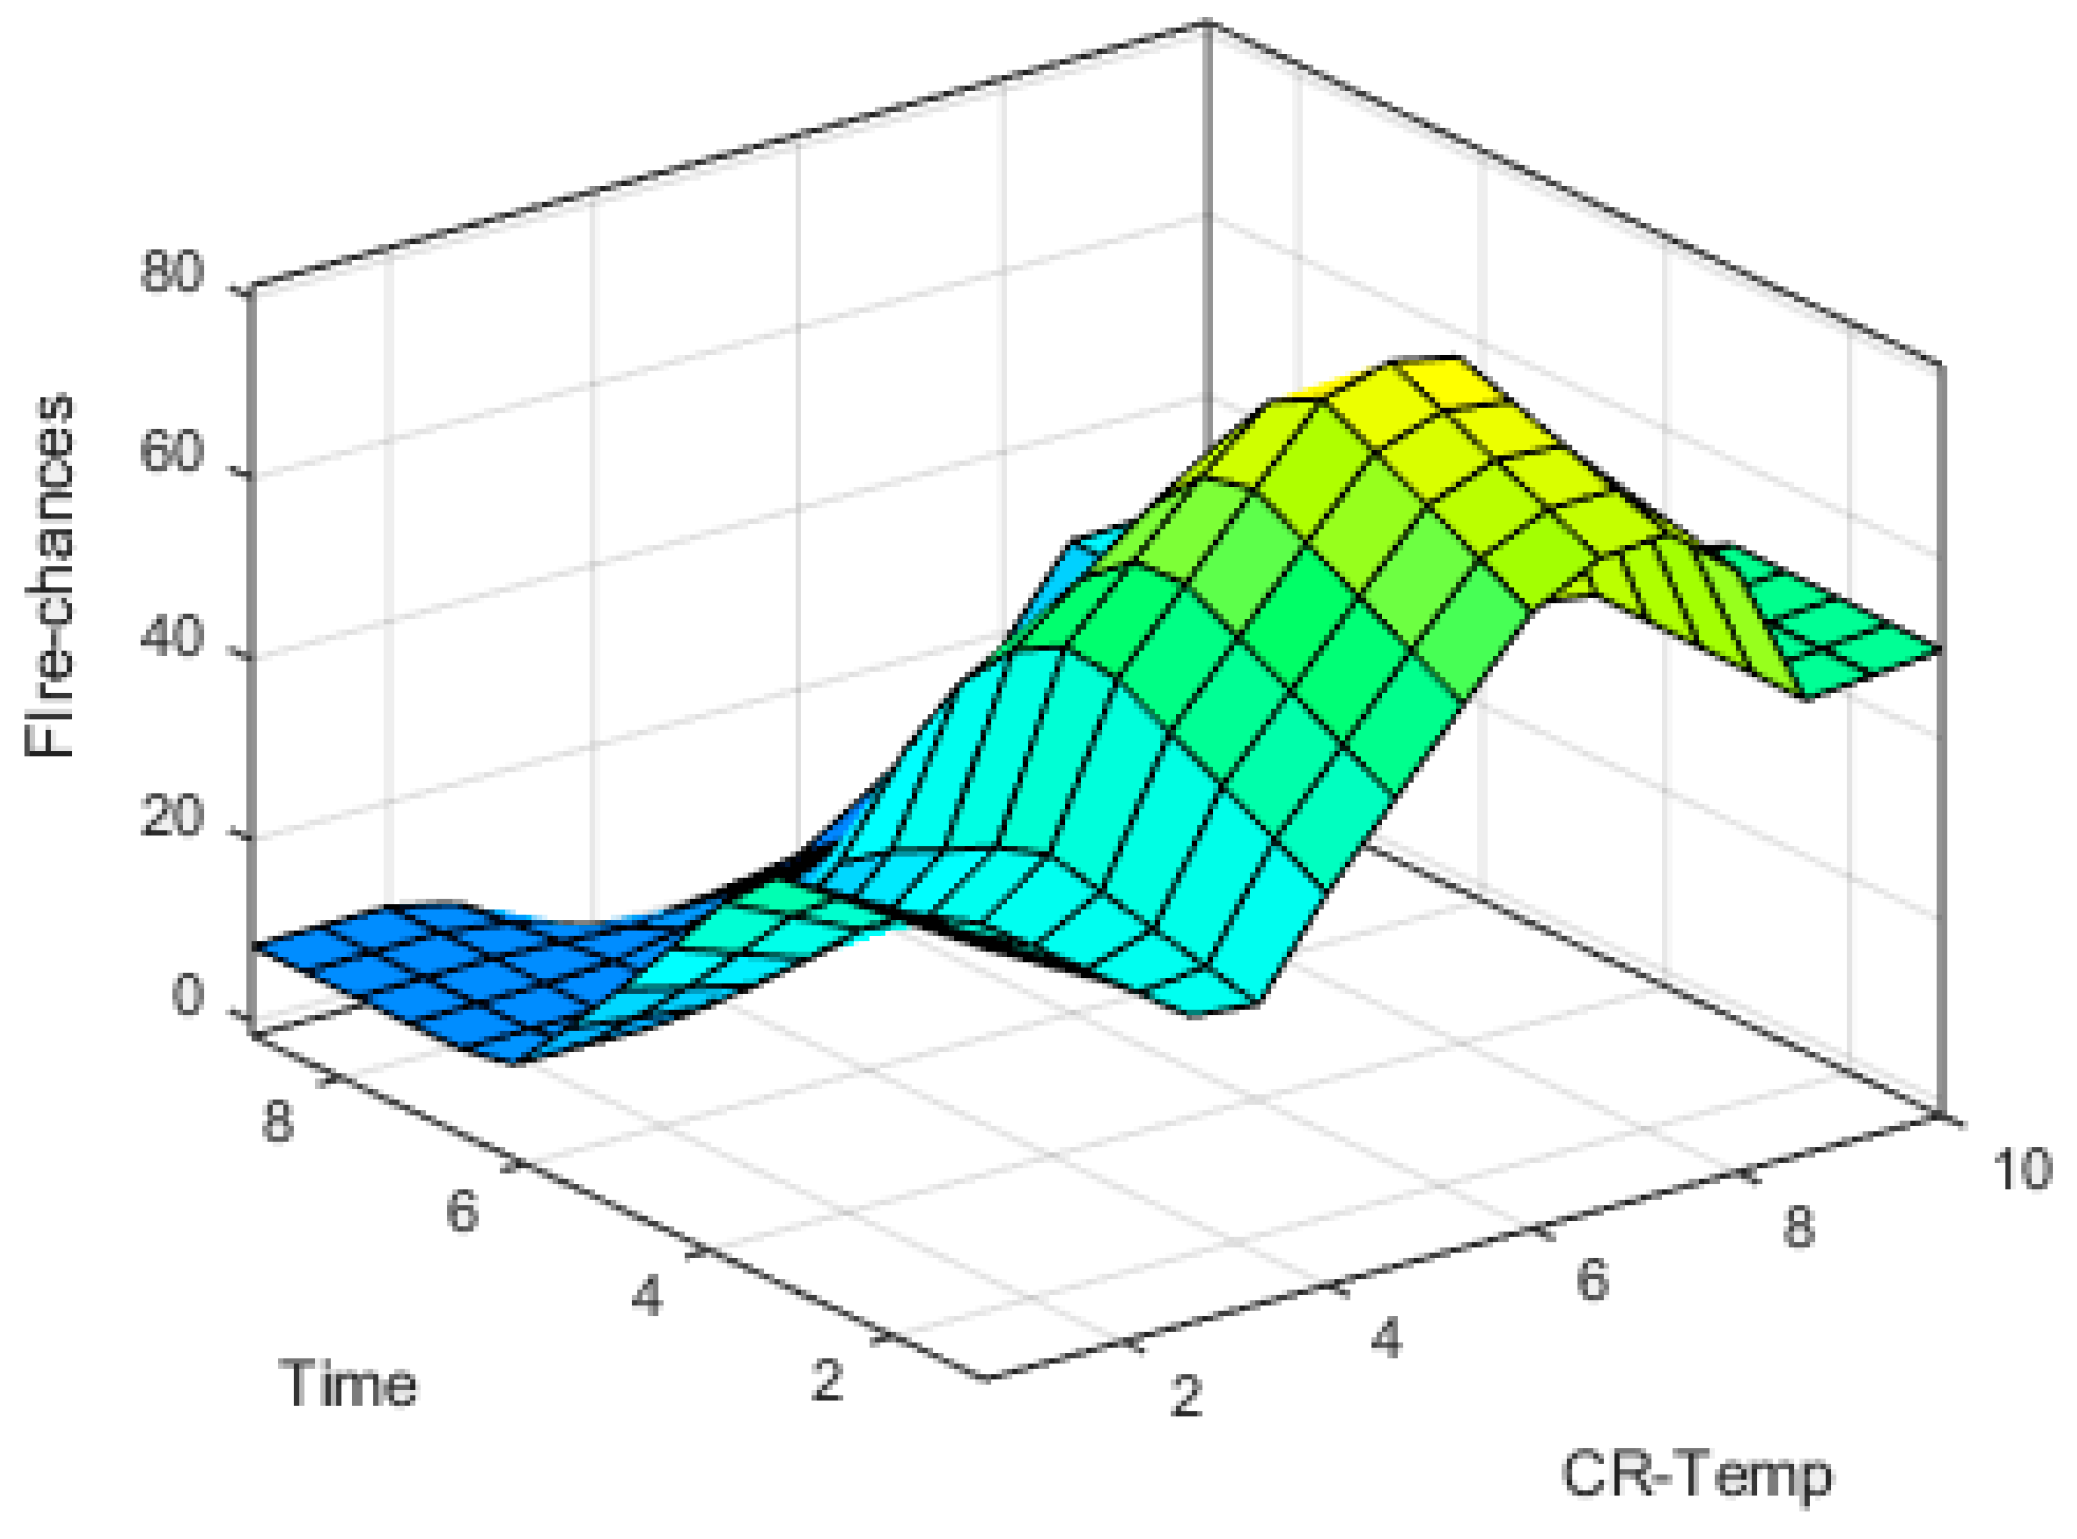
Figure 20.
Time vs. CR-Temp surface plot.
Figure 20.
Time vs. CR-Temp surface plot.
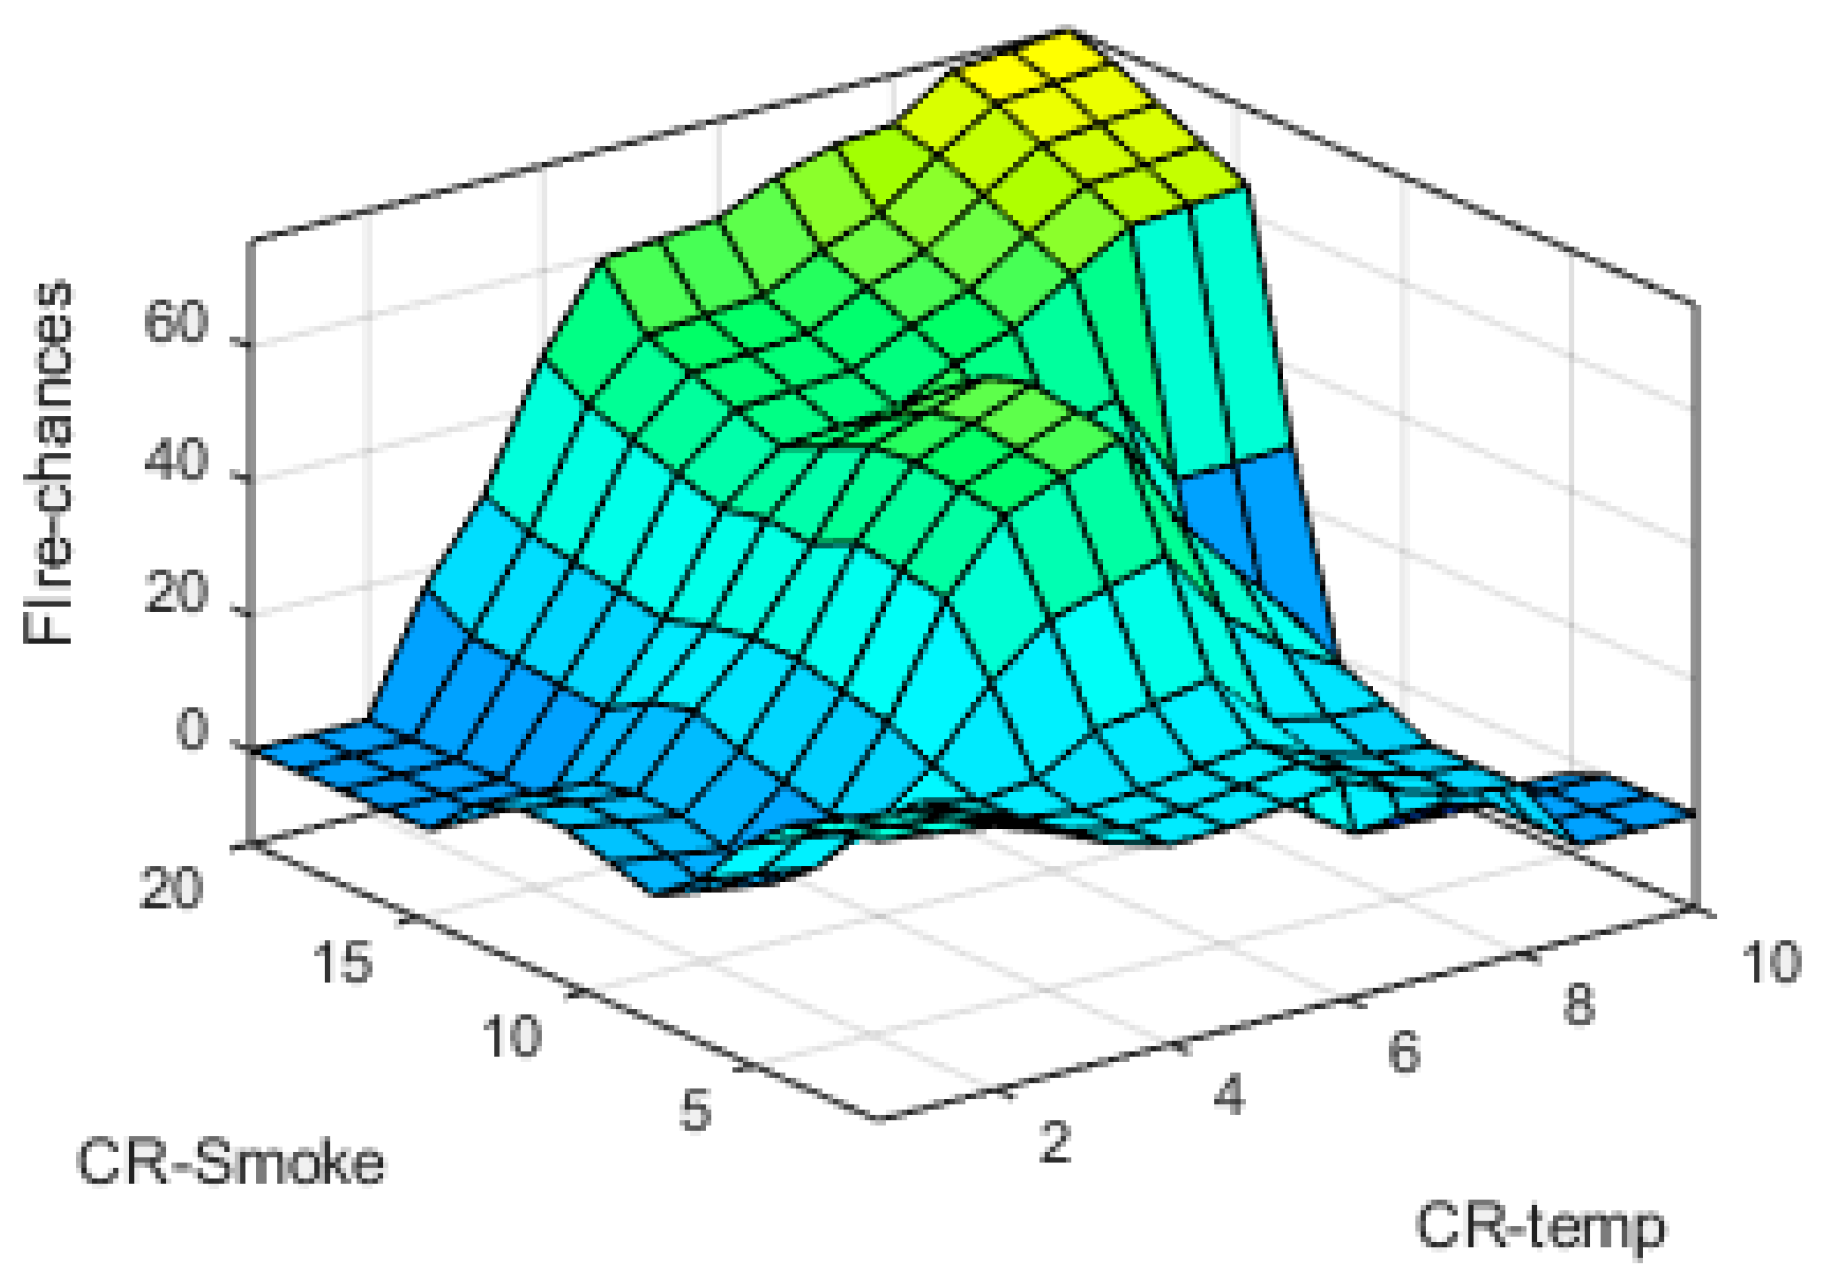
Figure 21.
CR-Smoke vs. CR-Temp surface plot.
Figure 21.
CR-Smoke vs. CR-Temp surface plot.
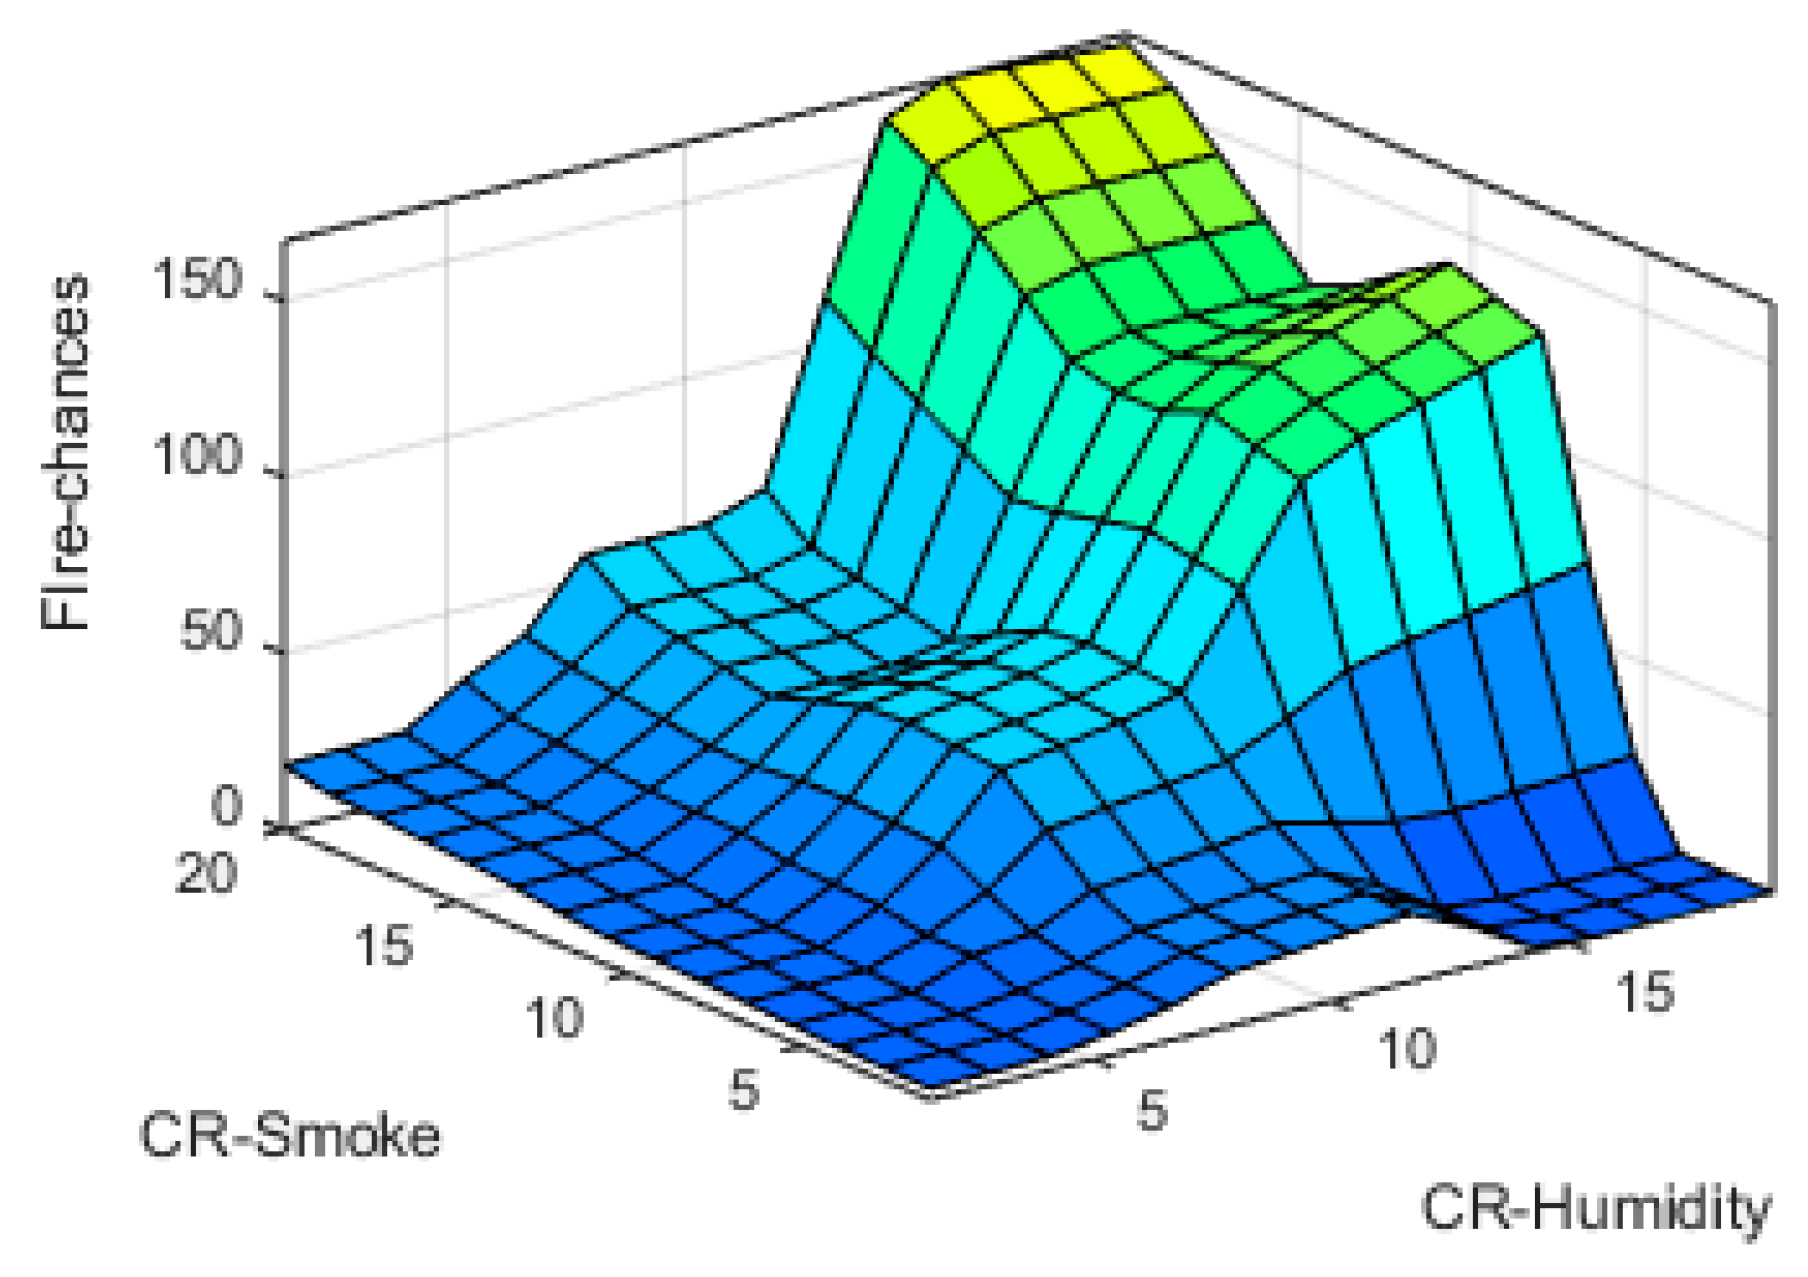
Figure 22.
CR-smoke vs. CR-Humidity surface Plot.
Figure 22.
CR-smoke vs. CR-Humidity surface Plot.
Table 1.
A sample of experimentally measured data in real-time.
Table 1.
A sample of experimentally measured data in real-time.
| Time | Flame Presence | Smoke | Humidity | Temperature |
|---|
| 5:19:17 PM | No Flame | 3.04 ppm | 22.00% | 35.00 °C |
| 5:19:18 PM | No Flame | 3.04 ppm | 22.00% | 35.00 °C |
| 5:19:19 PM | No Flame | 3.04 ppm | 22.00% | 35.00 °C |
| 5:19:21 PM | No Flame | 3.04 ppm | 23.00% | 35.00 °C |
| 5:19:22 PM | No Flame | 3.04 ppm | 22.00% | 35.00 °C |
| 5:19:24 PM | No Flame | 3.04 ppm | 23.00% | 35.00 °C |
| 5:19:25 PM | No Flame | 3.04 ppm | 23.00% | 35.00 °C |
| 5:19:27 PM | No Flame | 3.04 ppm | 22.00% | 35.00 °C |
| 5:19:28 PM | No Flame | 3.04 ppm | 22.00% | 35.00 °C |
| 5:19:30 PM | No Flame | 3.04 ppm | 22.00% | 35.00 °C |
| 5:19:31 PM | No Flame | 3.04 ppm | 22.00% | 35.00 °C |
| 5:19:33 PM | No Flame | 3.04 ppm | 22.00% | 35.00 °C |
| 5:19:34 PM | No Flame | 3.04 ppm | 22.00% | 35.00 °C |
| 5:19:36 PM | No Flame | 3.08 ppm | 23.00% | 36.00 °C |
| 5:19:37 PM | Flame detected! | 3.12 ppm | 24.00% | 36.00 °C |
| 5:19:39 PM | Flame detected! | 3.31 ppm | 24.00% | 36.00 °C |
| 5:19:40 PM | Flame detected! | 3.38 ppm | 25.00% | 36.00 °C |
| 5:19:42 PM | Flame detected! | 3.34 ppm | 25.00% | 36.00 °C |
| 5:19:43 PM | Flame detected! | 3.31 ppm | 24.00% | 36.00 °C |
Table 2.
C-R-Temp, C-R-Temp, and time of fire detection with experiment 1.
Table 2.
C-R-Temp, C-R-Temp, and time of fire detection with experiment 1.
| | Experiment 1 | |
|---|
| Sr.no | Time Interval (Minute) | C-R Temp (°C) | C-R Humidity (%) | C-R Smoke (ppm) |
|---|
| 1 | 2.8 | 0 | 0 | 0 |
| 2 | 3 | 2 | −2.8 | 3.8 |
| 3 | 4.1 | 3.8 | −1.3 | 4 |
| 4 | 4 | 6.4 | 10.8 | 10.2 |
| 5 | 2 | 3 | 7.1 | 4.12 |
| 6 | 3.3 | 4.6 | 9.5 | 8.56 |
| 7 | 1.4 | 2 | 5 | 4 |
| 8 | 2.44 | 5 | 7.6 | 10 |
Table 3.
C-R-Temp, C-R-Temp, and time of fire detection with experiment 2.
Table 3.
C-R-Temp, C-R-Temp, and time of fire detection with experiment 2.
| Experiment 2 |
|---|
| Time Interval (Minutes) | CR-Temp (°C) | CR-Humidity (%) | CR-Smoke (ppm) |
|---|
| 1.5 | 0.6 | 0.8 | 0.9 |
| 1.16 | 2.2 | 1.9 | 3.3 |
| 56 s | 1.2 | 2.2 | 3 |
| 2.38 | 3 | 2.5 | 6 |
| 2.12 | 1 | 2 | 2 |
| 1.56 | 3 | 6 | 5.5 |
| 2 | 2.8 | 8 | 6 |
| 2 | 3.2 | 6 | 6.73 |
Table 4.
The universe of discourse for each membership function.
Table 4.
The universe of discourse for each membership function.
| Variable | CR-Temp (°C) | CR-Humidity (%) | CR-Smoke (ppm) | Fire-Chances | Time (Min) |
|---|
| Low | 0–4 | 0–8 | 0–8 | 0–30 | - |
| Mid | 2.5–8.5 | 5–14 | 5–15 | 30–60 | - |
| High | 5.5–10 | 12–20 | 12–20 | 60–100 | - |
| Short | - | - | | - | 0–5 |
| Long | - | - | | - | 4–9 |
Table 5.
Rules for FMWS (according to flame presence).
Table 5.
Rules for FMWS (according to flame presence).
| Flame | Repeat First Step | Go to Next Step |
|---|
| Flame Detected | No | Yes |
| Flame is not detected | Yes | No |
Table 6.
Experimental analysis of CR-Temp(C).
Table 6.
Experimental analysis of CR-Temp(C).
| Sr. No | CR-Temp (C) | Fire Chances | Condition |
|---|
| 1 | 0–2 | 0–20 | Normal |
| 2 | 2–5 | 20–40 | Critical |
| 3 | 5–10 | >60 | Severely critical |
Table 7.
Experimental analysis of CR-Humidity (%).
Table 7.
Experimental analysis of CR-Humidity (%).
| Sr. No | CR-Humidity | Fire Chances | Condition |
|---|
| 1 | 0–8 | 0–20 | Normal |
| 2 | 4–14 | 20–40 | Critical |
| 3 | >15 | >60 | Severely critical |
Table 8.
Experimental analysis of Smoke (ppm).
Table 8.
Experimental analysis of Smoke (ppm).
| Sr. No | Smoke (ppm) | Fire Chances | Condition |
|---|
| 1 | 0–8 | 0–20 | Normal |
| 2 | 4–14 | 20–40 | Critical |
| 3 | 12–20 | >60 | Severely critical |
Table 9.
Comparison of two related technologies FIS and ANFIS.
Table 9.
Comparison of two related technologies FIS and ANFIS.
| Properties | Methods |
|---|
| FIS | ANFIS |
|---|
| Non-linear characterization | Yes | Yes |
| Automatic training | No | Yes |
| Knowledge needed for modeling biological phenomenon | A lot of human effort Requires | Do automatically from Datasets |
| Automatic Adaptation of output and membership functions | No | Yes |
Table 10.
Comparison of original case, ANFIS case, and FIS case.
Table 10.
Comparison of original case, ANFIS case, and FIS case.
| Sr. No. | CR-Temp (°C) | Flame Presence | CR-Humidity (%) | CR-Smoke (ppm) | Time (Min) | Chances of True Fire (%) | ANFIS Case | FIS Case | Original Case | Accuracy (%) |
|---|
| 1 | 1.53 | 1 | 7.85 | 2.1 | 2.53 | 8.4 | Low | Low | Low | 100% |
| 2 | 5.1 | 1 | 9.9 | 10.3 | 5 | 50 | Mid | Mid | Mid | 100% |
| 3 | 3.66 | 1 | 9.6 | 9.5 | 2.53 | 40 | Mid | Mid | Mid | 100% |
| 4 | 7.31 | 1 | 12.9 | 14.4 | 1.99 | 61.2 | High | High | High | 100% |
| 5 | 7.89 | 1 | 14.3 | 13.4 | 7.3 | 82.9 | High | High | High | 100% |
| 6 | 1.87 | 1 | 3.01 | 5 | 1.49 | 14.3 | Low | Low | Low | 100% |
| 7 | 2.71 | 1 | 5.18 | 5.2 | 2.51 | 45 | Mid | Mid | Mid | 100% |
| 8 | 8.1 | 1 | 7.35 | 14.2 | 1.39 | 67.7 | High | High | High | 100% |
| 9 | 6.69 | 1 | 17.2 | 12.9 | 2.35 | 83.4 | High | High | High | 100% |
| 10 | 1.27 | 1 | 14.8 | 2.4 | 2.35 | 45 | Low | Mid | Low | 100% |
| 11 | 5.48 | 1 | 10 | 10.3 | 1.39 | 65.9 | High | High | High | 100% |
| 12 | 8.9 | 1 | 16.1 | 15.2 | 4.04 | 83.9 | High | Mid | High | 100% |


