1. Introduction
With the proliferation of technological advancement, the idea of a smart city is emerging day by day. A city is named as smart once its intelligent and sustainable infrastructure is integrated with advanced technological solutions [
1]. The essential purpose of building a smart city is providing a sustainable, environment-friendly life to its residents. It is predicted that 66% of the world population is expected to live in urban areas by 2050 [
2]. Due to the industrial revolution and rapid urbanization, human societies are in great strain on resource consumption and environmental issues [
3]. Thus, it has become an important issue to keep track of footpath traffic and environmental parameters for urban planning, retail development, major event crowd assessments, pedestrian safety, traffic flow management and assessments of the street development.
Researchers are seeking interest in people counting in office buildings as well as public places such as train stations. There are numerous researches that have been carried out on human counting using different technologies in the indoor environment [
4,
5,
6]. Occupancy counting in smart buildings is implemented via video cameras, thermal cameras, sensors, radio frequency identification (RFID) and Wi-Fi [
7] probe requests [
8,
9,
10,
11].
One of the most extensively used methods of human counting is the usage of a video camera. It also has a wide range of applications in the surveillance of potential areas for detecting unusual events, tracking customers in retail stores to control and monitor the movements of assets, monitoring elderly and sick people staying at home alone, recognize and track people [
12]. The number of people in each frame of the video camera are determined based on the image processing algorithm. Some methods count the number of people by counting heads, whereas some methods count faces from the captured images [
13]. However, the system count and actual count vary due to the spatial characteristics of the area under surveillance (confined compared to open area), features extracted from the image, expected response time (real-time requirements compared to offline processing) and the maximum size of the crowd. Moreover, the performance of the video camera degrades due to environmental conditions such as sudden luminosity changes, camera location and angle of view. Furthermore, the process of counting people is complicated and very costly in terms of computing and money [
14]. There is an infringement of privacy. This technique allows accuracy up to 95% for an indoor surveillance environmental and 85% for outdoor applications [
15].
A thermal camera is another popular method for human detection. It is also used for vehicle detection, search for victims at night, spot smoldering fires inside a wall and detecting overheating electrical wiring. The thermal camera functions by detecting the infrared energy emitted by an object which is known as a heat signature and creating an image electronically based on information about the temperature differences. Compared to optical imaging, thermal imaging cameras are advantageous for night-time video surveillance. It can be used where pedestrians’ privacy respect cannot be violated. However, it also outperforms the bad results obtained from visible images due to occlusions or closing texture [
16]. Moreover, the size and weight of the camera are quite big (4 kg to 7 kg), and it consumes a high current (250 mA), which requires additional circuitry to run by an IoT enabled microcontroller based system [
17].
PIRs are other important technologies for human detection. These low-cost motion sensors respond when an infrared (IR) emitting subject (humans or animals) passes through its FoV [
18]. PIR sensors have been employed by many researchers for human detection, localization and gait velocity estimation at indoor surveillance. Zappi et al. (2010) proposed an array of Passive Infrared sensors (PIR) placed on the ceiling to determine the number of people passing the hallway. They detected the position and direction of movement from the analogue output signal of PIR which consists of two peaks. However, the drawback of the system is that it cannot detect more than one person at a time [
19]. Wang et al. (2014) showed two fusion methods for determining the building occupant level. The first method assumed independent observations of the multiple systems, whereas the second method exploits the correlation among the multiple information sources. They combined two methods and compared the experimental results with the results obtained from individual RFID or video cameras. The maximum accuracy of this fusion method is 73% only [
20].
The usage of PIR sensors does not violate human privacy, unlike the video camera. It needs 3.3–5 V supply to drive the PIR sensors. It consumes only 3 mA current while sensing [
21]. Therefore, it is possible to use the sensors in a microcontroller-based system. As the current consumption is deficient, there is no necessity to use any amplifier [
22]. Therefore, the circuitry becomes very simple. These sensors have been widely used for human presence detection in the indoor environment [
23]. However, it is not used in the outdoor environment to date as its performance degrades with the change in temperature and humidity.
The radio frequency identification (RFID) technology is also used for the identification of objects and people. There are two main components of an RFID network such as RFID readers and RFID tags. It then reflects signals with the tags’ unique identification number to the reader. The RFID reader emits electromagnetic waves and activates the RFID tags [
24]. RFID tags are classified as active and passive. Between these two, passive RFID tags are vastly used due to long life and cost-effectiveness. Among various applications, some potential applications are occupancy counting in smart buildings, building evacuation during natural disasters or terrorist attack, bus and railway stations, smart parking systems, asset tracking, bill payment in toll gates, track prisoners, etc. [
25,
26,
27].
The utilization of Wi-Fi probe requests is another important aspect of human counting and tracking inside office buildings. Ciftler et al. (2018) used Wi-Fi probe requests for human occupancy monitoring and tracking in smart buildings. Probe requests are continuously broadcasted signals from devices having Wi-Fi technology, such as smartphones, laptops and tablets. The unencrypted probe requests can be captured and decoded using passive sniffers without connecting to a particular network. The proposed method was able to differentiate the peak and off-peak hours of individual zones and track zone-level occupancy tracking with a maximum accuracy of 90%. This is adaptable for localization of pinch points of a building, tracking and occupancy counting for indoor surveillance [
28].
In addition to the development of occupancy counting in smart buildings, some cities of the USA, Europe and Australia have already started adopting smart technologies in their cities for pedestrian counting and collecting environmental data. These data are collected to have an adequate understanding of the ongoing trends of pedestrian activity. This helps to plan and respond to emergencies. Moreover, this data helps the city planner to take a decision quickly. The pedestrian counting system of Melbourne uses both camera and laser-based sensors, whereas Auckland, New York, Dublin, and Barcelona use only camera-based technology. Some systems (Auckland, New York and Liverpool) are typically installed under canopies or on street poles. Some other systems (Melbourne, Dublin and Barcelona) need separate installation facilities, which are an extra financial burden. The data collected are transferred to the server and uploaded on the website for public use via the 3G communication box. Although the usage of 3G communication covers a more extended range compared to Wi-Fi, ZigBee [
29] or other communication protocols, they consume excessive device energy [
30]. Moreover, the power consumption of the camera-based system is higher compared to the sensor-based prototype. A summary of the existing pedestrian counting system is shown in
Table 1. Although the existing systems can serve the purpose, power consumption, cost and people’s privacy concerns should also be addressed. Therefore, it has become an important issue to come up with a low-power, low-cost, compact, accurate system. Having additional features will be more advantageous.
After reviewing the technologies used for pedestrian counting, it is decided to use the PIR sensors in this research as it is a cost-effective, low-power sensor compared to other existing technologies. The drawbacks of the PIR sensors are considered while designing the prototype. Therefore, the developed prototype will be able to overcome the downsides of the sensors. This paper presents a novel compact system that not only provides the pedestrian count but also gives information about the pedestrian’s direction of travel and environmental data such as temperature, humidity, pressure, CO2 and TVOC. The novel contributions of this paper can be summarized as follows:
The sensitivity of the PIR sensors has been tuned, and a specific section from the Fresnel lens is chosen for receiving the IR emission from 1 m above the ground. Therefore, domestic animals such as dogs or cats will not be detected while crossing the footpath as the maximum shoulder height of a domestic dog is less than 100 cm [
37].
A novel method of the pedestrian count and direction detection system has been designed. Three PIR sensors cover the detection region across the width of footpath in such a way that the detection regions of the sensors do not overlap. Each of the three sensors is horizontally paired with another three sensors such that each pair can validate their detection as well as find the direction of travel of the pedestrian. Therefore, the system can provide highly accurate results, up to 95% compared to manual counting.
A microcontroller-based low-power sensing device along with the low-power communication system has been proposed to increase the battery life. The system can be installed on the street pole without altering the other infrastructure of the city.
2. Materials and Methods
This section presents the necessary explanation for developing the smart counting system. It also explains the FoV of Fresnel lens of the PIR sensors, the novel method of pedestrian detection and finding the direction of travel, proposed algorithm, installation system, study locations, data transmission and collection system.
2.1. Field of View for PIR Sensor
A PIR sensor consists of two sensing elements and a Fresnel lens. The Fresnel lens focuses the emitted IR radiation to the sensing element. The sensing element absorbs the IR radiation and converts it into heat, which is converted into a minute electric current by the pyroelectric crystalline material [
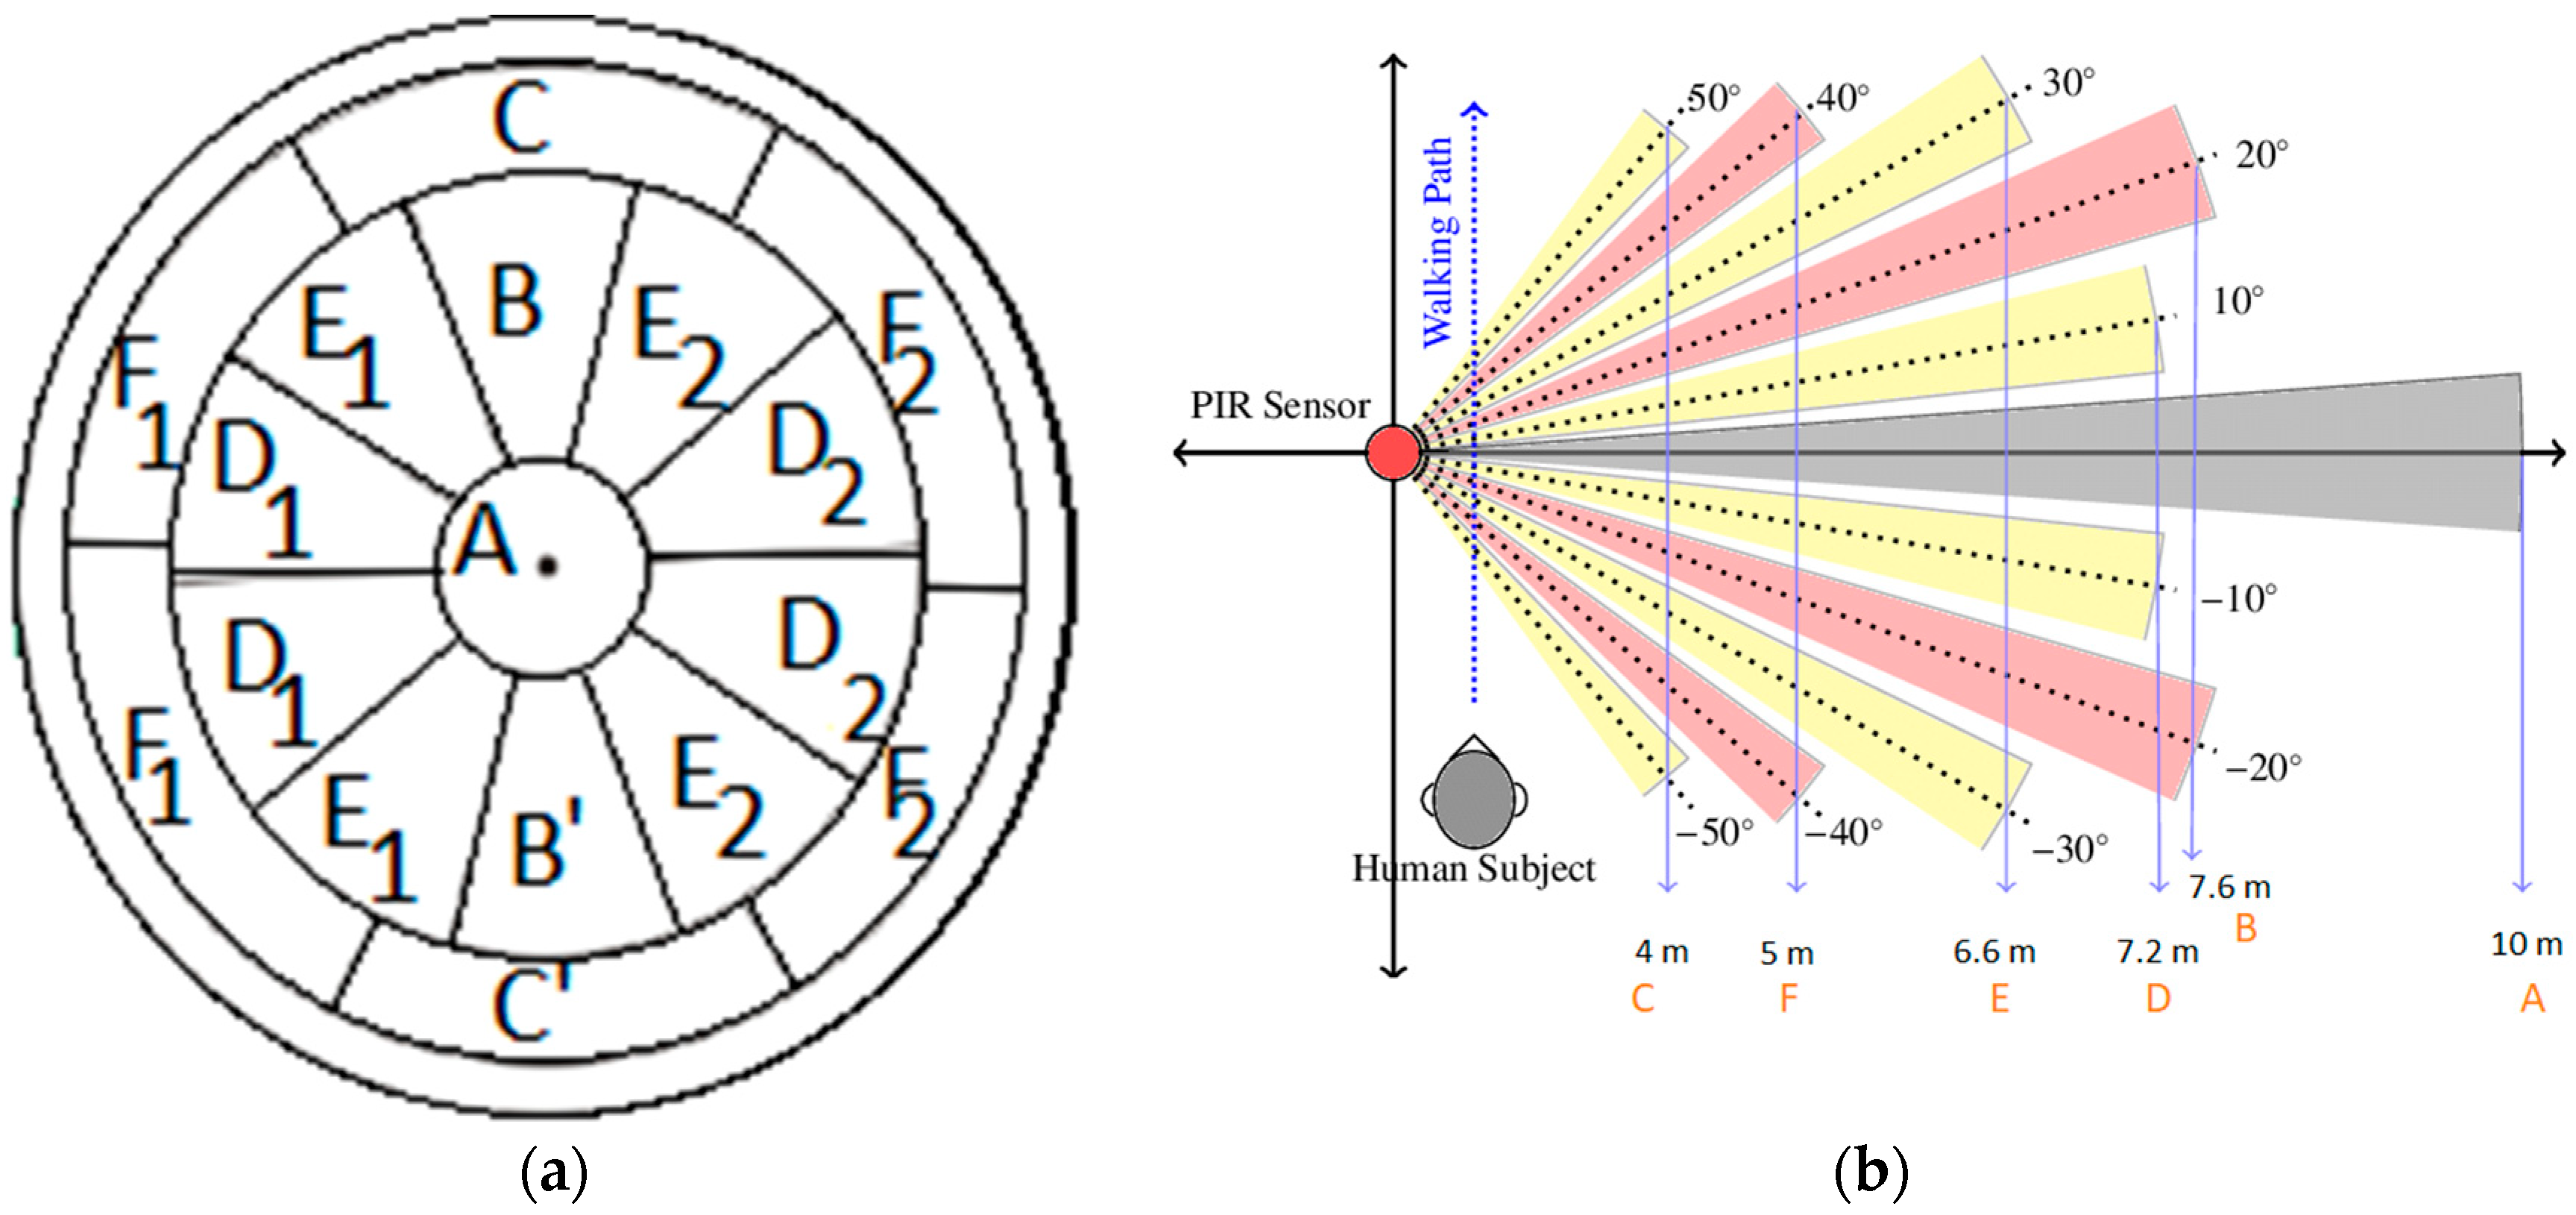
18]. A Fresnel lens is composed of a series of concentric grooves having a standard focal length. The significant advantage of the Fresnel lens is that the propagation direction of light does not change within a medium but only deviates at the surfaces of a medium. The different faceting and sub-lenses of the Fresnel offer a range of detection areas. The focal point of the FoV is divided into A-F sections (
Figure 1a), which are 10 degrees apart from each other. The different sections (A–F) of the Fresnel lens offer a detection range from 4 m–10 m at full sensitivity, as shown in
Figure 1b. The detection length can be decreased to 1.8 m at reduced sensitivity. The usage of the A-section at full sensitivity implies the installation of the sensor node at 11 m height of the pole. This is not possible in the practical scenario as the maximum height of the lamp posts is 6.5 m [
38]. Therefore, it is necessary to operate the PIR sensors at a reduced sensitivity mode rather than full sensitivity. The detection length of each section of the Fresnel lens is measured by walking towards that section from a far distance covering other sections with Polyvinyl chloride (PVC) tape.
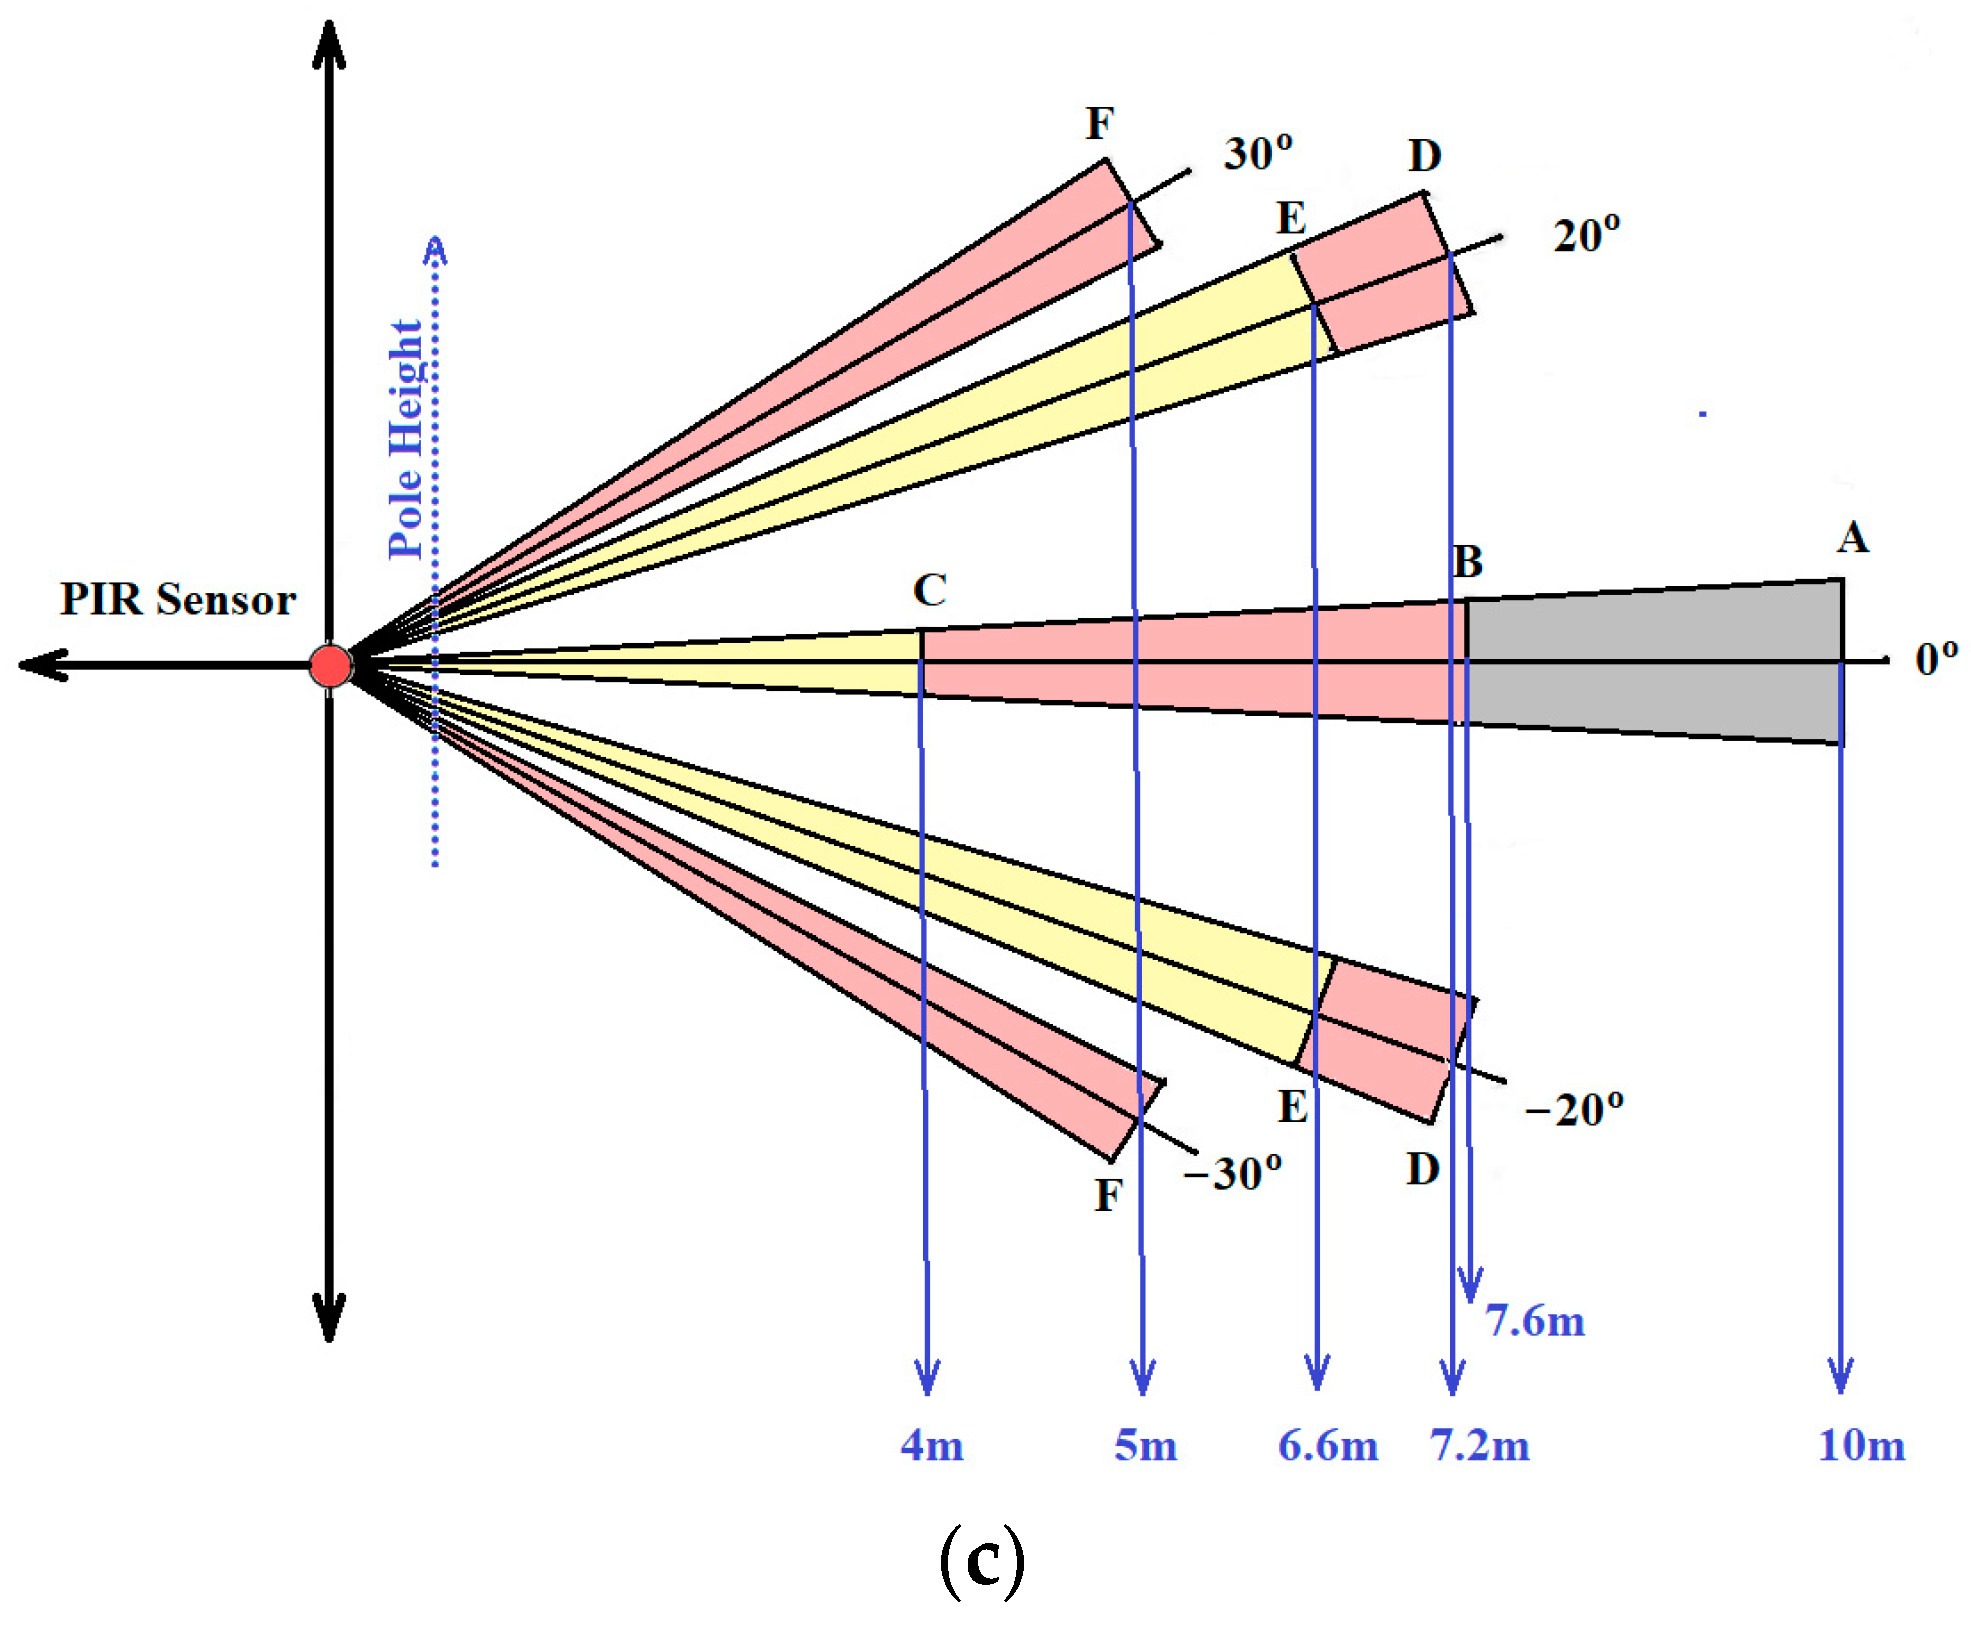
Figure 1b,c shows the top view and side view of the FoV of the Fresnel lens of the PIR sensor (Parallax Inc., Rocklin, CA, USA, 555-28027 PIR sensor module) at full sensitivity while
Table 2 shows the experimentally verified detection lengths of the A to F sections at full and reduced sensitivity.
2.2. Method for Pedestrian Detection
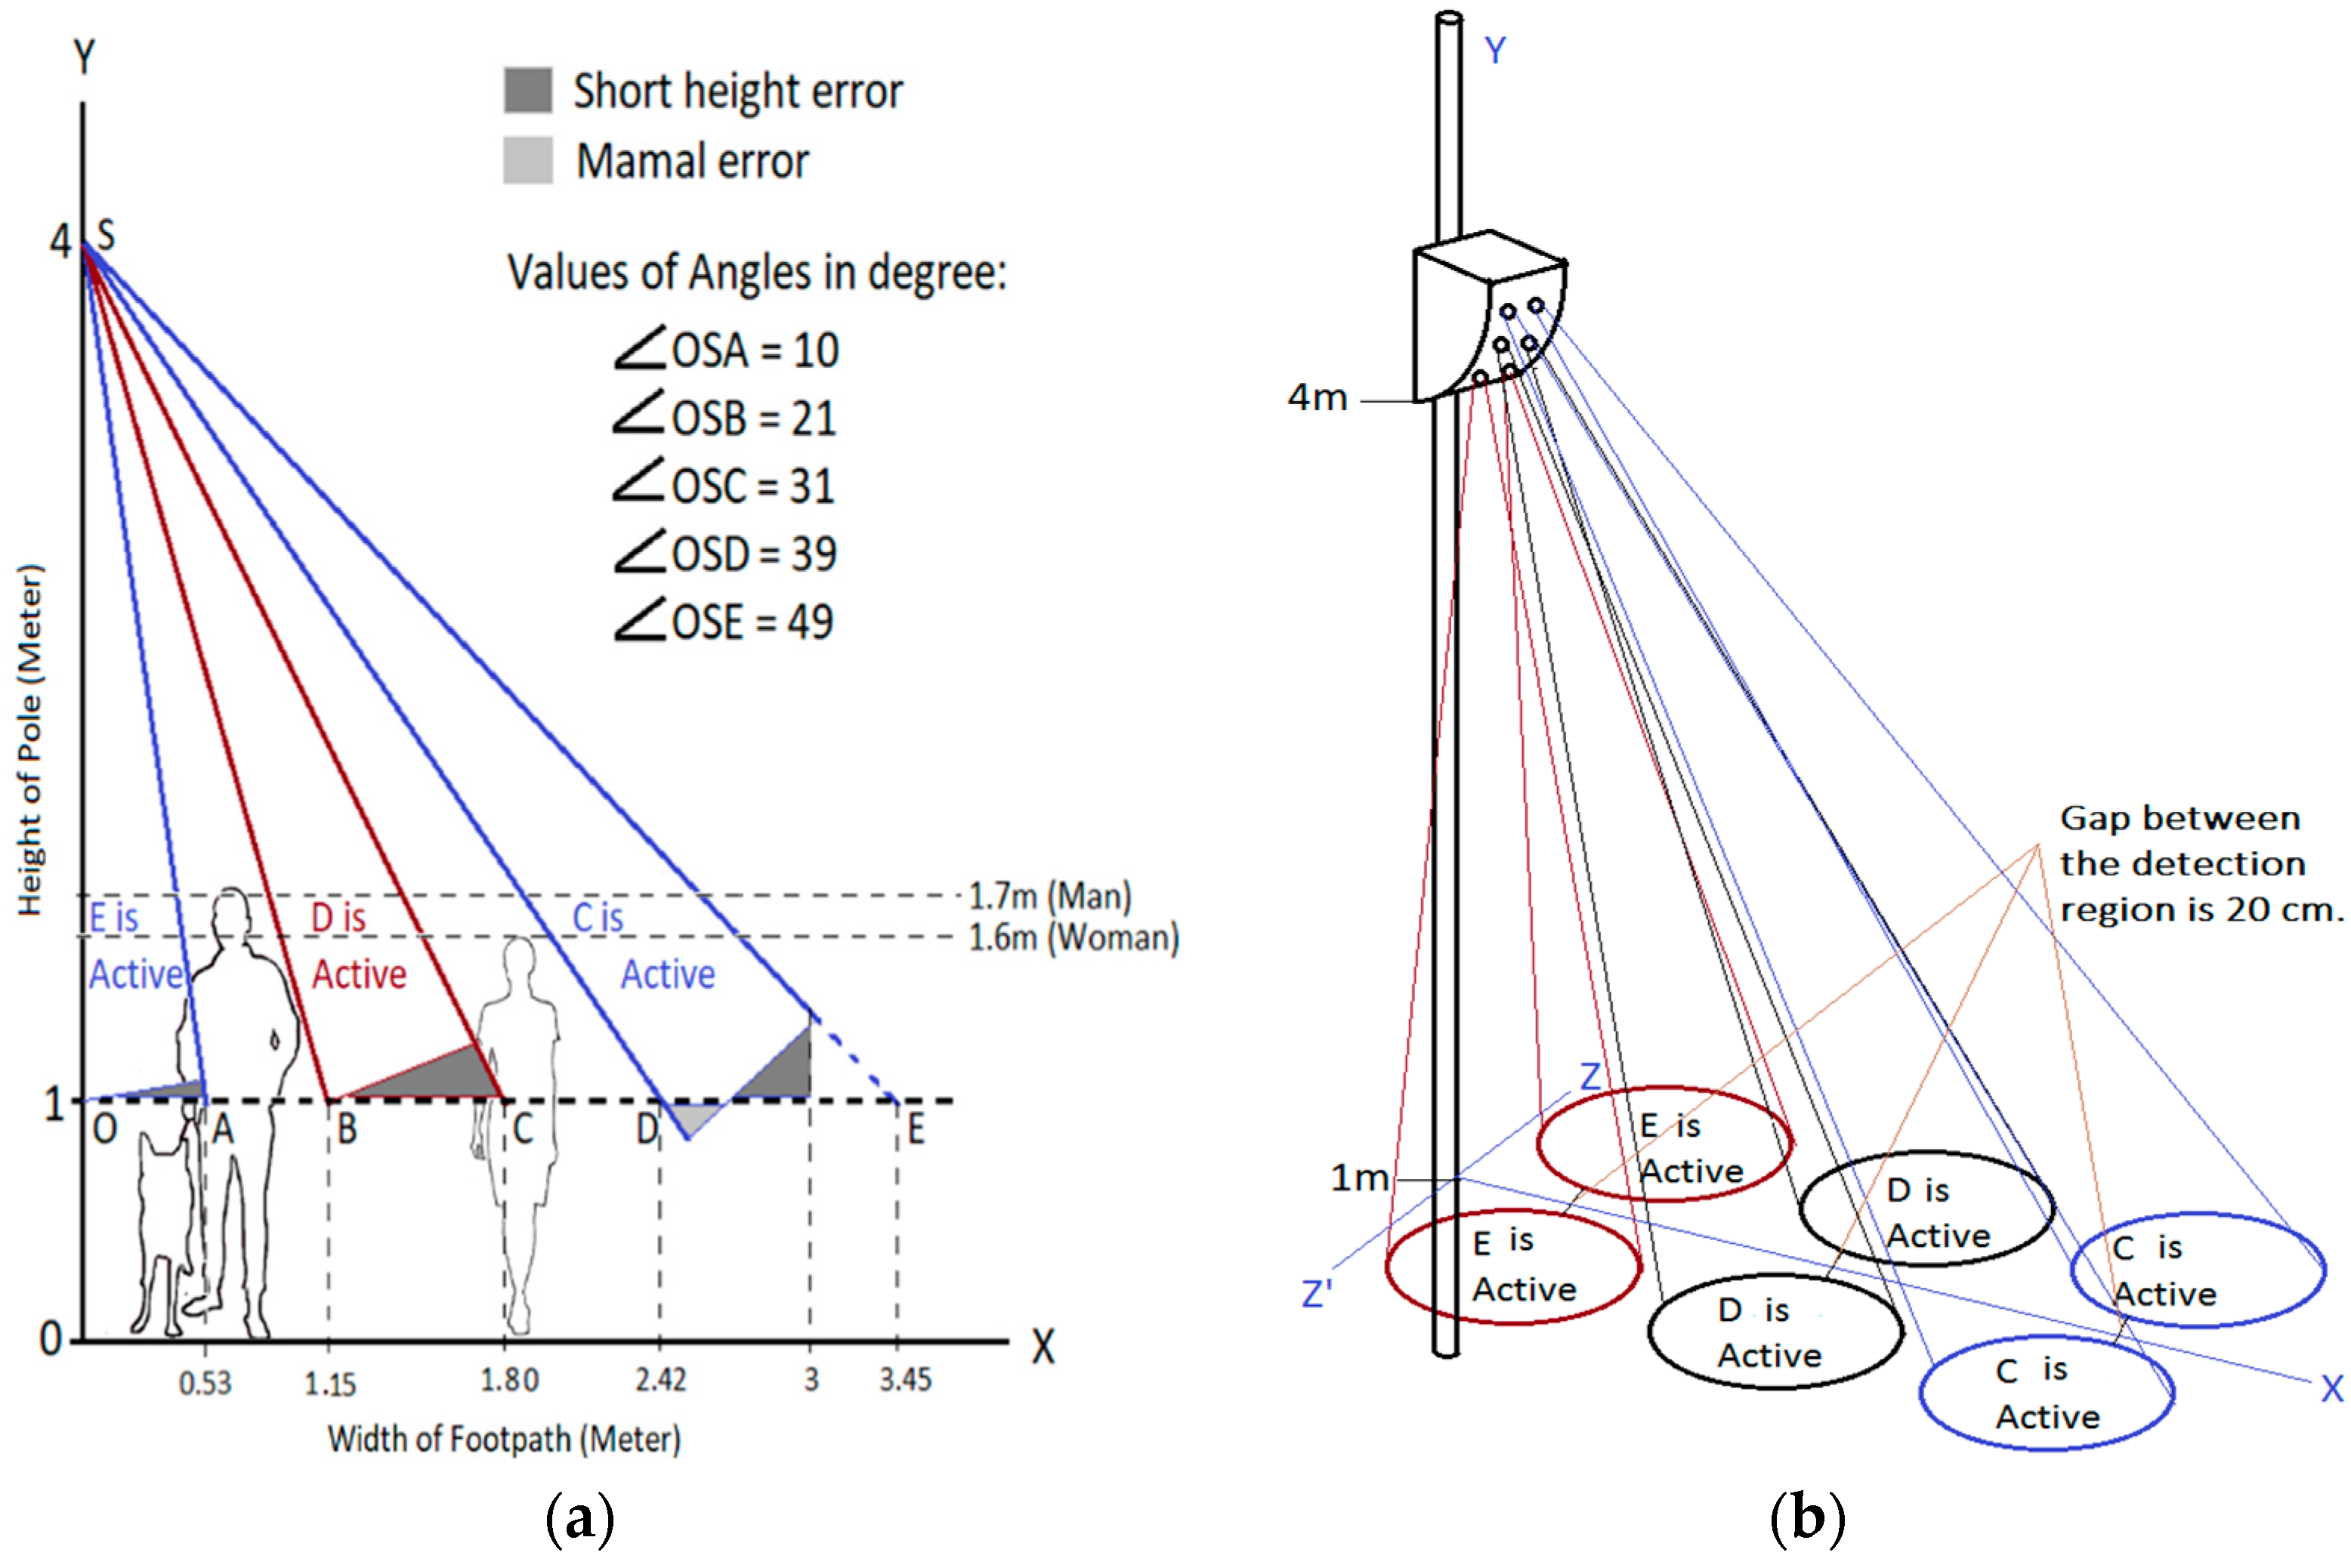
This research aims to cover 3 m wide footpath and limit the detection length to 1 m from the street level for avoiding the domestic animal. Three pairs of PIR sensors are used to develop the node for counting pedestrian and finding the direction of travel. The sensor node is mounted at 4 m of the electric pole, as shown in
Figure 2a. The bottom PIR pair is placed at 0° from the y-plane so that a person walking adjacent to the pole can also be detected. Each section of the Fresnel lens has 10° FOV. Therefore, the detection region of the bottom pair can be calculated as follows:
To find the appropriate focus angle of the middle pair of the PIR sensors, it is assumed that a person is standing at the edge of the detection region of the bottom pair as shown in
Figure 2a. The middle pair is placed in such a way that the person detected by the bottom pair does not fall in the coverage region of the middle pair. From the graphical representation of this scenario, it is determined that the middle pair detection region should start at 21° from the y-plane. Therefore, this middle pair detection region ends at 31° from the y-plane. The minimum and maximum coverage regions of the middle pair are calculated as follows:
Detection regions of the top pair are calculated in a similar manner and values are shown in
Figure 2a. Coverage regions of the sensors do not overlap due to applying this method while locating the PIR sensors. Therefore, the error can be minimized.
The required detection length of the bottom, middle and top PIR sensors can be found using the formula of a right-angle triangle, which is, The values of SA, SB and SD are calculated as 3 m, 3.17 m and 3.87 m, respectively. The appropriate selection of the sections of the Fresnel lens is necessary to minimize the error. If the selected section detects more area under the 1 m height of clearance, then tall domestic pets, such as dogs will be detected. When the selected section detects less area above the 1 m clearance, then pedestrians having a shorter height such as 1.1–1.2 will not be detected. As it is not possible to fine-tune the detection length of the commercial PIR sensor to achieve a full area of coverage, the section should be selected that provides minimum error region. Therefore, E, D and C- sections are kept active for the bottom, middle and top pairs, respectively. Bottom and middle PIR sensor pairs are operated at reducing sensitivity, whereas the top pair operates at full sensitivity to minimize the error. People on wheel-chair also come under the detection region.
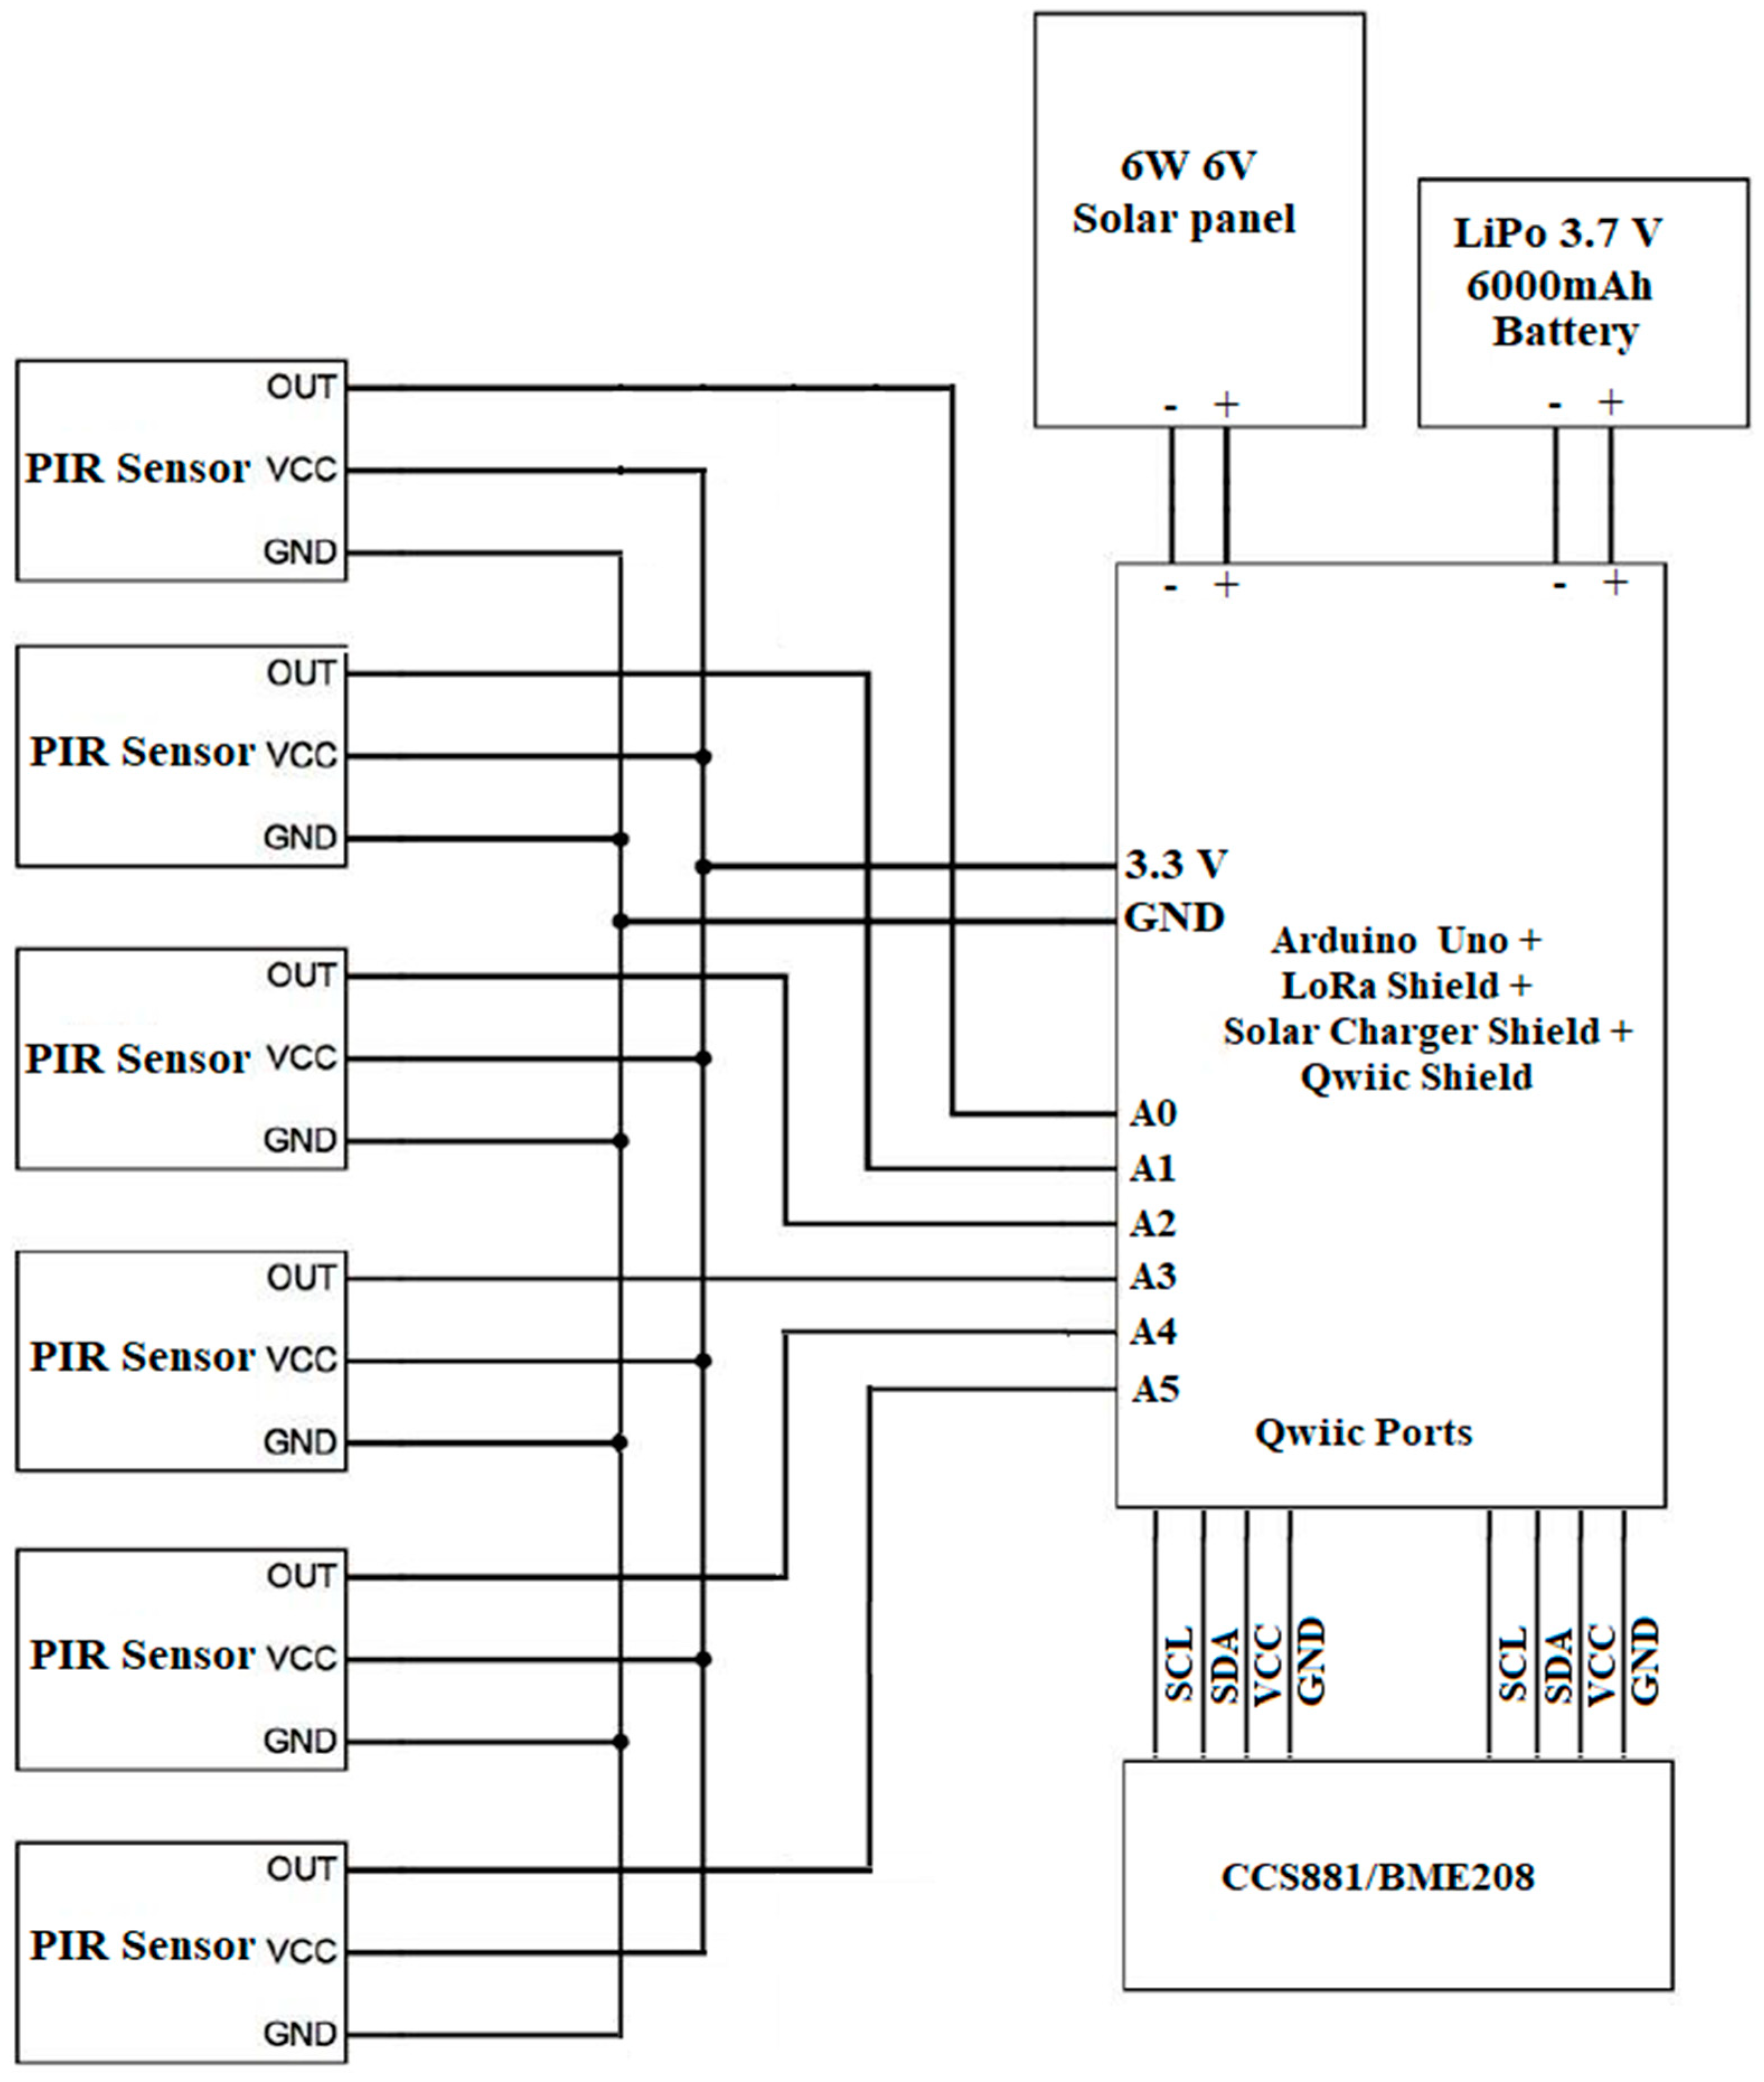
2.3. Development of the Sensor Node
The proposed system consists of six PIR sensors, one environmental combo sensor [
39], QWIIC shield [
40], Arduino UNO microcontroller [
41], power converter [
42], LoRa shield [
43] for radio communication, solar panel [
44] and rechargeable battery [
45] to provide continuous energy. The PIR sensors are connected to the analog inputs of Arduino Uno. The environmental combo is connected to the Arduino Uno via the QWIIC shield that has four 3.3 V I
2C ports and I
2C sensors are connected to the shield via the QWIIC cable [
46]. The solar charger shield and the LoRa shield are also connected with the main microcontroller. The 6000 mAh rechargeable battery and 6 V solar panel are connected with the power management block. A summary of the types of sensors and other electronics are listed in
Table 3 and the circuit block diagram of the proposed system are shown in
Figure 3.
All the sensors and the necessary electronics were placed inside the mould that is designed using the Fusion 360 software, as shown in
Figure 4a. A curvature plane was created to place the PIR sensors at the proposed angles. The PLA (PolyLactic Acid) filament was used to print the design in the DREAMER 3D PRINTER [
48]. PIR sensors are placed in the holder in such a way that the E, D and C sections function for the bottom, middle and top pairs of the PIR sensors, respectively. Due to the usage of the holders, direct sunlight cannot affect the performances of the PIR sensors. A unique environmental combo sensor’s holder was designed to hold the sensor, which was connected with the glue on the box. One side of the holder is open so that it is exposed to the environment and able to read the environmental parameters such as temperature, humidity, pressure, CO
2 and TVOC. The processing units and all the connections are located inside the mould.
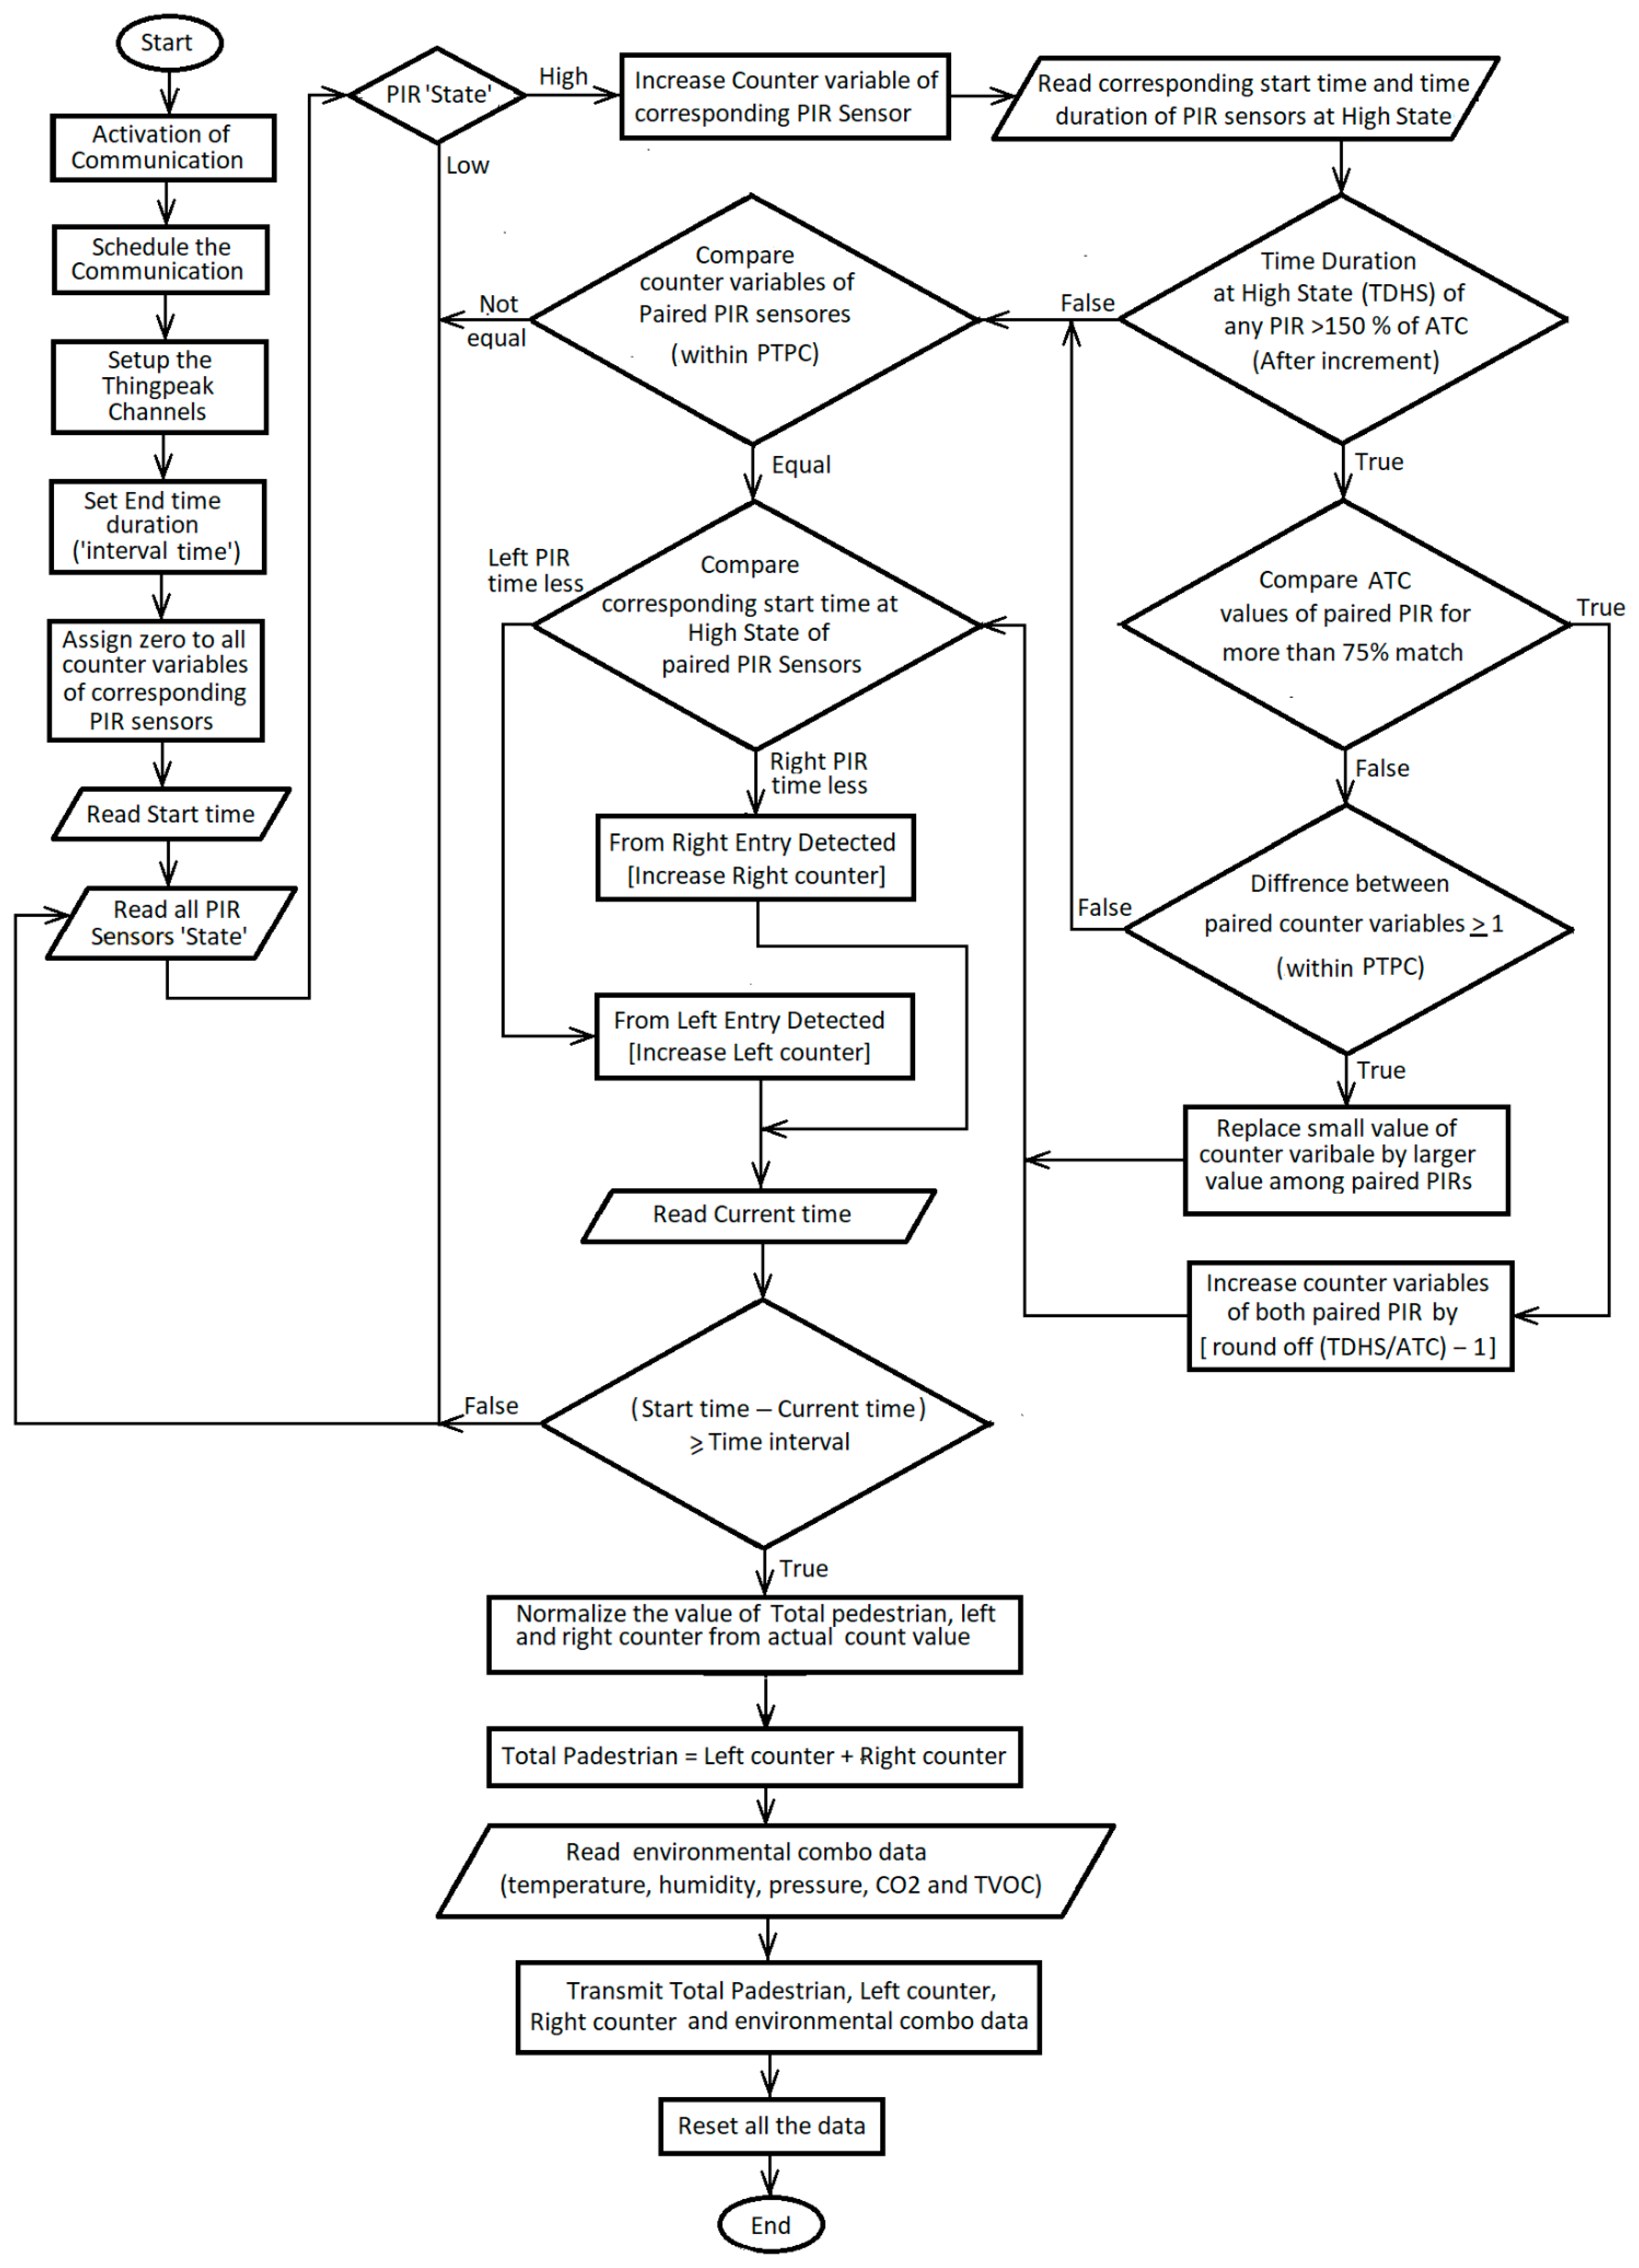
2.4. Algorithm of the Pedestrian Count
To use the PIR sensors as the human counter, an intelligent algorithm has been developed to count accurately the number of pedestrians within the focus area of the PIR sensor. A flag variable and counter variable are used in this algorithm. Initially, the flag variable is stated at a LOW state. Usually, the output is LOW for the PIR sensor. The PIR sensor changes from LOW to HIGH state as soon as any person enters its focus zone and stays at the HIGH state for a certain duration before it goes back to LOW state. The time duration can be adjusted and is set in such a way so that the person takes a similar amount of time to walk the duration of its focus angle. Due to the change of state of the PIR sensor from LOW to HIGH, the value of the counter variable is increased by one and immediately the state of the flag variable is switched to HIGH state. This algorithm prevents the counter from counting more than once for the duration a pedestrian takes to cross the coverage region of the PIR sensor. As soon as the sensor goes LOW, the flag variables state is also changed to LOW and waits for the next person to cross.
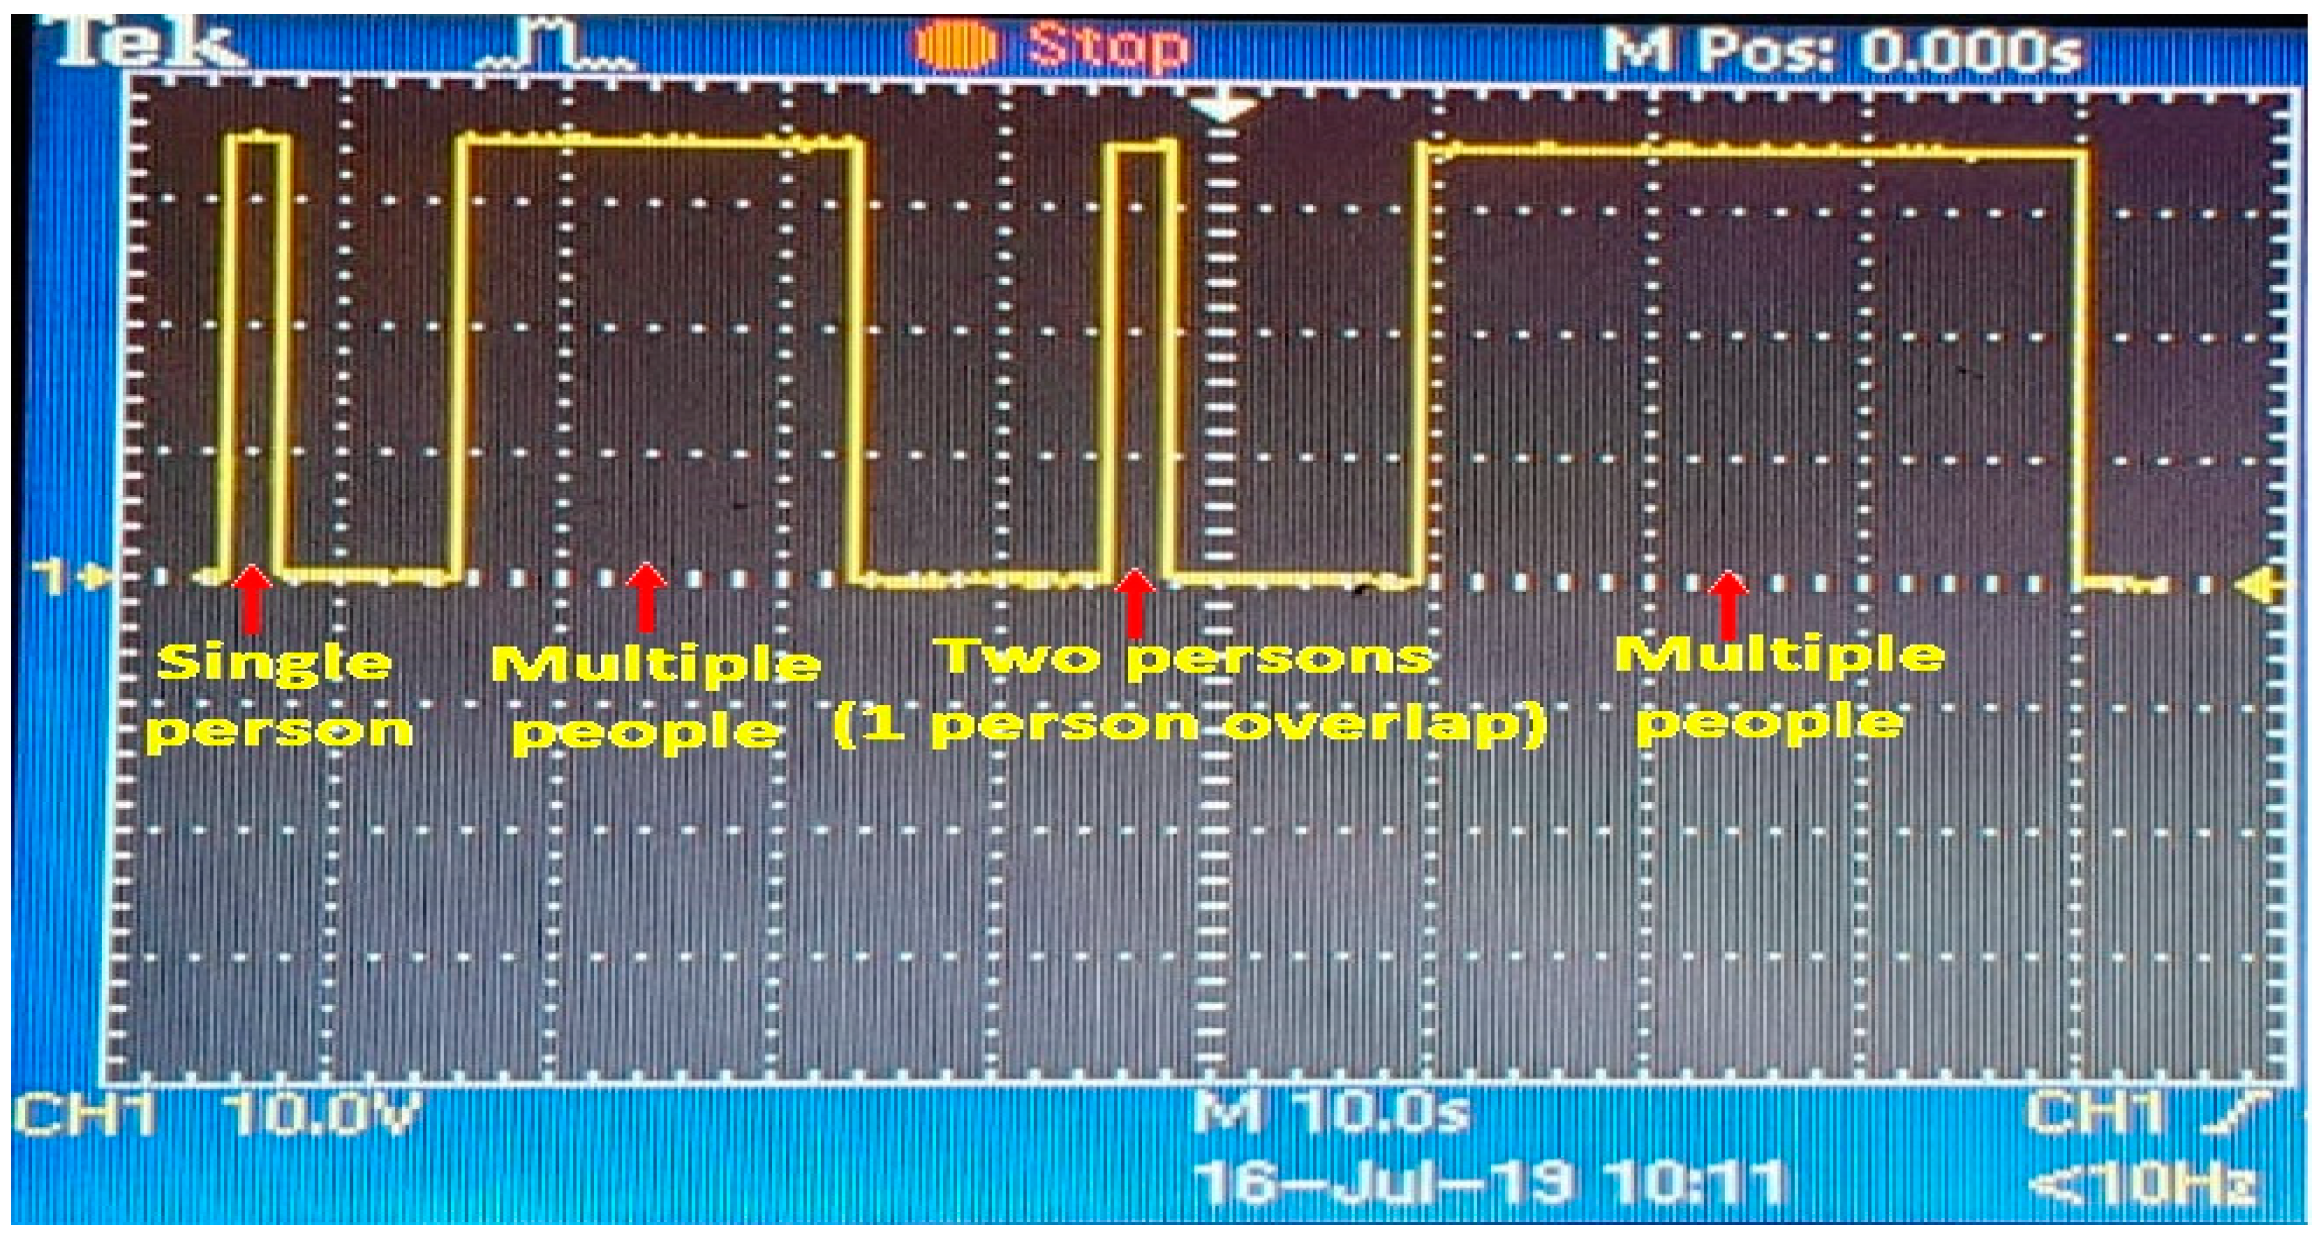
The direction of the pedestrian is determined from their entry time of the incident IR beam. The width of the footpath is divided into three zones, and each zone is covered with one pair of the PIR sensors. When a pedestrian is crossing a zone, he will trigger both the sensors in the pair. By recording the entry times of each sensor beam and comparing the earliest time among them, the direction is detected. This algorithm may provide incorrect results if a second person enters the focus zone of a PIR sensor before the transition from HIGH to LOW due to the first person. In this case, the duration of HIGH state gets extended as shown in
Figure 5 and multiple passersby can be counted as a single individual. To avoid such a scenario, an error correction algorithm is developed.
The error correction algorithm is based on a comparison of the average time of crossing (ATC) a PIR sensor coverage area by a human, with the time duration at HIGH state (TDHS) of the corresponding sensor. The average time required to cross the coverage region (
dp) of the PIR sensor by a human walking with a speed (
Vp) is found as:
This algorithm mathematically calculates the number of the people, i.e., the increment of the counter variable as:
The error correction is activated for any PIR sensors that stay HIGH for more than 1.5 times of the ATC considering 50% tolerance. Before adding the corrected increment to the counter variable, it also compares the TDHS of the other sensor in the pair. Each of the paired sensors is placed in the mould at an angle that produces a 20 cm gap between their coverage regions. Therefore, the probable time period of crossing (PTPC) between the paired sensors is calculated as:
If the values of TDHS for both the sensors in a pair are 75% near each other or the value of the counter variable is more than one for any PIR sensor in a pair within the PTPC, the increment is added. Otherwise, it does not add any increment correction. After counting the number of pedestrians by each pair of the PIR sensor, the total number of pedestrians is calculated as follows:
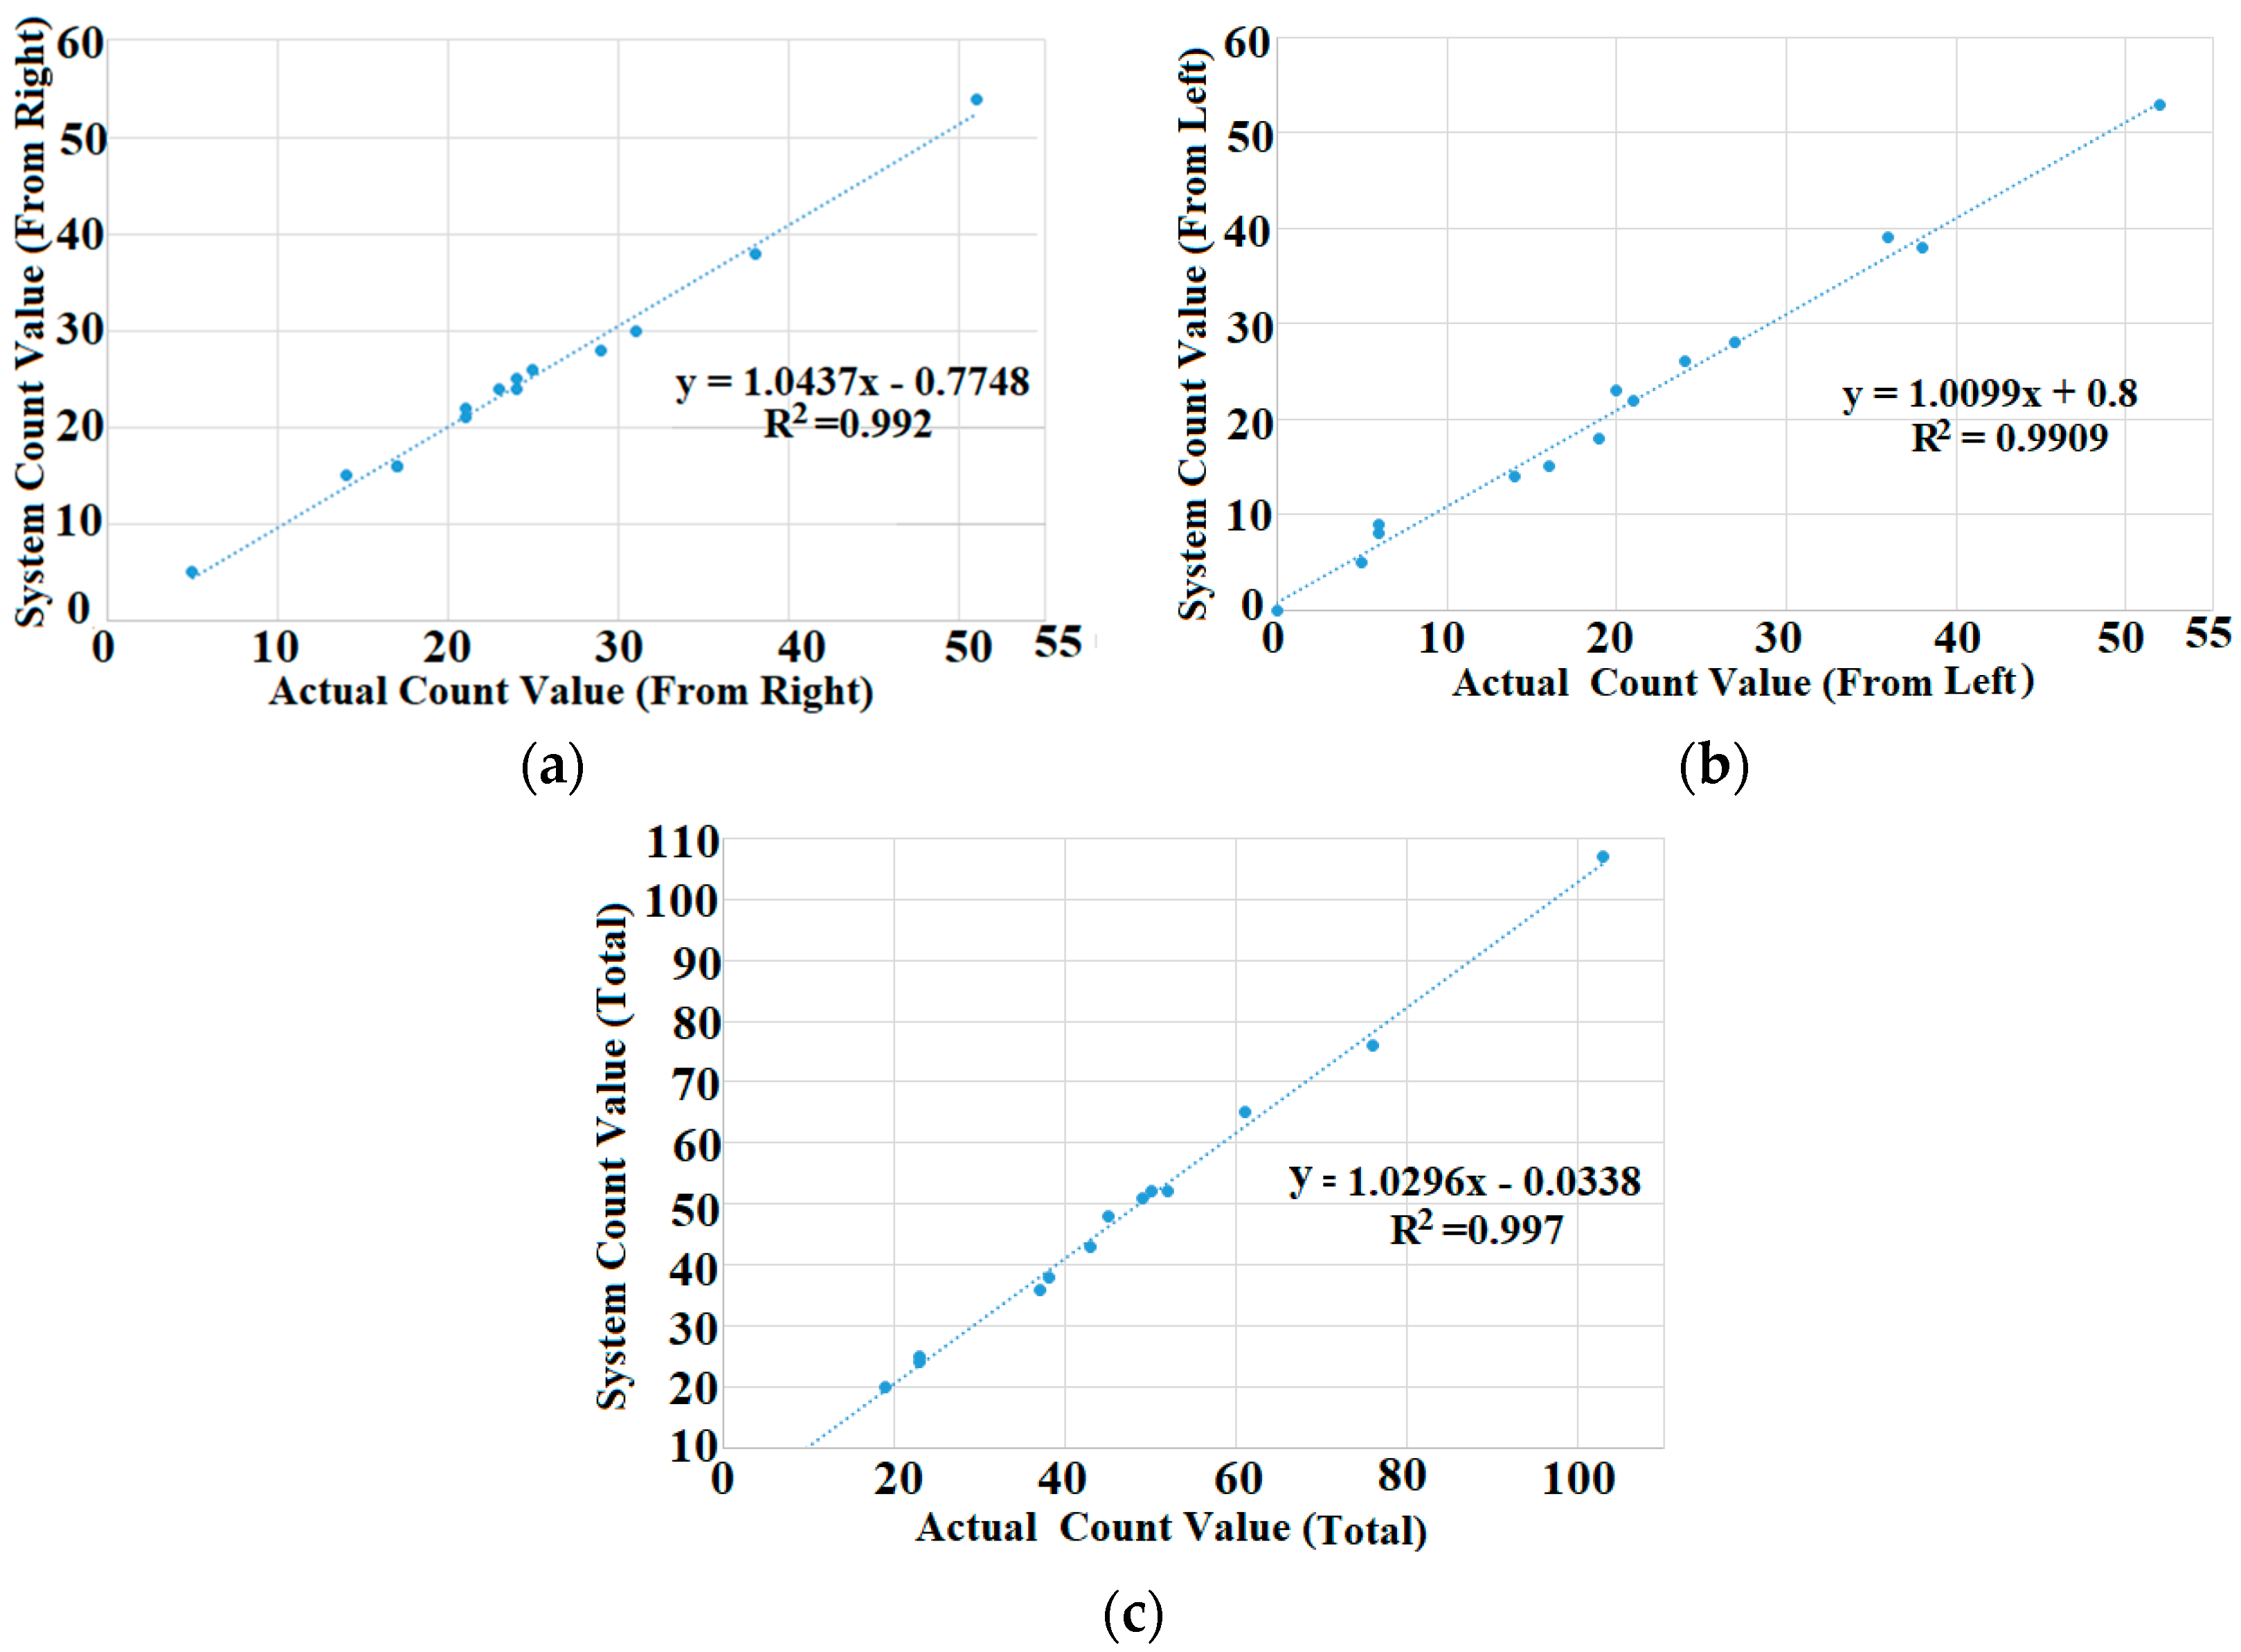
To find a more accurate value of the pedestrian count, the
Ntotal has been normalized using calibrated characteristics between the actual counted value and system counted value as explained in
Section 3.1. Due to considering all the possible scenarios of the pedestrians walking pattern and feeding the system with actual count trends to ensure that the system provides more accurate results, the developed algorithm is defined as an intelligent algorithm.
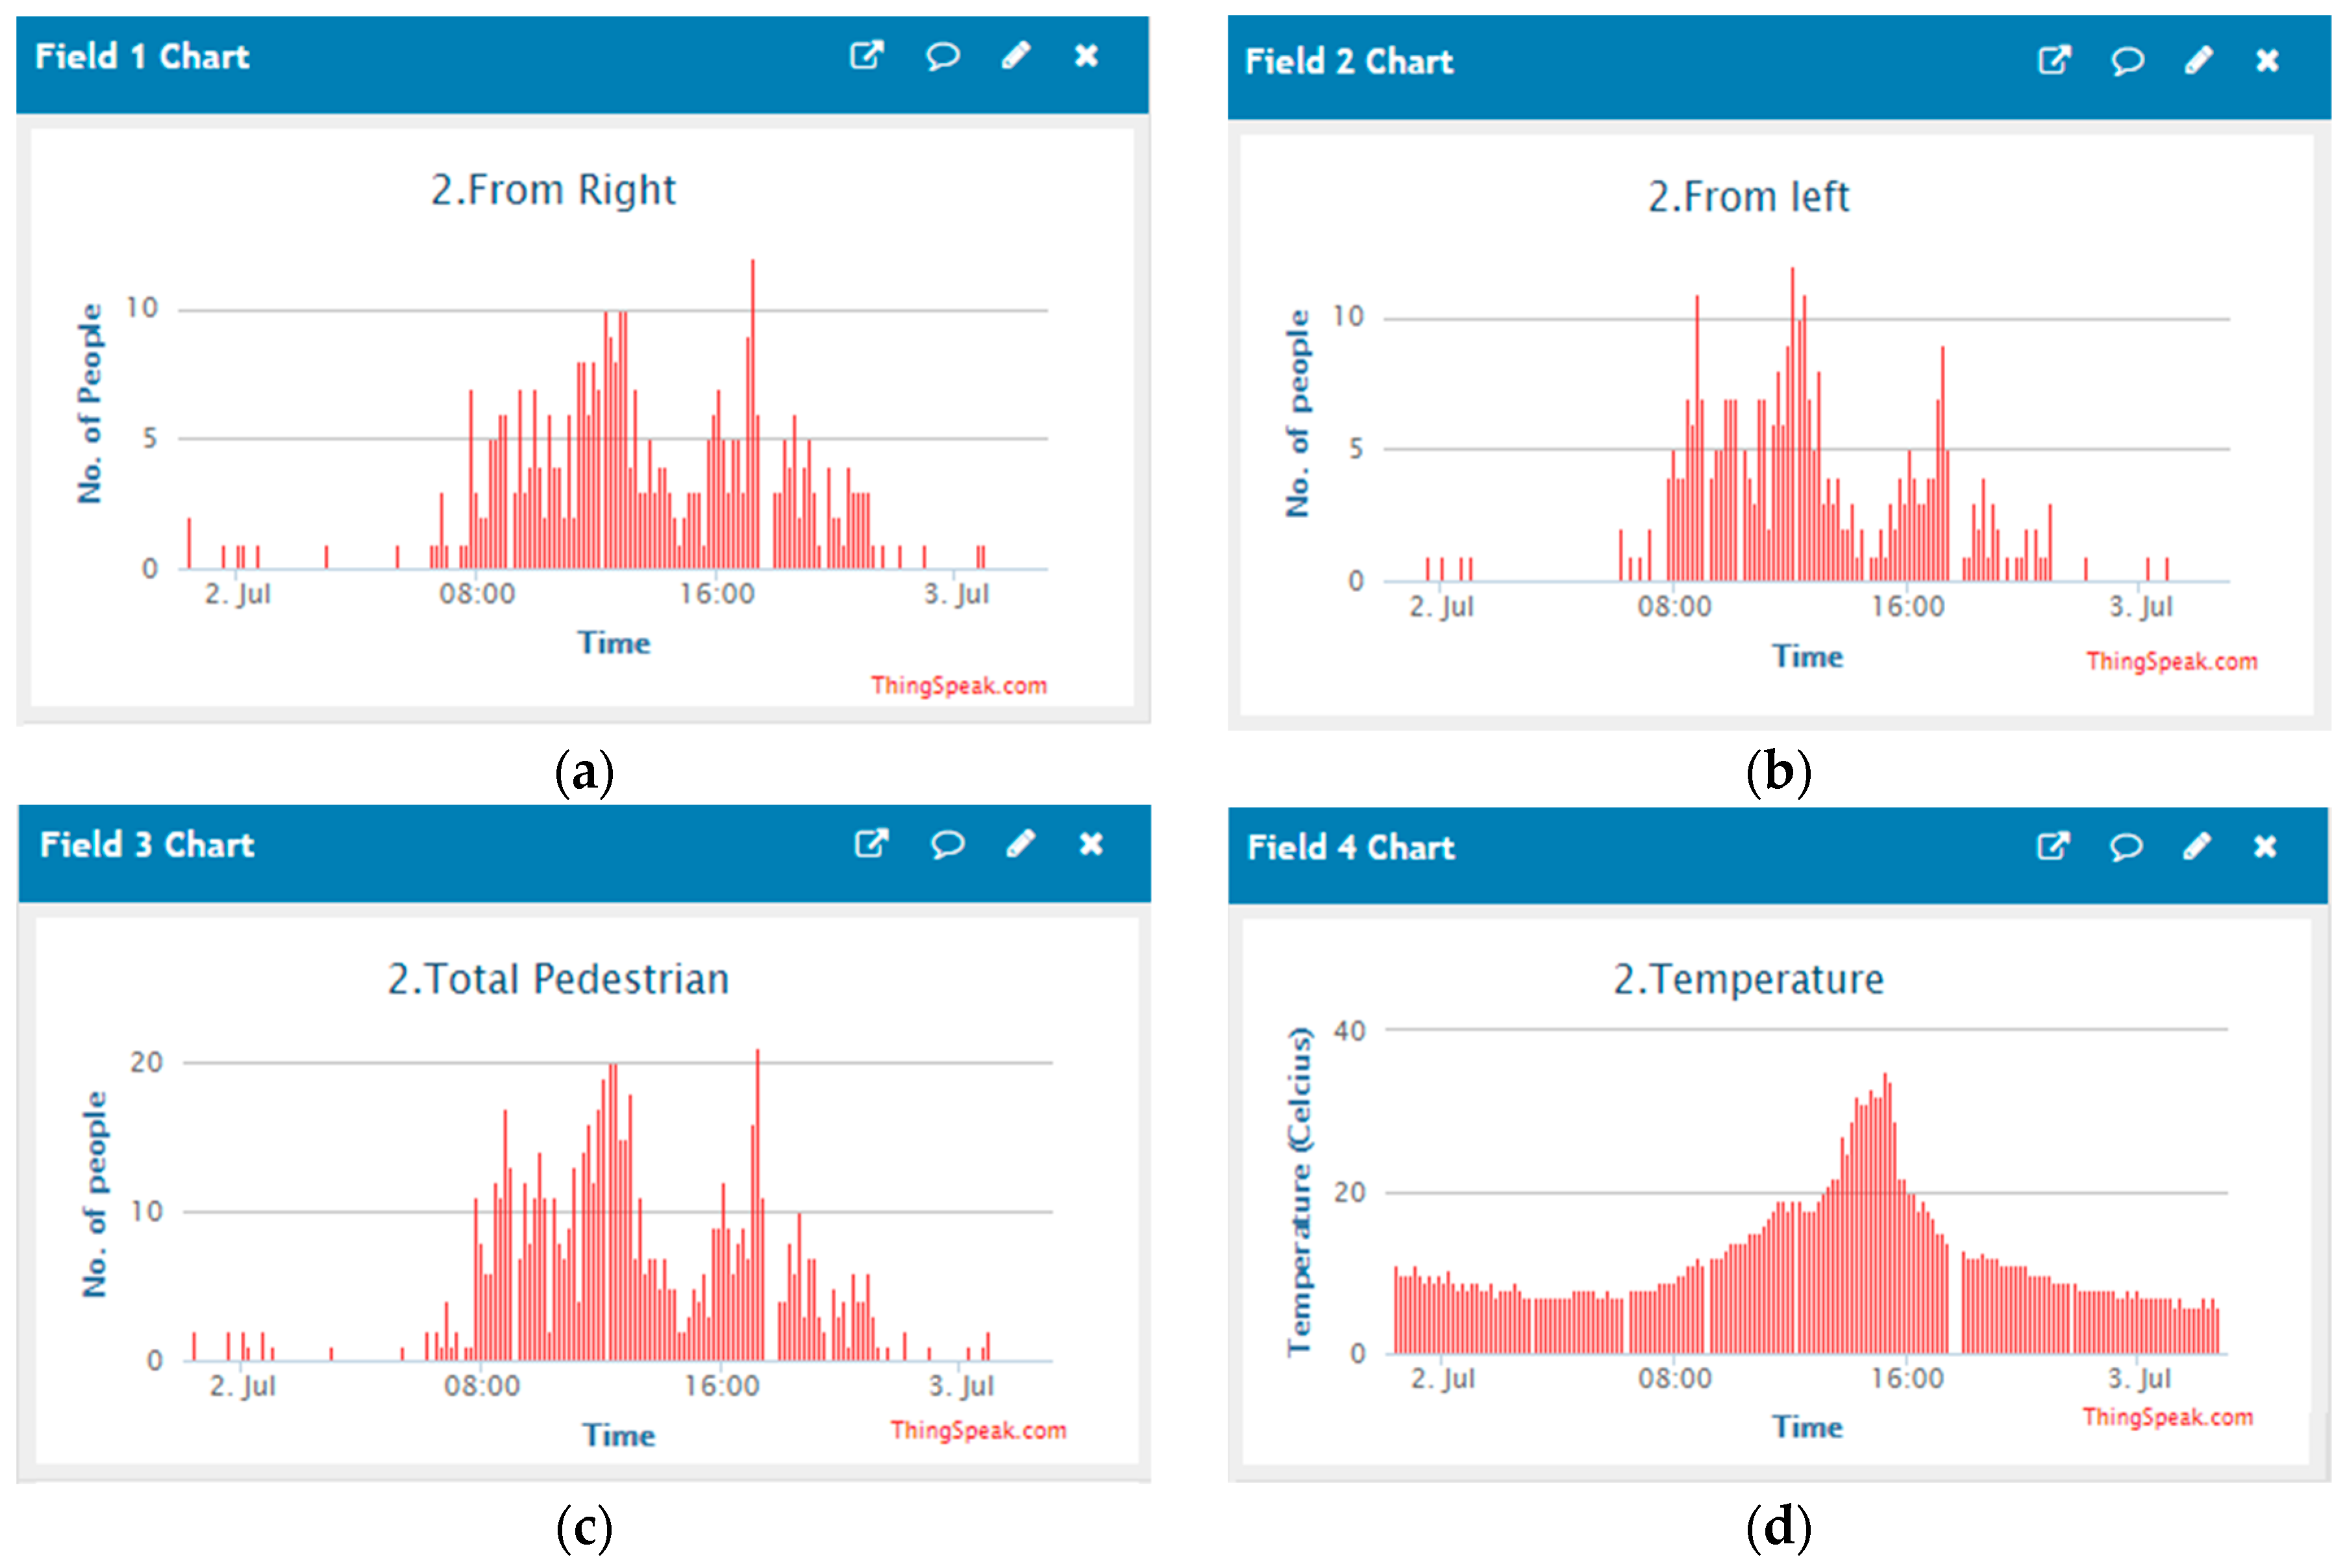
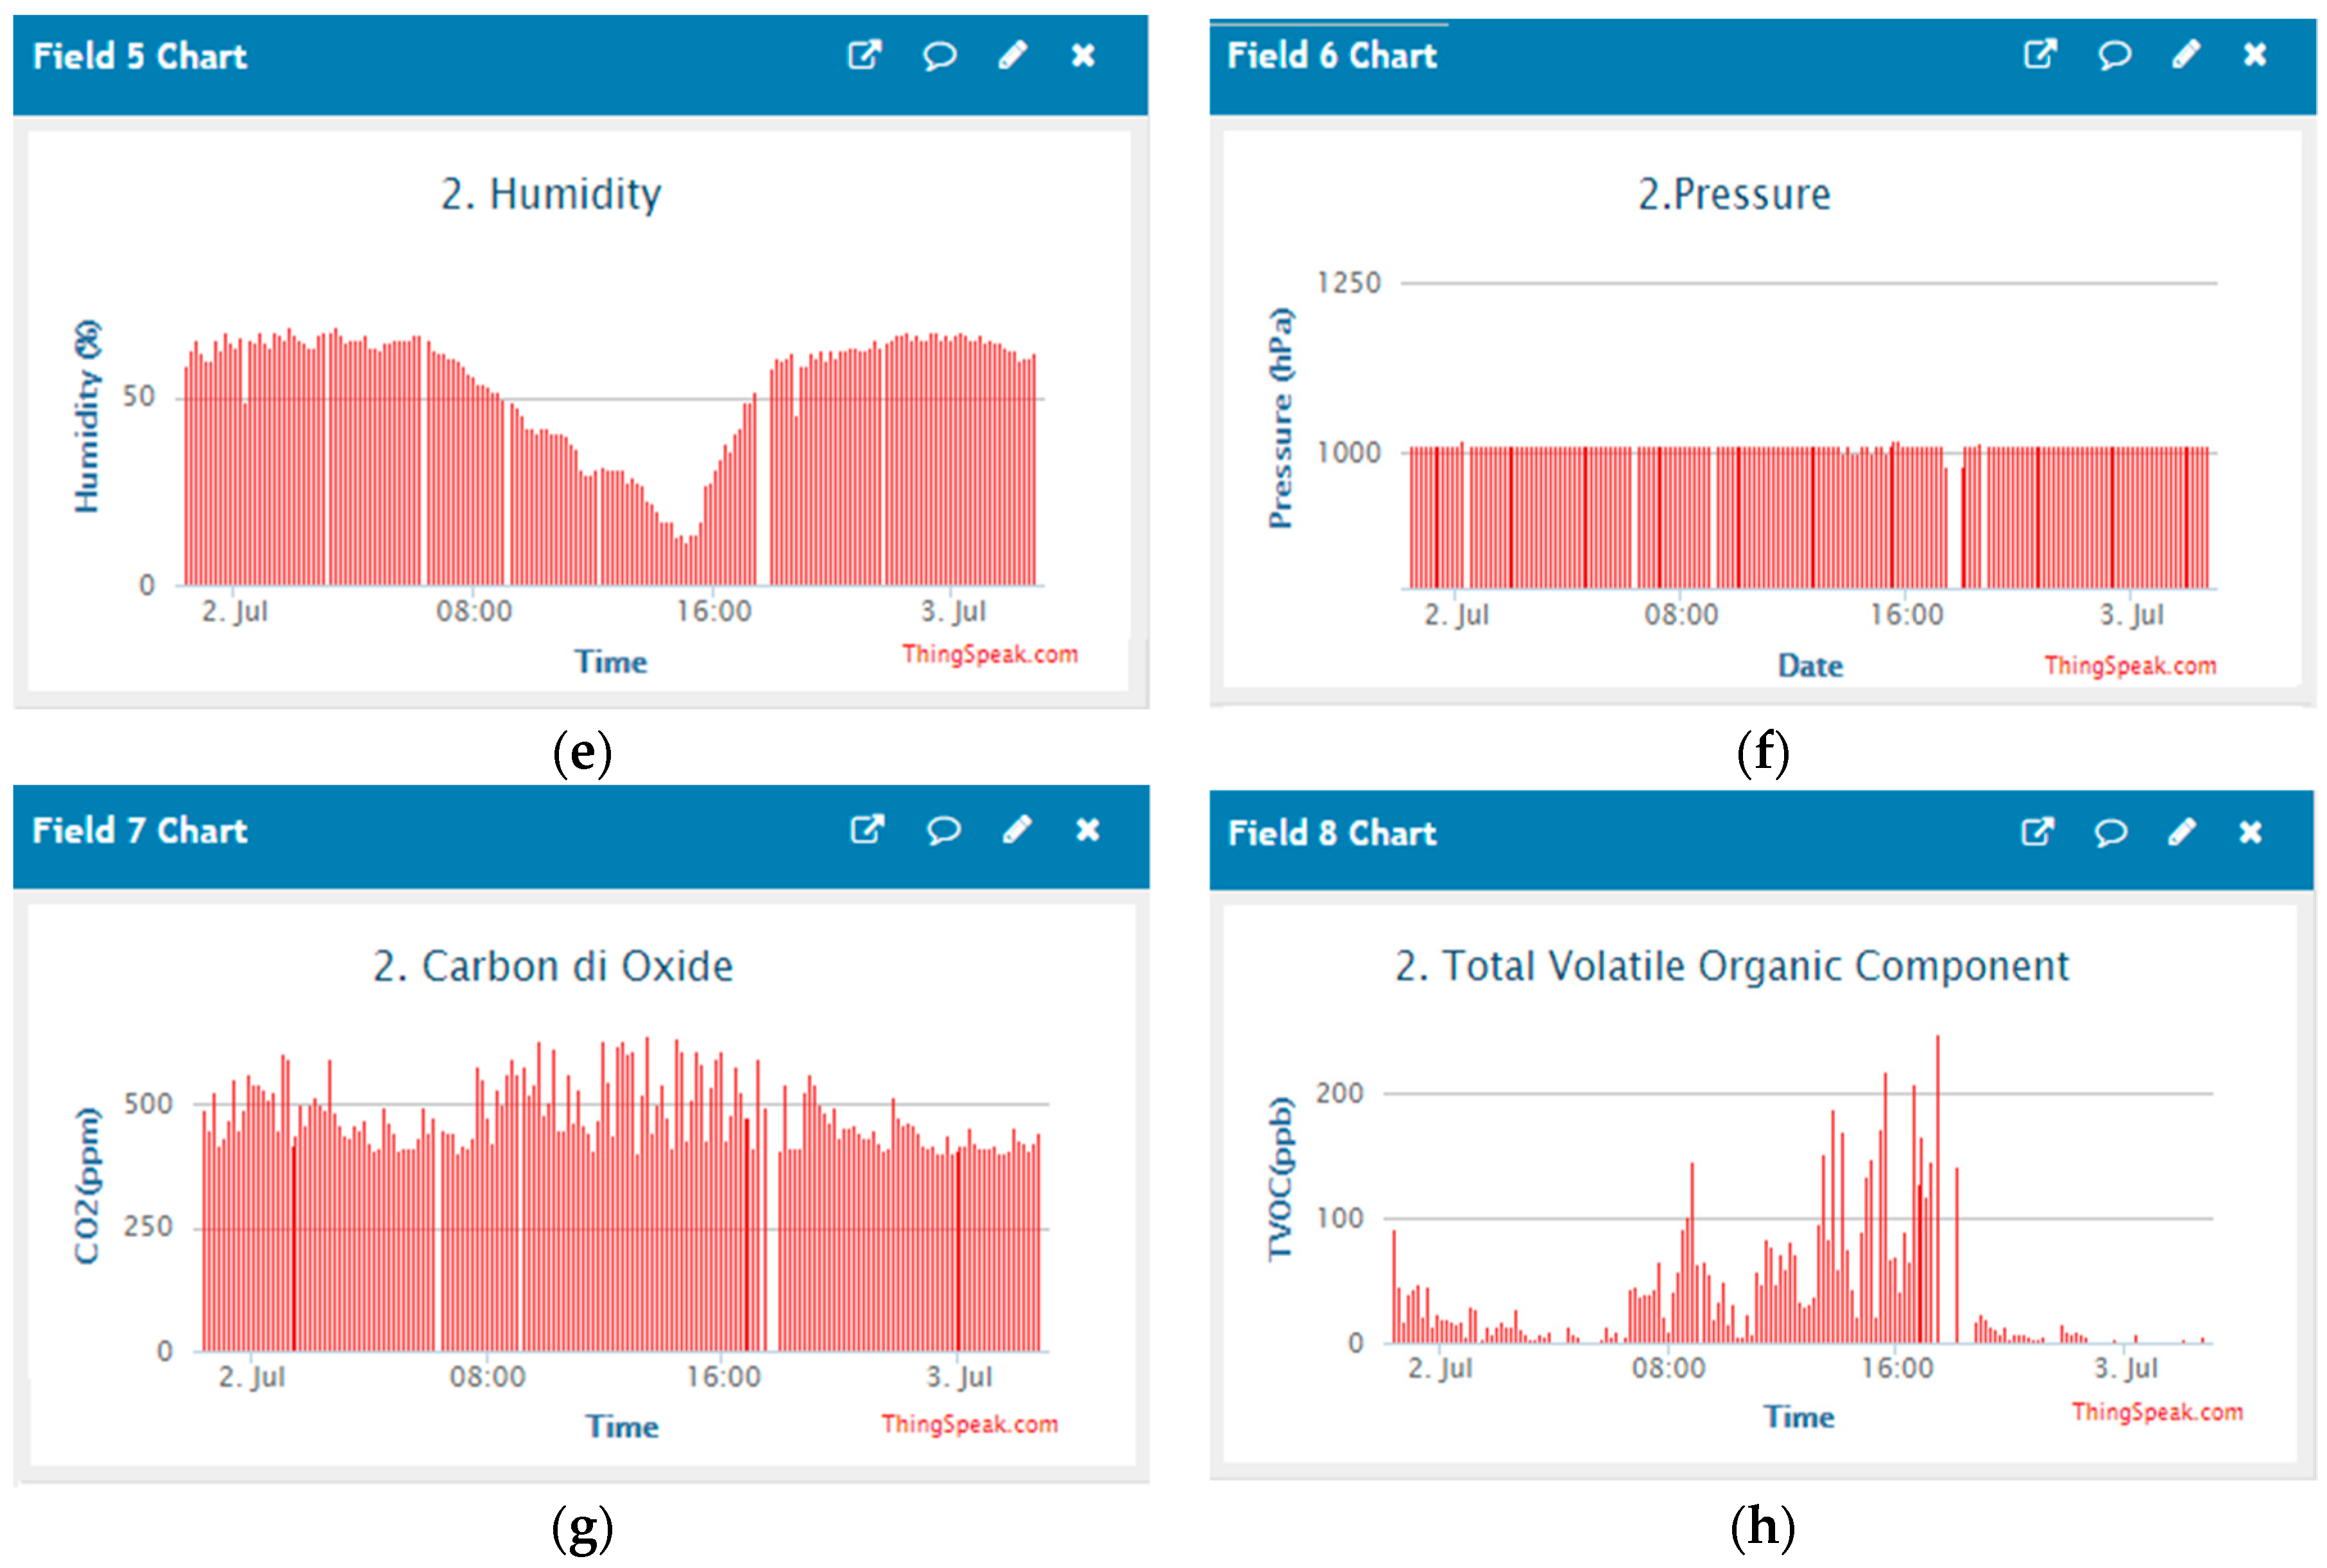
Once the pedestrian counting and direction of travels are obtained for 10 min and environmental combo data are read. After reading all the sensor data, data is sent to the Thingspeak [
49] server through the TTN (The Things Network) [
50] gateway. The complete flow diagram of the developed system is shown in
Figure 6.
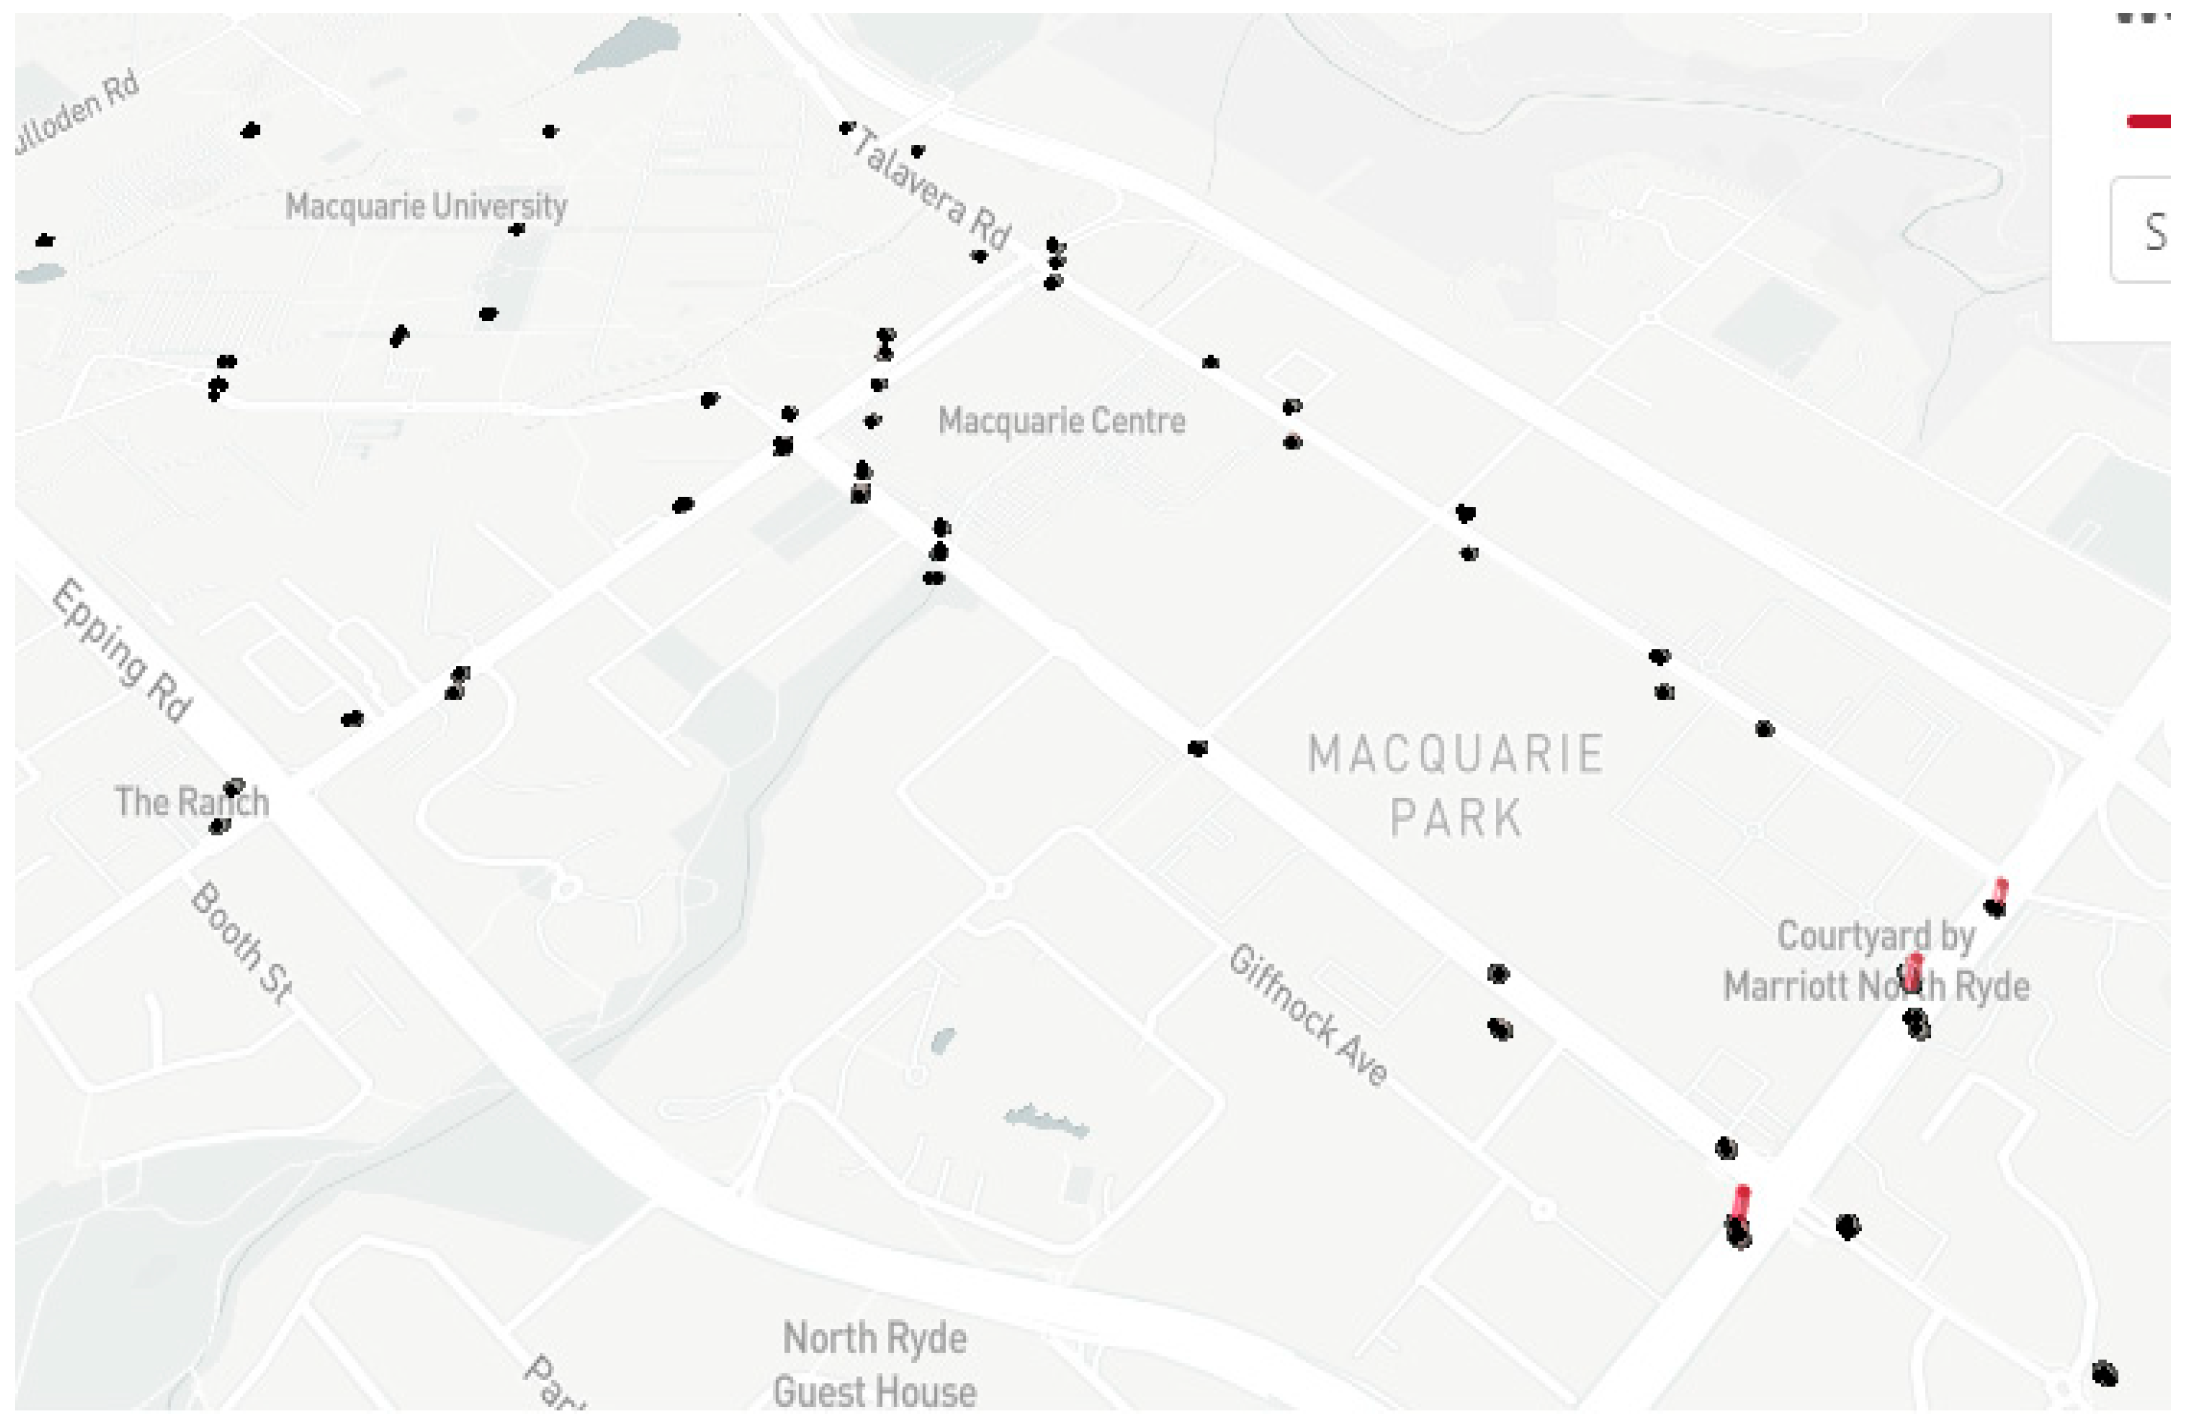
2.5. Study Location
There is a total of 74 sensors that have been installed near Macquarie University.
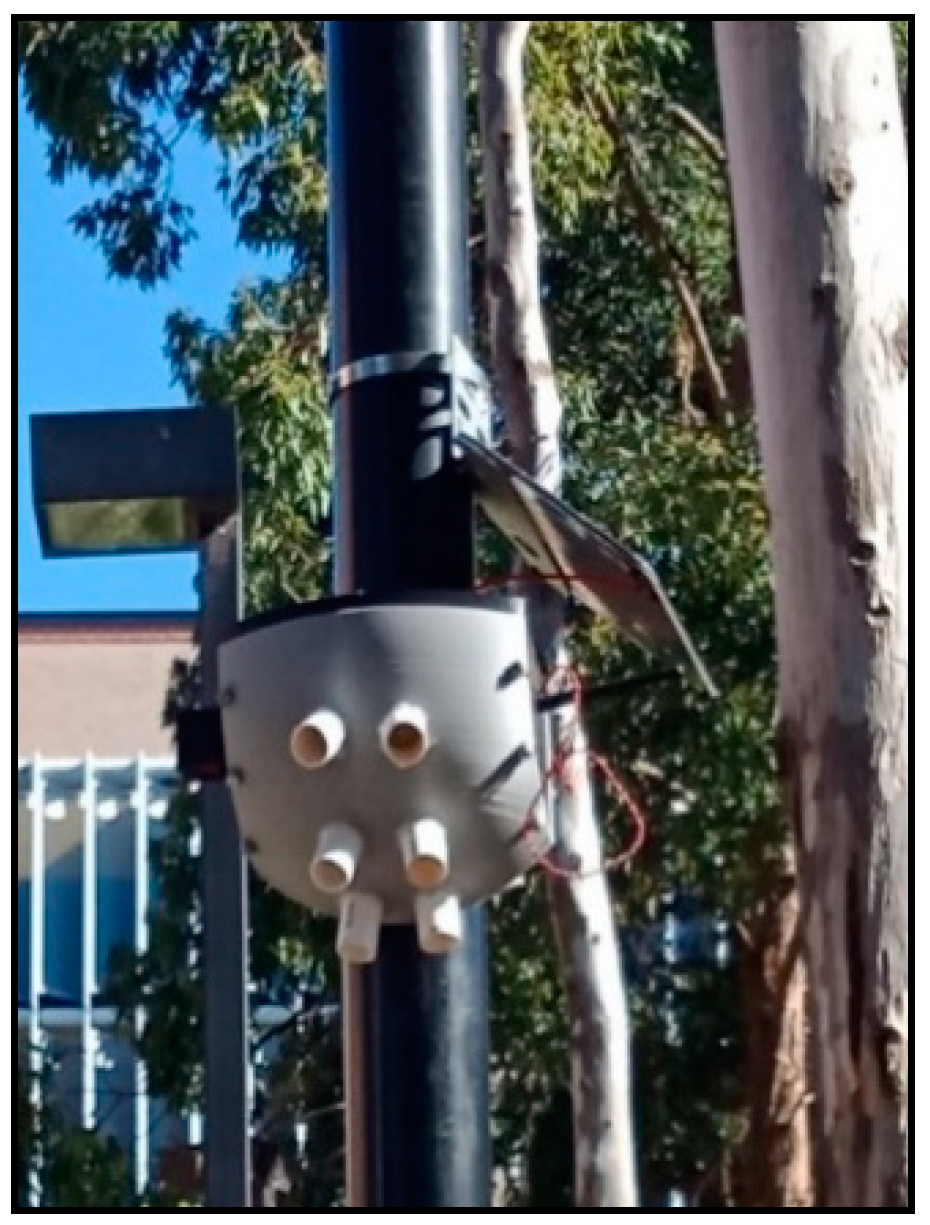
Figure 7 shows the locations of all the sensor nodes. The sensor nodes have been working successfully for the last six months and providing the number of pedestrians, direction of travel and ambient parameters. Pole brackets were used to mount the proposed systems and solar panel on the electric pole.
Figure 8 shows the mounting system with the solar panel on the pole.
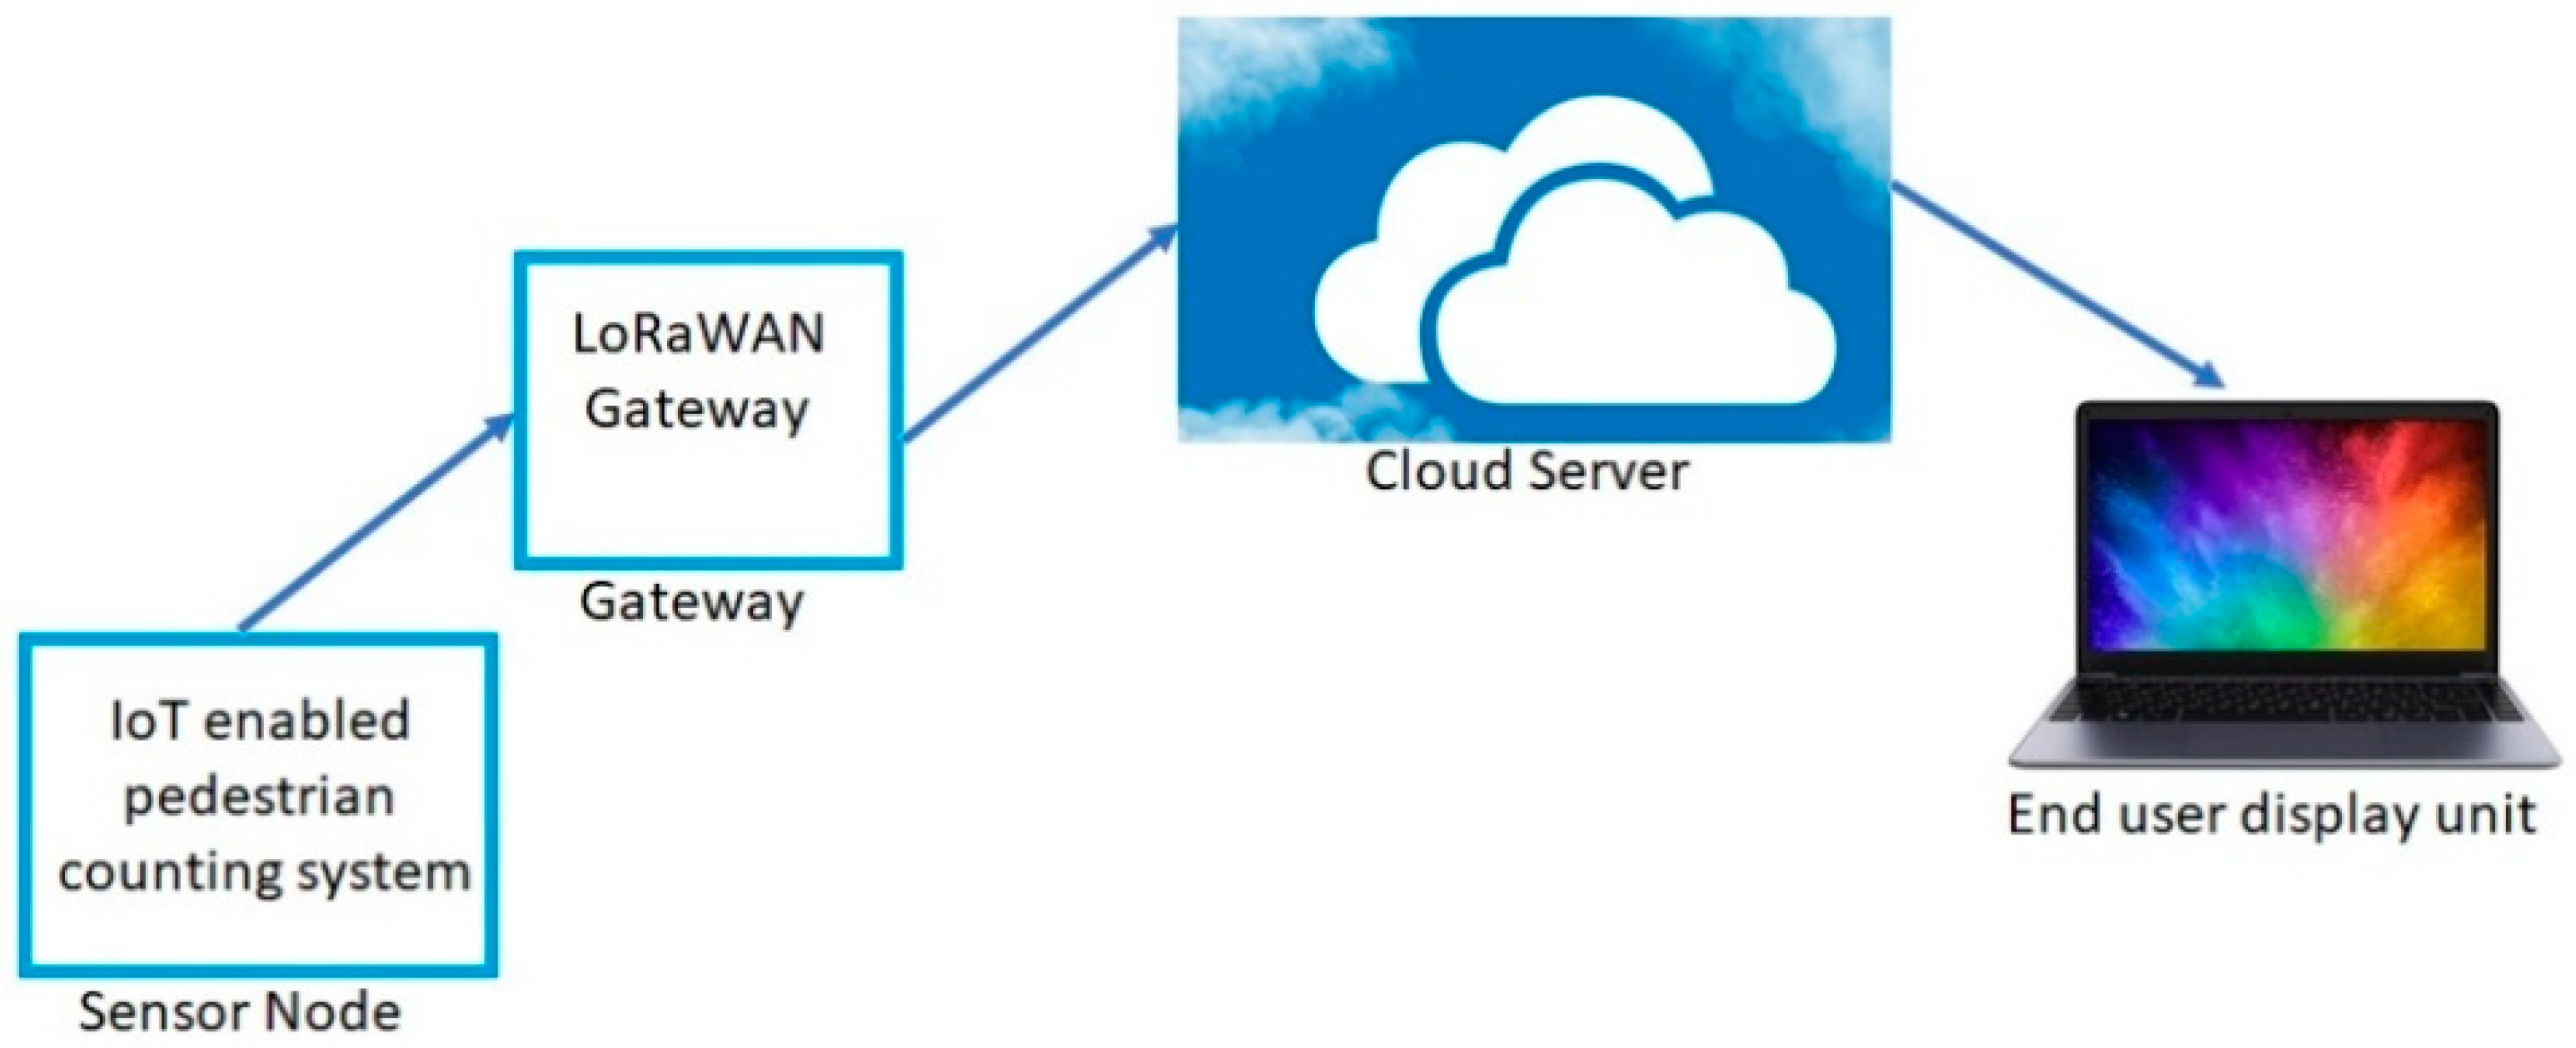
2.6. Data Transmission and Collection
The proposed pedestrian counting system is based on the Lora Communication. It offers connectivity of a few kilometers in urban areas and up to ten kilometers in rural areas. It is widely used where low data rate, low power and low throughput are required. Utilization of license-free Industrial, scientific and medical (
ISM) radio bands enables LoRaWAN to attract customers such as the smart city [
51]. This communication system consists of two different layers. The physical layer is based on the Chirp Spread Spectrum (CSS) modulation technique and the MAC-layer protocol is accountable for getting access to the network architecture [
52]. The frequency shift keying (FSK) is used in the LoRa communication to communicate between the gateway and sensor node [
53].
Figure 9 shows the block diagram of the proposed system. After the installation of the sensor nodes, the data were collected and stored in the Thingspeak channel.
4. Conclusions
An IoT enabled pedestrian count, direction of travel and ambient parameters determination system is successfully presented in this paper. The PIR sensors detect the movement and convert the data into the pedestrian count and direction of movement. The developed system is tested at various times of the day to evaluate the performance. This novel method counts pedestrians with 95% accuracy and avoids counting any movement of domestic animals such as dogs or cats. The method does not require any images or videos thus protecting human privacy. The environmental combo provides all the necessary information of the weather such as temperature, humidity, pressure, CO2 and VOC. The installation of the sensor nodes on the electric pole reduces the financial burden. The implementation cost of the system is about 250 US dollars, which includes the purchase of electronic consumables in small numbers. The total cost of fabrication will significantly reduce if the productions are made in large numbers. The current price though is less compared to other existing systems thus making this a potential candidate to implement in a smart city.
The open-access database of the system promotes identifying hotspots and taking necessary action for pedestrian safety and facilities improvement. Moreover, it will help the City Council to improve the planning and provision of transportation services. Furthermore, this will enable local businesses to monitor the pedestrian traffic flow and manage business resources to improve efficiency and increase revenue. Environmental monitoring data will help in understanding air quality and taking essential measures for making the city greener. Therefore, the existence of such sensor nodes in a city provides an opportunity for decision-makers to test assumptions and scenarios, reducing the chance of costly mistakes with the infrastructure. That is why it is adopted by the Macquarie park district, Sydney, Australia, which is experiencing considerable growth of office developments over the past two decades and is expected to continuingly expand as Sydney’s knowledge hub in near future. Without such a mutual policy and implementation framework, urban planning projects may place tremendous pressure on the precinct, transportation and inhabitants whilst also leading to costly and ineffective solutions. It is anticipated that the major cities in Australia and other countries will adopt this technology very soon. In addition to pedestrian counting, this system can also be implemented in a smart building to know the number of people inside and outside the building during emergency evacuation.
Although there are so many advantages of the proposed system, there are some limitations as well. This system is not able to differentiate between humans and animals having height more than 1 m. Due to keeping 1 m clearance from the street level, babies sleeping on the pram are not counted.
Future work would be the inclusion of more sensors such as noise sensor, wind speed determination, rain sensors, visibility sensor, etc. Moreover, the long term collected data would be analyzed to predict the trends. The environmental effect on the pedestrian movement would also be analyzed for different applications.

 ,
, 


