Sensitivity of Piezoelectric-Based Smart Interfaces to Structural Damage in Bolted Connections


Abstract
:1. Introduction
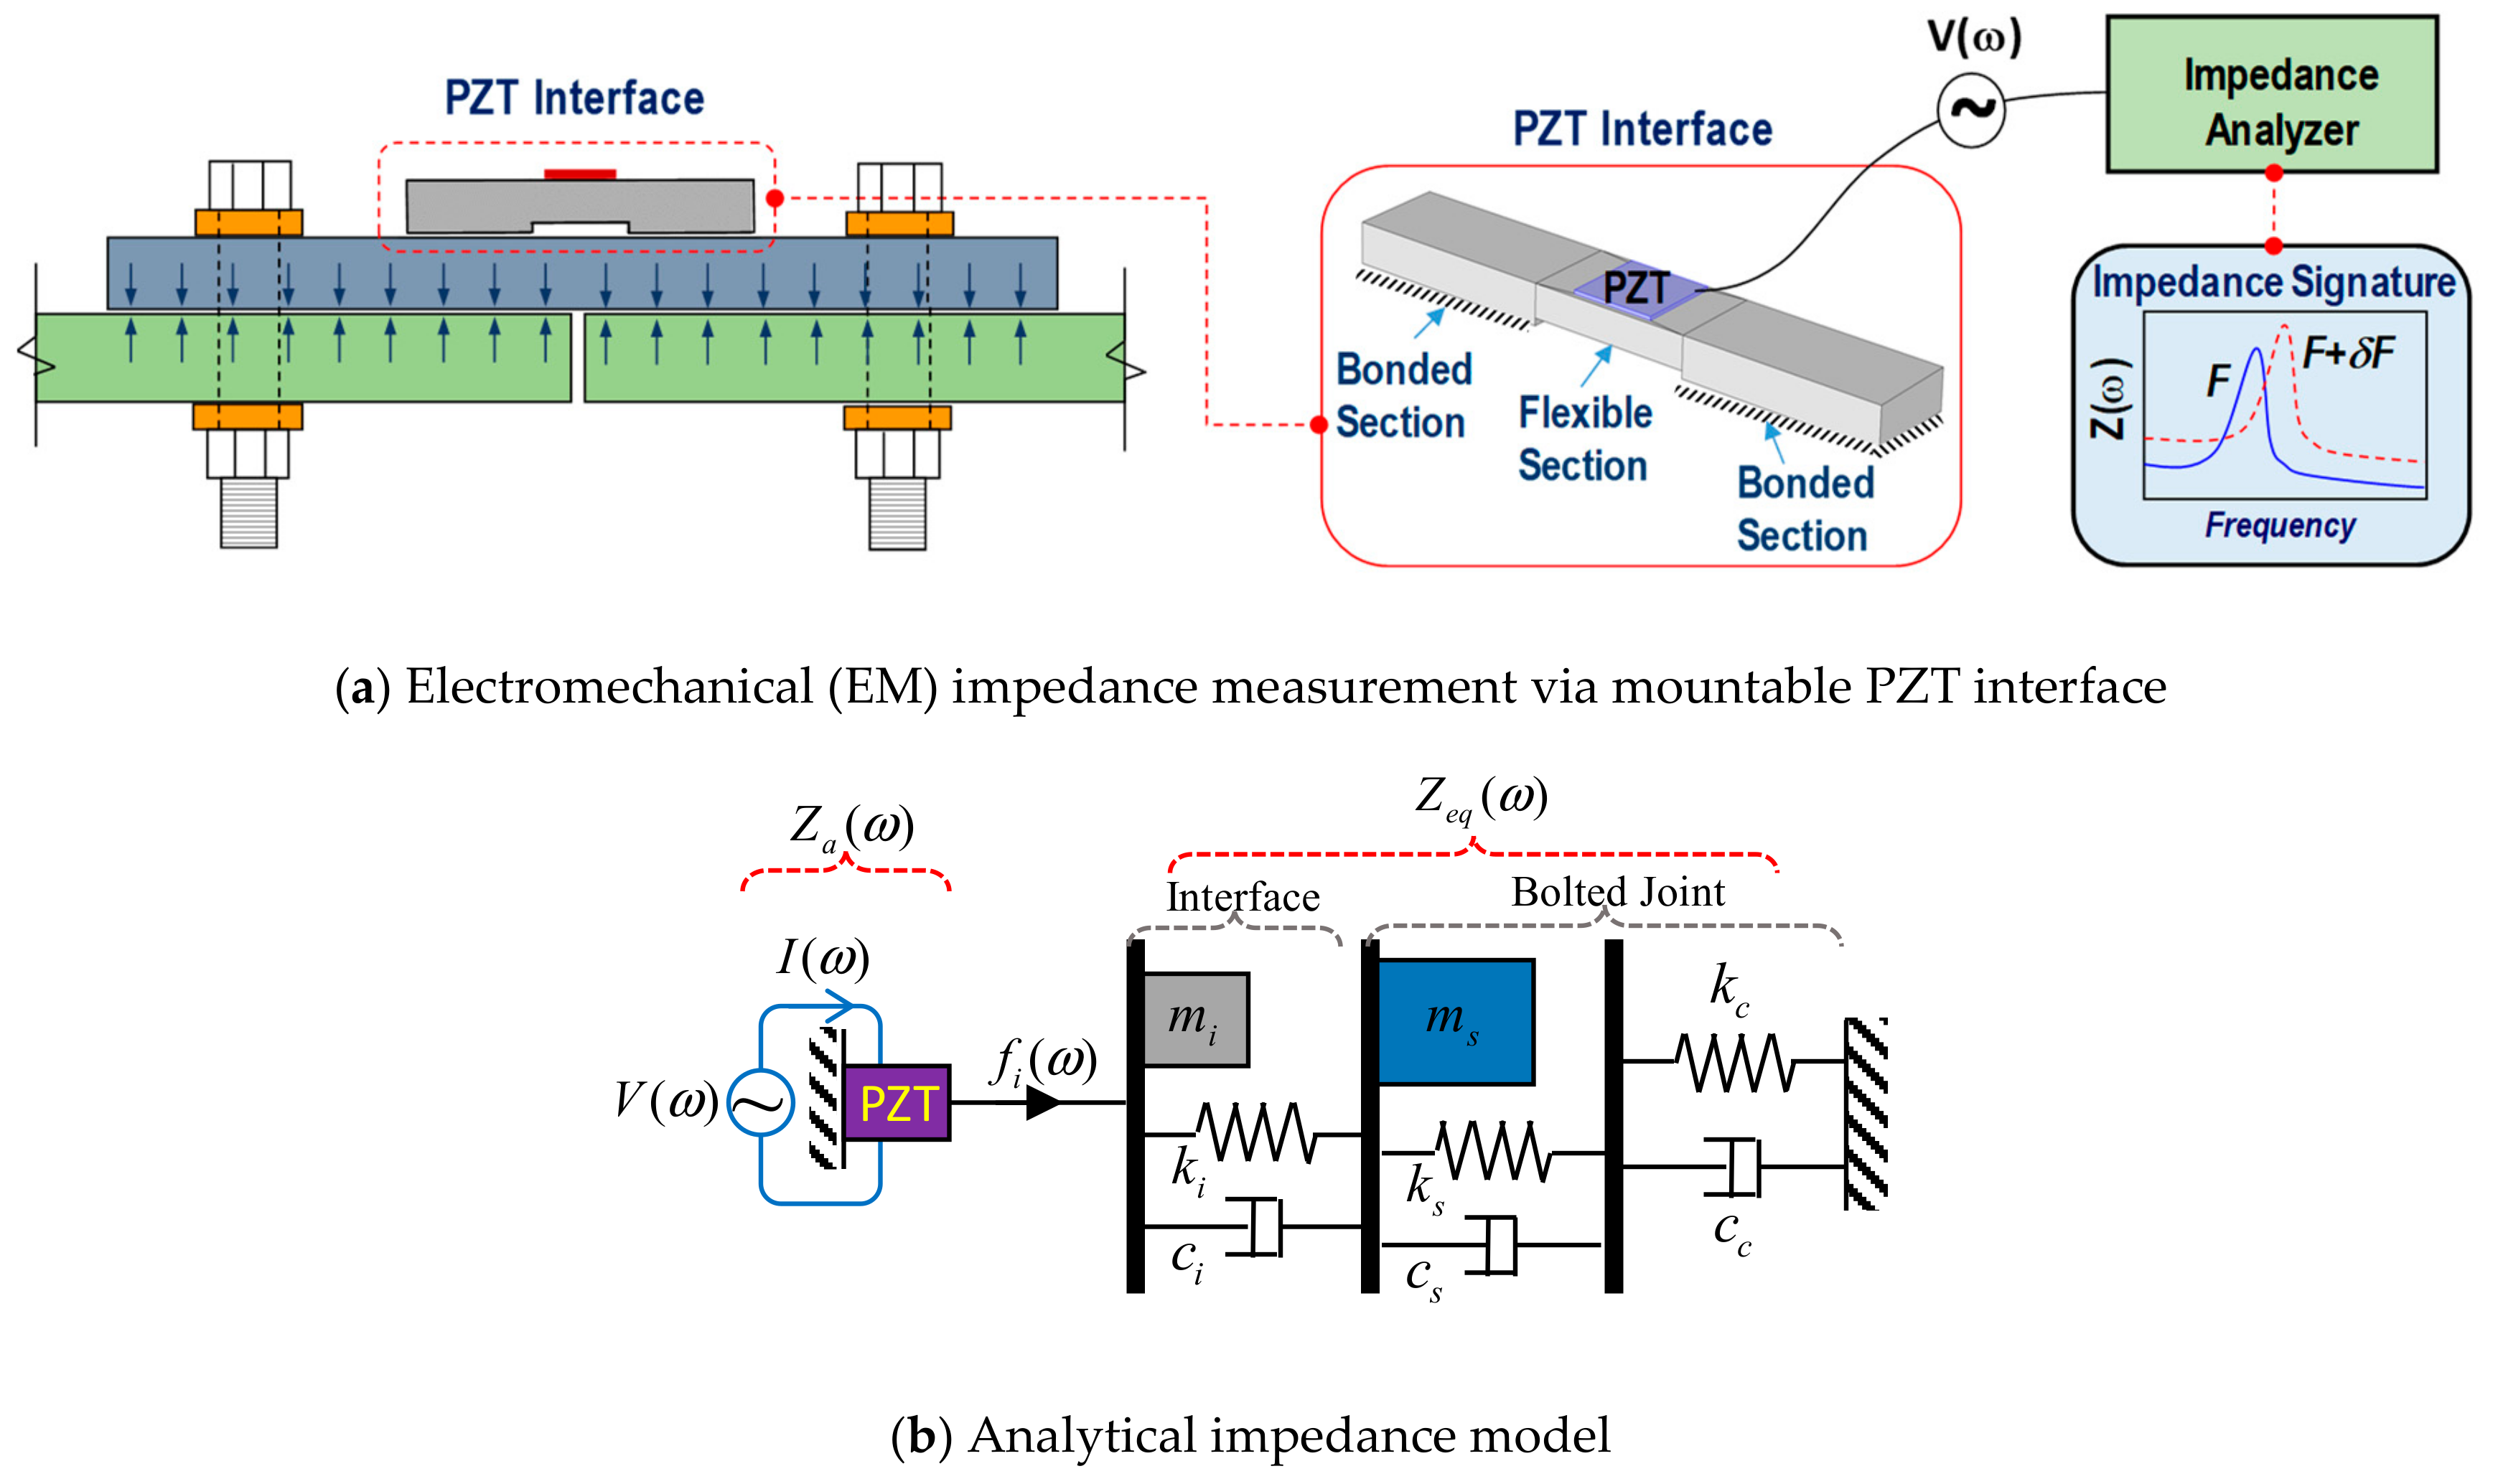
2. Piezoelectric Interface-Based Damage Monitoring Technique for Bolted Joints
3. Experimental Investigation on Damage Sensitivity of Piezoelectric-based Smart Interface
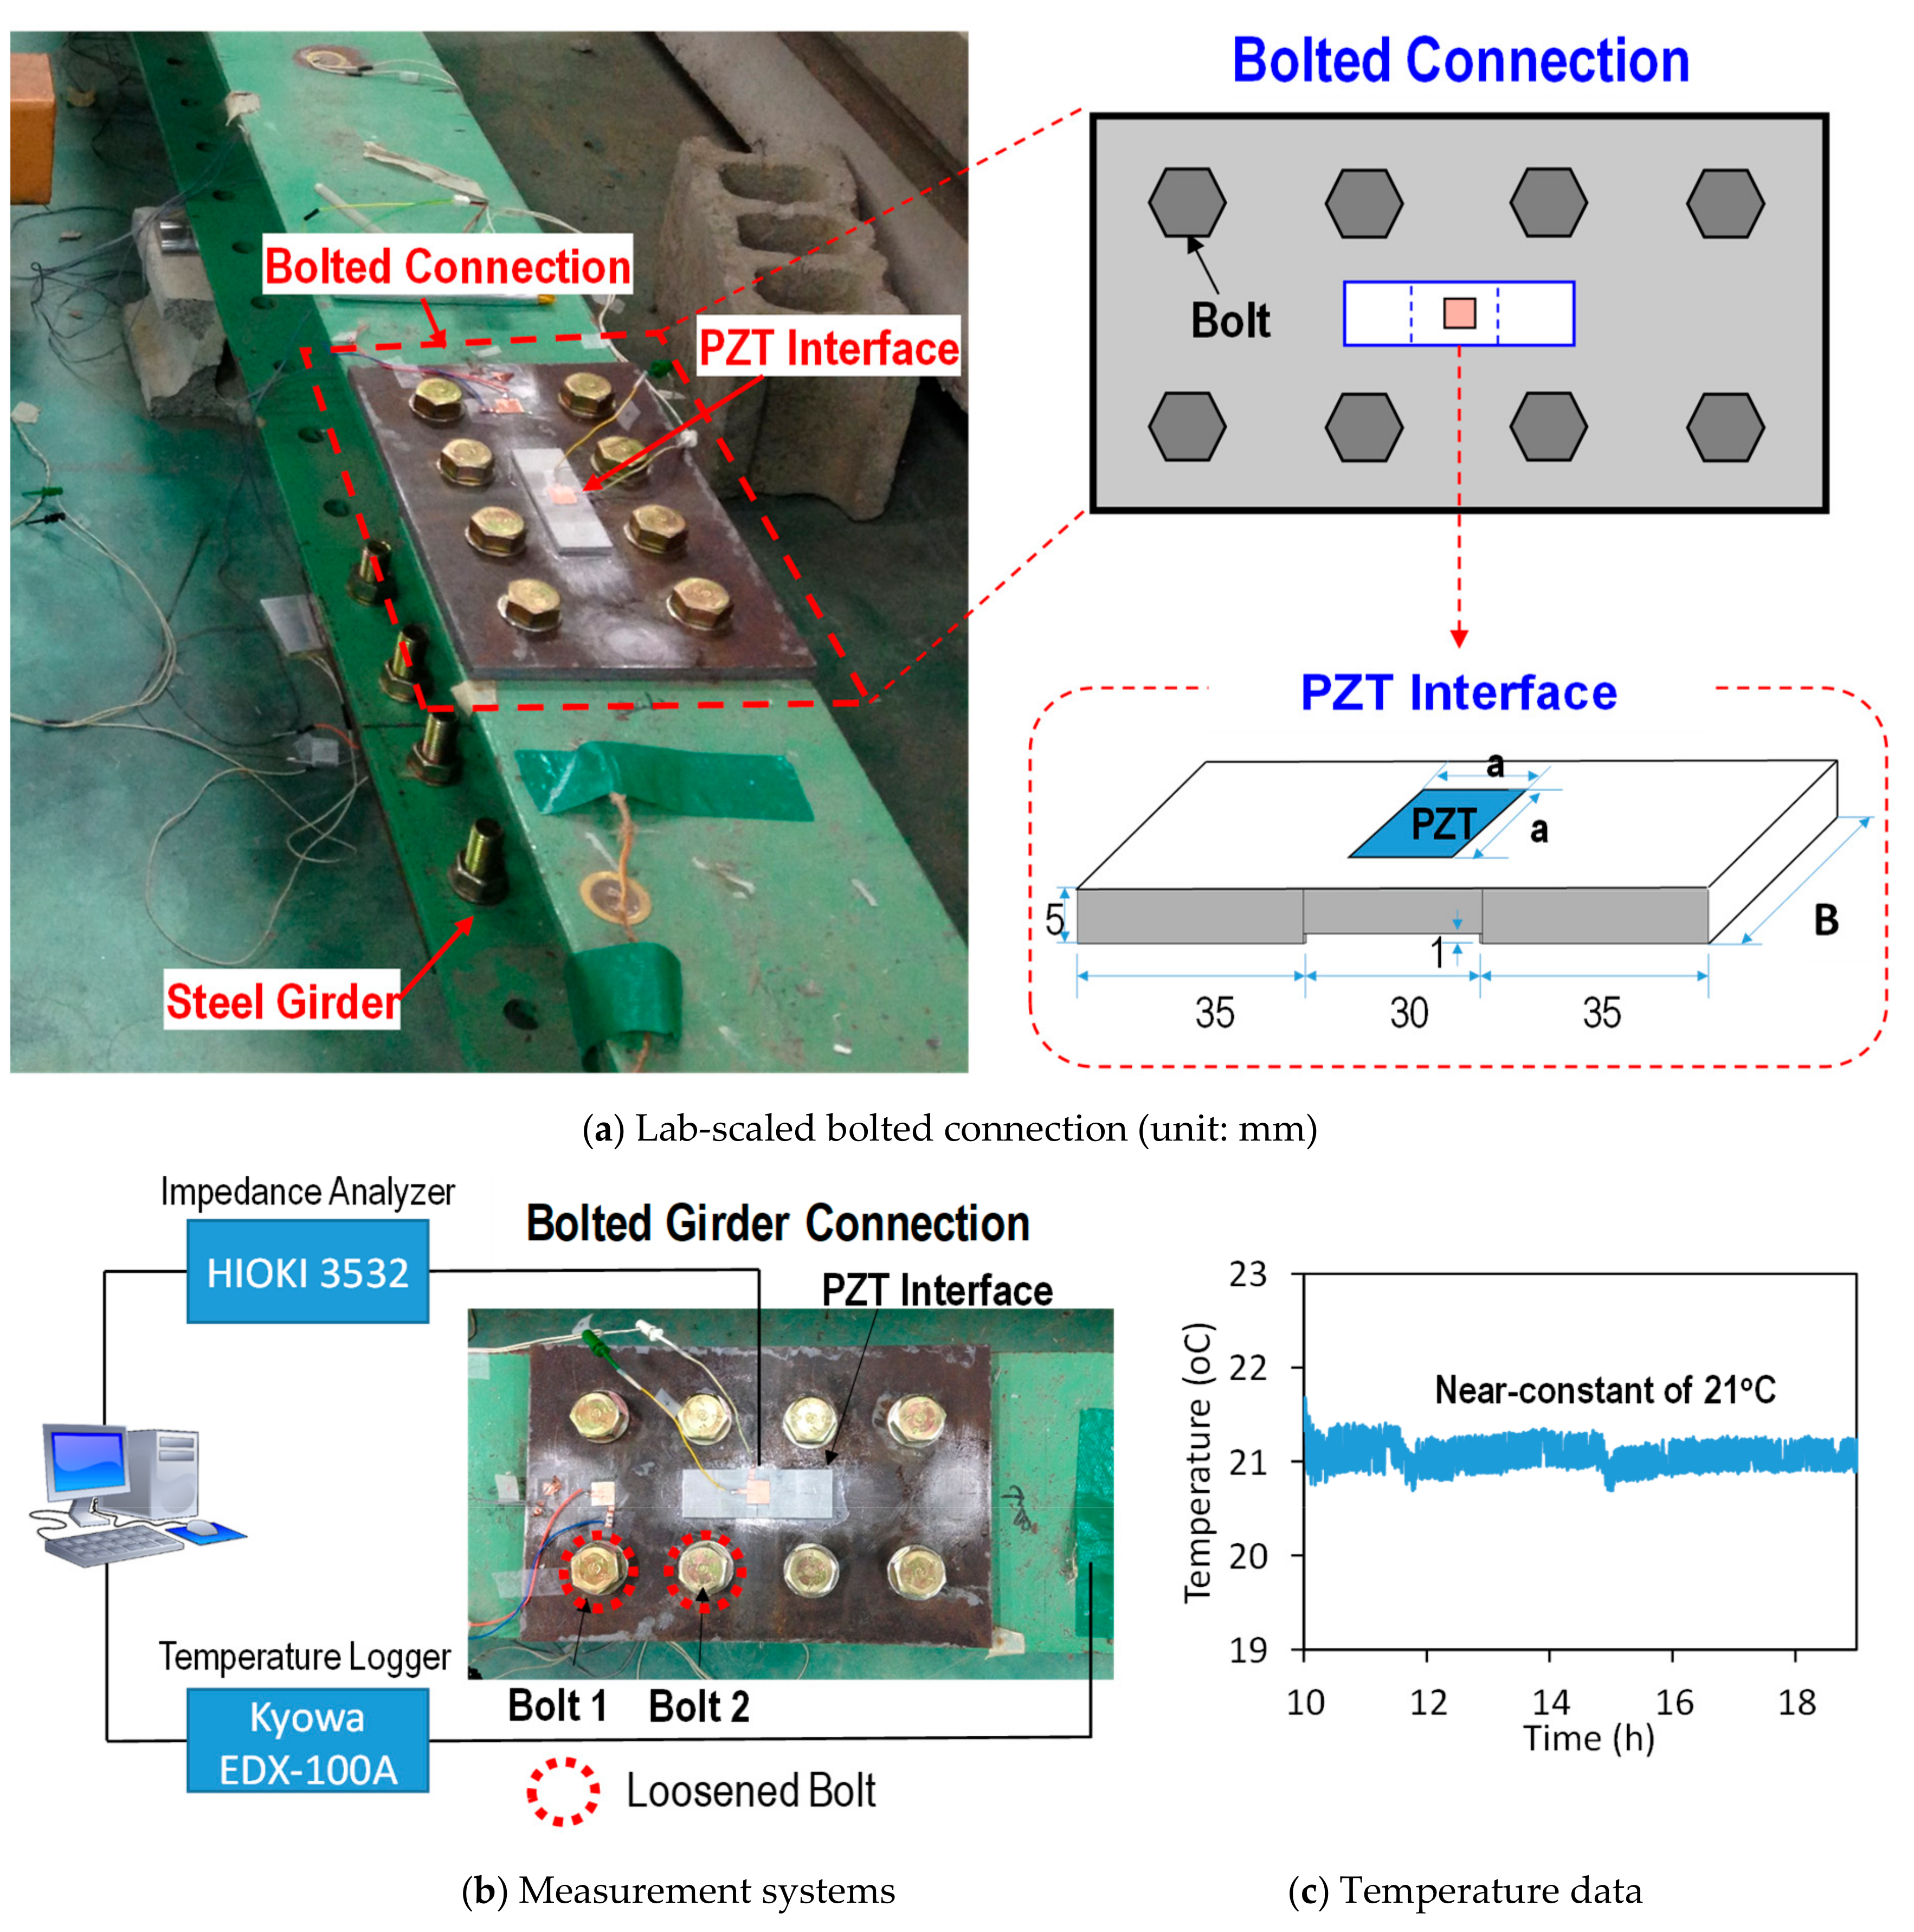
3.1. Experiments on Bolted Connection
3.1.1. Test Setup
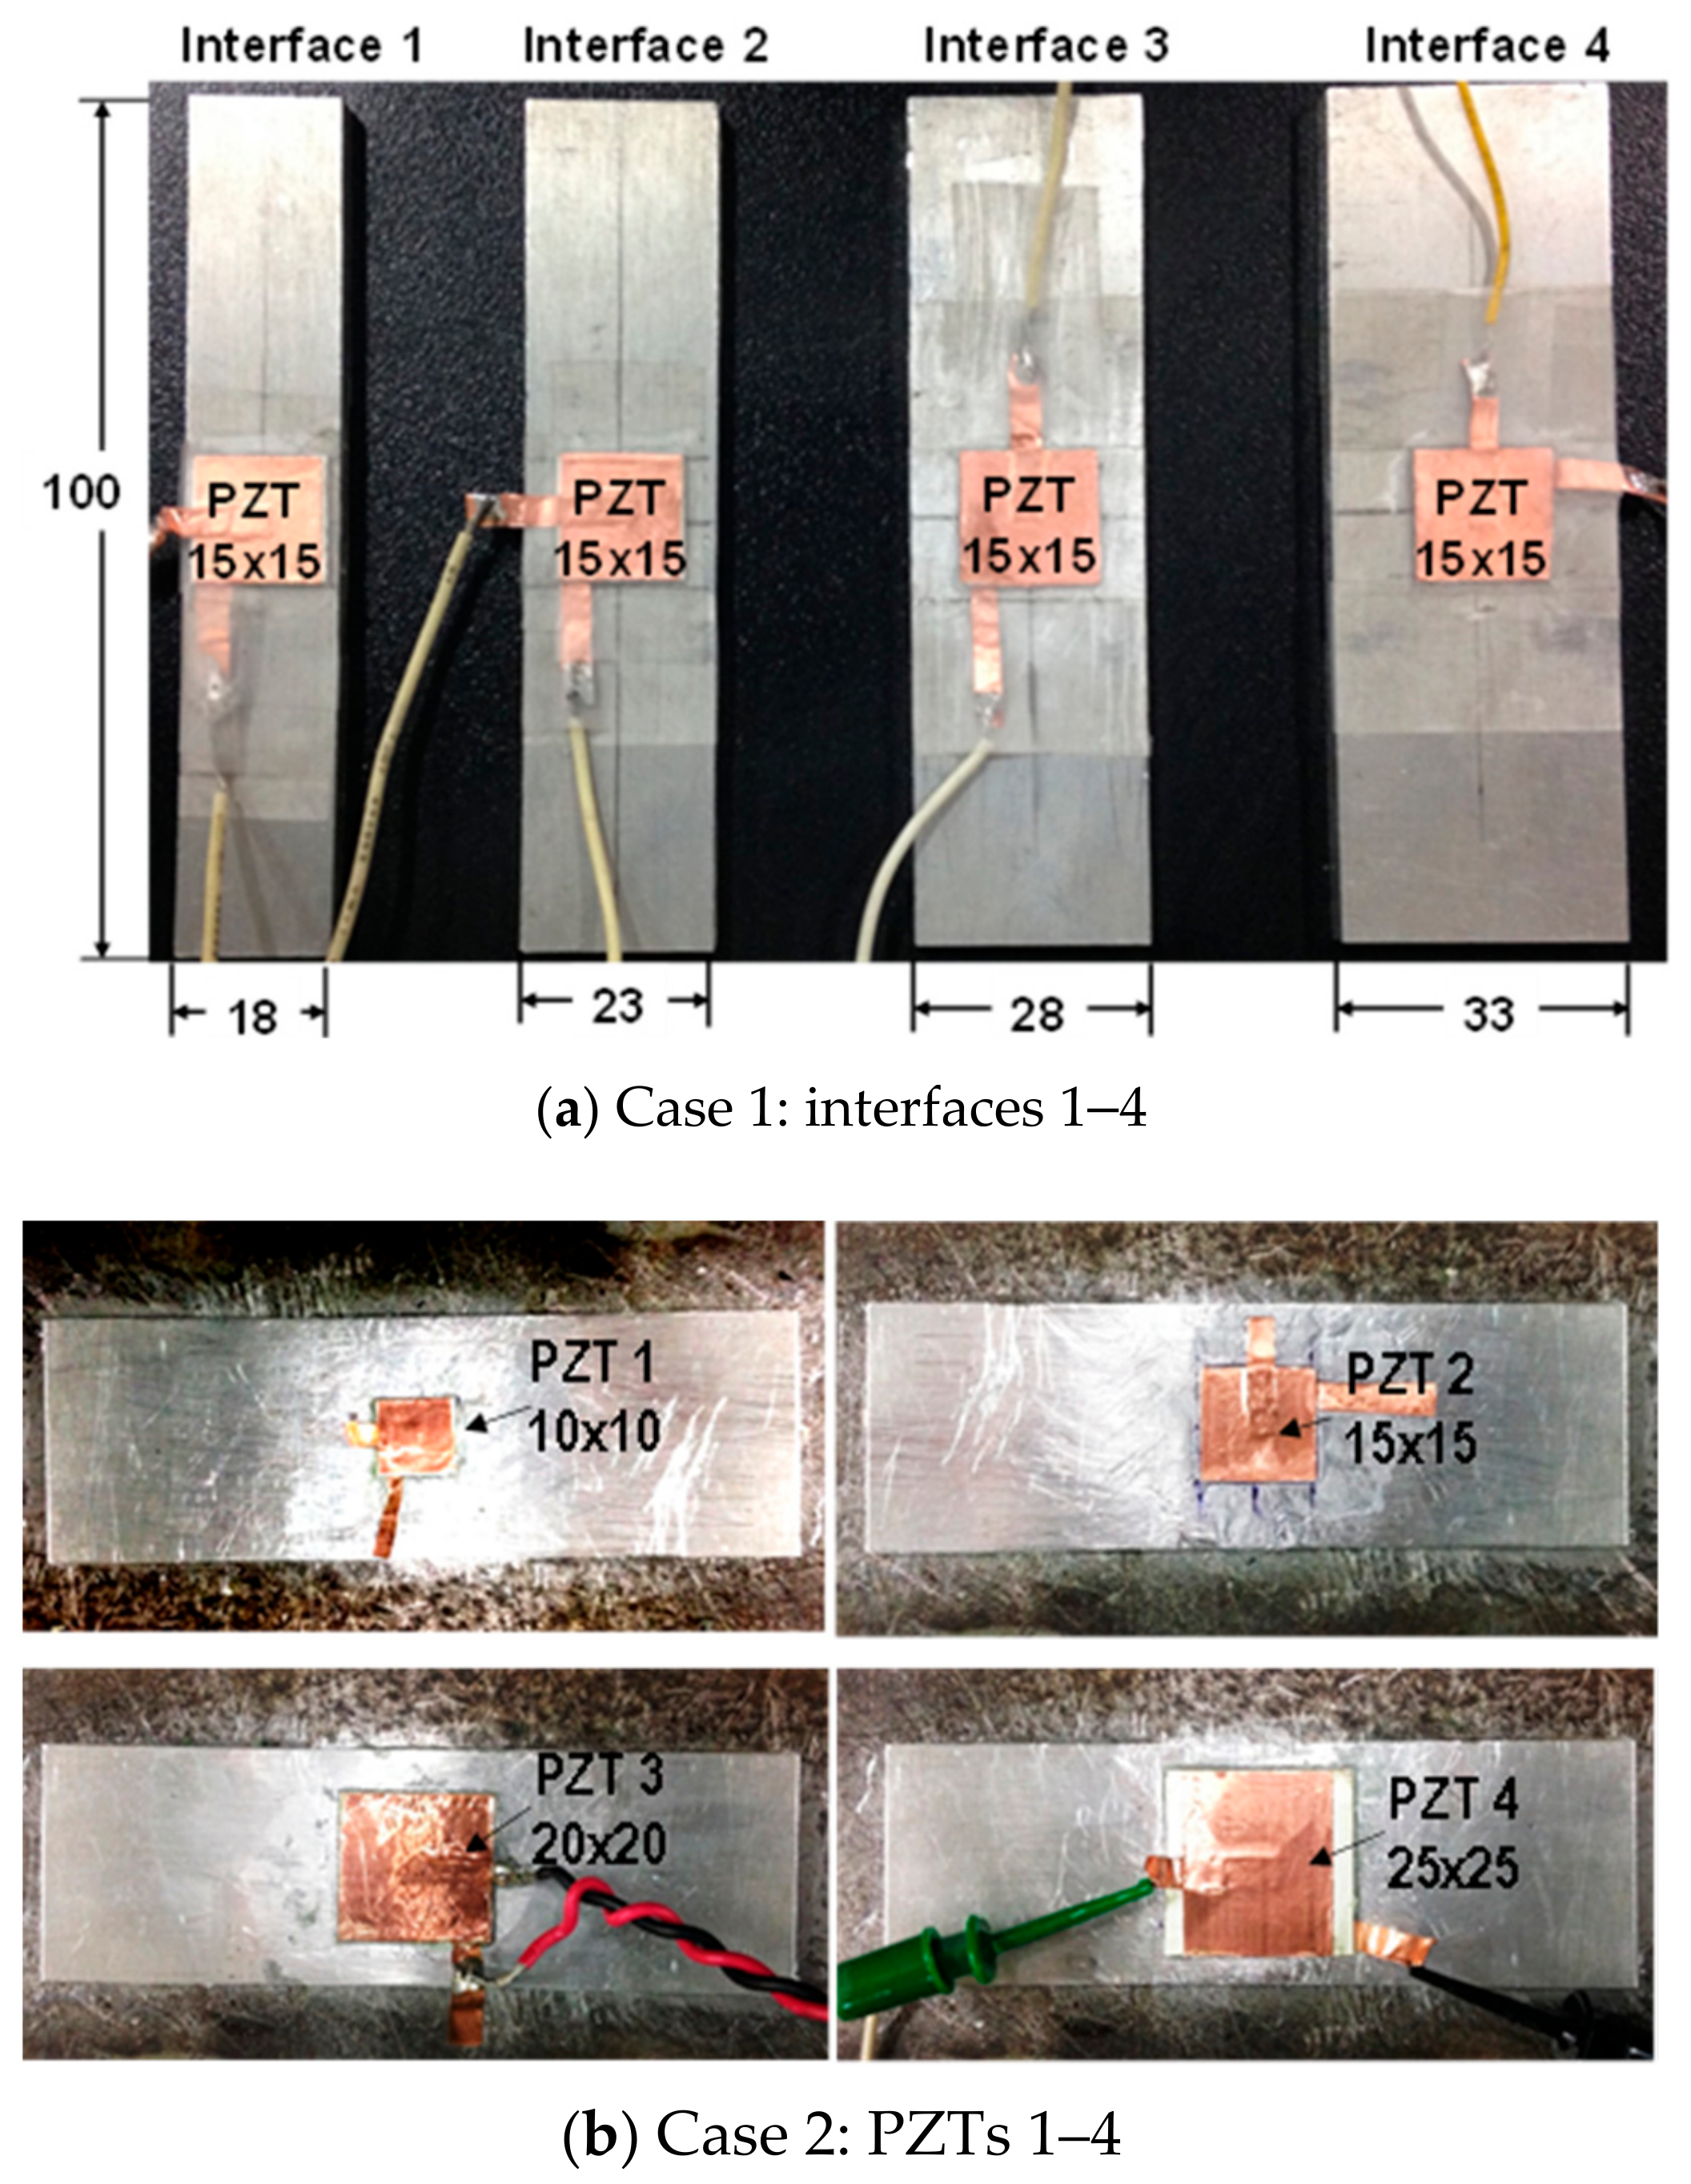
3.1.2. Selection of PZT Interfaces
3.1.3. Testing Procedure
3.2. Effect of Interface’s Geometric Parameters on Damage Sensitivity of Impedance Responses
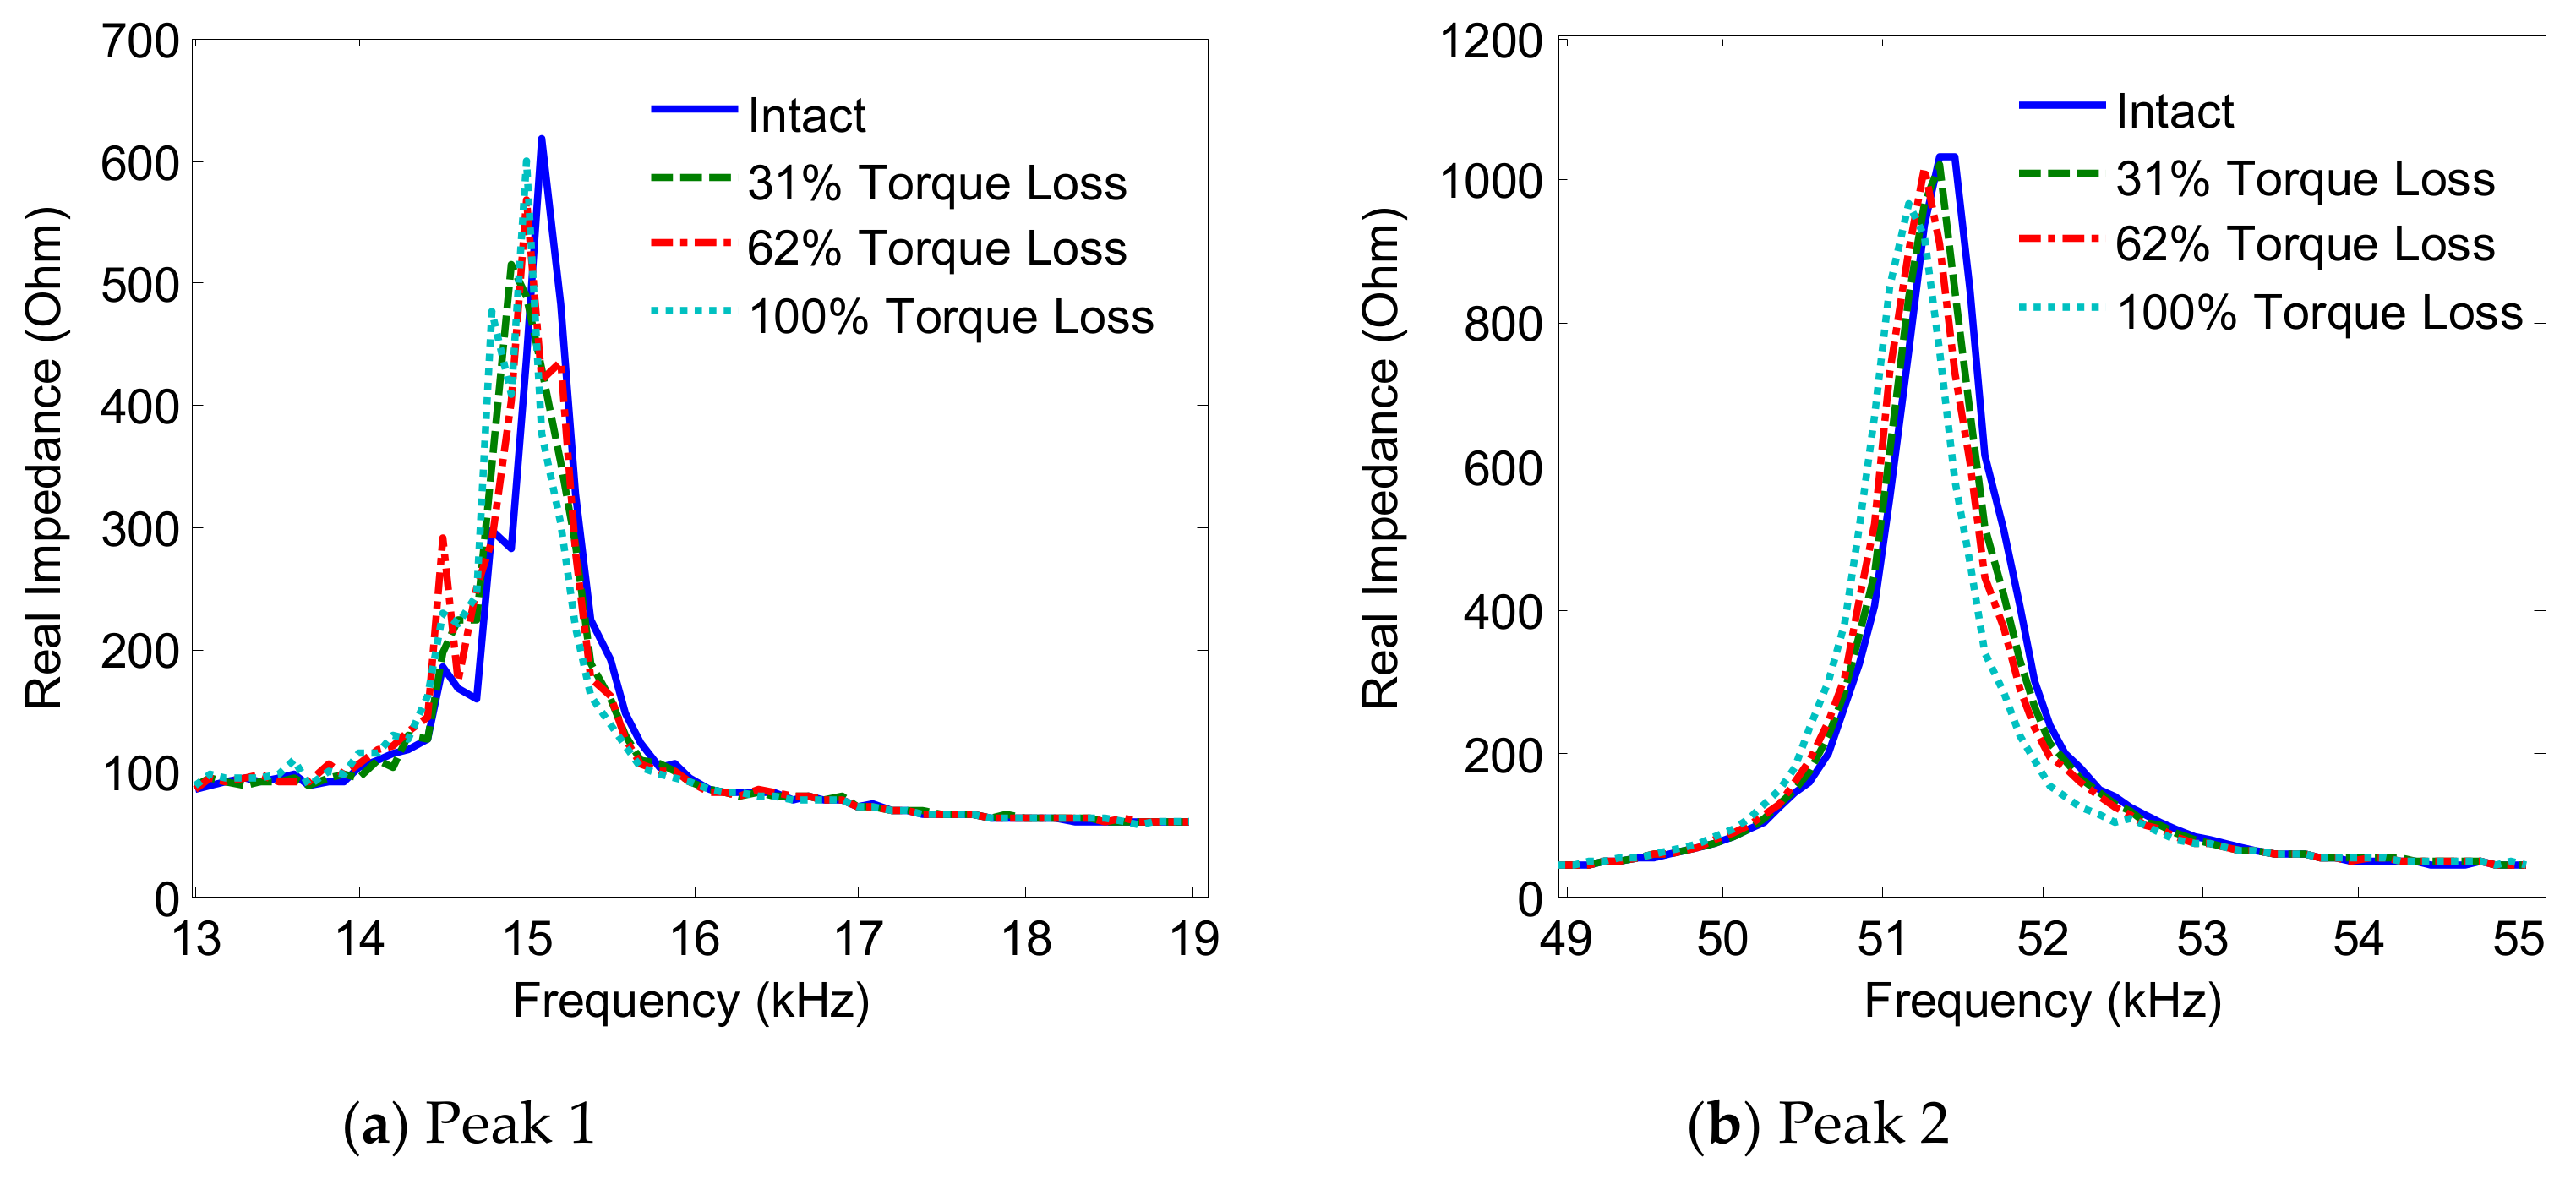
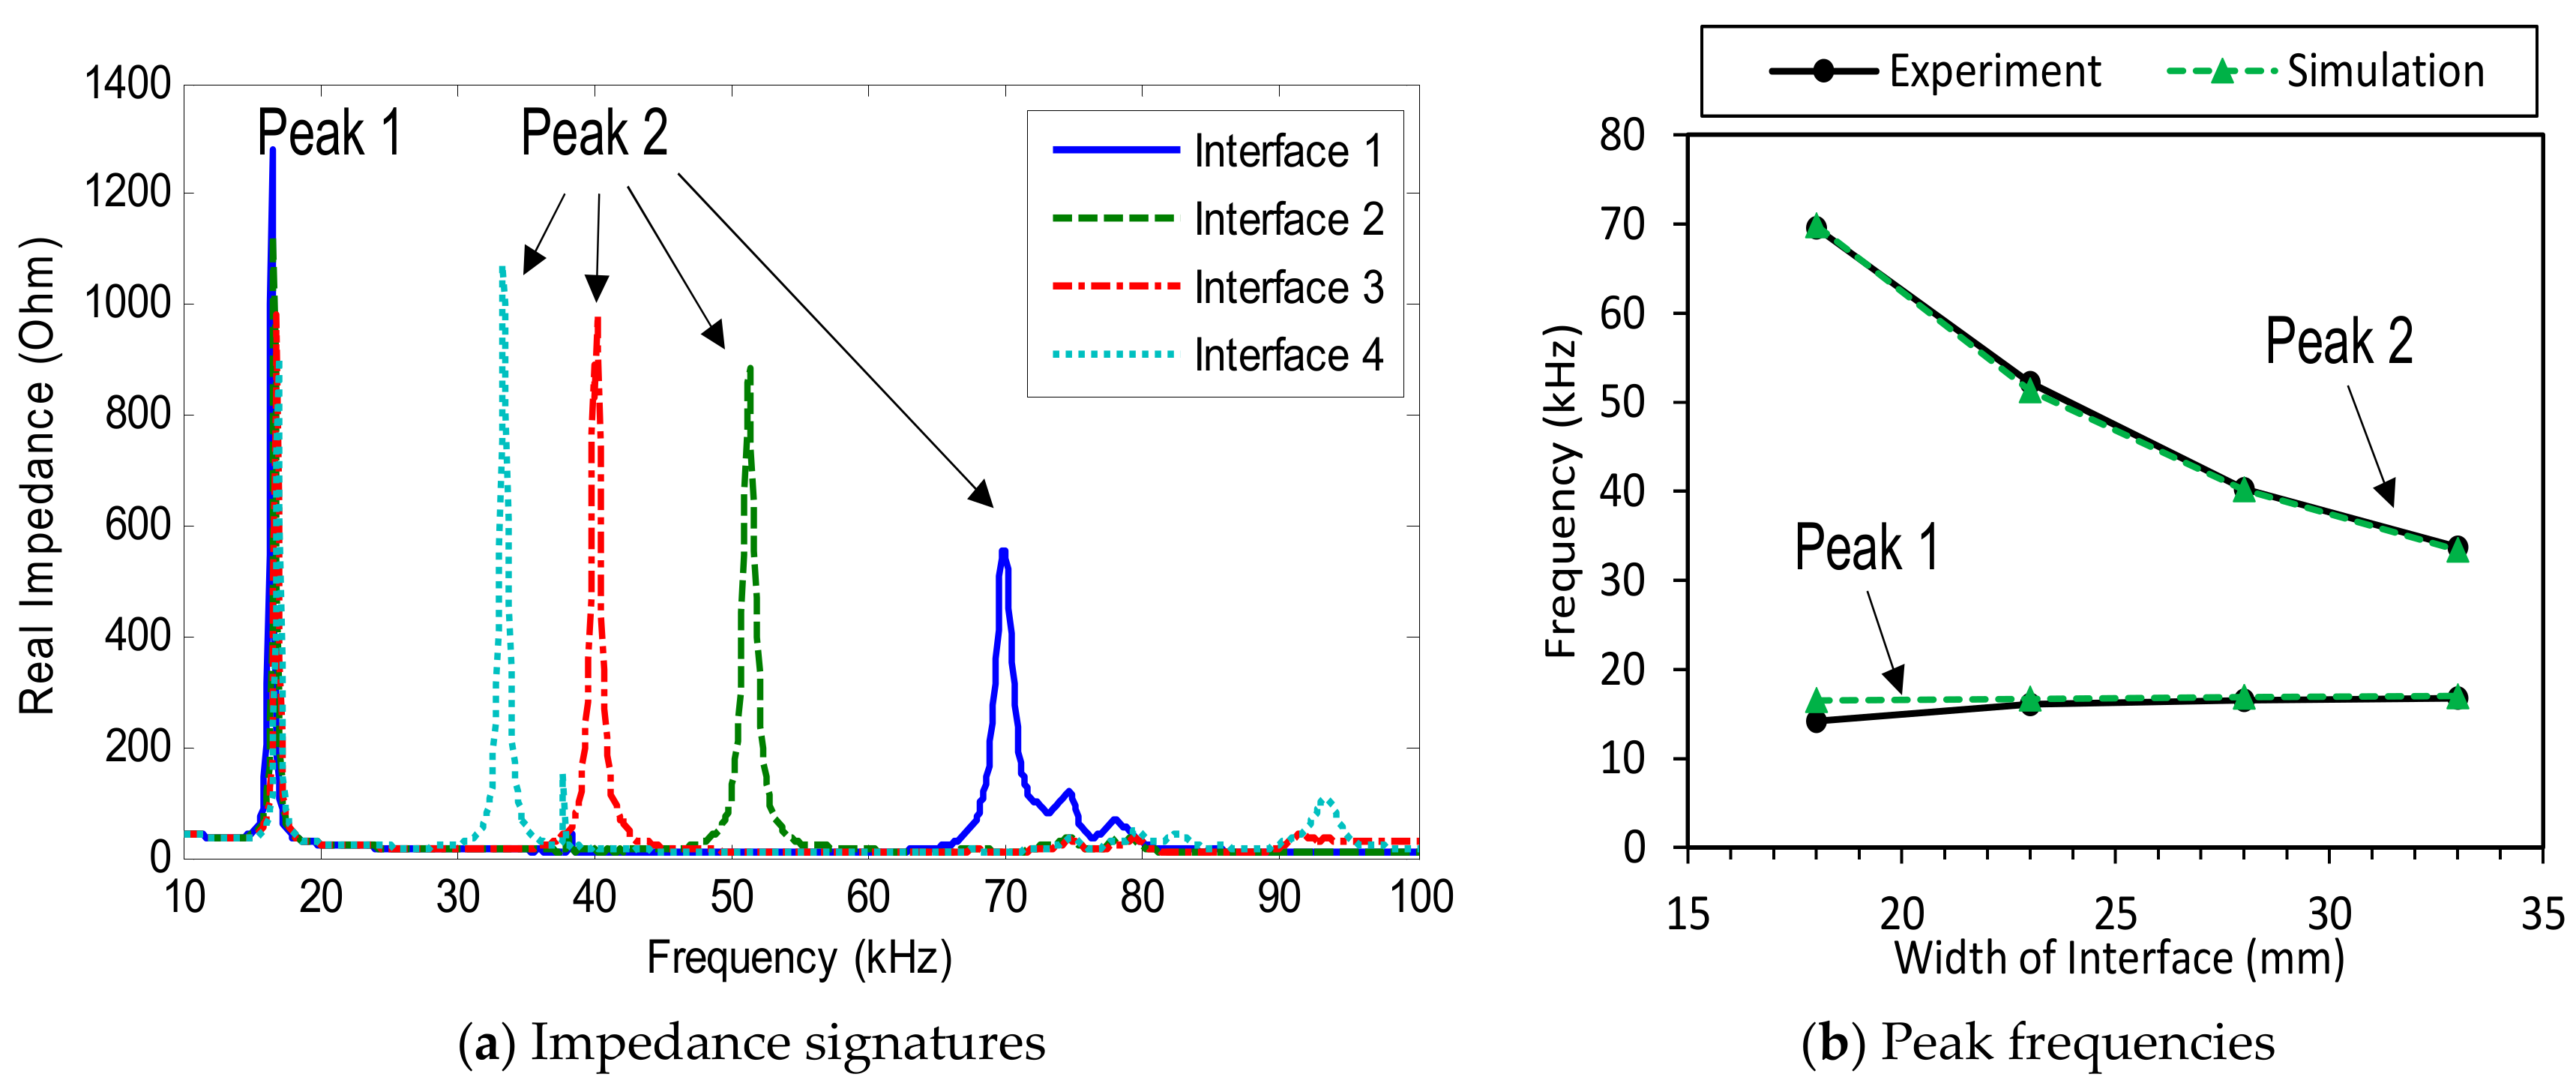
3.2.1. Impedance Signatures versus Interface Width
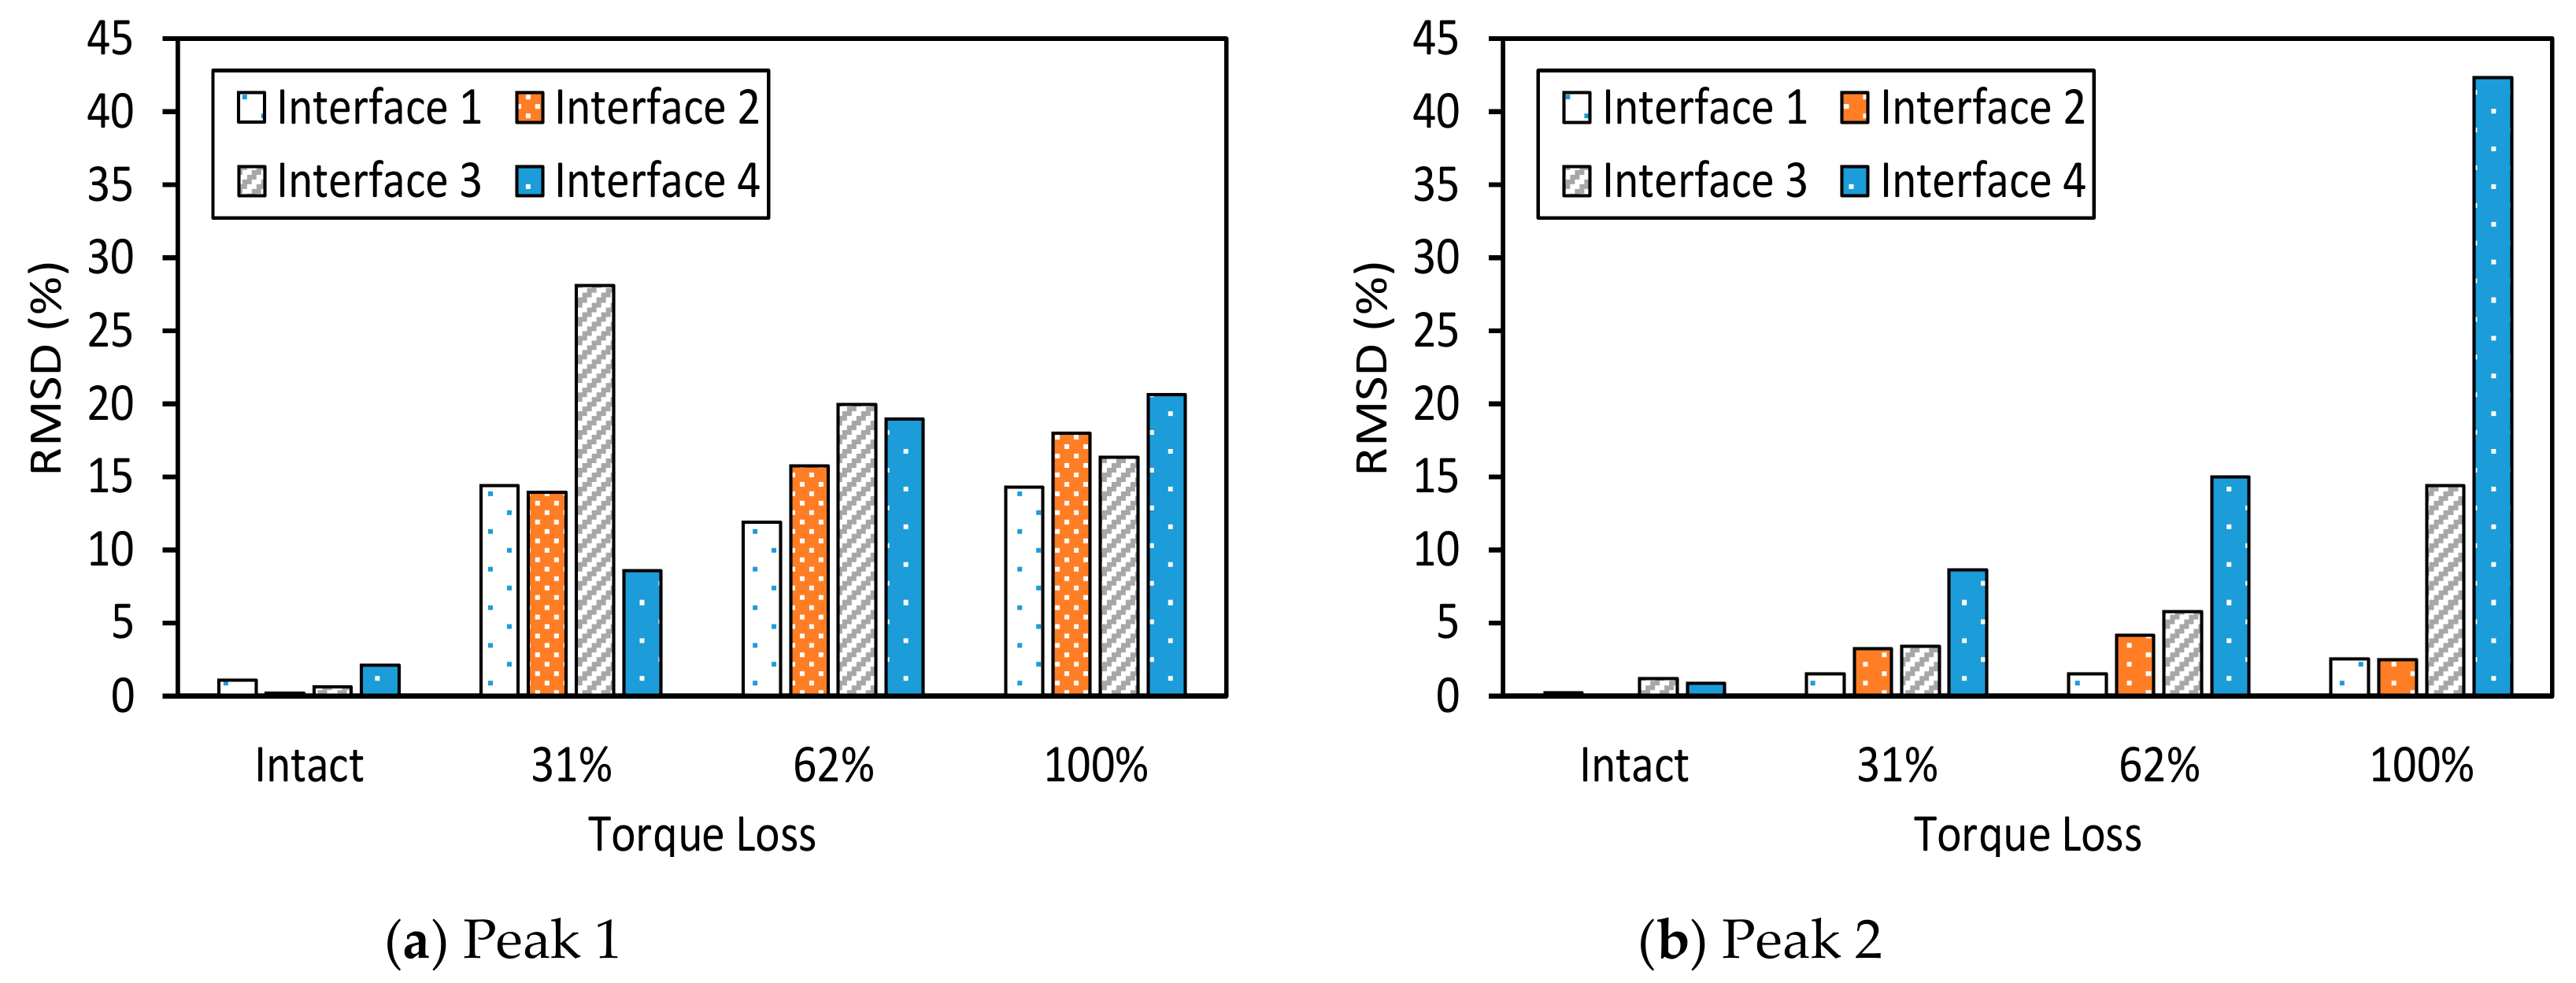
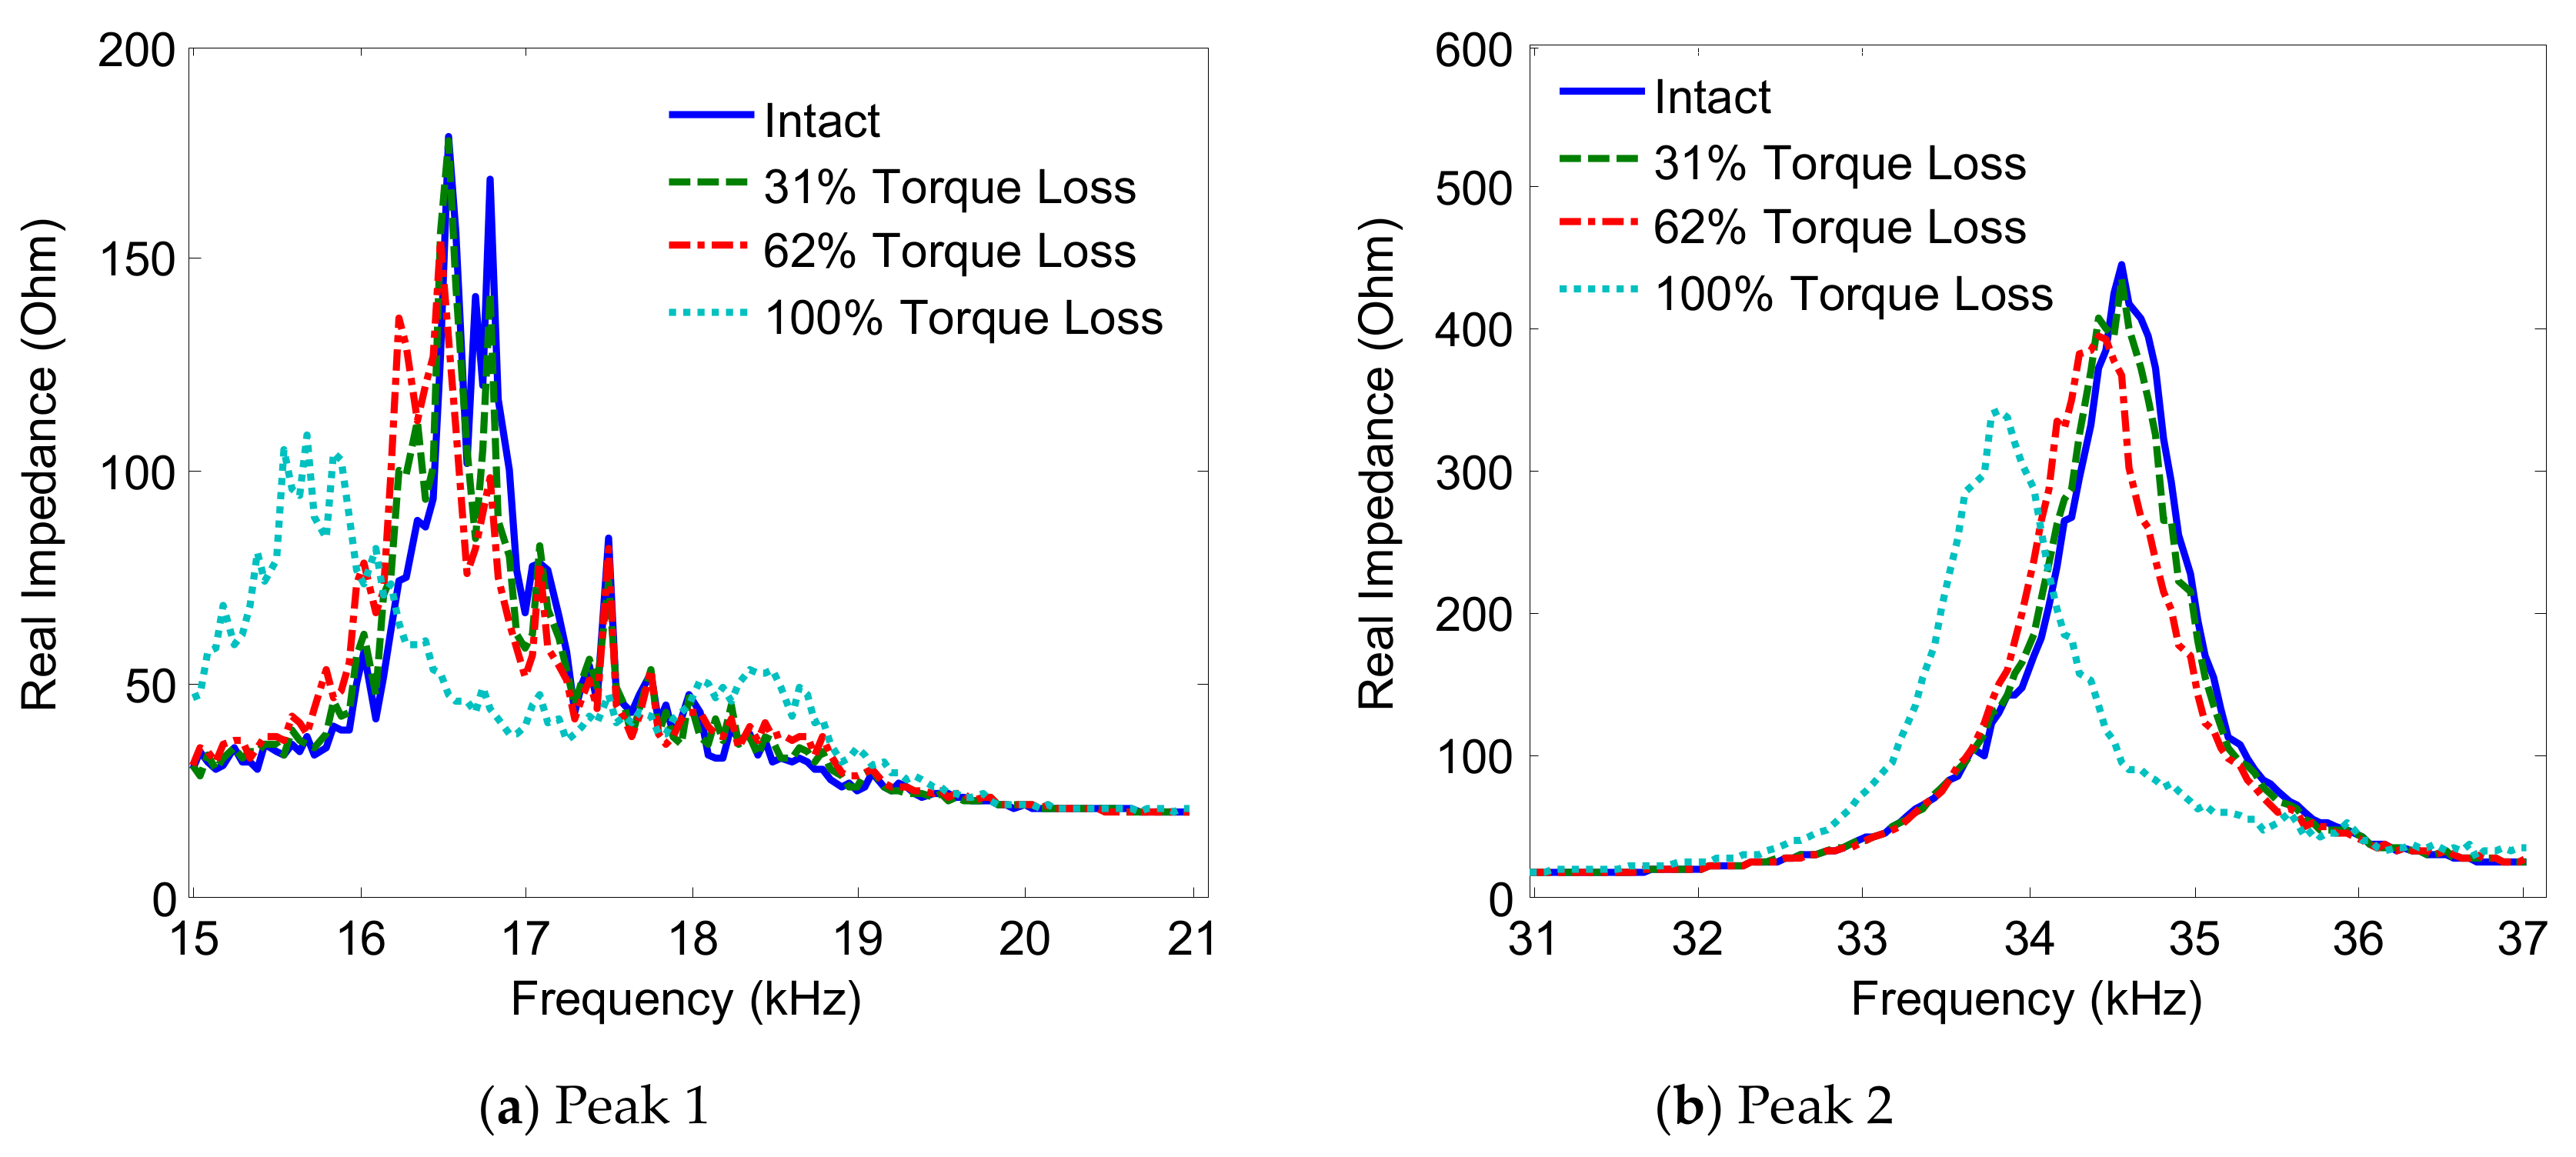
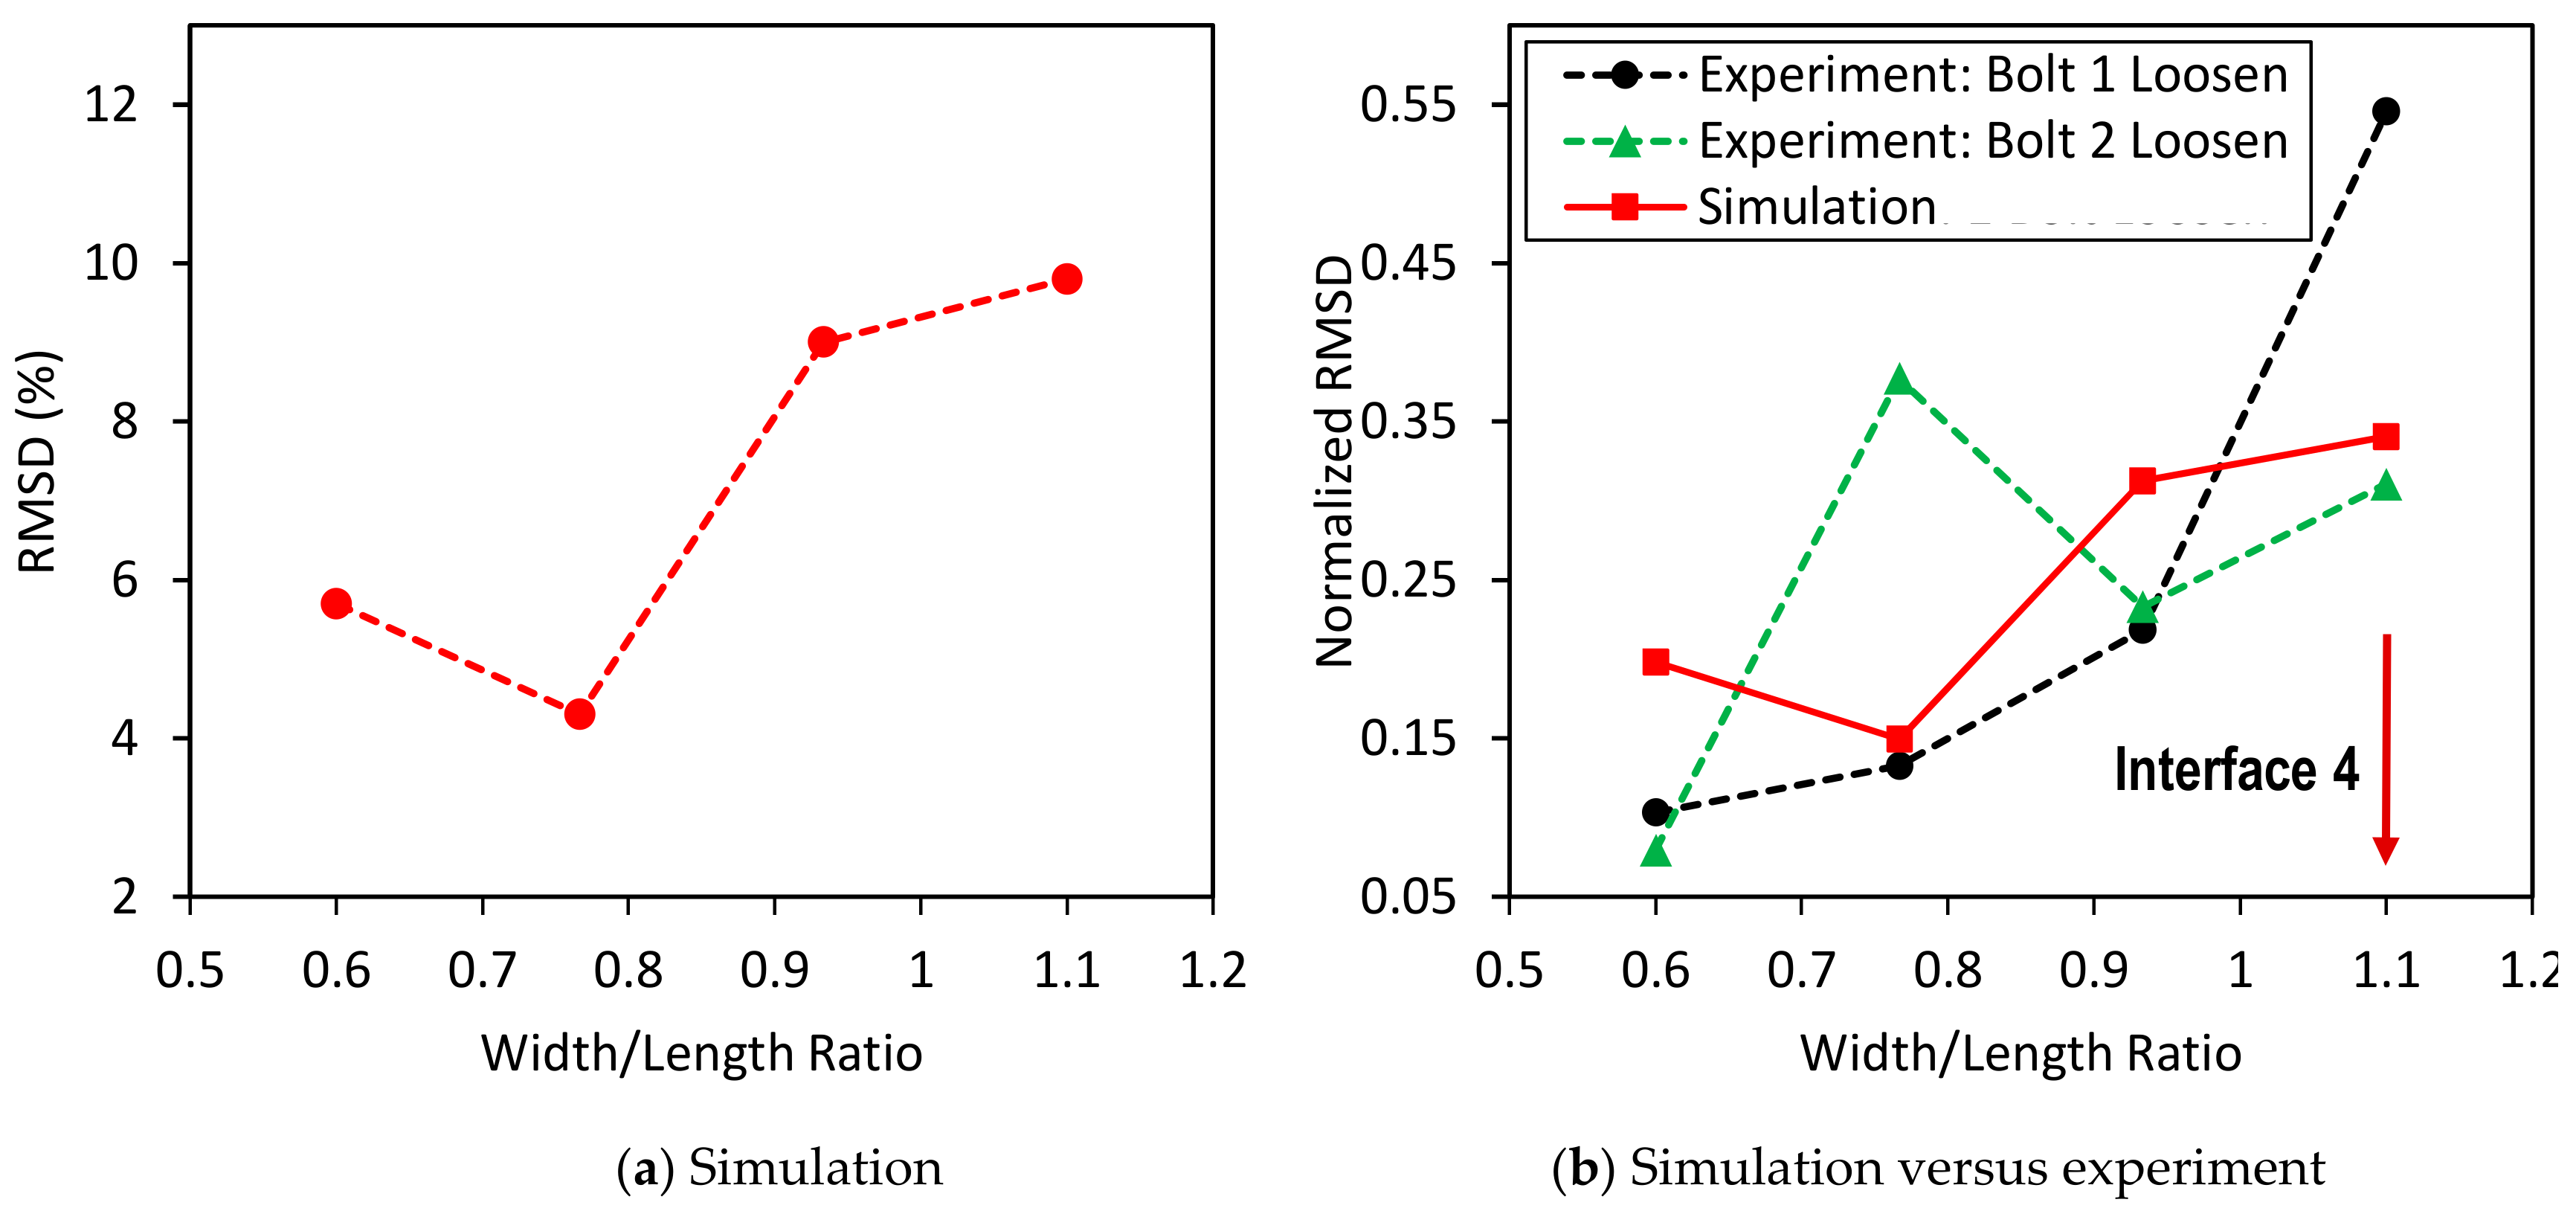
3.2.2. Damage Sensitivity of Impedance Responses versus Interface Width
3.3. Effect of PZT Size on the Damage Sensitivity of Impedance Responses
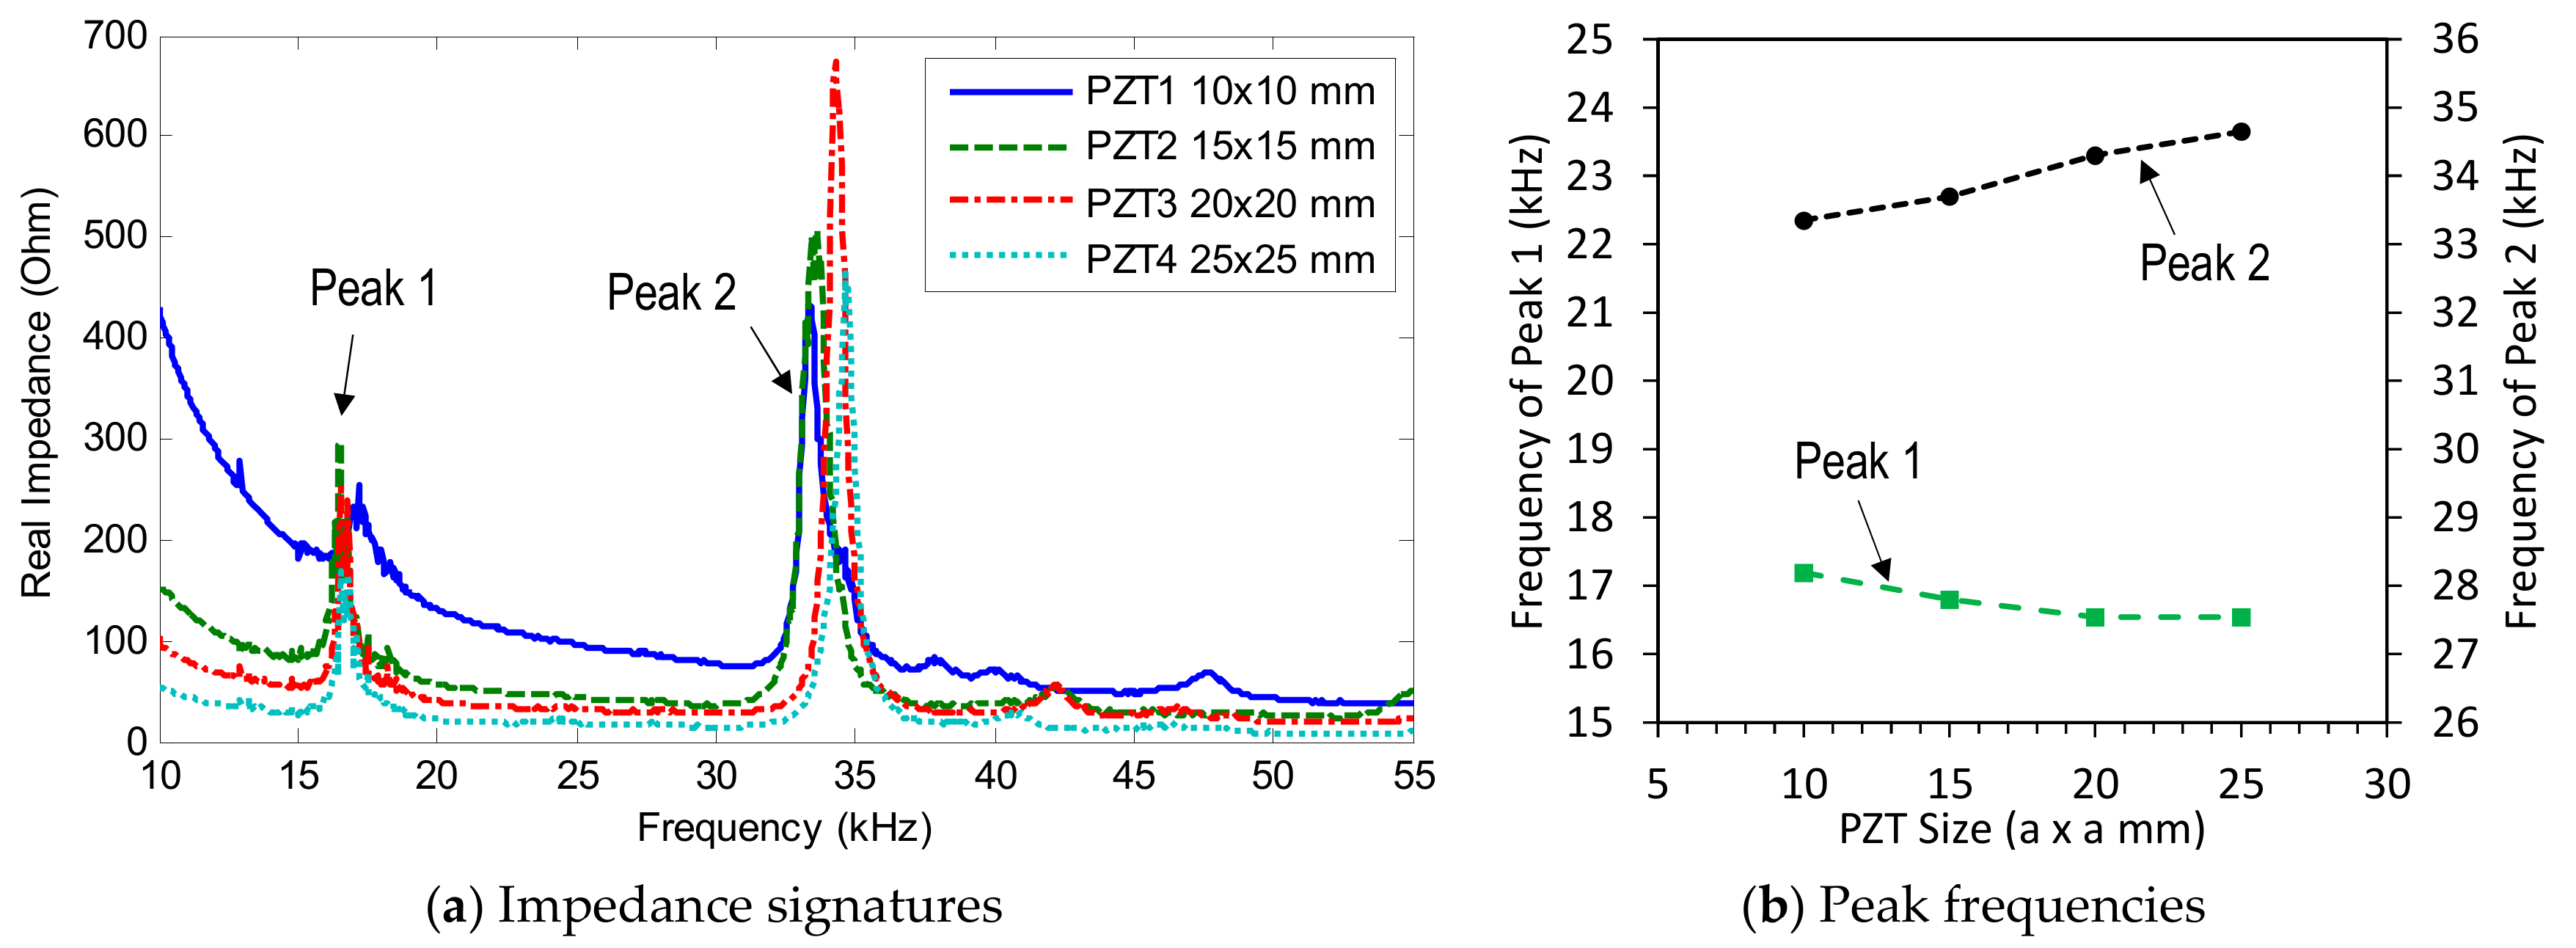
3.3.1. Impendance Signatures versus Piezoelectric Size
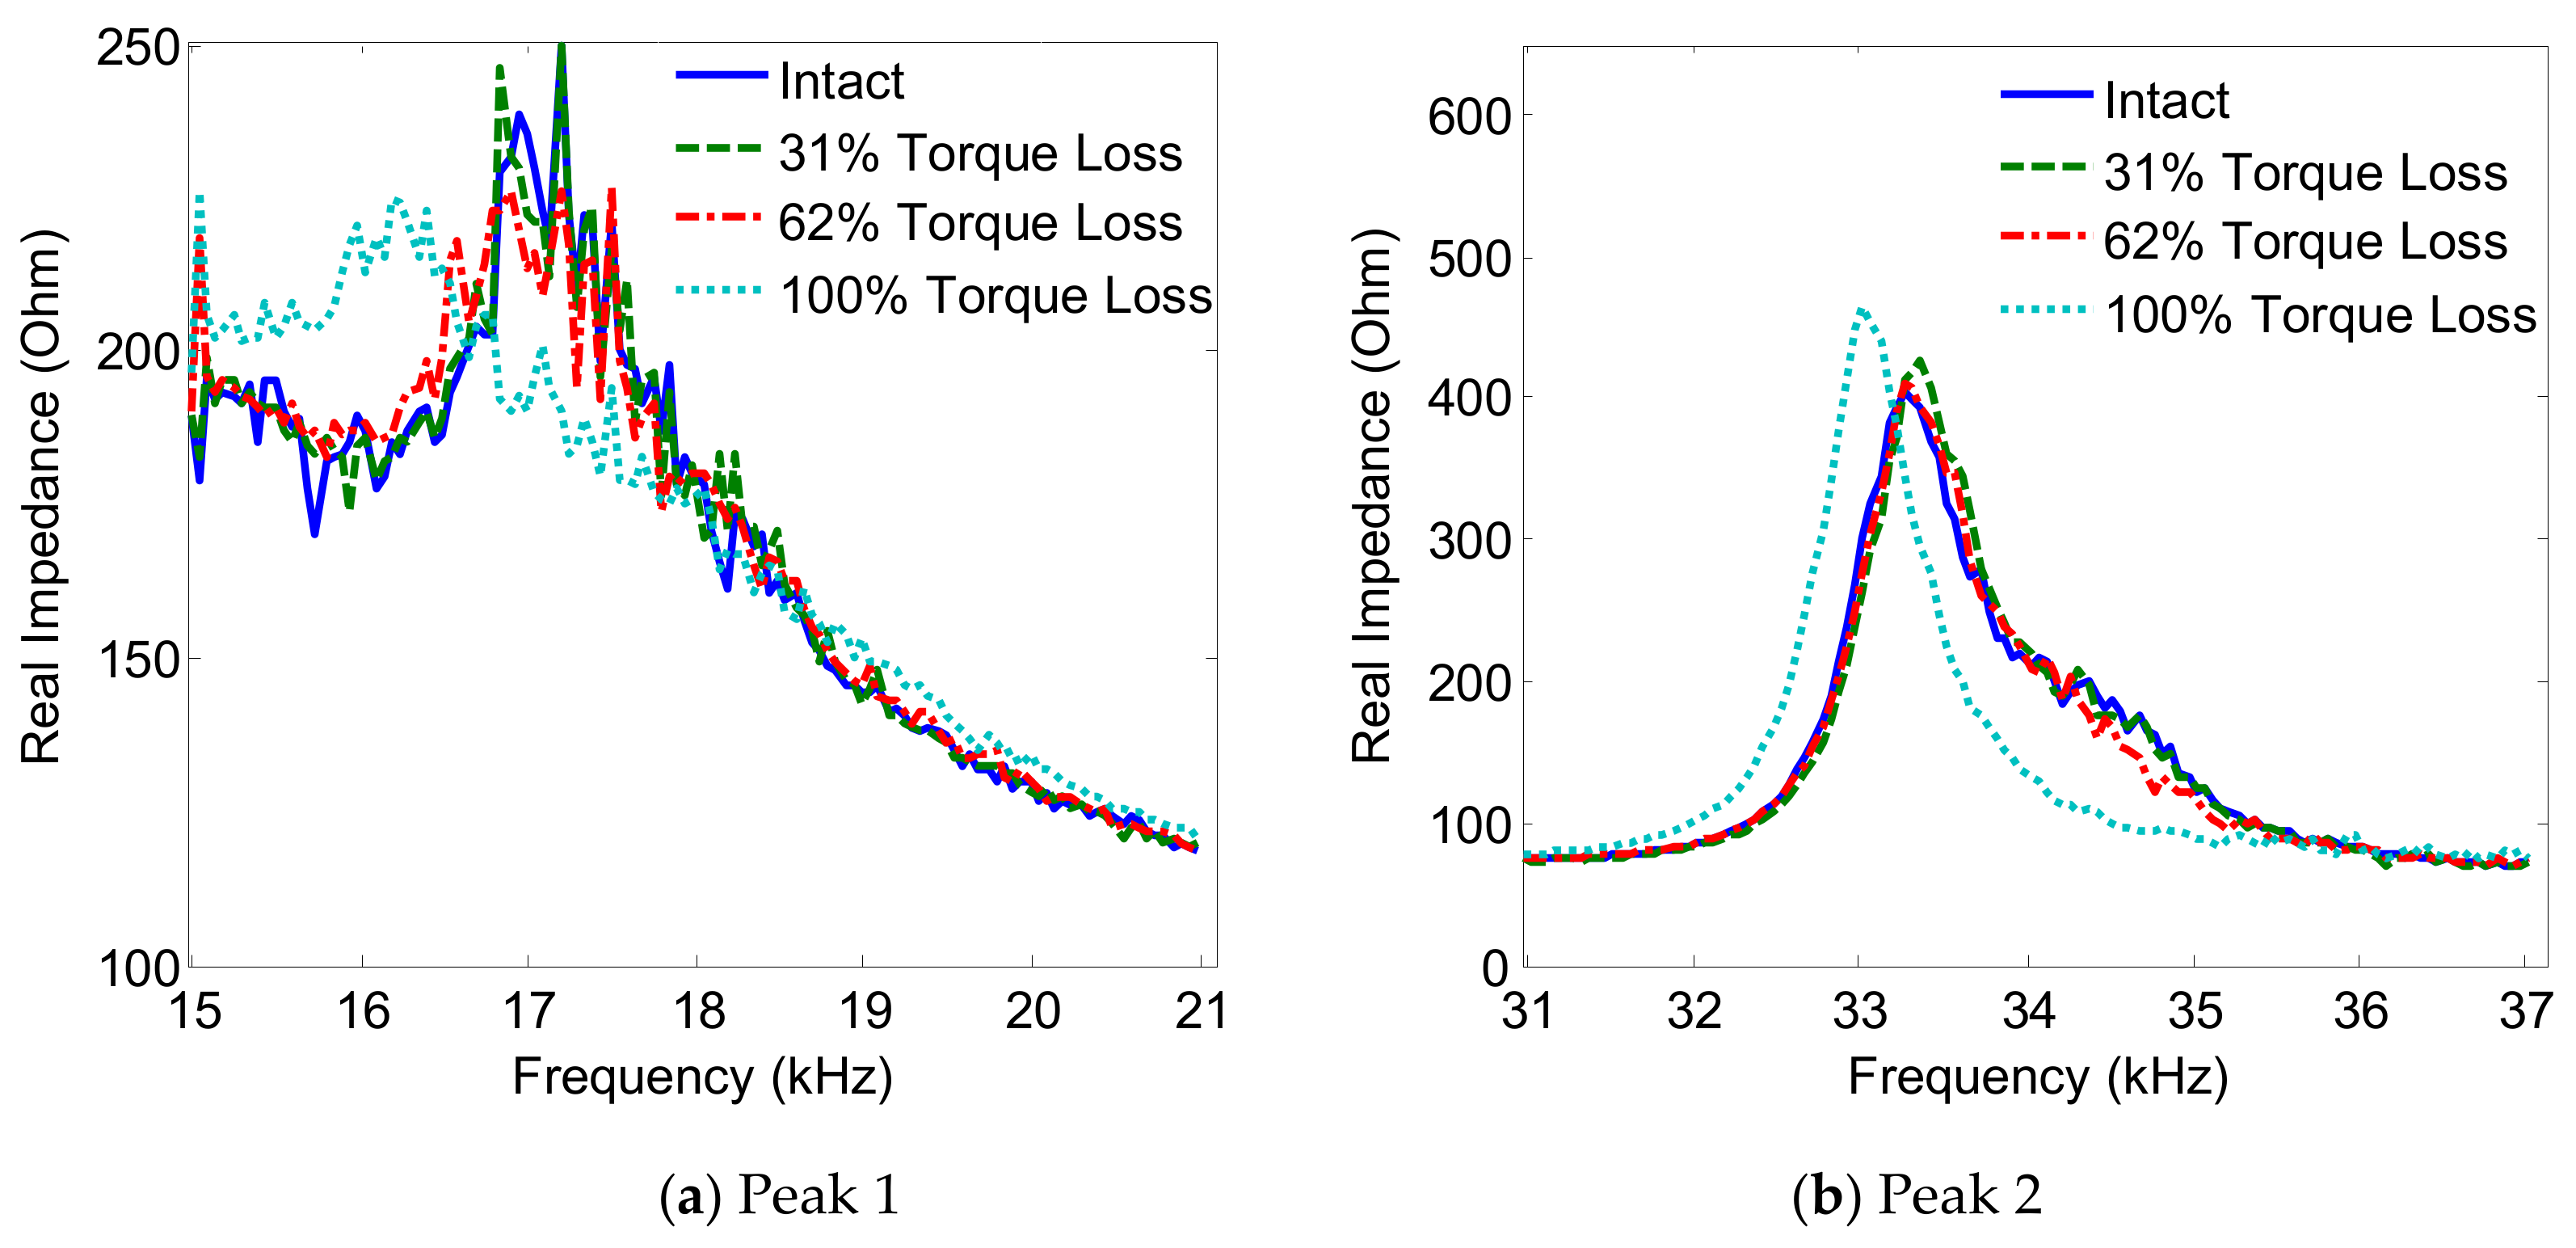
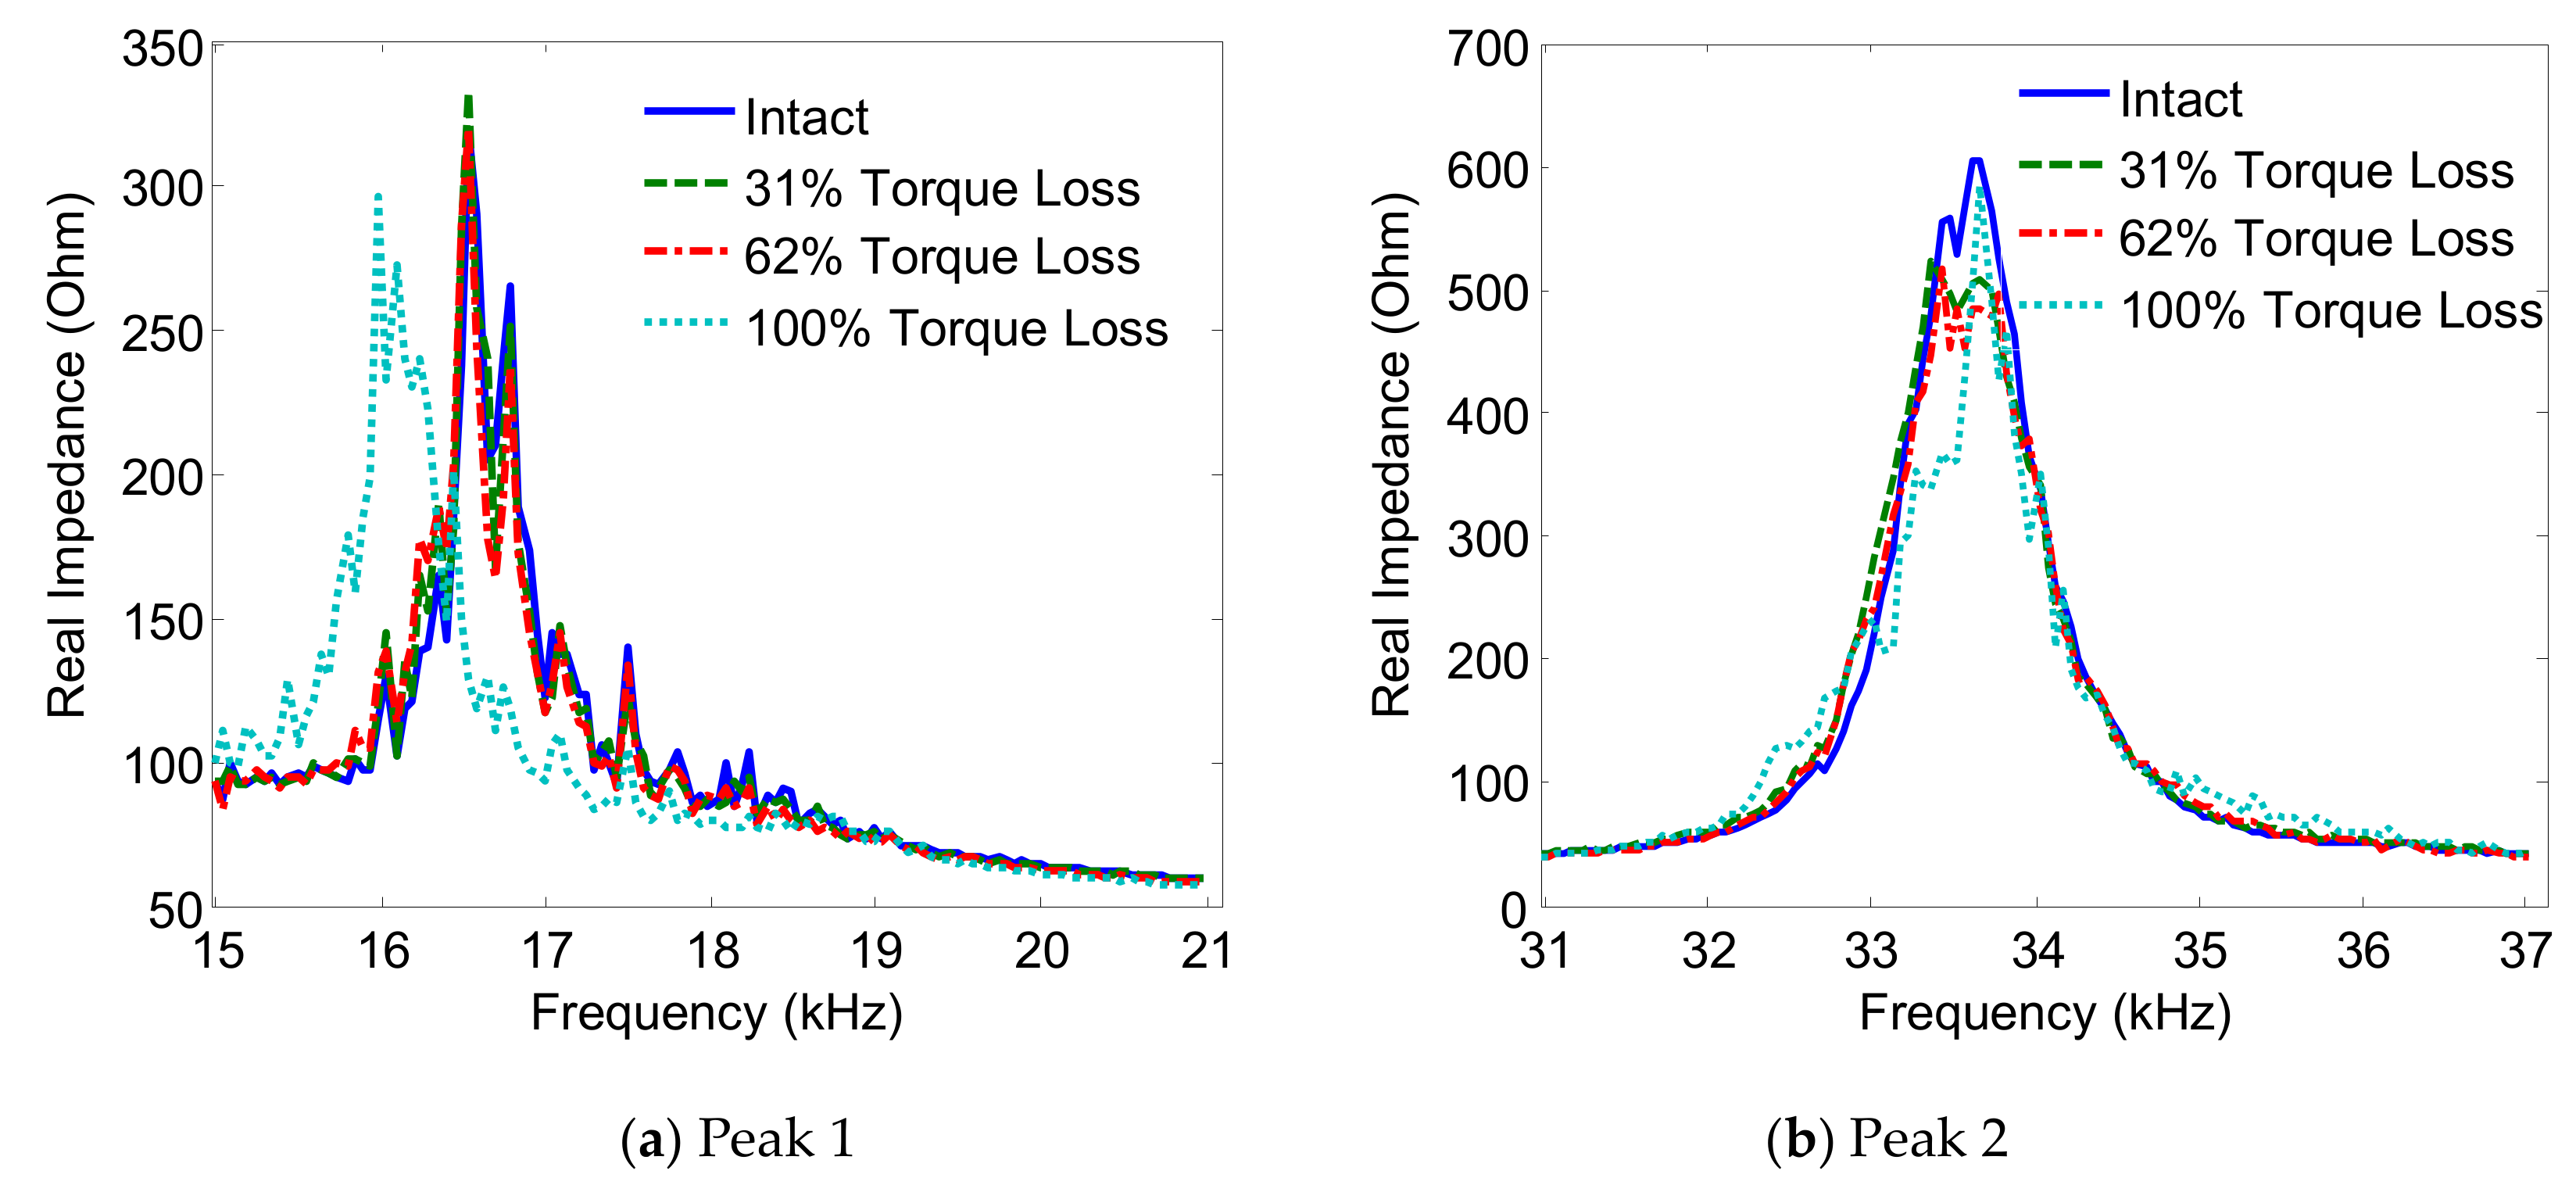
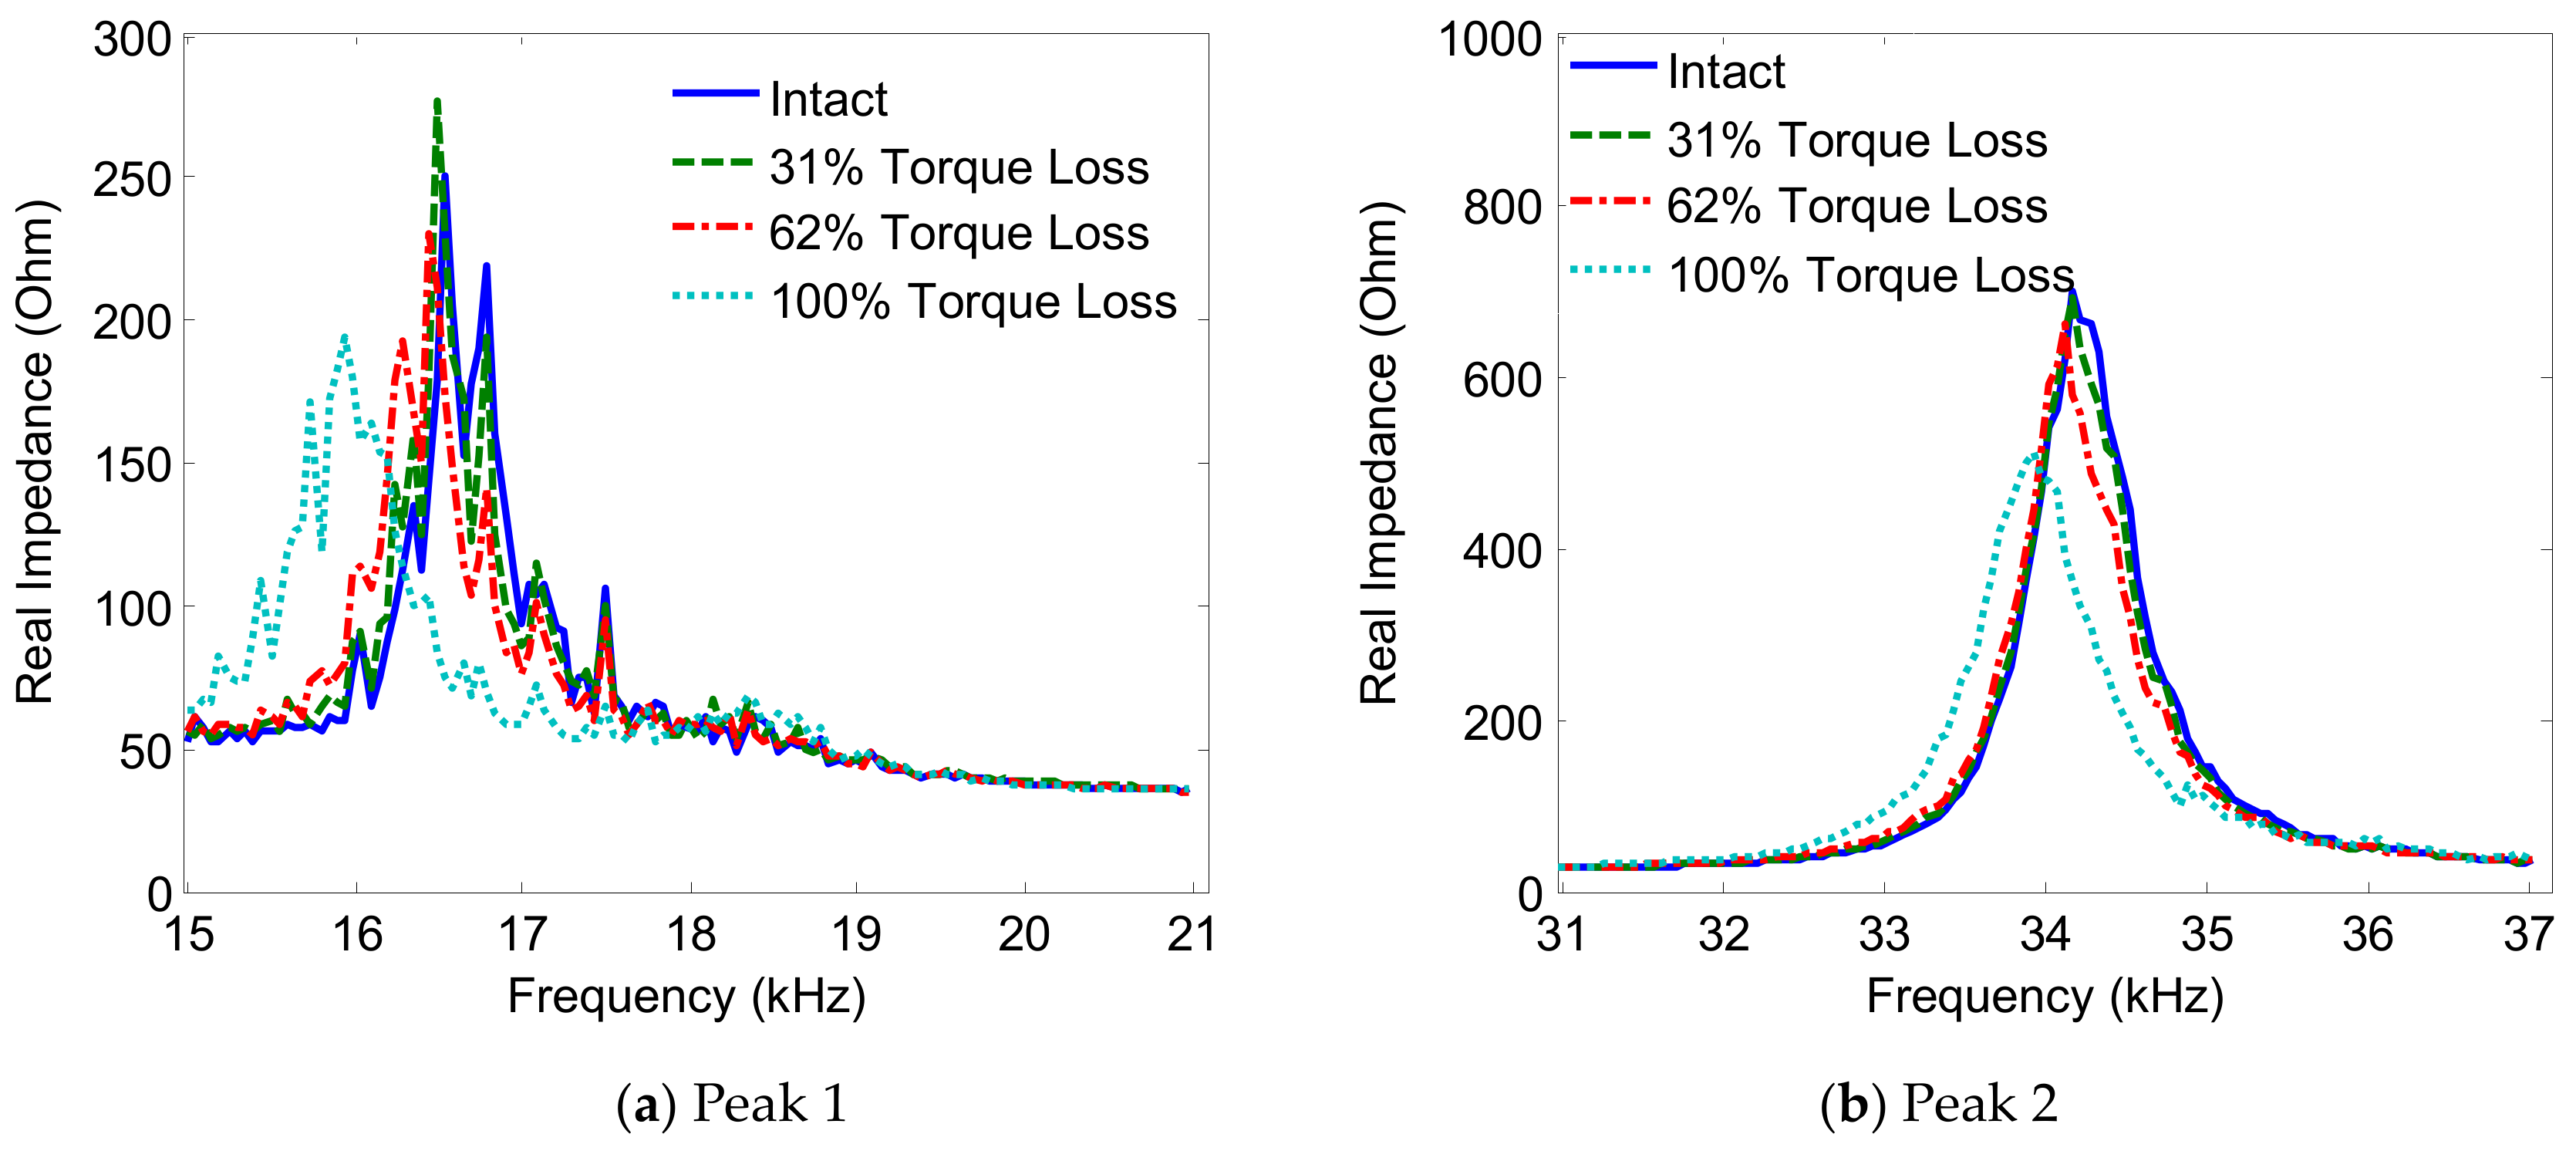
3.3.2. Damage Sensitivity of Impedance Signatures versus PZT Size
4. Numerical Investigation on the Damage Sensitivity of Piezoelectric-Based Smart Interfaces
4.1. Numerical Modeling of Bolted Connection
4.1.1. Modeling of PZT Interface-Bolted Connection Interaction
4.1.2. Simulation Cases
4.2. Numerical Analysis of Interface’s Geometric Parameters
4.2.1. Numerical Impedance Signatures versus Interface Width
4.2.2. Damage Sensitivity of Numerical Impedance Signatures
4.3. Numerical Analysis of PZT Size
4.3.1. Numerical Impedance Signatures versus PZT Size
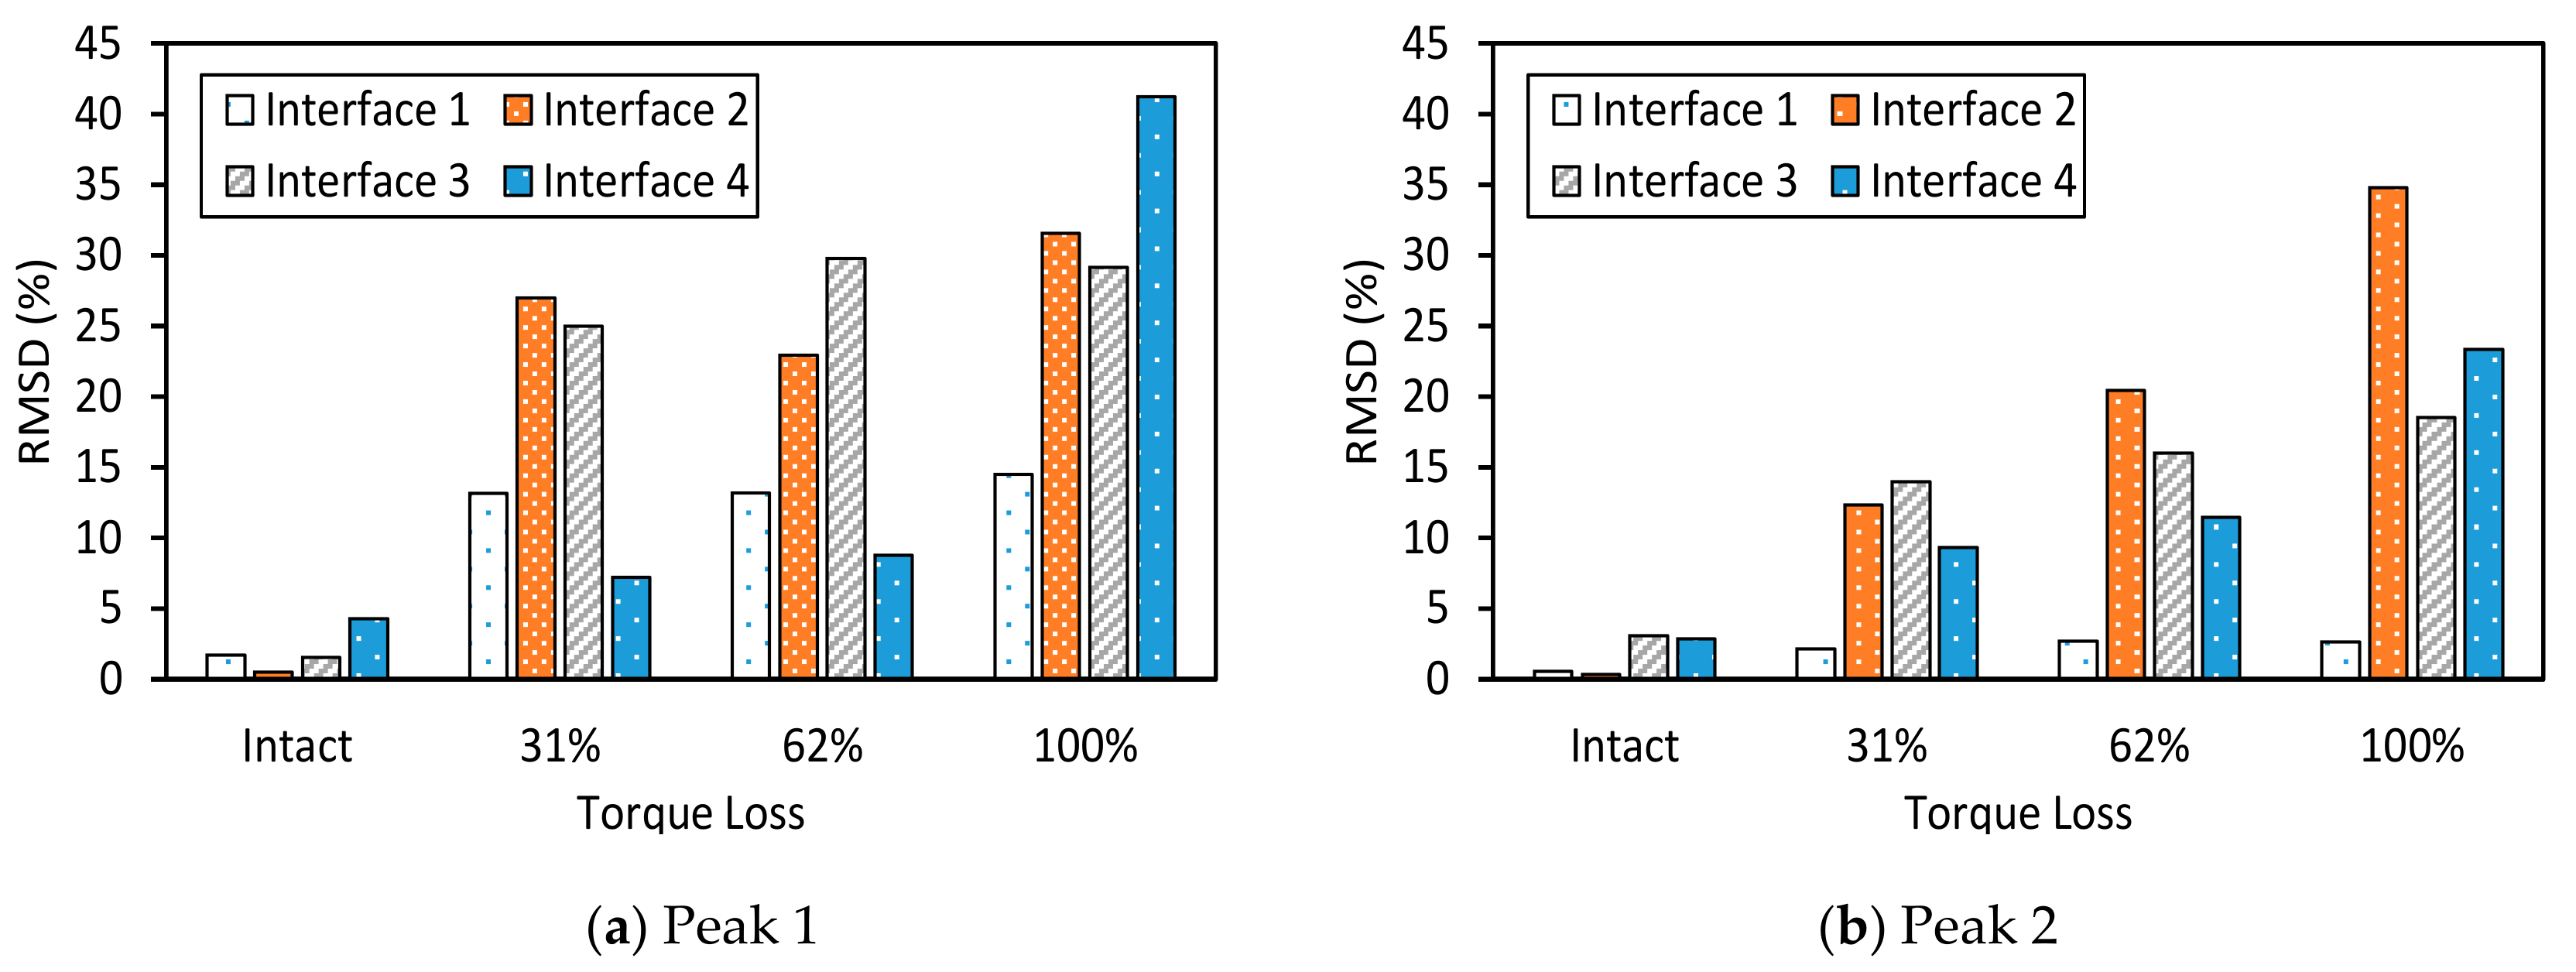
4.3.2. Damage Sensitivity of Numerical Impedance Signatures
5. Conclusions
- (1)
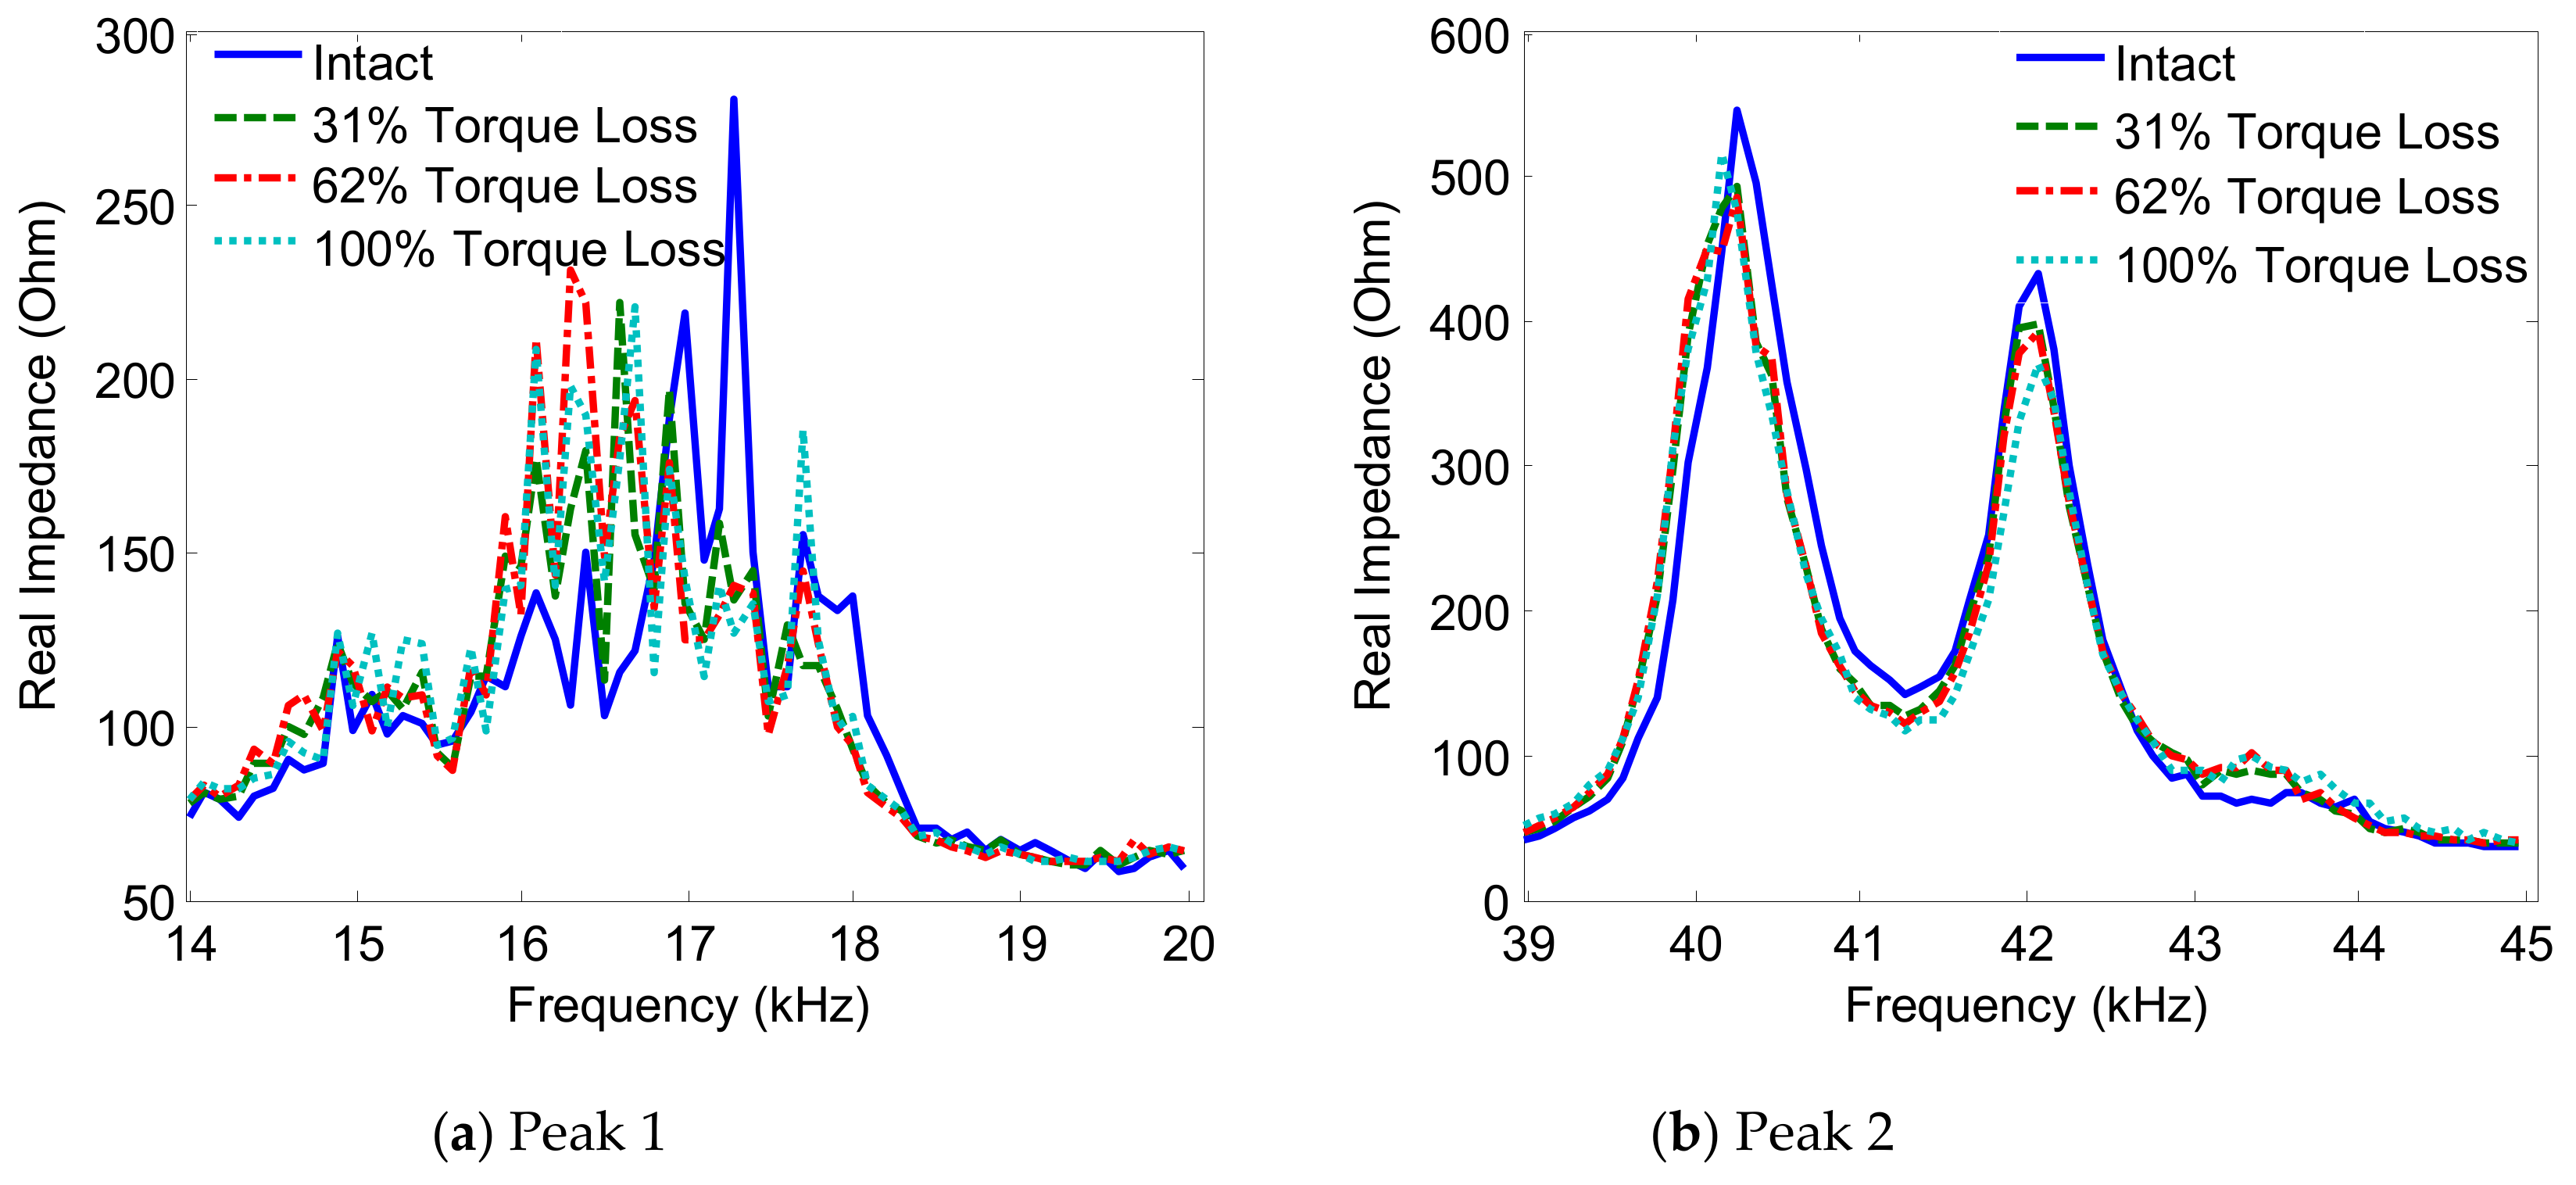
- When the width of the interface increased, the flexible section of the interface changed from the beam-like structure to the plate-like structure. As a result, the resonant frequency of Peak 1 was slightly increased, while the resonant frequency of Peak 2 was significantly decreased. The longitudinal flexural motion of Peak 1 remained unchanged, while the lateral flexural motion of Peak 2 became more distinct, along with an increase of the interface’s width. The more distinct motions of the impedance peaks might cause improved sensitivity of the impedance signatures.
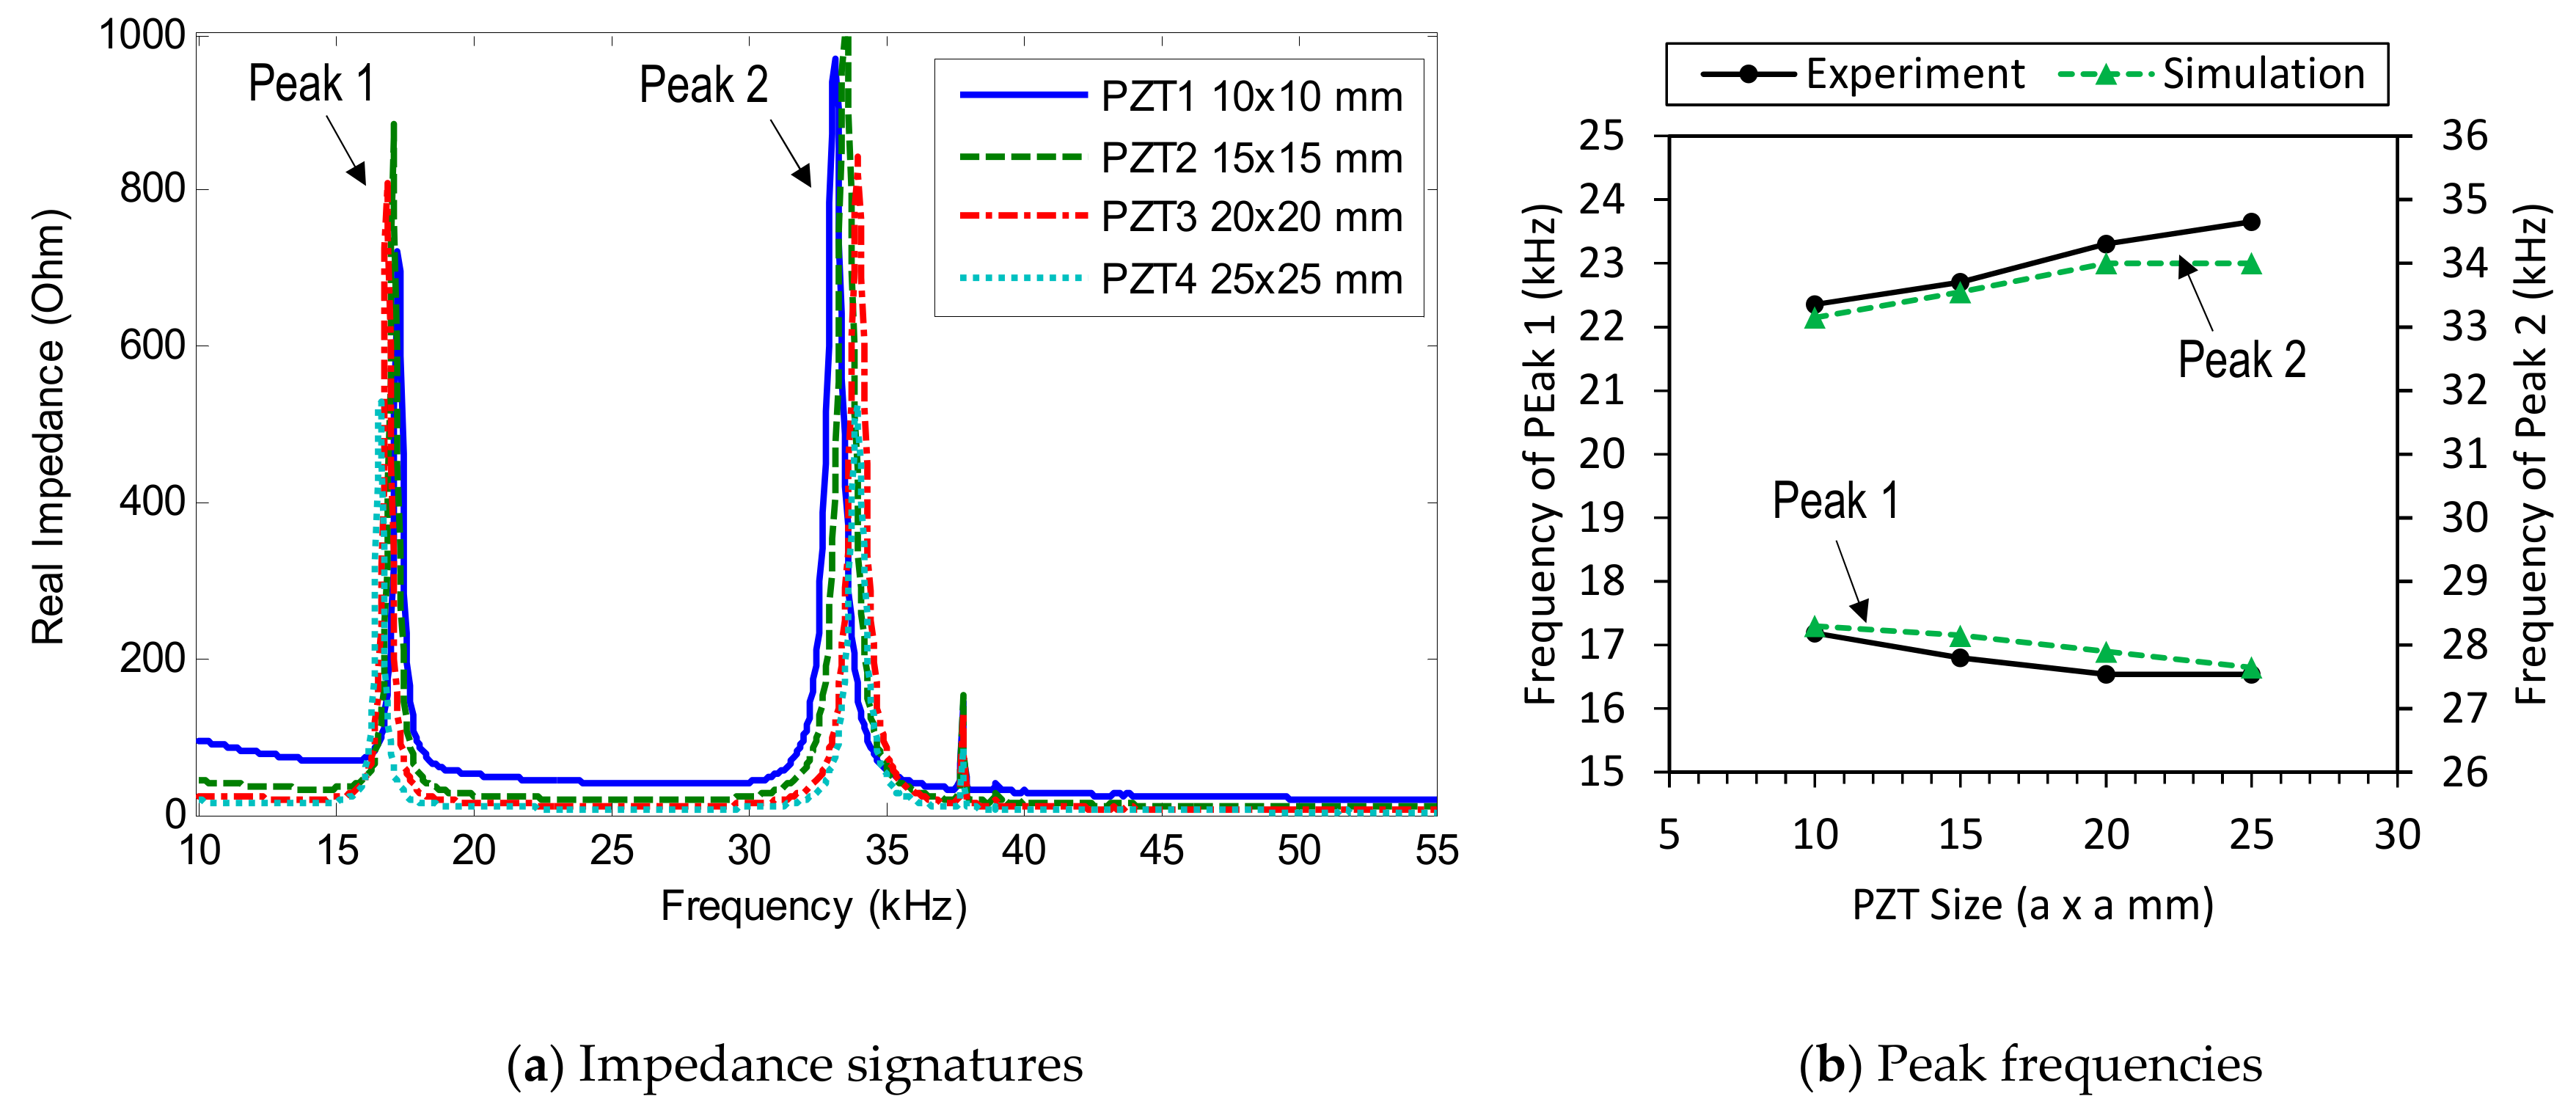
- (2)
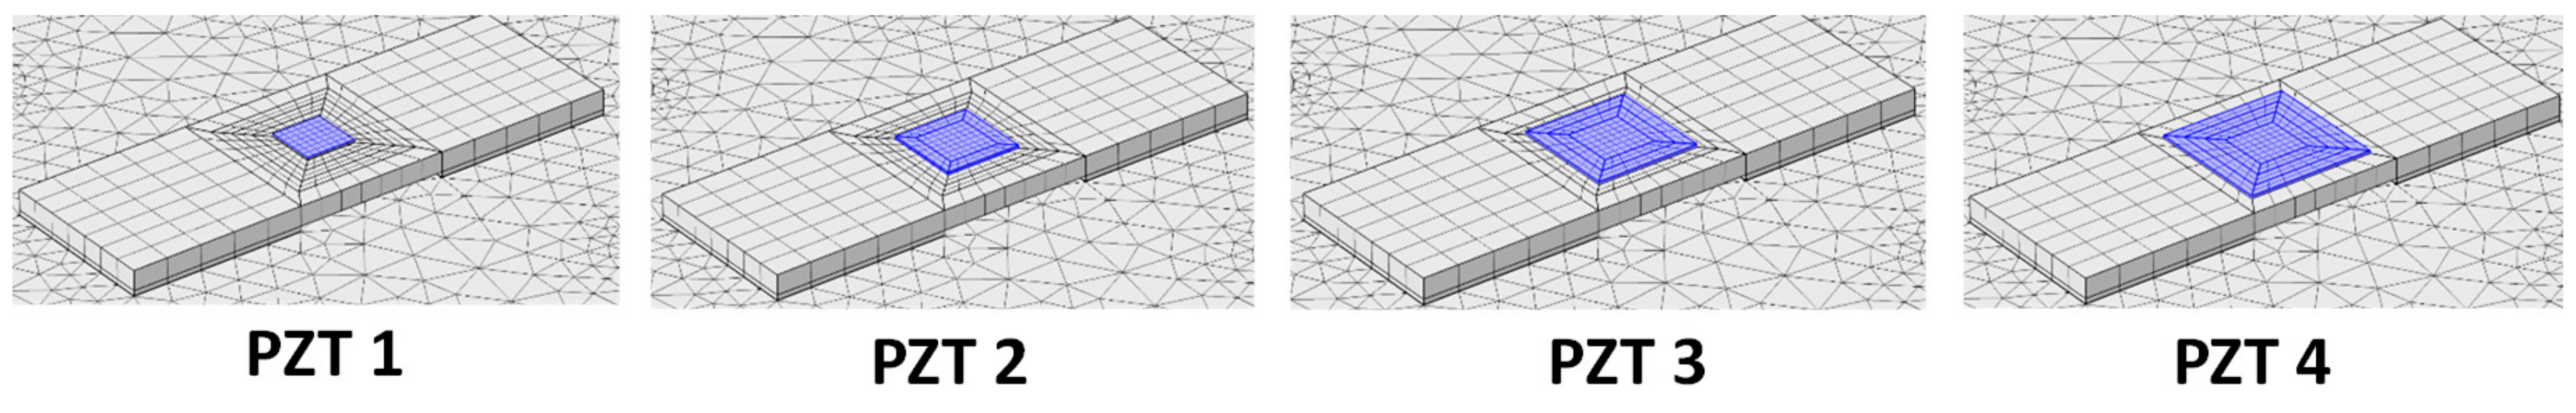
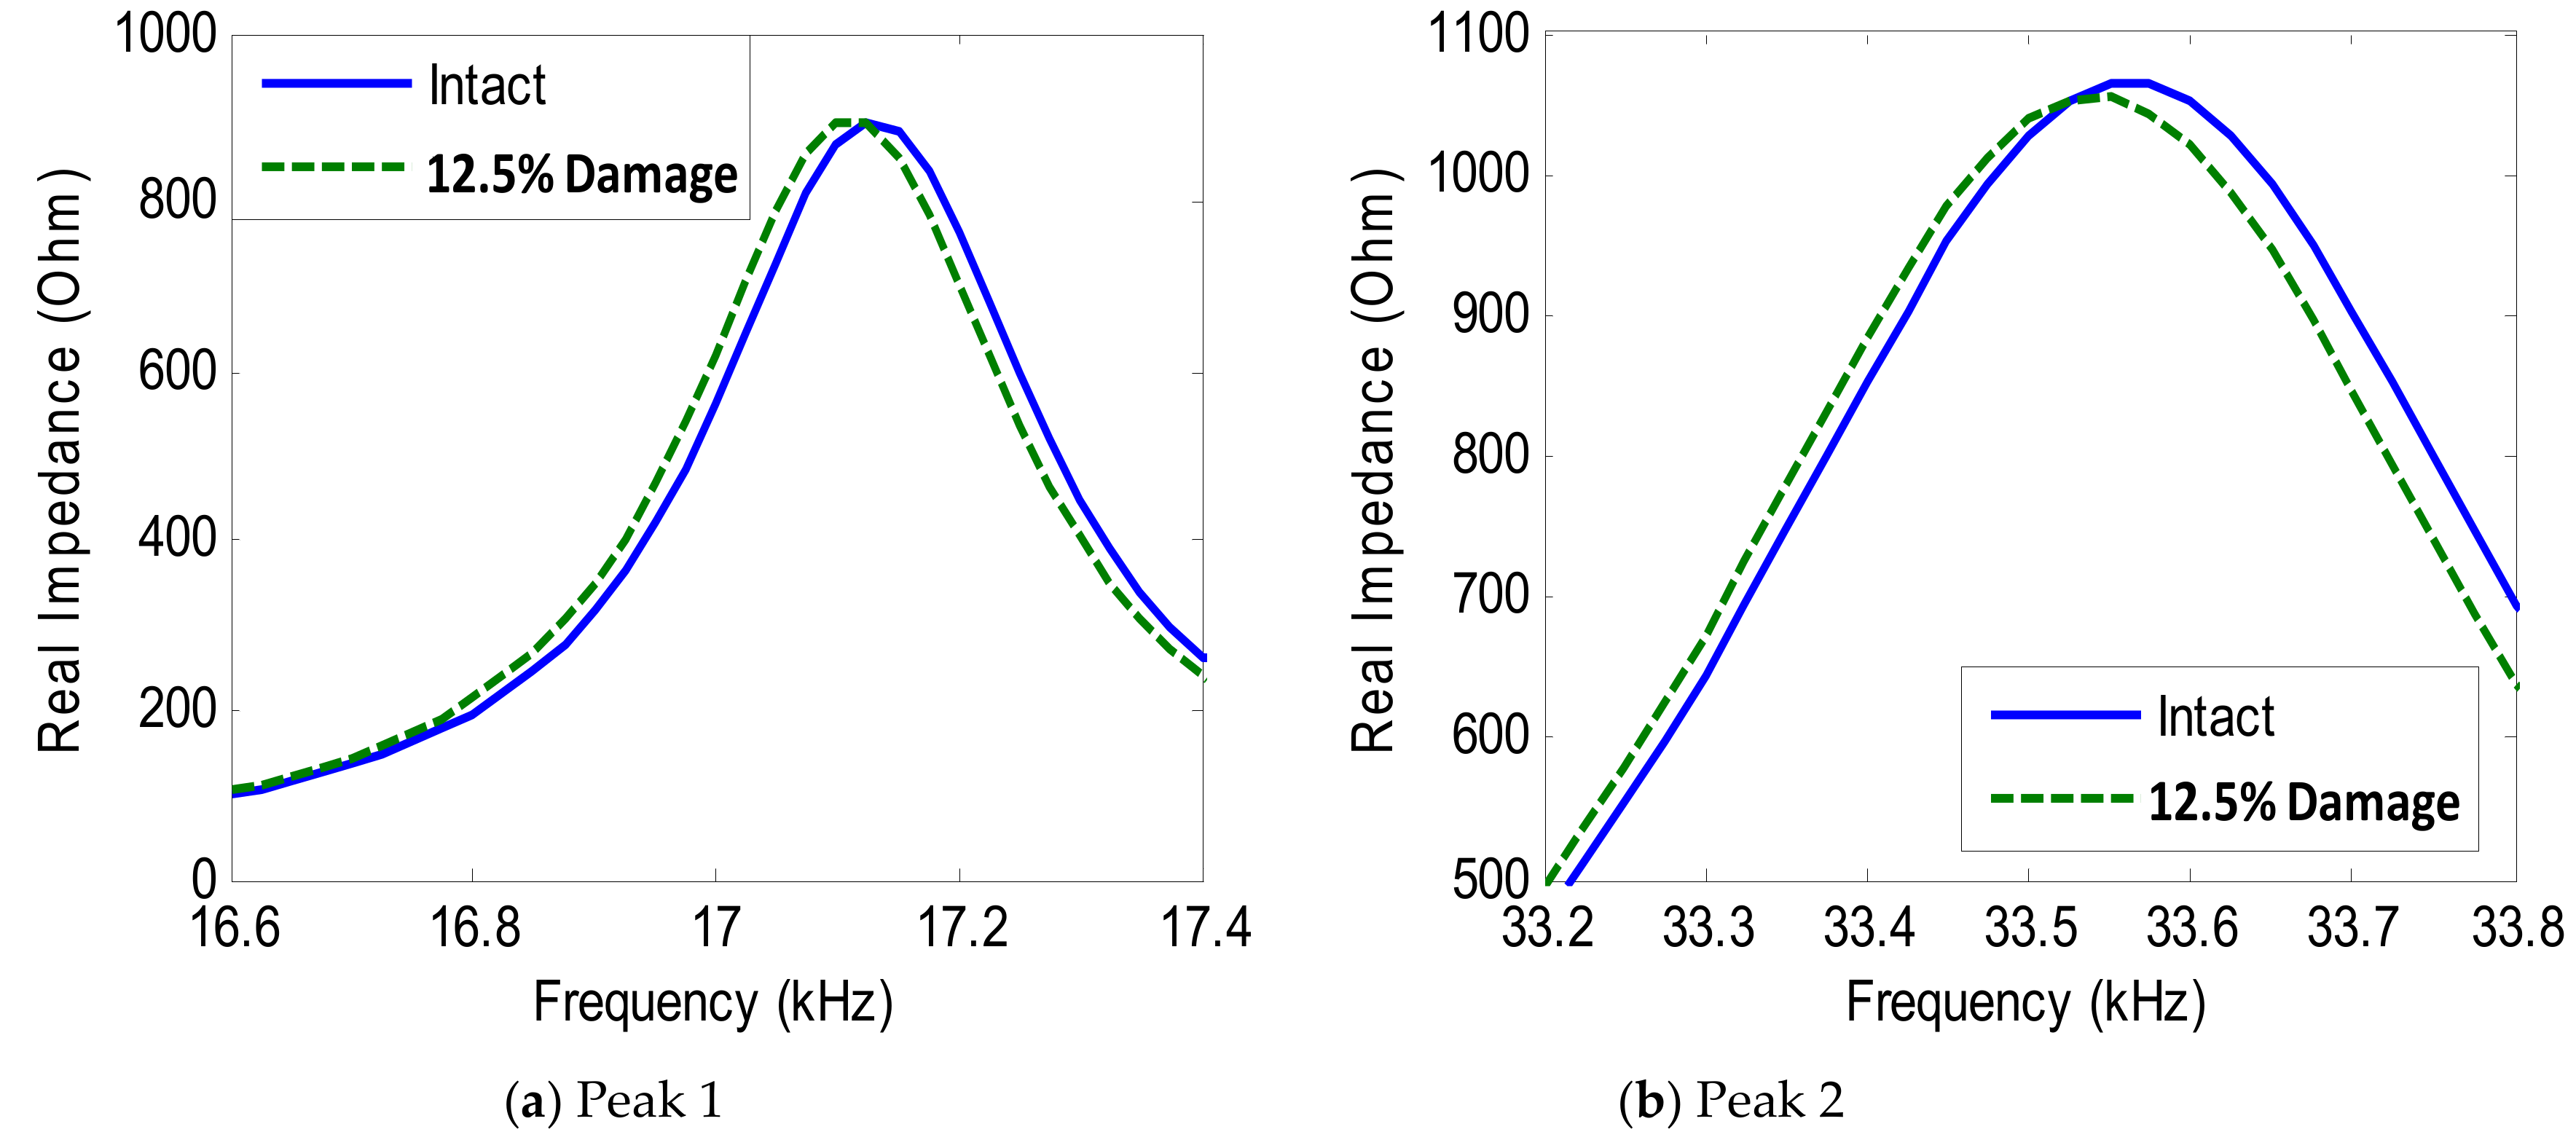
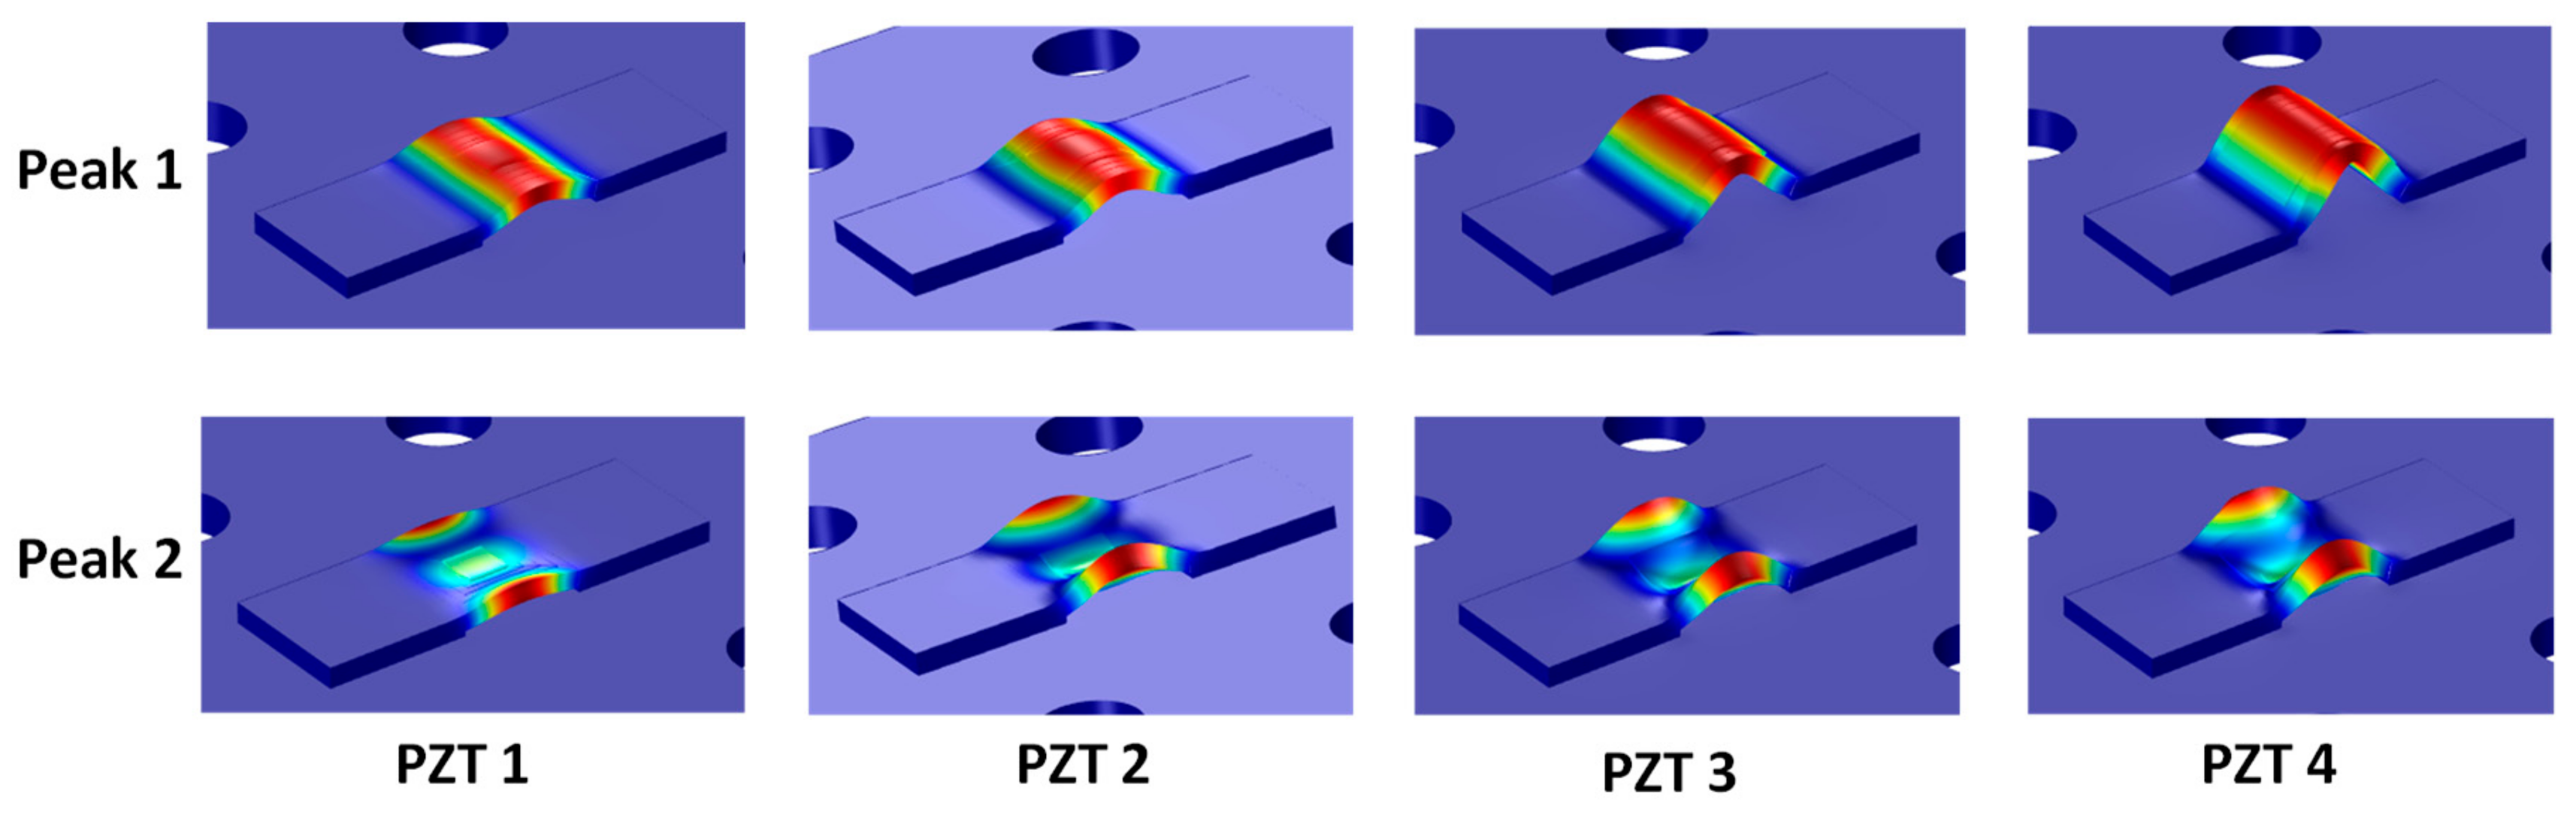
- When the size of the PZT was increased, the impedance pattern shifted down, and the resonant frequency of Peak 1 slightly decreased, while the resonant frequency of Peak 2 slightly increased. The PZT driving force on the interface increased, along with an increase in the PZT size, making the flexural motions of the two peaks became more distinct. This increased piezoelectric driving force would make stronger excitations to the PZT interface that could result in higher damage sensitivity of the PZT interface.
- (3)
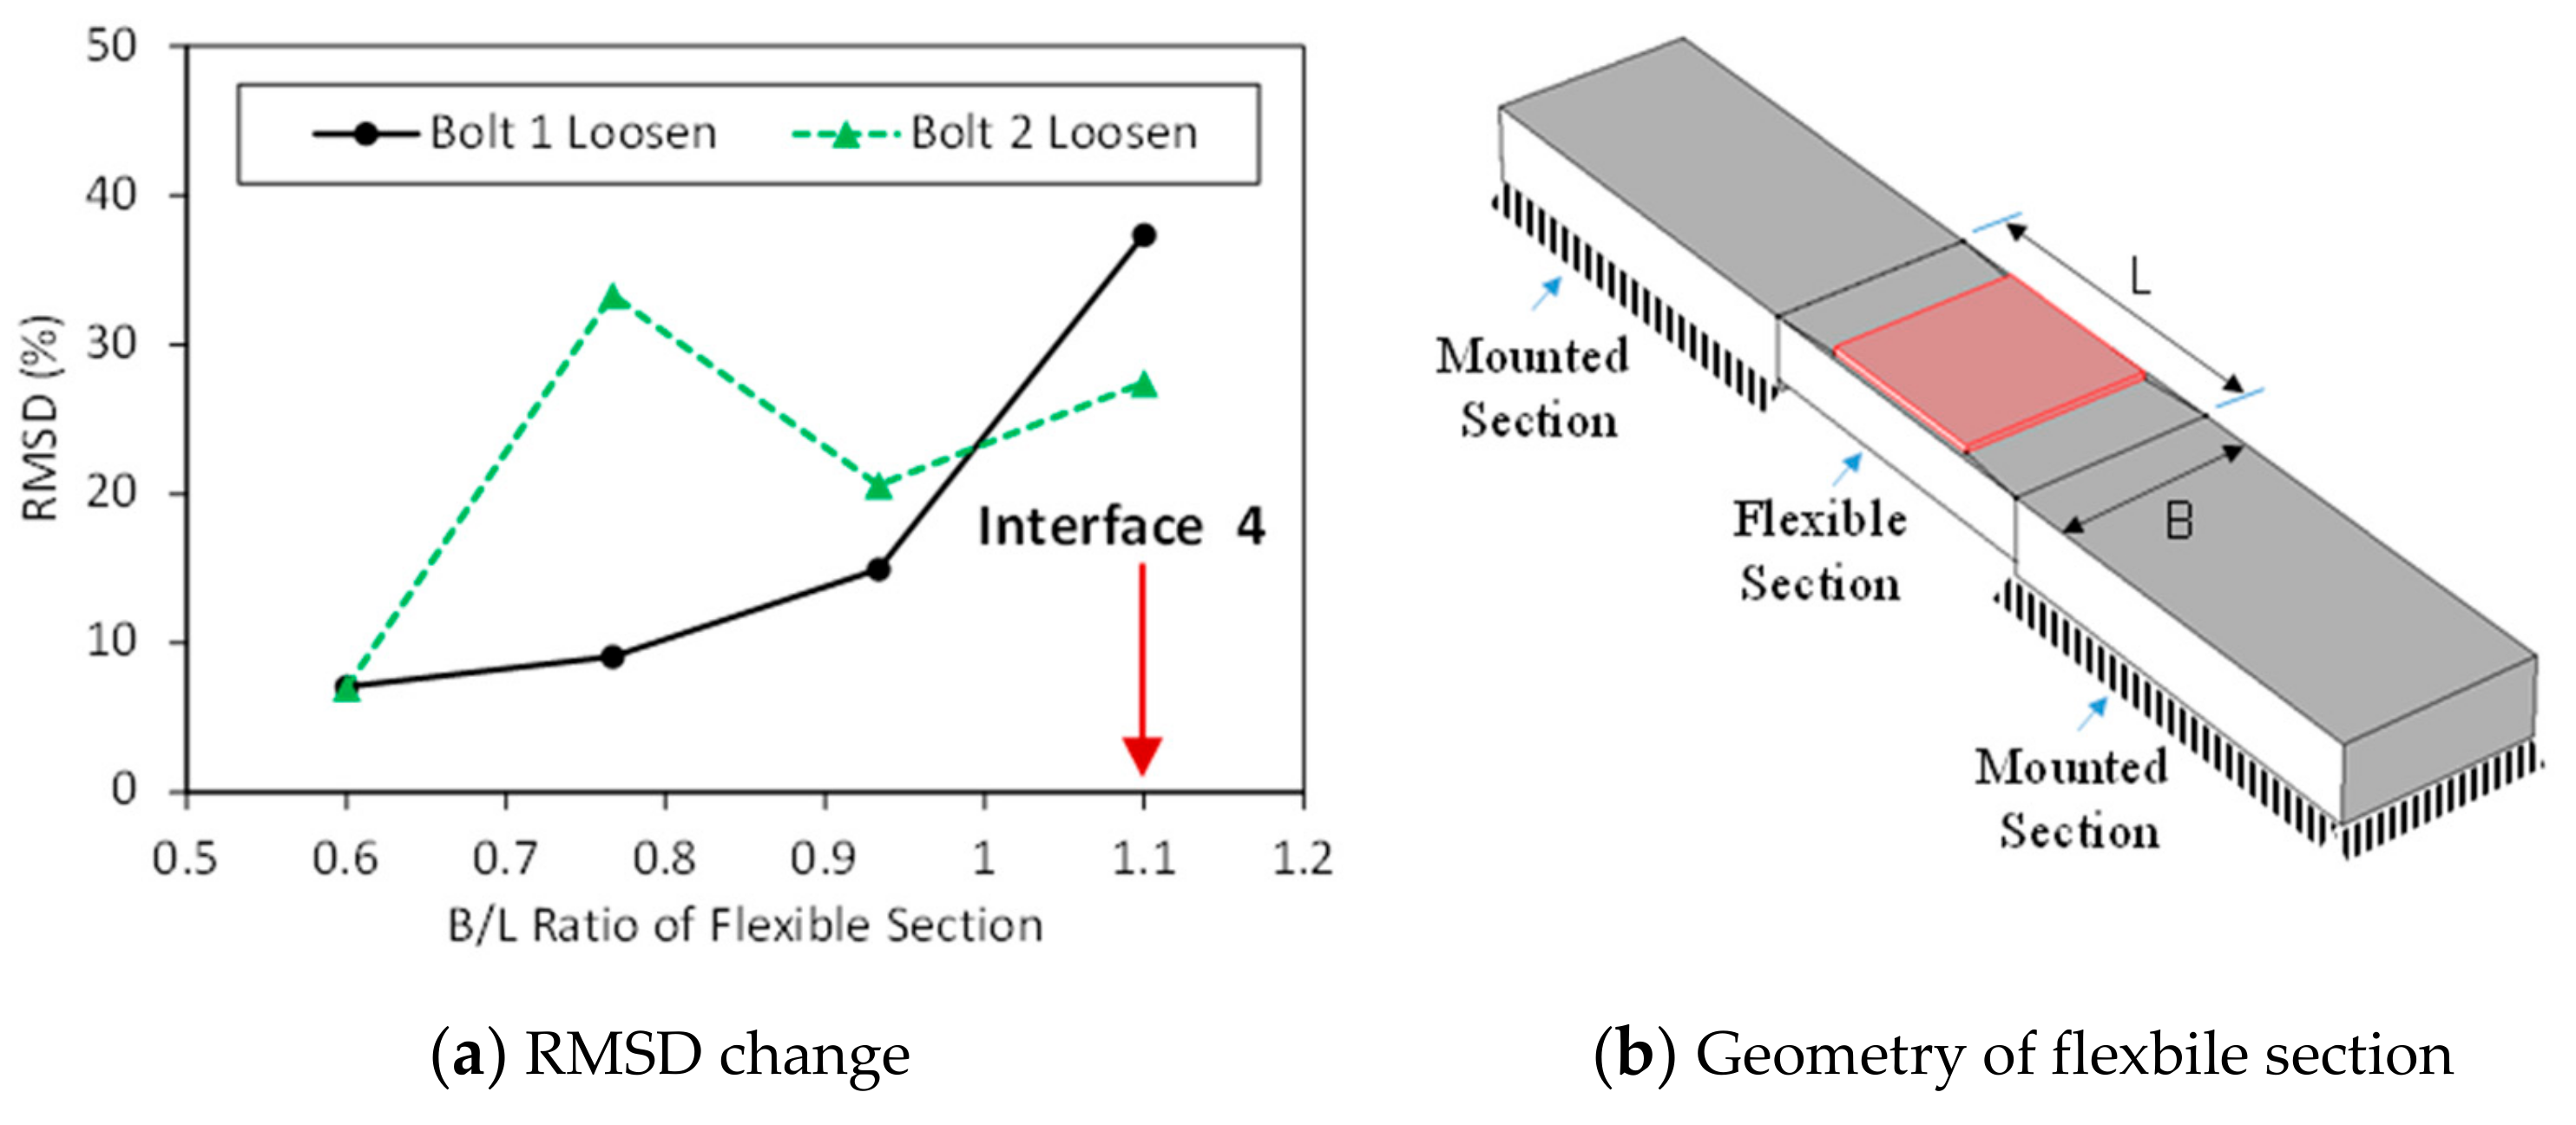
- To maximize its damage detection performance, the PZT interface should be designed to have the flexible section of a near-square shape, and the PZT patch covering 40% of the surface area of the flexible section.
Author Contributions
Funding
Conflicts of Interest
References
- Huda, F.; Kajiwara, I.; Hosoya, N.; Kawamura, S. Bolt loosening analysis and diagnosis by non-contact laser excitation vibration tests. Mech. Syst. Signal Process. 2013, 40, 589–604. [Google Scholar] [CrossRef]
- Huynh, T.-C.; Park, J.-H.; Jung, H.-J.; Kim, J.-T. Quasi-autonomous bolt-loosening detection method using vision-based deep learning and image processing. Autom. Constr. 2019, 105, 102844. [Google Scholar] [CrossRef]
- Park, J.-H.; Huynh, T.-C.; Choi, S.-H.; Kim, J.-T. Vision-based technique for bolt-loosening detection in wind turbine tower. Wind Struct. 2015, 21, 709–726. [Google Scholar] [CrossRef]
- Mita, A.; Fujimoto, A. Active detection of loosened bolts using ultrasonic waves and support vector machines. In Proceedings of the 5th International Workshop on Structural Health Monitoring, Stanford, CA, USA, 12–14 September 2005; pp. 1017–1024. [Google Scholar]
- Min, J.; Park, S.; Yun, C.-B.; Lee, C.-G.; Lee, C. Impedance-based structural health monitoring incorporating neural network technique for identification of damage type and severity. Eng. Struct. 2012, 39, 210–220. [Google Scholar] [CrossRef]
- Park, G.; Cudney, H.H.; Inman, D.J. Feasibility of using impedance-based damage assessment for pipeline structures. Earthq. Eng. Struct. Dyn. 2001, 30, 1463–1474. [Google Scholar] [CrossRef]
- Zhang, M.; Shen, Y.; Xiao, L.; Qu, W. Application of subharmonic resonance for the detection of bolted joint looseness. Nonlinear Dyn. 2017, 88, 1643–1653. [Google Scholar] [CrossRef]
- Shen, Y.; Giurgiutiu, V. Health monitoring of aerospace bolted lap joints using nonlinear ultrasonic spectroscopy: Theory and experiments. In Proceedings of the 9th International Workshop on Structural Health Monitoring, Stanford University, Stanford, CA, USA, 10–13 September 2013; p. 23332340. [Google Scholar]
- Park, G.; Sohn, H.; Farrar, C.R.; Inman, D.J. Overview of piezoelectric impedance-based health monitoring and path forward. Shock Vib. Dig. 2003, 35, 451–464. [Google Scholar] [CrossRef]
- Huynh, T.C.; Dang, N.L.; Kim, J.T. Advances and challenges in impedance-based structural health monitoring. Struct. Monit. Maint. 2017, 4, 301–329. [Google Scholar]
- Nguyen, T.-C.; Huynh, T.-C.; Yi, J.-H.; Kim, J.-T. Hybrid bolt-loosening detection in wind turbine tower structures by vibration and impedance responses. Wind Struct. 2017, 24, 385–403. [Google Scholar] [CrossRef]
- Venu Gopal Madhav, A.; Chee Kiong, S. Application of Electromechanical Impedance Technique for Engineering Structures: Review and Future Issues. J. Intell. Mater. Syst. Struct. 2009, 21, 41–59. [Google Scholar] [CrossRef]
- Yaowen, Y.; Yan, L.Y.; Kiong, S.C. Practical issues related to the application of the electromechanical impedance technique in the structural health monitoring of civil structures: II. Numerical verification. Smart Mater. Struct. 2008, 17, 035009. [Google Scholar]
- Na, W.; Baek, J. A review of the piezoelectric electromechanical impedance based structural health monitoring technique for engineering structures. Sensors 2018, 18, 1307. [Google Scholar] [CrossRef] [PubMed]
- Mascarenas, D.L.; Todd, M.D.; Park, G.; Farrar, C.R. Development of an impedance-based wireless sensor node for structural health monitoring. Smart Mater. Struct. 2007, 16, 2137. [Google Scholar] [CrossRef]
- Nguyen, K.-D.; Lee, S.-Y.; Lee, P.-Y.; Kim, J.-T. Wireless SHM for bolted connections via multiple PZT-interfaces and Imote2-platformed impedance sensor node. In Proceedings of the 6ANCRiSST, Dalian, China, 25–26 July 2011. [Google Scholar]
- Park, J.-H.; Huynh, T.-C.; Kim, J.-T. Temperature effect on wireless impedance monitoring in tendon anchorage of prestressed concrete girder. Smart Struct. Syst. 2015, 15, 1159–1175. [Google Scholar] [CrossRef]
- Perera, R.; Pérez, A.; García-Diéguez, M.; Zapico-Valle, J. Active Wireless System for Structural Health Monitoring Applications. Sensors 2017, 17, 2880. [Google Scholar] [CrossRef] [PubMed]
- Park, S.; Shin, H.-H.; Yun, C.-B. Wireless impedance sensor nodes for functions of structural damage identification and sensor self-diagnosis. Smart Mater. Struct. 2009, 18, 055001. [Google Scholar] [CrossRef]
- Overly, T.G.S.; Park, G.; Farinholt, K.M.; Farrar, C.R. Development of an extremely compact impedance-based wireless sensing device. Smart Mater. Struct. 2008, 17, 065011. [Google Scholar] [CrossRef]
- Annamdas, V.G.M.; Radhika, M.A.; Yang, Y. Easy installation method of piezoelectric (PZT) transducers for health monitoring of structures using electro-mechanical impedance technique. Proc. SPIE 2009, 7292, 729227. [Google Scholar]
- Ryu, J.-Y.; Huynh, T.-C.; Kim, J.-T. Tension Force Estimation in Axially Loaded Members Using Wearable Piezoelectric Interface Technique. Sensors 2018, 19, 47. [Google Scholar] [CrossRef]
- Na, S.; Lee, H.-K. Resonant frequency range utilized electro-mechanical impedance method for damage detection performance enhancement on composite structures. Compos. Struct. 2012, 94, 2383–2389. [Google Scholar] [CrossRef]
- Wang, C.; Wang, N.; Ho, S.-C.; Chen, X.; Pan, M.; Song, G. Design of a Novel Wearable Sensor Device for Real-Time Bolted Joints Health Monitoring. IEEE Internet Things J. 2018, 5, 5307–5316. [Google Scholar] [CrossRef]
- Huynh, T.-C.; Kim, J.-T. Impedance-Based Cable Force Monitoring in Tendon-Anchorage Using Portable PZT-Interface Technique. Math. Probl. Eng. 2014, 2014, 784731. [Google Scholar] [CrossRef]
- Huynh, T.-C.; Kim, J.-T. Quantitative damage identification in tendon anchorage via PZT interface-based impedance monitoring technique. Smart Struct. Syst. 2017, 20, 181–195. [Google Scholar]
- Huynh, T.-C.; Dang, N.-L.; Kim, J.-T. PCA-based filtering of temperature effect on impedance monitoring in prestressed tendon anchorage. Smart Struct. Syst. 2018, 22, 57–70. [Google Scholar]
- Huynh, T.-C.; Kim, J.-T. RBFN-based temperature compensation method for impedance monitoring in prestressed tendon anchorage. Struct. Control Health Monit. 2018, 25, e2173. [Google Scholar] [CrossRef]
- Huynh, T.C.; Dang, N.L.; Kim, J.T. Preload Monitoring in Bolted Connection Using Piezoelectric-Based Smart Interface. Sensors 2018, 18, 2766. [Google Scholar] [CrossRef]
- Ryu, J.-Y.; Huynh, T.-C.; Kim, J.-T. Experimental investigation of magnetic-mount PZT-interface for impedance-based damage detection in steel girder connection. Struct. Monit. Maint. 2017, 4, 237–253. [Google Scholar]
- Johnson, K.L. Contact Mechanics; Cambridge University Press: Cambridge, UK, 1985. [Google Scholar]
- Ritdumrongkul, S.; Abe, M.; Fujino, Y.; Miyashita, T. Quantitative health monitoring of bolted joints using a piezoceramic actuator–sensor. Smart Mater. Struct. 2004, 13, 20. [Google Scholar] [CrossRef]
- Liang, C.; Sun, F.P.; Rogers, C.A. Coupled Electro-Mechanical Analysis of Adaptive Material Systems—Determination of the Actuator Power Consumption and System Energy Transfer. J. Intell. Mater. Syst. Struct. 1994, 5, 12–20. [Google Scholar] [CrossRef]
- Sun, F.P.; Chaudhry, Z.; Liang, C.; Rogers, C. Truss structure integrity identification using PZT sensor-actuator. J. Intell. Mater. Syst. Struct. 1995, 6, 134–139. [Google Scholar] [CrossRef]
- Huynh, T.-C.; Kim, J.-T. Quantification of temperature effect on impedance monitoring via PZT interface for prestressed tendon anchorage. Smart Mater. Struct. 2017, 26, 125004. [Google Scholar] [CrossRef]
- Bhalla, S.; Soh, C.K. Electromechanical Impedance Modeling for Adhesively Bonded Piezo-Transducers. J. Intell. Mater. Syst. Struct. 2016, 15, 955–972. [Google Scholar] [CrossRef]
- Islam, M.M.; Huang, H. Understanding the effects of adhesive layer on the electromechanical impedance (EMI) of bonded piezoelectric wafer transducer. Smart Mater. Struct. 2014, 23, 125037. [Google Scholar] [CrossRef]
- Bhalla, S.; Moharana, S. A refined shear lag model for adhesively bonded piezo-impedance transducers. J. Intell. Mater. Syst. Struct. 2012, 24, 33–48. [Google Scholar] [CrossRef]
- BoltScience. Available online: http://www.boltscience.com/pages/vibloose.htm (accessed on 30 July 2019).
- Huynh, T.-C.; Park, Y.-H.; Park, J.-H.; Kim, J.-T. Feasibility Verification of Mountable PZT-Interface for Impedance Monitoring in Tendon-Anchorage. Shock Vib. 2015, 2015, 11. [Google Scholar] [CrossRef]
- Uddin, M.N.; Islam, M.S.; Sampe, J.; Ali, S.H.M.; Bhuyan, M.S. Design and simulation of piezoelectric cantilever beam based on mechanical vibration for energy harvesting application. In Proceedings of the 2016 International Conference on Innovations in Science, Engineering and Technology (ICISET), Chittagong, Bangladesh, 28–29 October 2016; pp. 1–4. [Google Scholar]
- Dang, N.-L.; Huynh, T.-C.; Kim, J.-T. Local Strand-Breakage Detection in Multi-Strand Anchorage System Using an Impedance-Based Stress Monitoring Method—Feasibility Study. Sensors 2019, 19, 1054. [Google Scholar] [CrossRef] [PubMed]
- Mansoor, M.B.; Köble, S.; Wong, T.W.; Woias, P.; Goldschmidtböing, F. Design, Characterization and Sensitivity Analysis of a Piezoelectric Ceramic/Metal Composite Transducer. Micromachines 2017, 8, 271. [Google Scholar] [CrossRef]


| Case 1: Different Interfaces with Same PZT | Case 2: Different PZTs on the Same Interface | ||||
|---|---|---|---|---|---|
| Parameters | a | B | Parameters | a | B |
| Interface 1 | 15 mm | 18 mm | PZT 1 | 10 mm | 33 mm |
| Interface 2 | 15 mm | 23 mm | PZT 2 | 15 mm | 33 mm |
| Interface 3 | 15 mm | 28 mm | PZT 3 | 20 mm | 33 mm |
| Interface 4 | 15 mm | 33 mm | PZT 4 | 25 mm | 33 mm |
| Loosened Bolt | Description of Bolt Torque Level (Nm) |
|---|---|
| Bolt 1 | Bolt 1: 160 → 110 (−31%) → 60 (−62%) → 0 (−100%); all others: 160 |
| Bolt 2 | Bolt 2: 160 → 110 (−31%) → 60 (−62%) → 0 (−100%); all others: 160 |
| Parameters | PZT Interface | Connection Splice | Adhesive Layer |
|---|---|---|---|
| Young’s modulus, E (GPa) | 70 | 200 | 6 |
| Poisson’s ratio, υ | 0.33 | 0.3 | 0.38 |
| Mass density, ρ (kg/m3) | 2700 | 7850 | 1700 |
| Damping loss factor, η | 0.02 | 0.02 | 0.02 |
© 2019 by the authors. Licensee MDPI, Basel, Switzerland. This article is an open access article distributed under the terms and conditions of the Creative Commons Attribution (CC BY) license (http://creativecommons.org/licenses/by/4.0/).
Share and Cite
Huynh, T.-C.; Ho, D.-D.; Dang, N.-L.; Kim, J.-T. Sensitivity of Piezoelectric-Based Smart Interfaces to Structural Damage in Bolted Connections. Sensors 2019, 19, 3670. https://doi.org/10.3390/s19173670
Huynh T-C, Ho D-D, Dang N-L, Kim J-T. Sensitivity of Piezoelectric-Based Smart Interfaces to Structural Damage in Bolted Connections. Sensors. 2019; 19(17):3670. https://doi.org/10.3390/s19173670
Chicago/Turabian StyleHuynh, Thanh-Canh, Duc-Duy Ho, Ngoc-Loi Dang, and Jeong-Tae Kim. 2019. "Sensitivity of Piezoelectric-Based Smart Interfaces to Structural Damage in Bolted Connections" Sensors 19, no. 17: 3670. https://doi.org/10.3390/s19173670
APA StyleHuynh, T.-C., Ho, D.-D., Dang, N.-L., & Kim, J.-T. (2019). Sensitivity of Piezoelectric-Based Smart Interfaces to Structural Damage in Bolted Connections. Sensors, 19(17), 3670. https://doi.org/10.3390/s19173670