Detecting the Presence of Different Types of Oil in Seawater Using a Fluorometric Index


Abstract
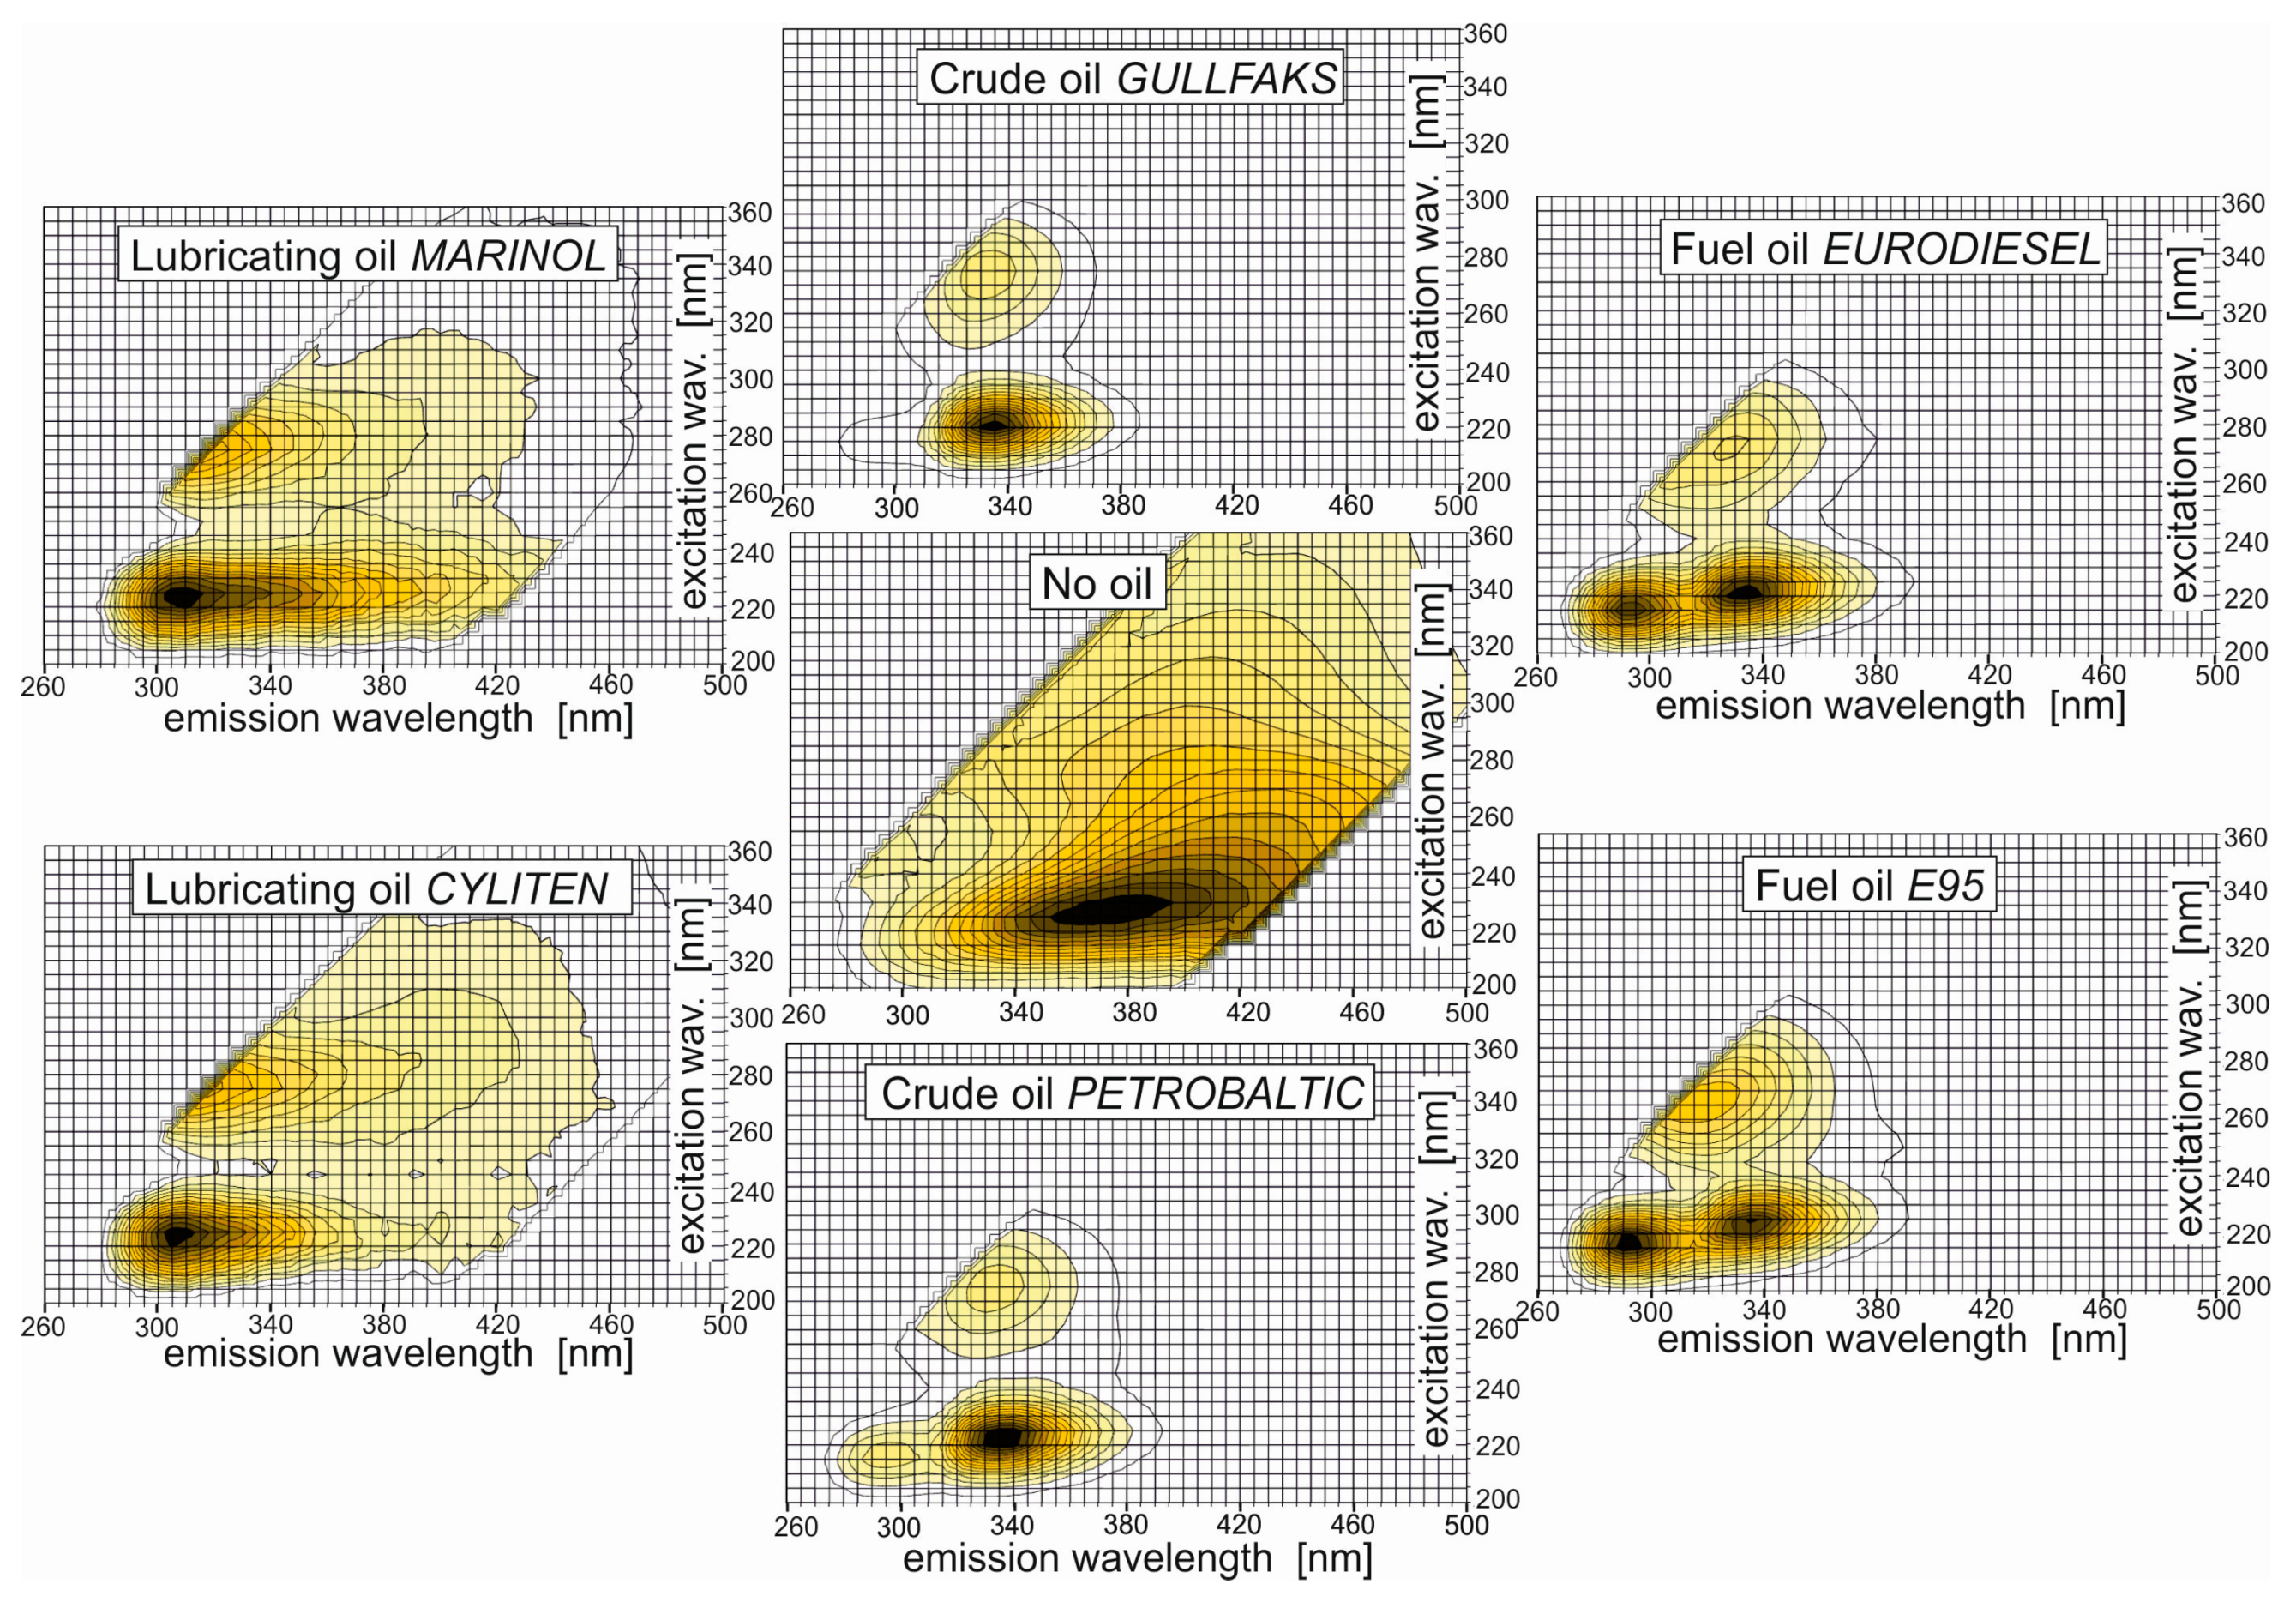
:1. Introduction
2. Materials and Methods
2.1. Materials
2.1.1. Seawater Samples
2.1.2. Oil Samples
2.2. Methods
2.2.1. Exposure of Seawater Samples to Oil
2.2.2. Measurement and Apparatus
Instrument
Measurement Parameters
2.2.3. Measurement of Seawater and Oil-Contaminated Seawater Samples
- The EEMs for samples of environment seawater were previously measured three times, allowing for a reliable, artefact-free background to be obtained.
- Next, the EEMs of seawater exposed to each kind of oil for various ro/w were measured.
- Measurements for all samples were performed at a stabilized temperature of 20 °C.
- Rayleigh scattering to yield a digital matrix of EEMs was removed (if the excitation wavelength and emission wavelengths were equal and the emission wavelength was two times higher than the excitation wavelength).
3. Results and Discussion
3.1. Fluorometric Index (FI) Calculations
3.2. Statistical Analysis of the Fluorometric Index
4. Conclusions
Author Contributions
Acknowledgments
Conflicts of Interest
References
- IMO. The International Convention for the Prevention of Pollution from Ships (MARPOL), 1973 as Modified by the Protocol of 1978. Available online: http://www.imo.org/en/About/conventions/listofconventions/pages/international-convention-for-the-prevention-of-pollution-from-ships-(marpol).aspx (accessed on 1 July 2019).
- Wang, Z. Oil Fingerprinting and Spill Source Identification; Davidson, W.F., Lee, K., Cogswell, A., Eds.; Oil Spill Response: A Global Perspective; NATO Science for Peace and Security Series C: Environmental Security; Springer: Dordrecht, The Netherlands, 2008. [Google Scholar]
- Fingas, M. The Basics of oil Spill Cleanup, 3rd ed.; CRC Press: Boca Raton, FL, USA, 2012. [Google Scholar]
- Fingas, M. Oil Spill Science and Technology, 2nd ed.; Gulf Professional Publishing: Houston, TX, USA, 2016. [Google Scholar]
- Fingas, M. Marine Oil Spills 2018. J. Mar. Sci. Eng. 2019, 7, 82. [Google Scholar] [CrossRef]
- Migliacci, M.; Gambardella, A.; Tranfaglia, M. SAR Polarimetry. To Observe Oil Spills. IEEE Trans. Geosci. Remote Sens. 2007, 43, 506–511. [Google Scholar] [CrossRef]
- Robbe, N.; Zielinski, O. Airborne remote sensing of oil spills-analysis and fusion of multi-spectral near-range data. J. Mar. Sci. Environ. 2004, 2, 19–27. [Google Scholar]
- Hu, C.; Feng, L.; Holmes, J.; Swayze, G.A.; Leifer, I.; Melton, C.; Garcia, O.; Macdonald, I.; Hess, M.; Muller-Karger, F.; et al. Remote sensing estimation of surface oil volume during the 2010 Deepwater Horizon oil blowout in the Gulf of Mexico: Scaling up AVIRIS observations with MODIS measurements. J. Appl. Remote Sens. 2018, 12, 026008. [Google Scholar] [CrossRef]
- Leifer, I.; Lehr, W.J.; Beatty, D.S.; Bradley, E.; Clark, R.; Dennison, P.; Hu, Y.; Matheson, S.; Jones, C.E.; Holt, B.; et al. State of the art satellite and airborne marine oil spill remote sensing: Application to the BP Deepwater Horizon oil spill. Remote Sens. Environ. 2012, 124, 185–209. [Google Scholar] [CrossRef] [Green Version]
- Downare, T.D.; Mullinst, O.C. Visible and Near-Infrared Fluorescence of Crude Oils. Appl. Spectrosc. 1995, 49, 754–776. [Google Scholar] [CrossRef]
- Wang, Z.; Stout, S. Oil Spill Environmental Forensics: Fingerprinting and Source Identification, 2nd ed.; Academic Press, Elsevier: London, UK, 2016. [Google Scholar]
- Skou, N.; Sorensen, B.; Poulson, A. A New Airborne Dual Frequency Microwave Radiometer for Mapping and Quantifying Mineral Oil on the Sea Surface. In Proceedings of the Second Thematic Conference on Remote Sensing for Marine and Coastal Environments, ERIM Conferences, Ann Arbor, MI, USA, 9–12 May 1994; pp. II559–II565. [Google Scholar]
- Sun, S.; Hu, C.; Feng, L.; Swayze, G.A.; Holmes, J.; Graettinger, G.; MacDonald, I.; Garcia, O.; Leifer, I. Oil slick morphology derived from AVRIS measurements of the Deepwater Horizon oil spill: Implications for spatial resolution requirements of remote sensors. Mar. Pollut. Bull. 2016, 103, 276–285. [Google Scholar] [CrossRef] [PubMed]
- Garcia-Pineda, O.; MacDonald, I.; Hu, C.; Svejkovsky, J.; Hess, M.; Dukhovskoy, D.; Morey, S.L. Detection of floating oil anomalies from the Deepwater Horizon oil spill with synthetic aperture radar. Oceanography 2013, 26, 124–137. [Google Scholar] [CrossRef]
- Zielinski, O.; Busch, J.A.; Cembella, A.D.; Daly, K.L.; Engelbrektsson, J.; Hannides, A.K.; Schmidt, H. Detecting marine hazardous substances and organisms: Sensors for pollutants, toxins and pathogens. Ocean Sci. 2009, 5, 329–349. [Google Scholar] [CrossRef]
- Patra, D.; Mishra, A.K. Total synchronous fluorescence scan spectra of petroleum products. Anal. Bioanal. Chem. 2002, 373, 304–309. [Google Scholar] [CrossRef] [PubMed]
- Poryvkina, L.; Babichenko, S.; Davydova, O. SFS characterisation of oil pollution in natural water. In Proceedings of the 5th International Conference on Remote Sensing for Marine and Coastal Environments, San Diego, CA, USA, 5–7 October 1998; Volume 2, pp. 520–524. [Google Scholar]
- Baszanowska, E.; Otremba, Z. Modification of optical properties of seawater exposed to oil contaminants based on excitation-emission spectra. J. Eur. Opt. Soc. Rap. Public 2015, 10, 10047. Available online: http://www.jeos.org/index.php/jeos_rp/article/view/15047 (accessed on 30 June 2019). [CrossRef]
- Zhou, Z.; Guo, L.; Shiller, A.M.; Lohrenz, S.E.; Asper, V.L.; Osburn, C.L. Characterization of oil components from the Deepwater Horizon oil spill in the Gulf of Mexico using fluorescence EEM and PARAFAC techniques. Mar. Chem. 2013, 148, 10–21. [Google Scholar] [CrossRef]
- Zhou, Z.; Liu, Z.; Guo, L. Chemical evolution of Macondo crude oil during laboratory degradation as characterized by fluorescence EEMs and hydrocarbon composition. Mar. Pollut. Bull. 2013, 66, 164–175. [Google Scholar] [CrossRef] [PubMed]
- Conmy, R.N.; Coble, P.G.; Farr, J.; Wood, A.M.; Lee, K.; Pegau, W.S.; Walsh, I.D.; Koch, C.R.; Abercrombie, M.I.; Miles, M.S.; et al. Submersible Optical Sensors Exposed to Chemically Dispersed Crude Oil: Wave Tank Simulations for Improved Oil Spill Monitoring. Environ. Sci. Technol. 2014, 48, 1803–1810. [Google Scholar] [CrossRef] [PubMed]
- Tedetti, M.; Guigue, C.; Goutx, M. Utilization of a submersible UV fluorometer for monitoring anthropogenic inputs in the Mediterranean coastal waters. Mar. Pollut. Bull. 2010, 60, 350–362. [Google Scholar] [CrossRef] [PubMed]
- Hou, Y.; Li, Y.; Liu, B.; Liu, Y.; Wang, T. Design and Implementation of a Coastal-Mounted Sensor for Oil Film Detection on Seawater. Sensors 2017, 18, 70. [Google Scholar] [CrossRef] [PubMed]
- Baszanowska, E.; Otremba, Z. Fluorometric index for sensing oil in the sea environment. Sensors 2017, 17, 1276. [Google Scholar] [CrossRef] [PubMed]
- Wakeman, S.G. Synchronous fluorescence spectroscopy and its application to indigenous and petroleum-derived hydrocarbons in lacustrine sediments. Environ. Sci. Technol. 1997, 11, 272–276. [Google Scholar]
- Mendoza, W.G.; Riemer, D.D.; Zika, R.G. Application of fluorescence and PARAFAC to assess vertical distribution of subsurface hydrocarbons and dispersant during the Deepwater Horizon oil spill. Environ. Sci. 2013, 15, 1017–1030. [Google Scholar] [CrossRef] [PubMed]
- Zhou, Z.; Guo, L.; Osburn, C.L. Fluorescence EEMs and PARAFAC Techniques in the Analysis of Petroleum Components in the Water Column. In Hydrocarbon and Lipid Microbiology Protocols; McGenity, T., Timmis, K., Nogales, B., Eds.; Springer Protocols Handbooks, Springer: Berlin/Heidelberg, Germany, 2015. [Google Scholar]
- Bugden, J.B.C.; Yeung, C.W.; Kepkay, P.E.; Lee, K. Application of ultraviolet fluorometry and excitation–emission matrix spectroscopy (EEMs) to fingerprint oil and chemically dispersed oil in seawater. Mar. Pollut. Bull. 2008, 56, 677–685. Available online: http://www.ncbi.nlm.nih.gov/pubmed/18304589 (accessed on 30 June 2019). [CrossRef] [PubMed]


| Exmax (nm) ± 5 (nm)/Emmax (nm) ± 5 (nm) | ||||
|---|---|---|---|---|
| Petrobaltic | Peak 1 | Peak 2 | Peak 3 | Peak 4 |
| 0.5 × 10⁻⁶ | 225/330 | 220/310 | 255/360 | 270/320 |
| 5 × 10⁻⁶ | 225/340 | 255/360 | 270/325 | |
| 50 × 10−6 | 225/340 | 220/295 | 275/335 | |
| 500 × 10−6 | 225/340 | 220/295 | 275/335 | |
| Flotta | ||||
| 0.5 × 10⁻⁶ | 225/340 | 250/360 | 275/325 | |
| 5 × 10⁻⁶ | 225/340 | 250/360 | 275/330 | |
| 50 × 10−6 | 220/335 | 275/335 | ||
| 500 × 10−6 | 220/335 | 275/335 | ||
| Gullfaks | ||||
| 0.5 × 10⁻⁶ | 225/335 | 255/360 | 275/320 | |
| 5 × 10⁻⁶ | 225/340 | 275/330 | ||
| 50 × 10−6 | 220/335 | 275/335 | ||
| 500×10−6 | 220/335 | 275/335 | ||
| Eurodiesel | ||||
| 0.5 × 10⁻⁶ | 225/335 | 225/310 | 275/320 | |
| 5 × 10⁻⁶ | 225/340 | 225/310 | 275/335 | |
| 50 × 10−6 | 220/335 | 220/295 | 275/330 | |
| 500 × 10−6 | 220/335 | 215/290 | 275/335 | |
| E95 | ||||
| 0.5 × 10⁻⁶ | 225/335 | 220/310 | 275/325 | |
| 5 × 10⁻⁶ | 225/335 | 225/310 | 275/325 | |
| 50 × 10−6 | 225/335 | 220/295 | 270/320 | |
| 500 × 10−6 | 215/290 | 260/310 | ||
| Marinol | ||||
| 0.5 × 10⁻⁶ | 225/335 | 275/320 | ||
| 5 × 10⁻⁶ | 225/335 | 275/320 | ||
| 50 × 10−6 | 225/340 | 225/310 | 275/320 | |
| 500 × 10−6 | 225/305 | 275/320 | ||
| Cyliten | ||||
| 0.5 × 10⁻⁶ | 225/340 | 225/305 | 275/320 | |
| 5 × 10⁻⁶ | 225/305 | 275/320 | ||
| 50 × 10−6 | 225/305 | 275/320 | ||
| 500 × 10−6 | 225/340 | 225/305 | 275/320 | |
| FIw/o (-) | ||
|---|---|---|
| 15 March 2019 | 15 April 2019 | 20 May 2019 |
| 0.85 | 0.88 | 0.85 |
| ro/w | FIo/w (-) | ||||||
|---|---|---|---|---|---|---|---|
| Petrobaltic | Flotta | Gullfaks | Eurodiesel | E95 | Marinol 1240 | Cyliten N-460 | |
| 0.5 × 10⁻⁶ | 1.22 | 1.33 | 1.42 | 1.44 | 1.48 | 1.18 | 1.09 |
| 5 × 10⁻⁶ | 1.36 | 1.36 | 1.52 | 1.51 | 1.21 | 1.17 | 1.58 |
| 50 × 10−6 | 1.63 | 1.60 | 1.72 | 1.68 | 1.64 | 1.17 | 1.62 |
| 500 × 10−6 | 1.62 | 1.67 | 1.79 | 1.64 | 1.93 | 1.53 | 1.05 |
| ro/w | FIo/w (-) | ||||||
|---|---|---|---|---|---|---|---|
| Petrobaltic | Flotta | Gullfaks | Eurodiesel | E95 | Marinol 1240 | Cyliten N-460 | |
| 0.5 × 10⁻⁶ | 1.28 | 1.20 | 1.33 | 1.17 | 1.33 | 1.44 | 1.14 |
| 5 × 10⁻⁶ | 1.38 | 1.33 | 1.39 | 1.44 | 1.22 | 1.22 | 1.15 |
| 50 × 10−6 | 1.60 | 1.62 | 1.71 | 1.69 | 1.61 | 1.21 | 1.06 |
| 500 × 10−6 | 1.60 | 1.65 | 1.77 | 1.58 | 1.97 | 1.27 | 0.8 |
| ro/w | FIo/w (-) | ||||||
|---|---|---|---|---|---|---|---|
| Petrobaltic | Flotta | Gullfaks | Eurodiesel | E95 | Marinol 1240 | Cyliten N-460 | |
| 0.5 × 10⁻⁶ | 1.21 | 1.27 | 1.34 | 1.54 | 1.07 | 1.06 | 1.18 |
| 5 × 10⁻⁶ | 1.29 | 1.34 | 1.46 | 1.41 | 1.20 | 1.68 | 1.37 |
| 50 × 10−6 | 1.65 | 1.67 | 1.75 | 1.62 | 1.65 | 1.44 | 2.04 |
| 500 × 10−6 | 1.59 | 1.65 | 1.77 | 1.55 | 1.89 | 1.79 | 1.04 |
© 2019 by the authors. Licensee MDPI, Basel, Switzerland. This article is an open access article distributed under the terms and conditions of the Creative Commons Attribution (CC BY) license (http://creativecommons.org/licenses/by/4.0/).
Share and Cite
Baszanowska, E.; Otremba, Z. Detecting the Presence of Different Types of Oil in Seawater Using a Fluorometric Index. Sensors 2019, 19, 3774. https://doi.org/10.3390/s19173774
Baszanowska E, Otremba Z. Detecting the Presence of Different Types of Oil in Seawater Using a Fluorometric Index. Sensors. 2019; 19(17):3774. https://doi.org/10.3390/s19173774
Chicago/Turabian StyleBaszanowska, Emilia, and Zbigniew Otremba. 2019. "Detecting the Presence of Different Types of Oil in Seawater Using a Fluorometric Index" Sensors 19, no. 17: 3774. https://doi.org/10.3390/s19173774