Portable System for Box Volume Measurement Based on Line-Structured Light Vision and Deep Learning


Abstract
:1. Introduction
- Visual sensor. A portable mechanical structure for box volume measurement is proposed with an accuracy of ±5.0 mm and measuring range of 10–1800 mm (Section 2 and Section 3.1).
- Box volume measurement algorithm. A novel algorithm for calculating the box volume in a completely automatic manner online is presented (Section 3.2).
- Calibration. A novel calibration method for the automatic calibration of our system is proposed. This method performs camera and laser projector calibrations in a single step, thus avoiding the digitalization of a reference sphere to obtain extrinsic parameters (Section 3.3).
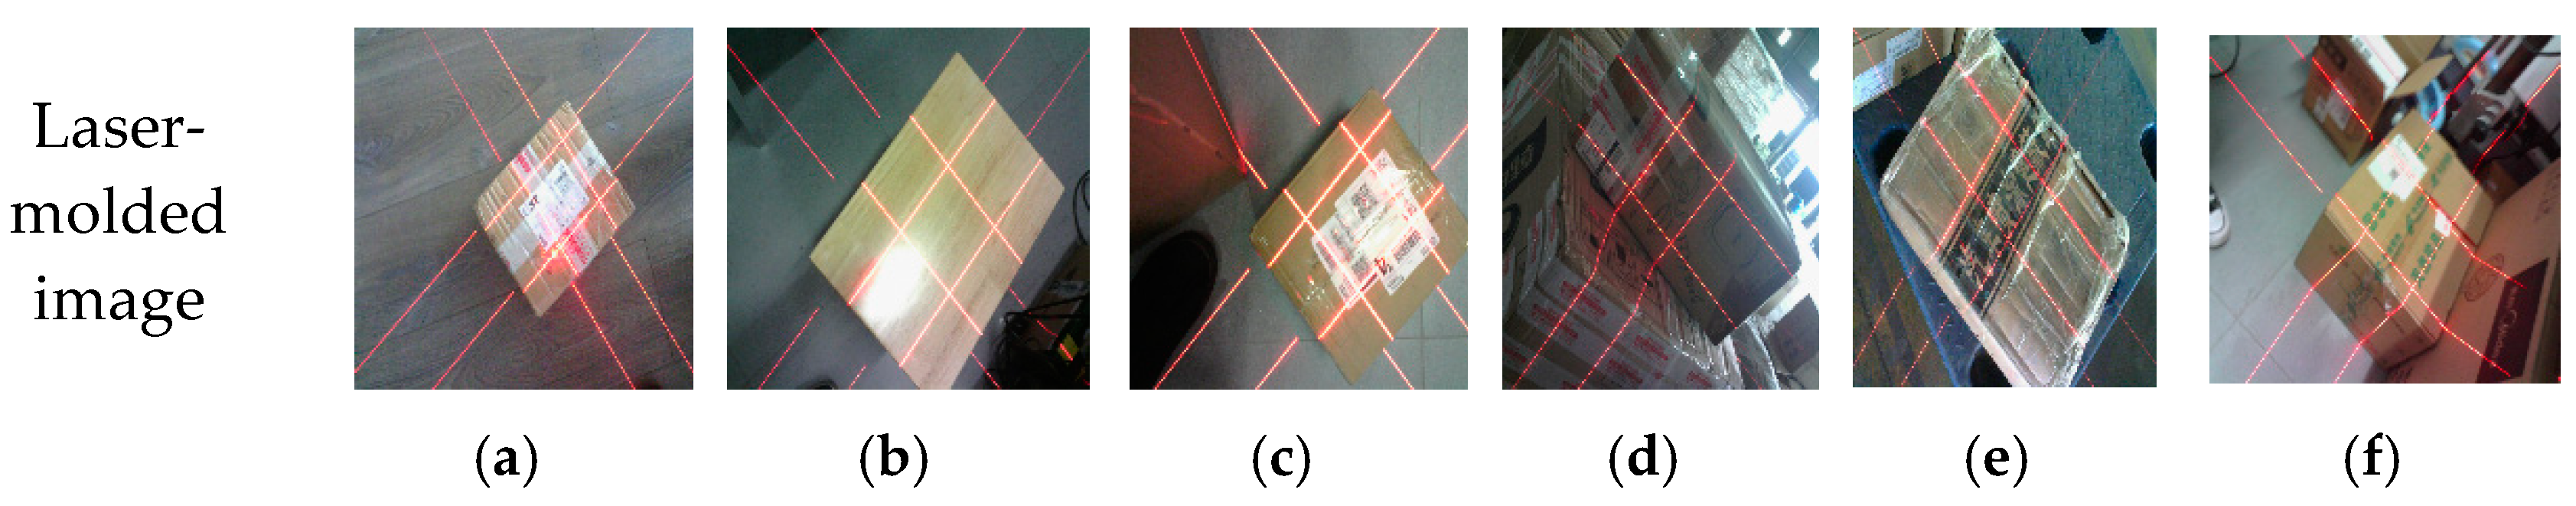
- Edge detection. A total of 40,000 labeled laser-modulated images are collected. With this box edge detection database, a novel end-to-end deep learning architecture that is based on IHED is proposed and it has achieved excellent performance (Section 3.4).
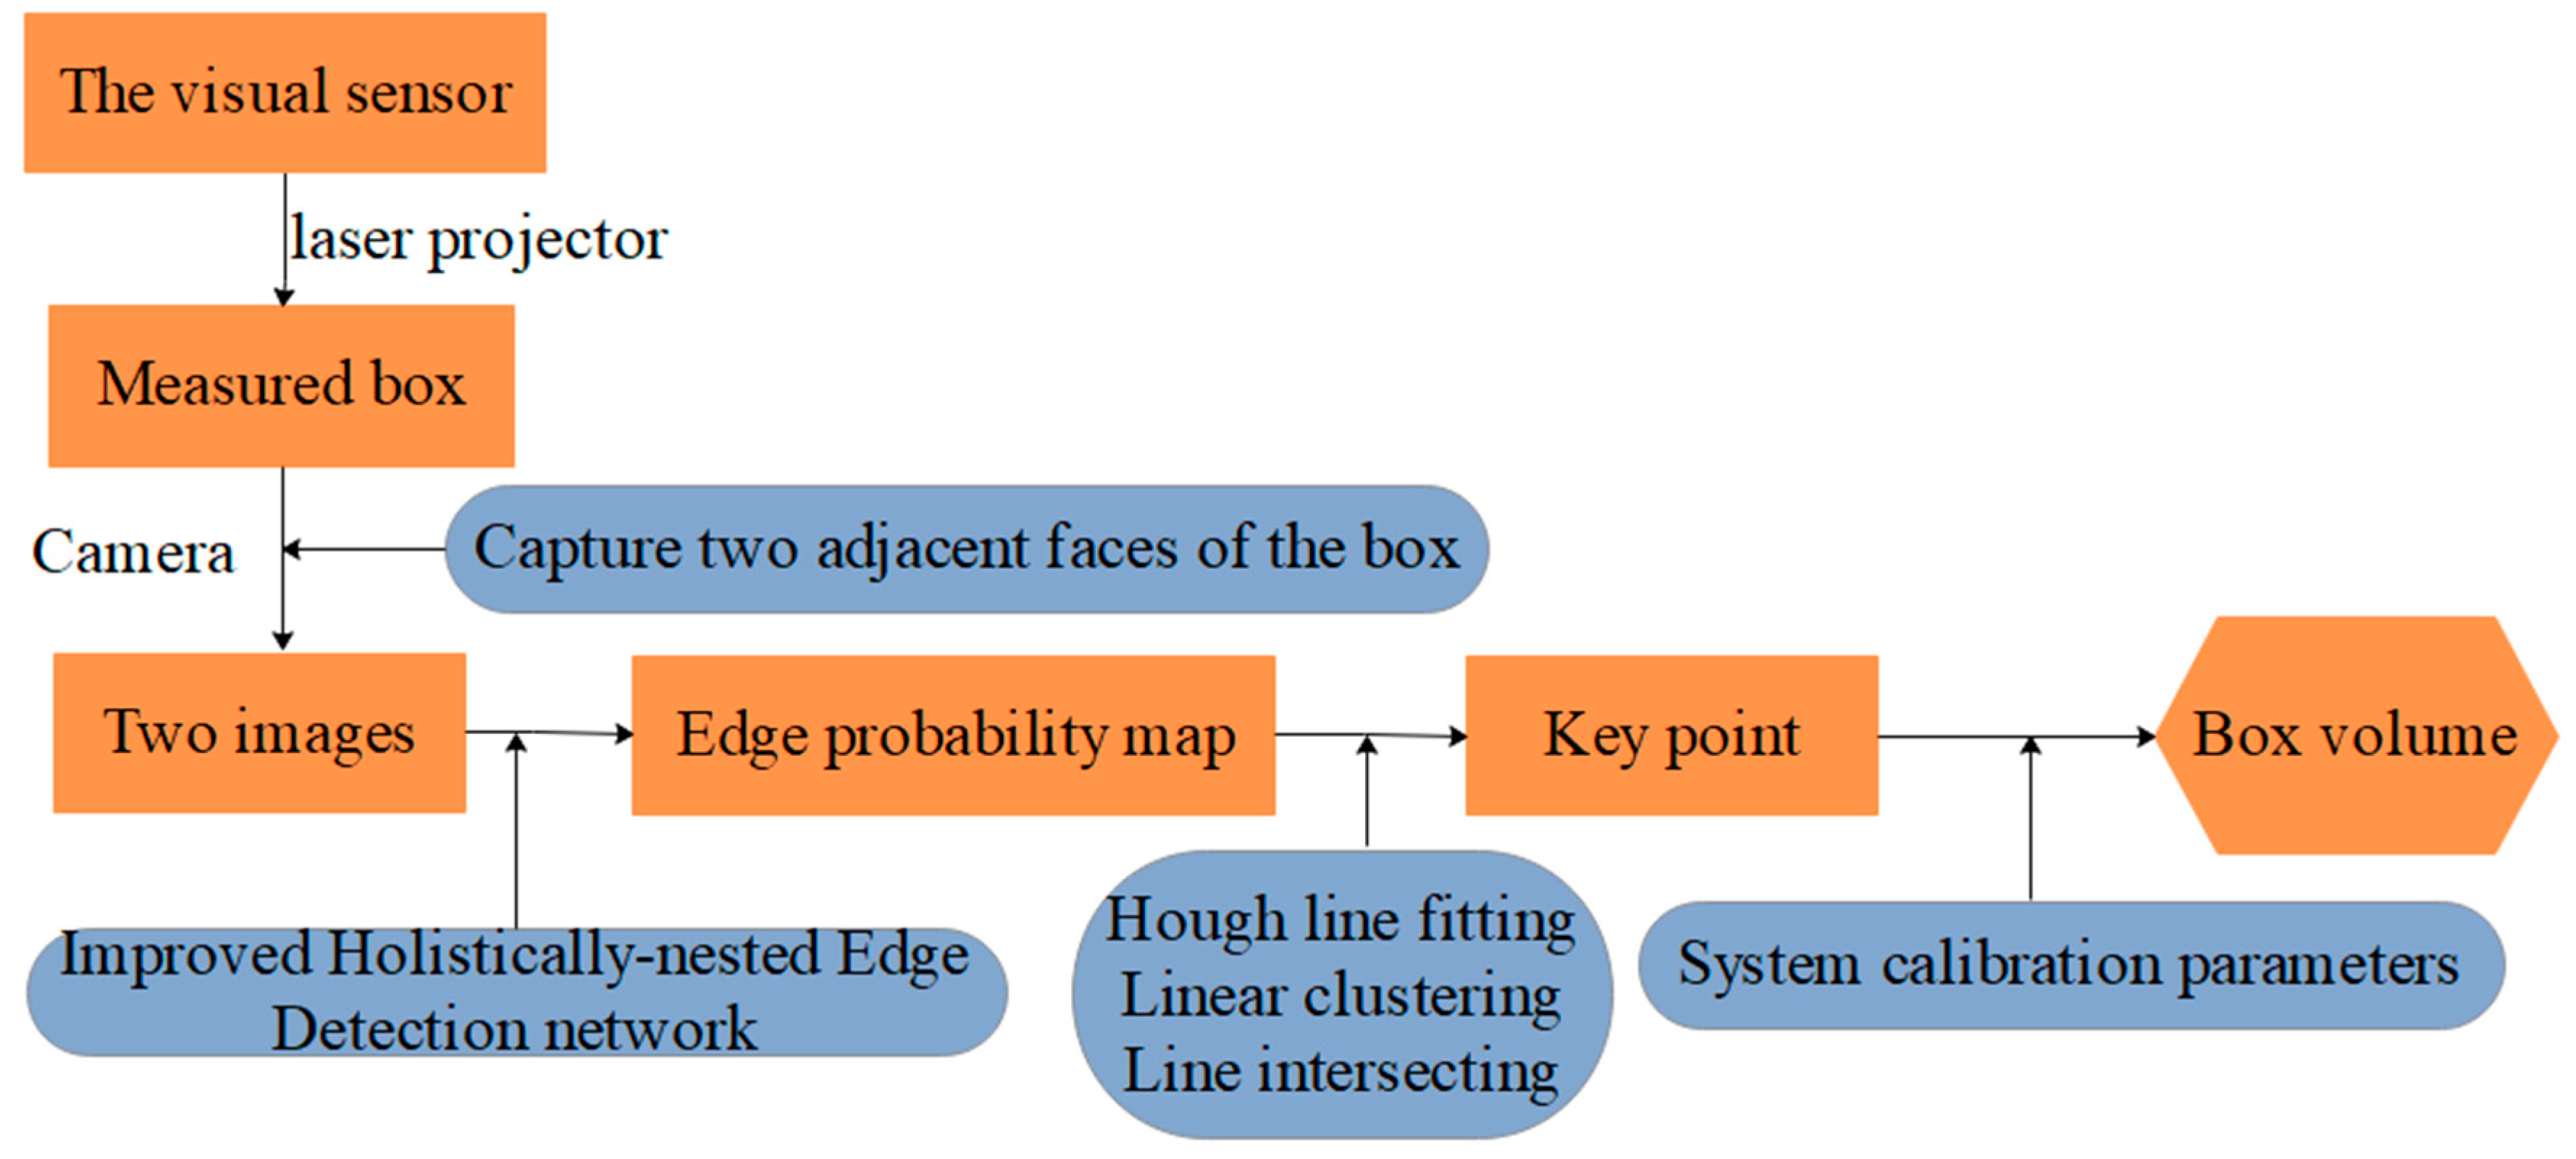
2. Overview
- Solving parameters: Before using the system, we obtain the parameters by using our calibration method (Section 3.3).
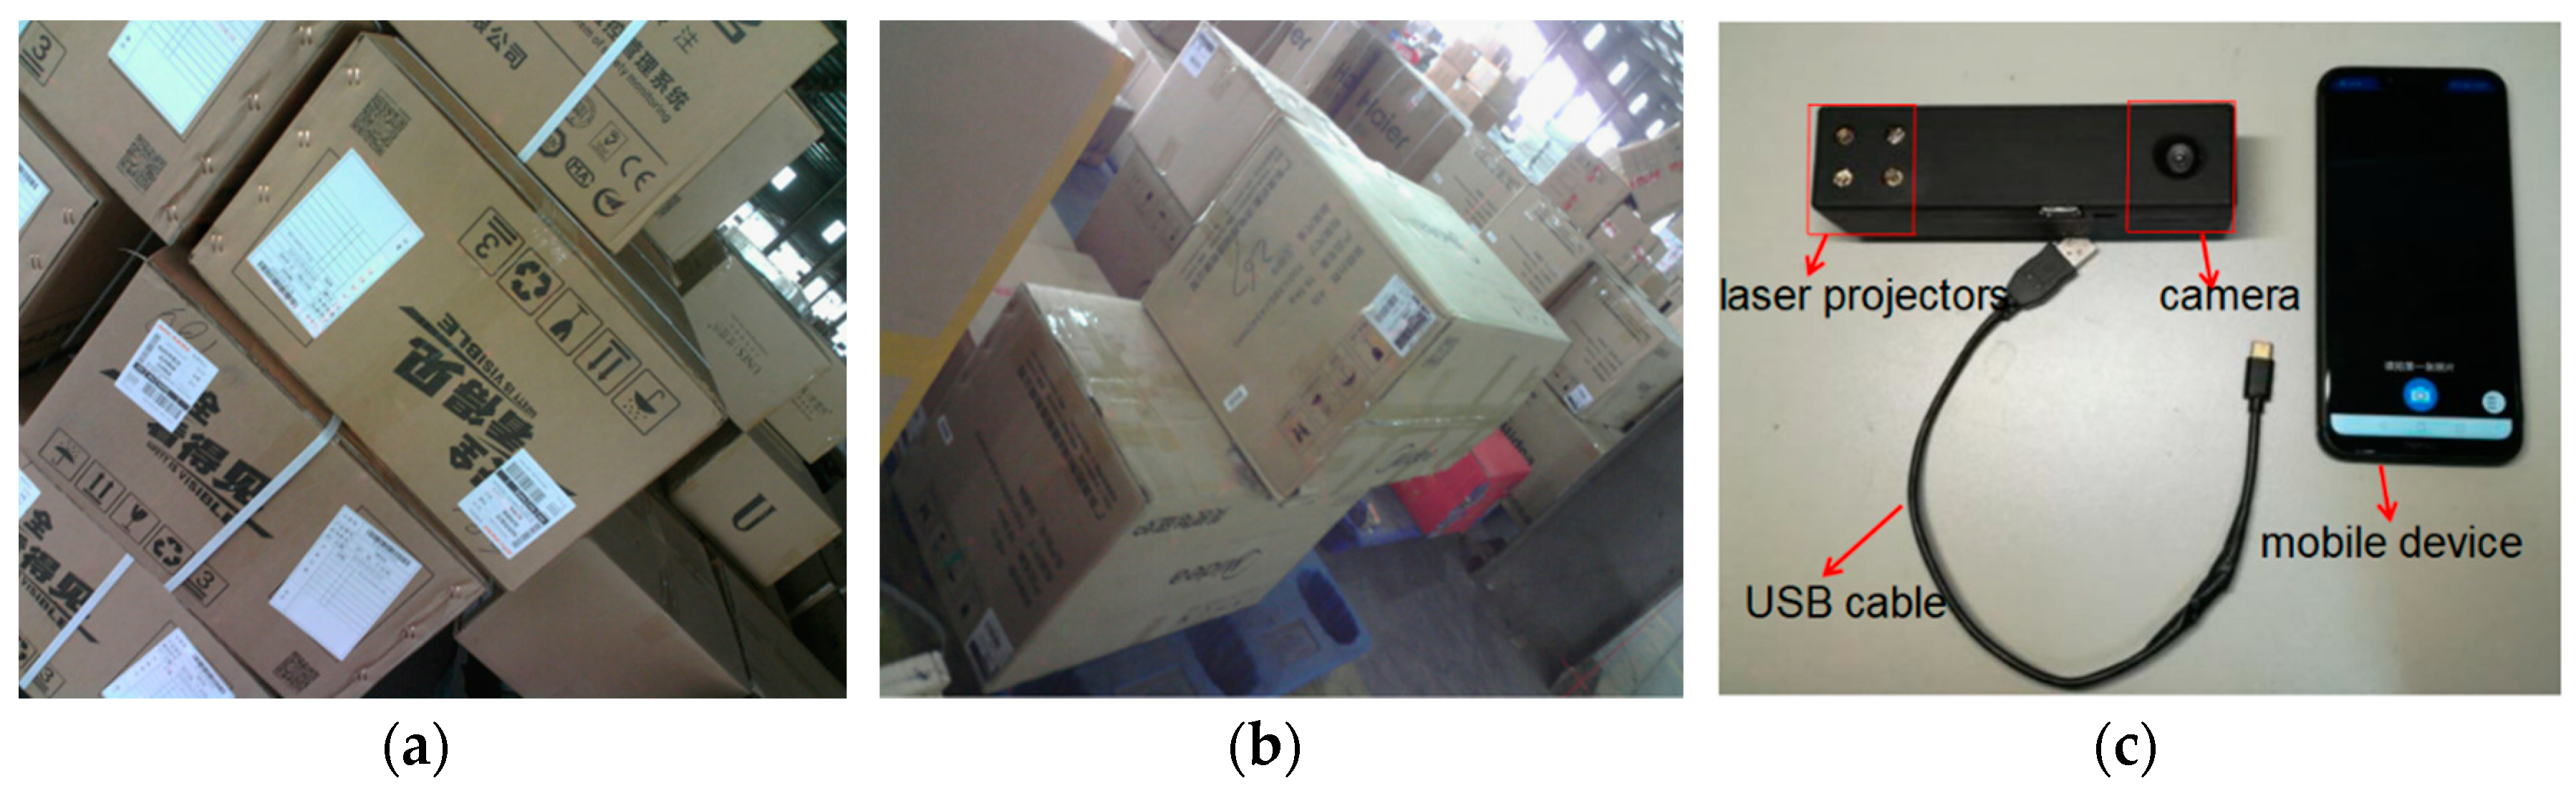
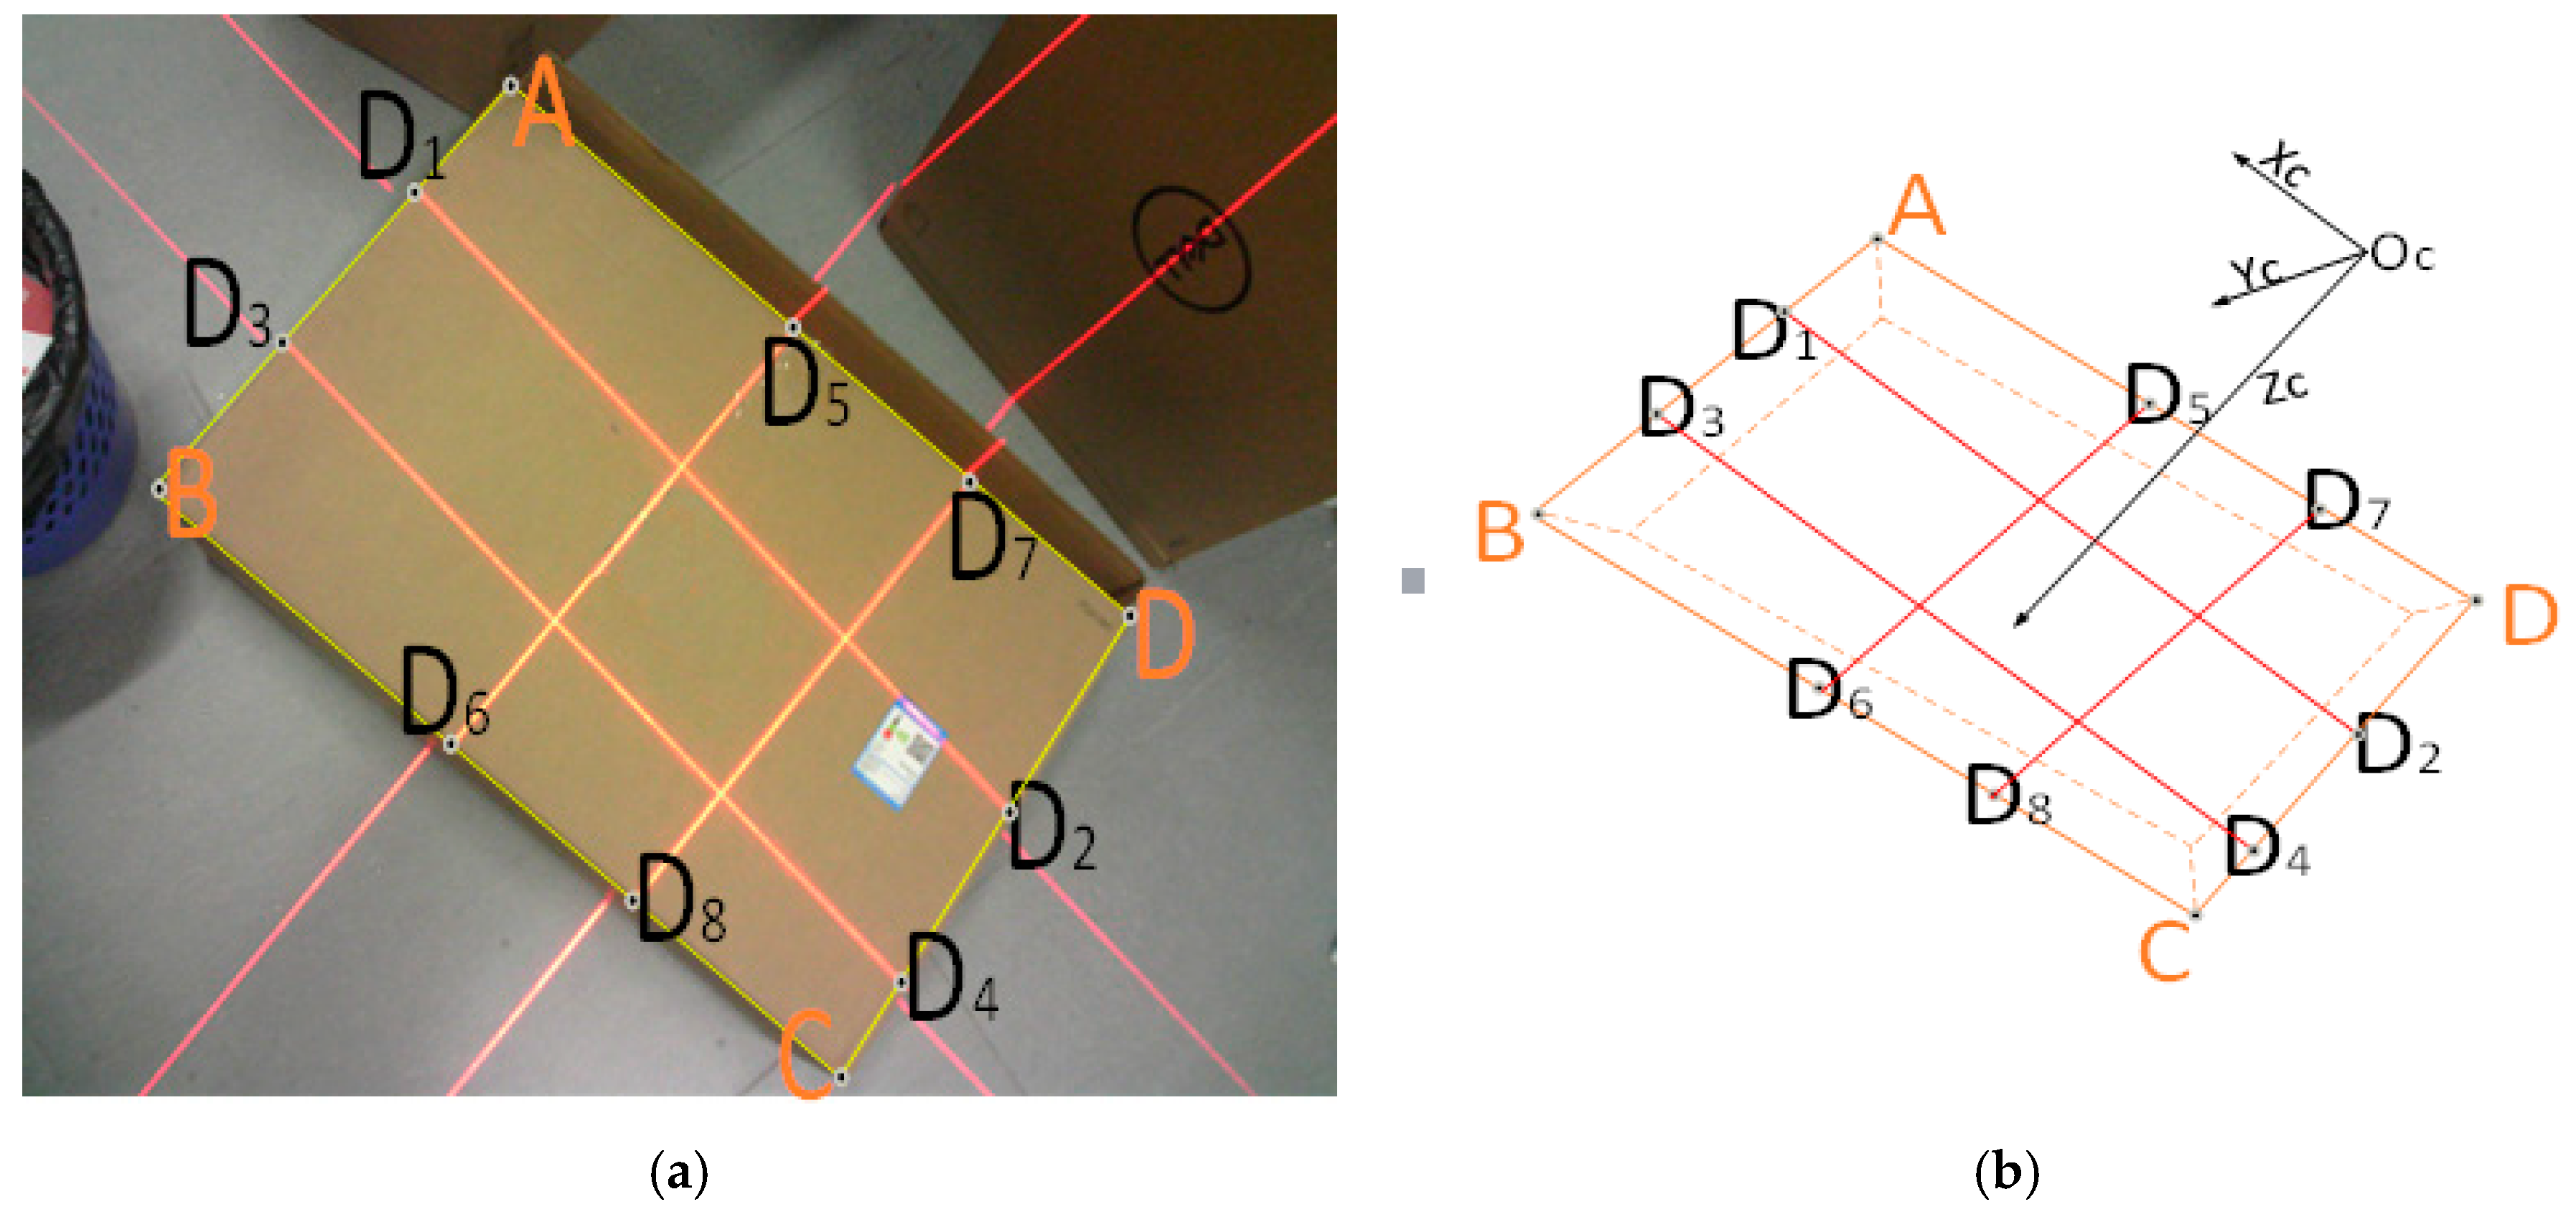
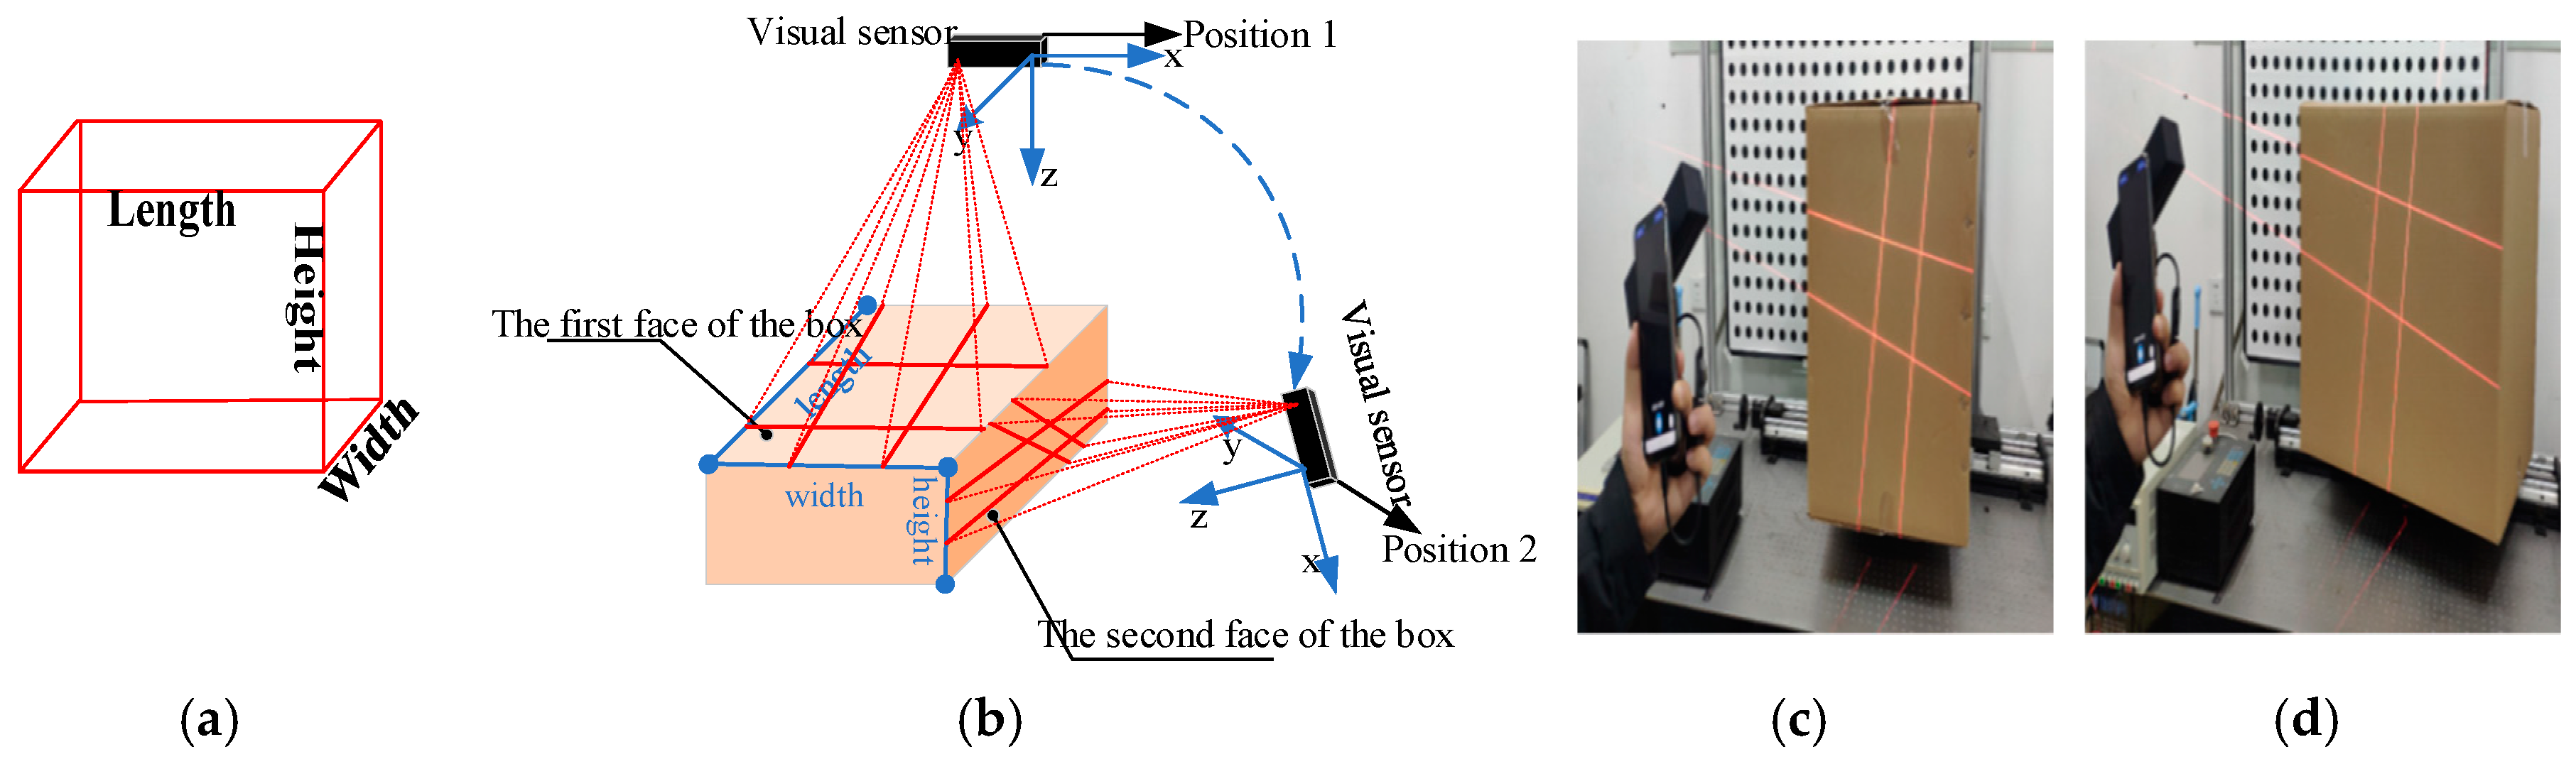
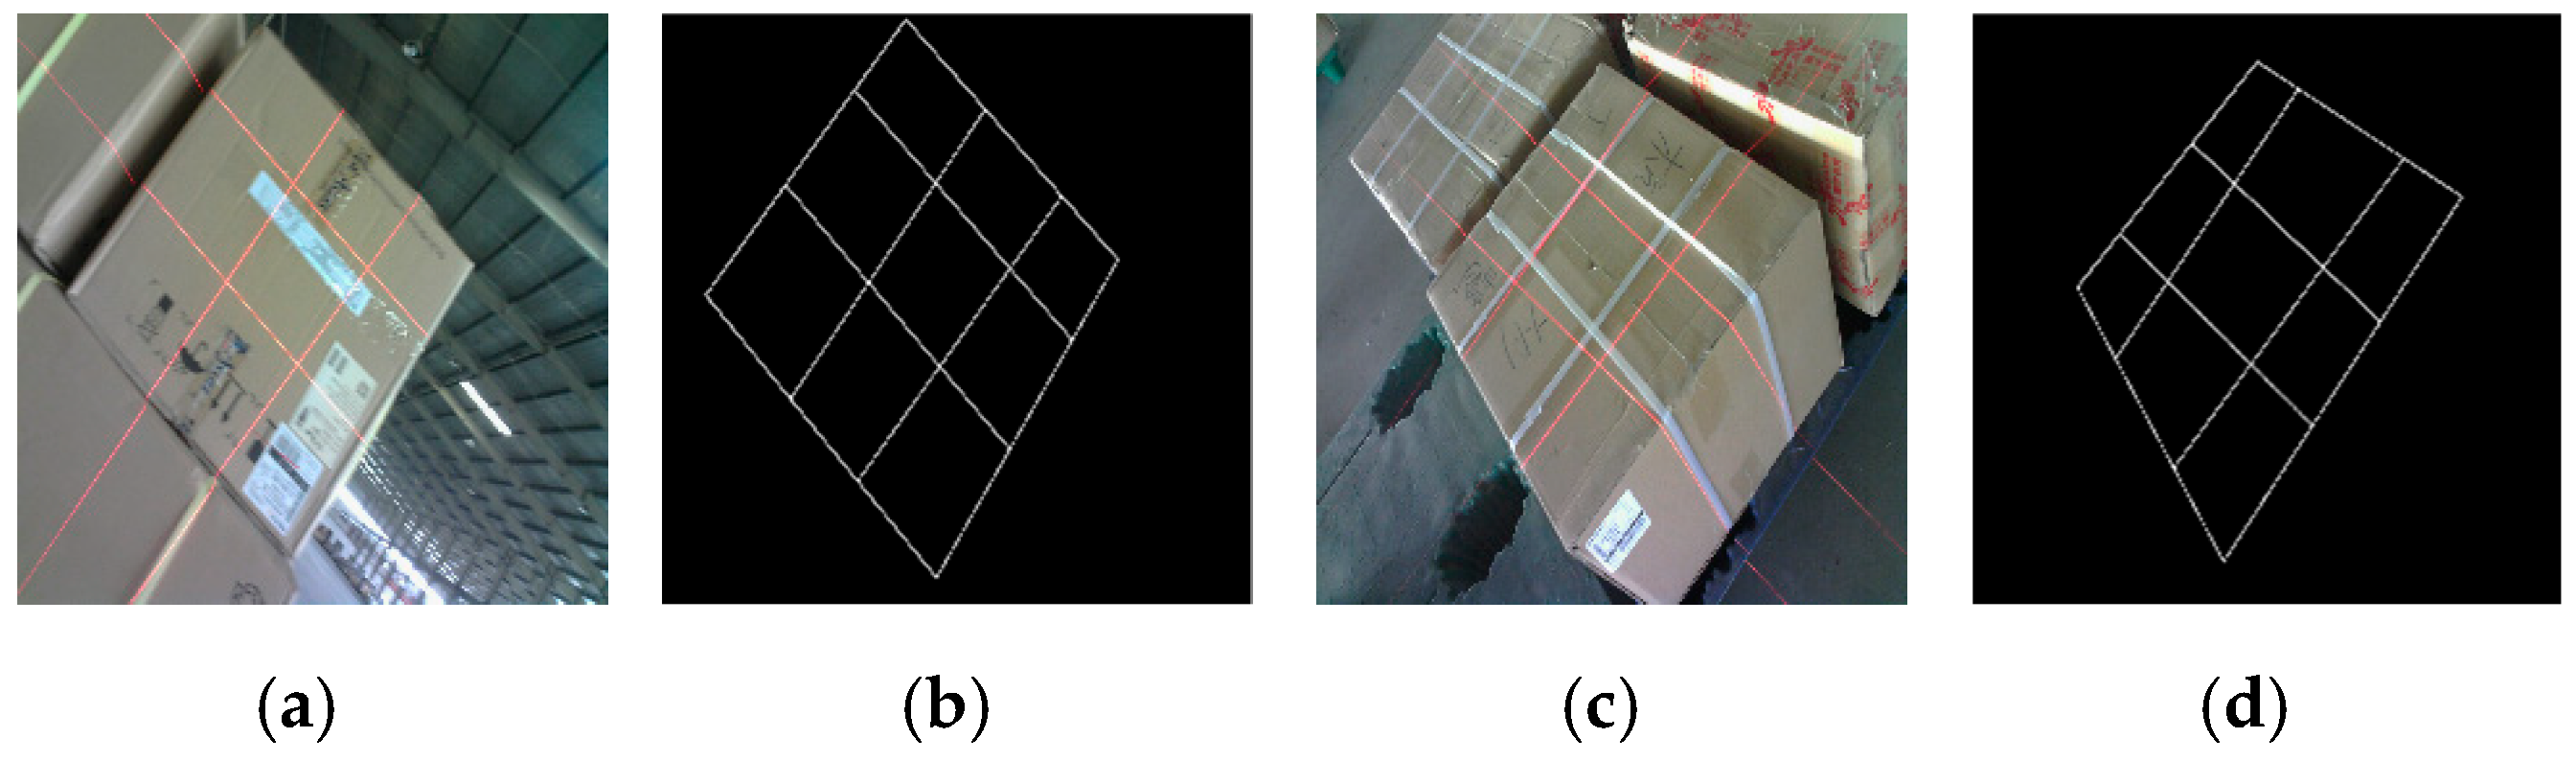
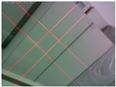
- Data collection: The visual sensor connected to a portable mobile device is used. Two images of any two adjacent faces of the box are obtained. The four modulated laser stripes should intersect the four edges of the box face, as shown in Figure 2c,d.
- Volume measurement: The system will automatically process the collected images and then obtain the box length, width, and height. Finally, the system automatically obtains the volume of the measured box.
3. Mathematical Modeling
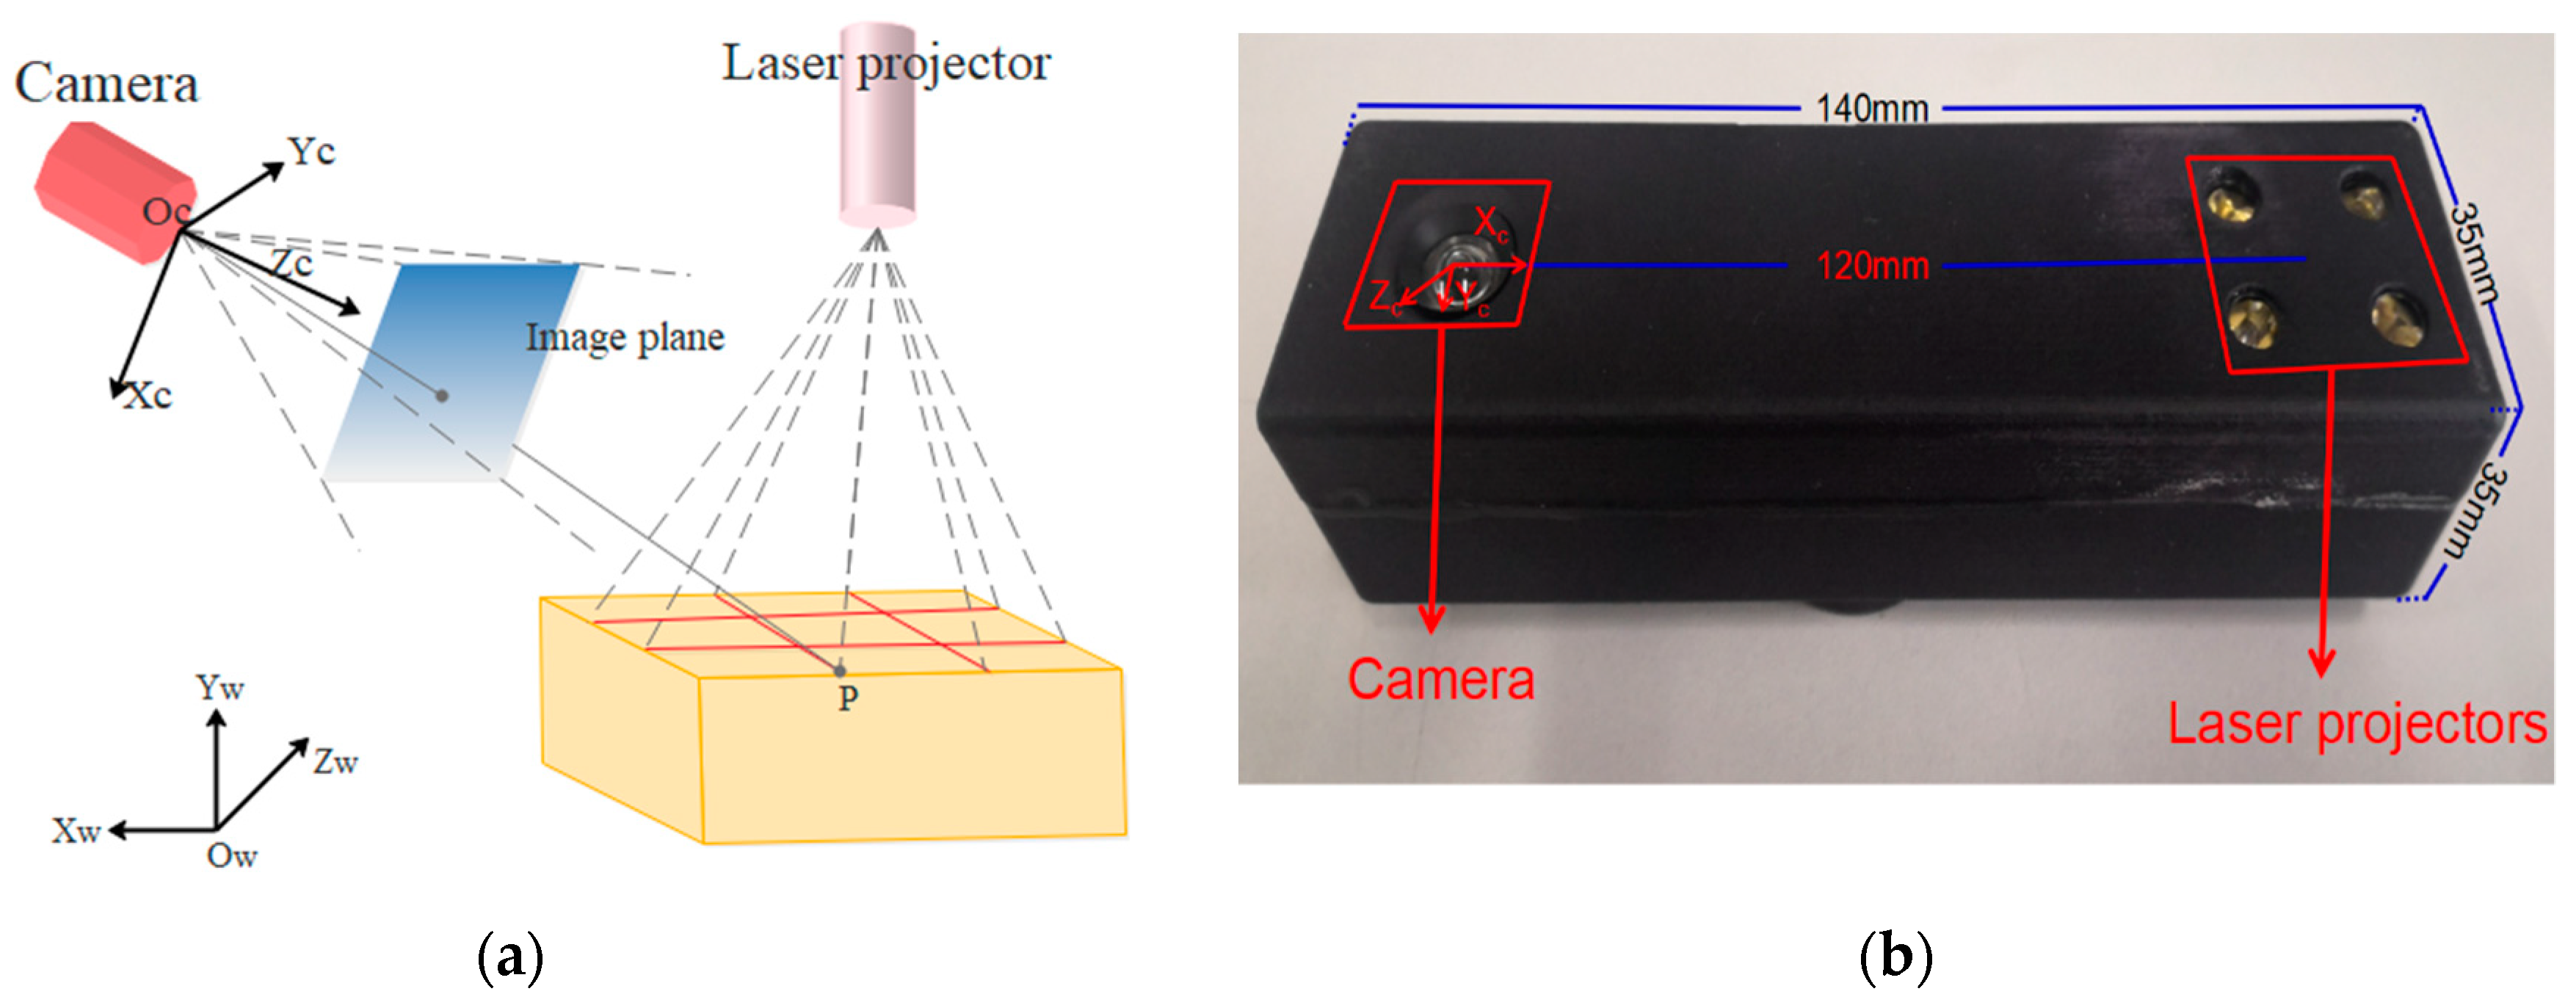
3.1. Design of the Visual Sensor Measurement System
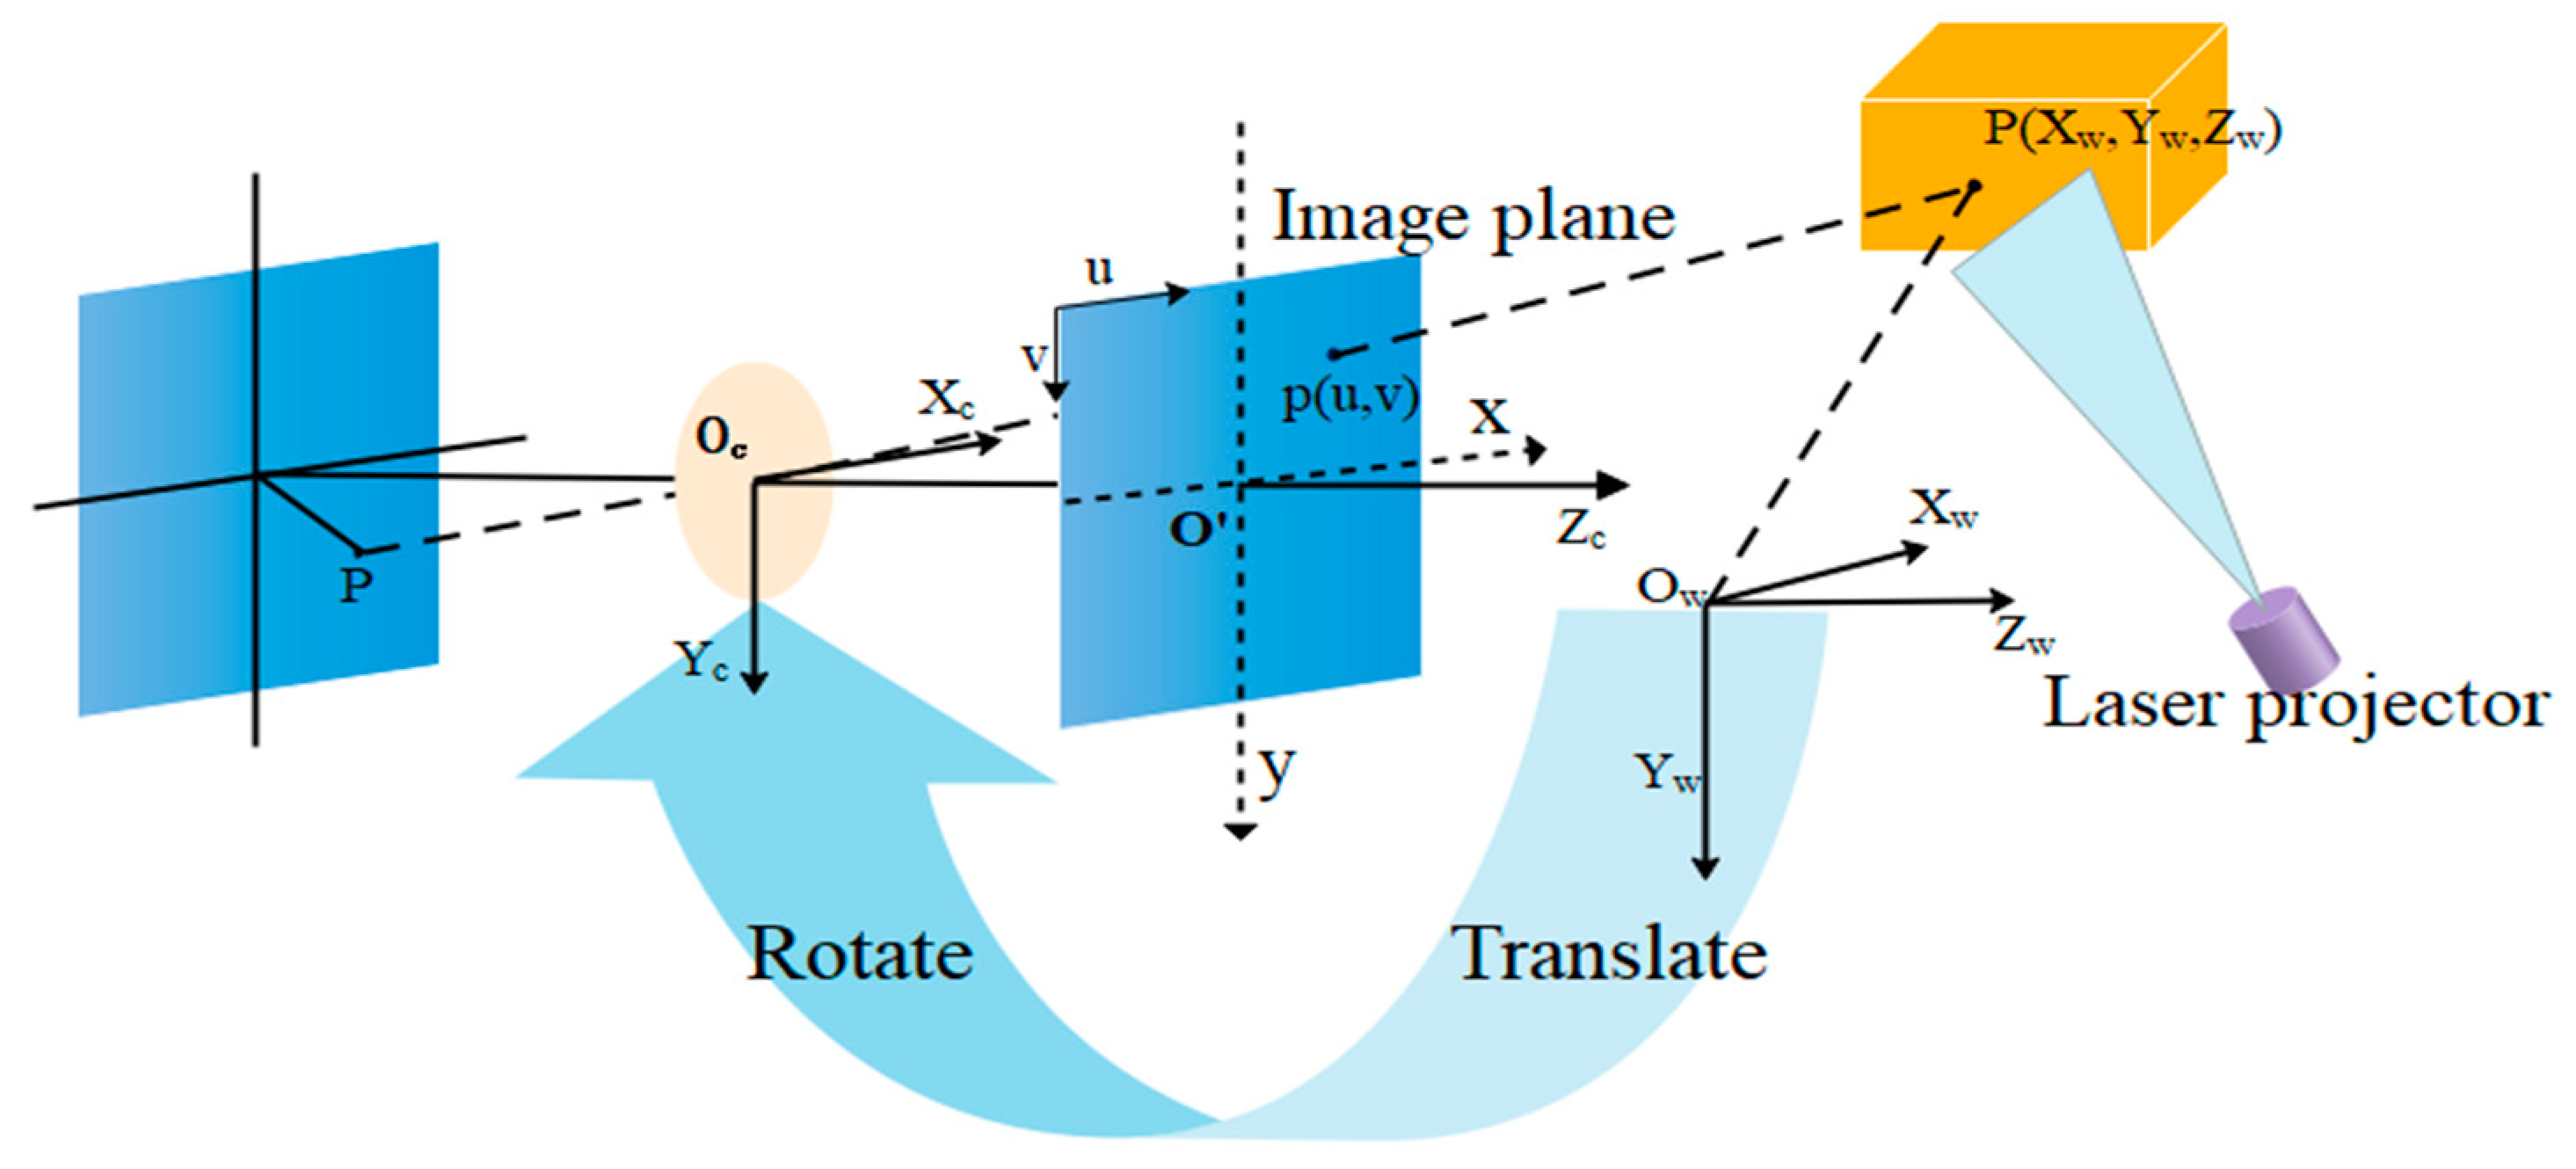
3.2. Geometric Model
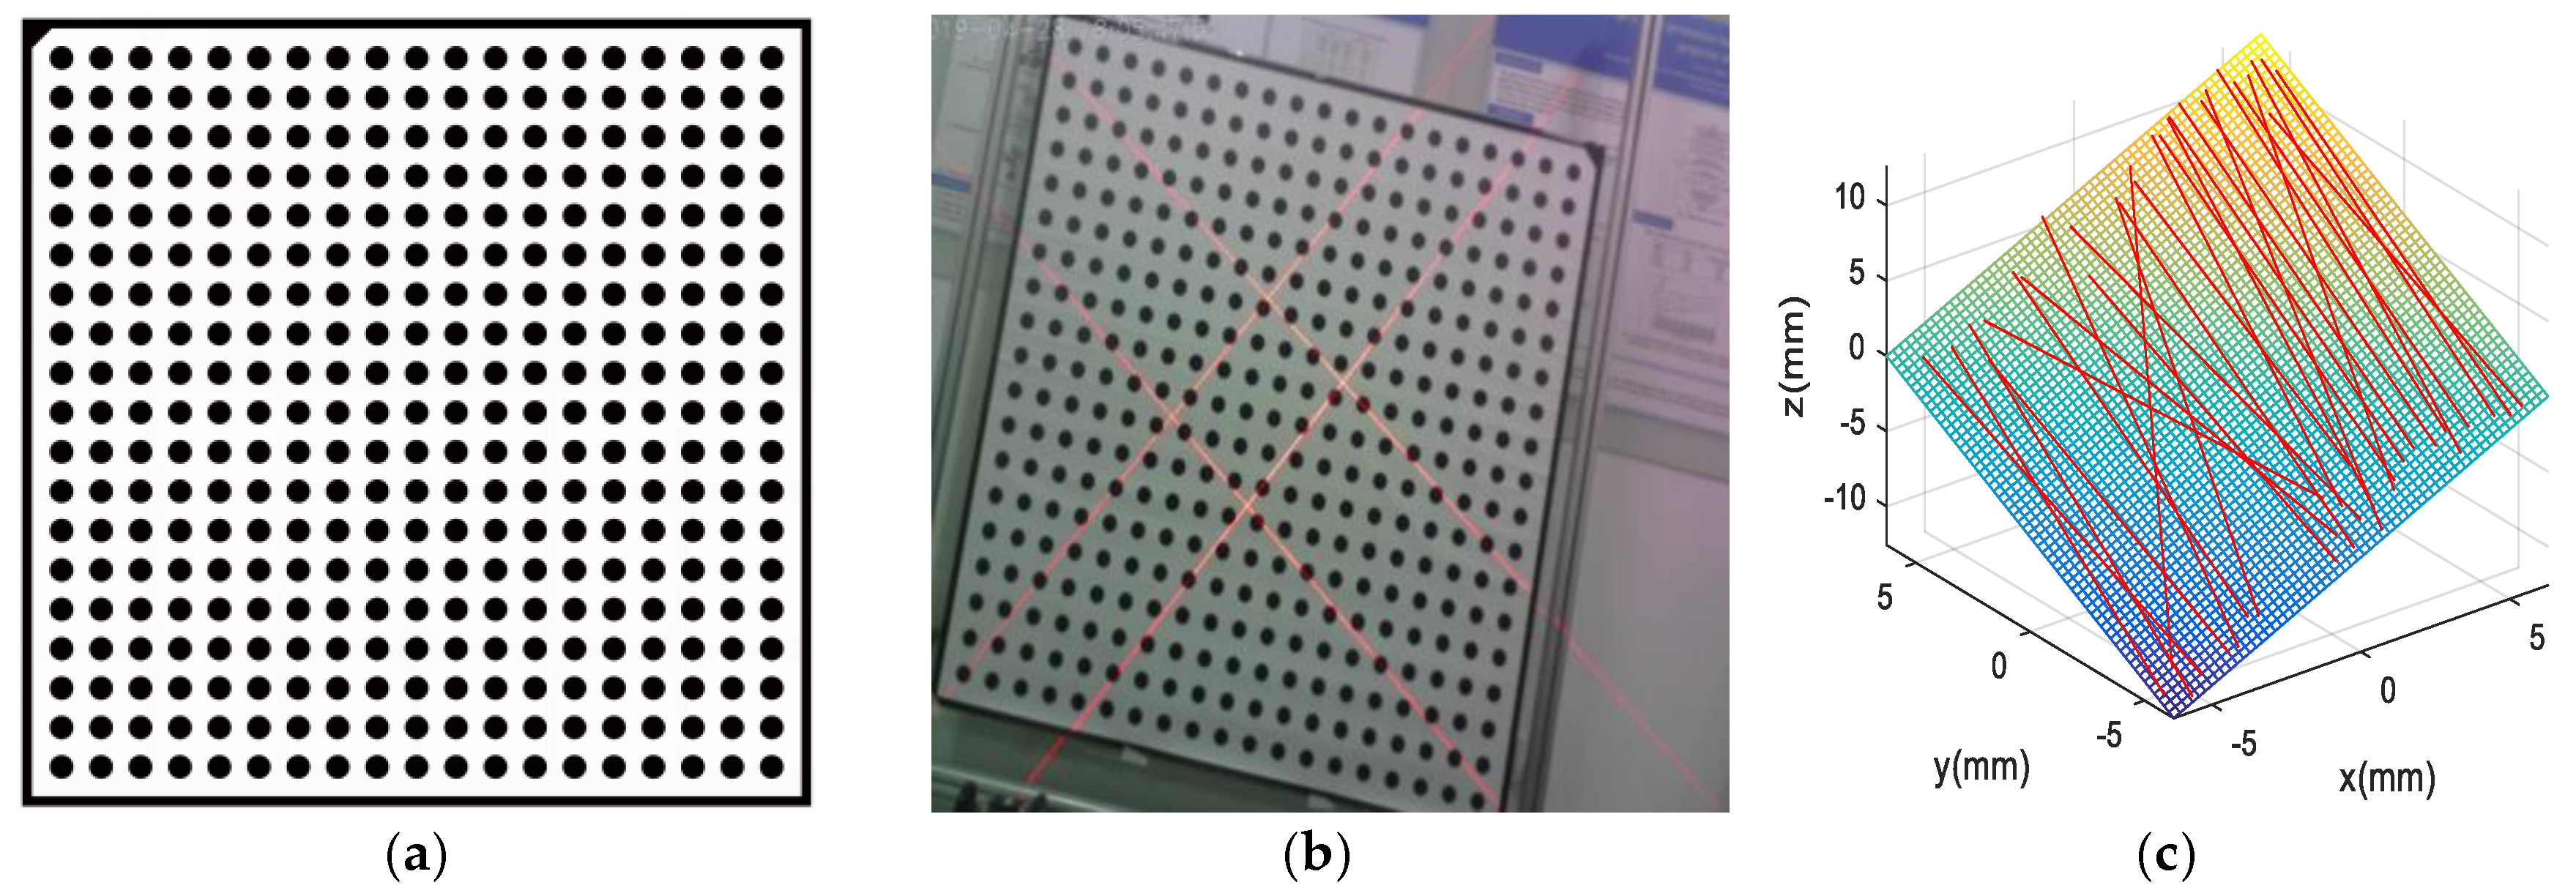
3.3. Calibration Method for the Camera and 2 × 2 Laser Line Grid Projector
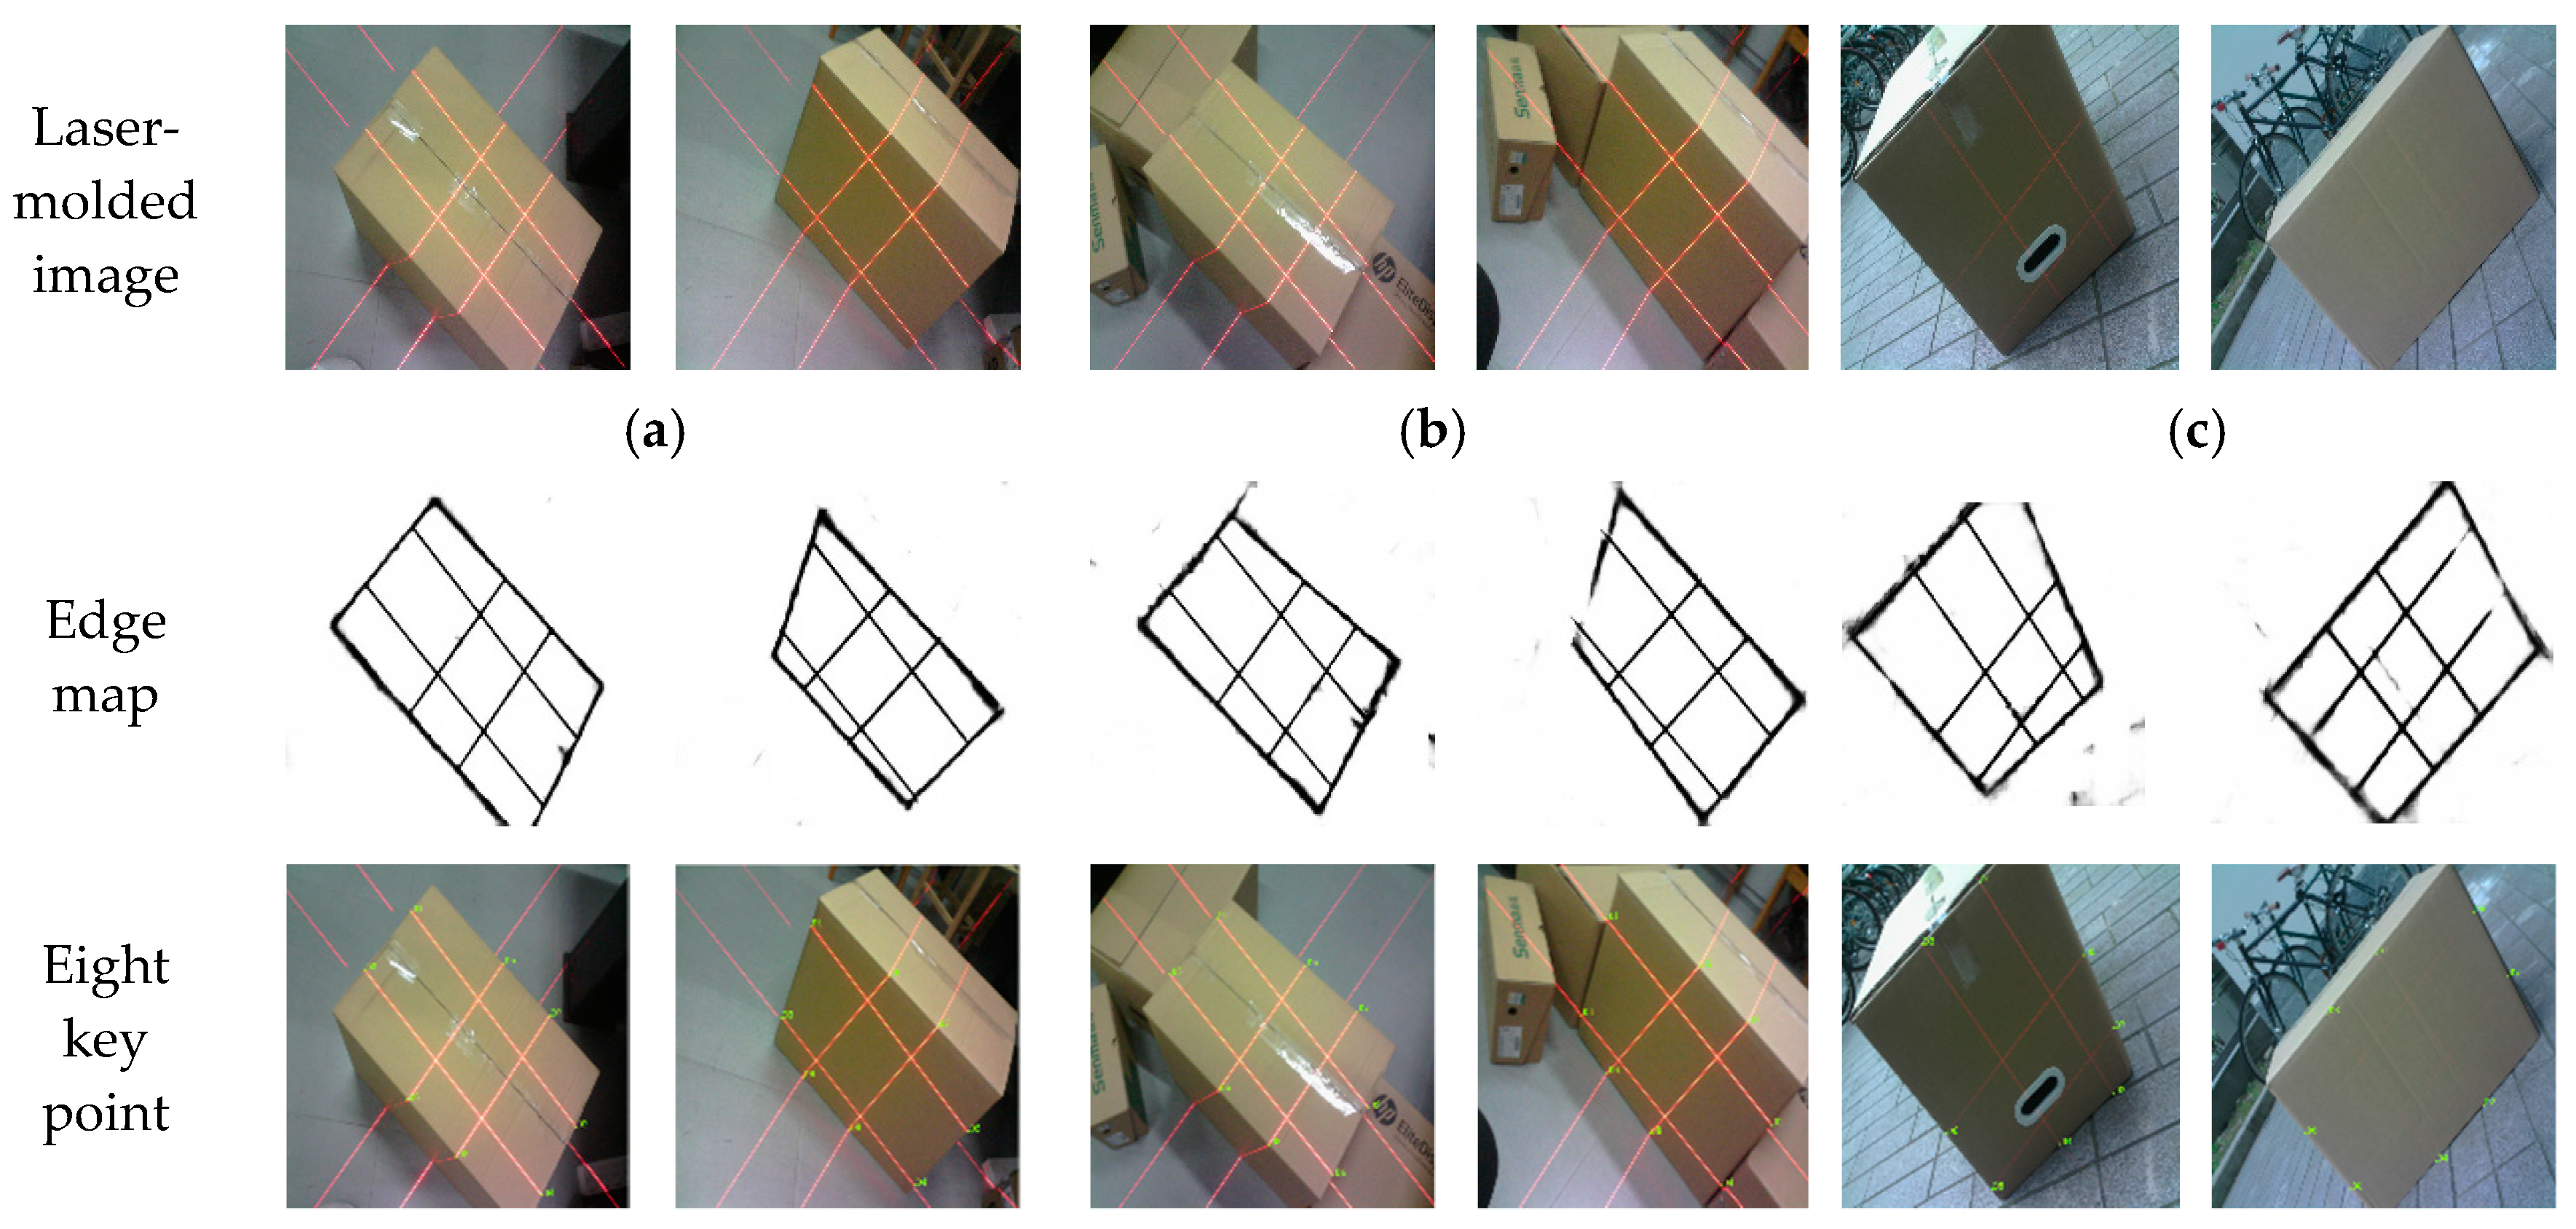
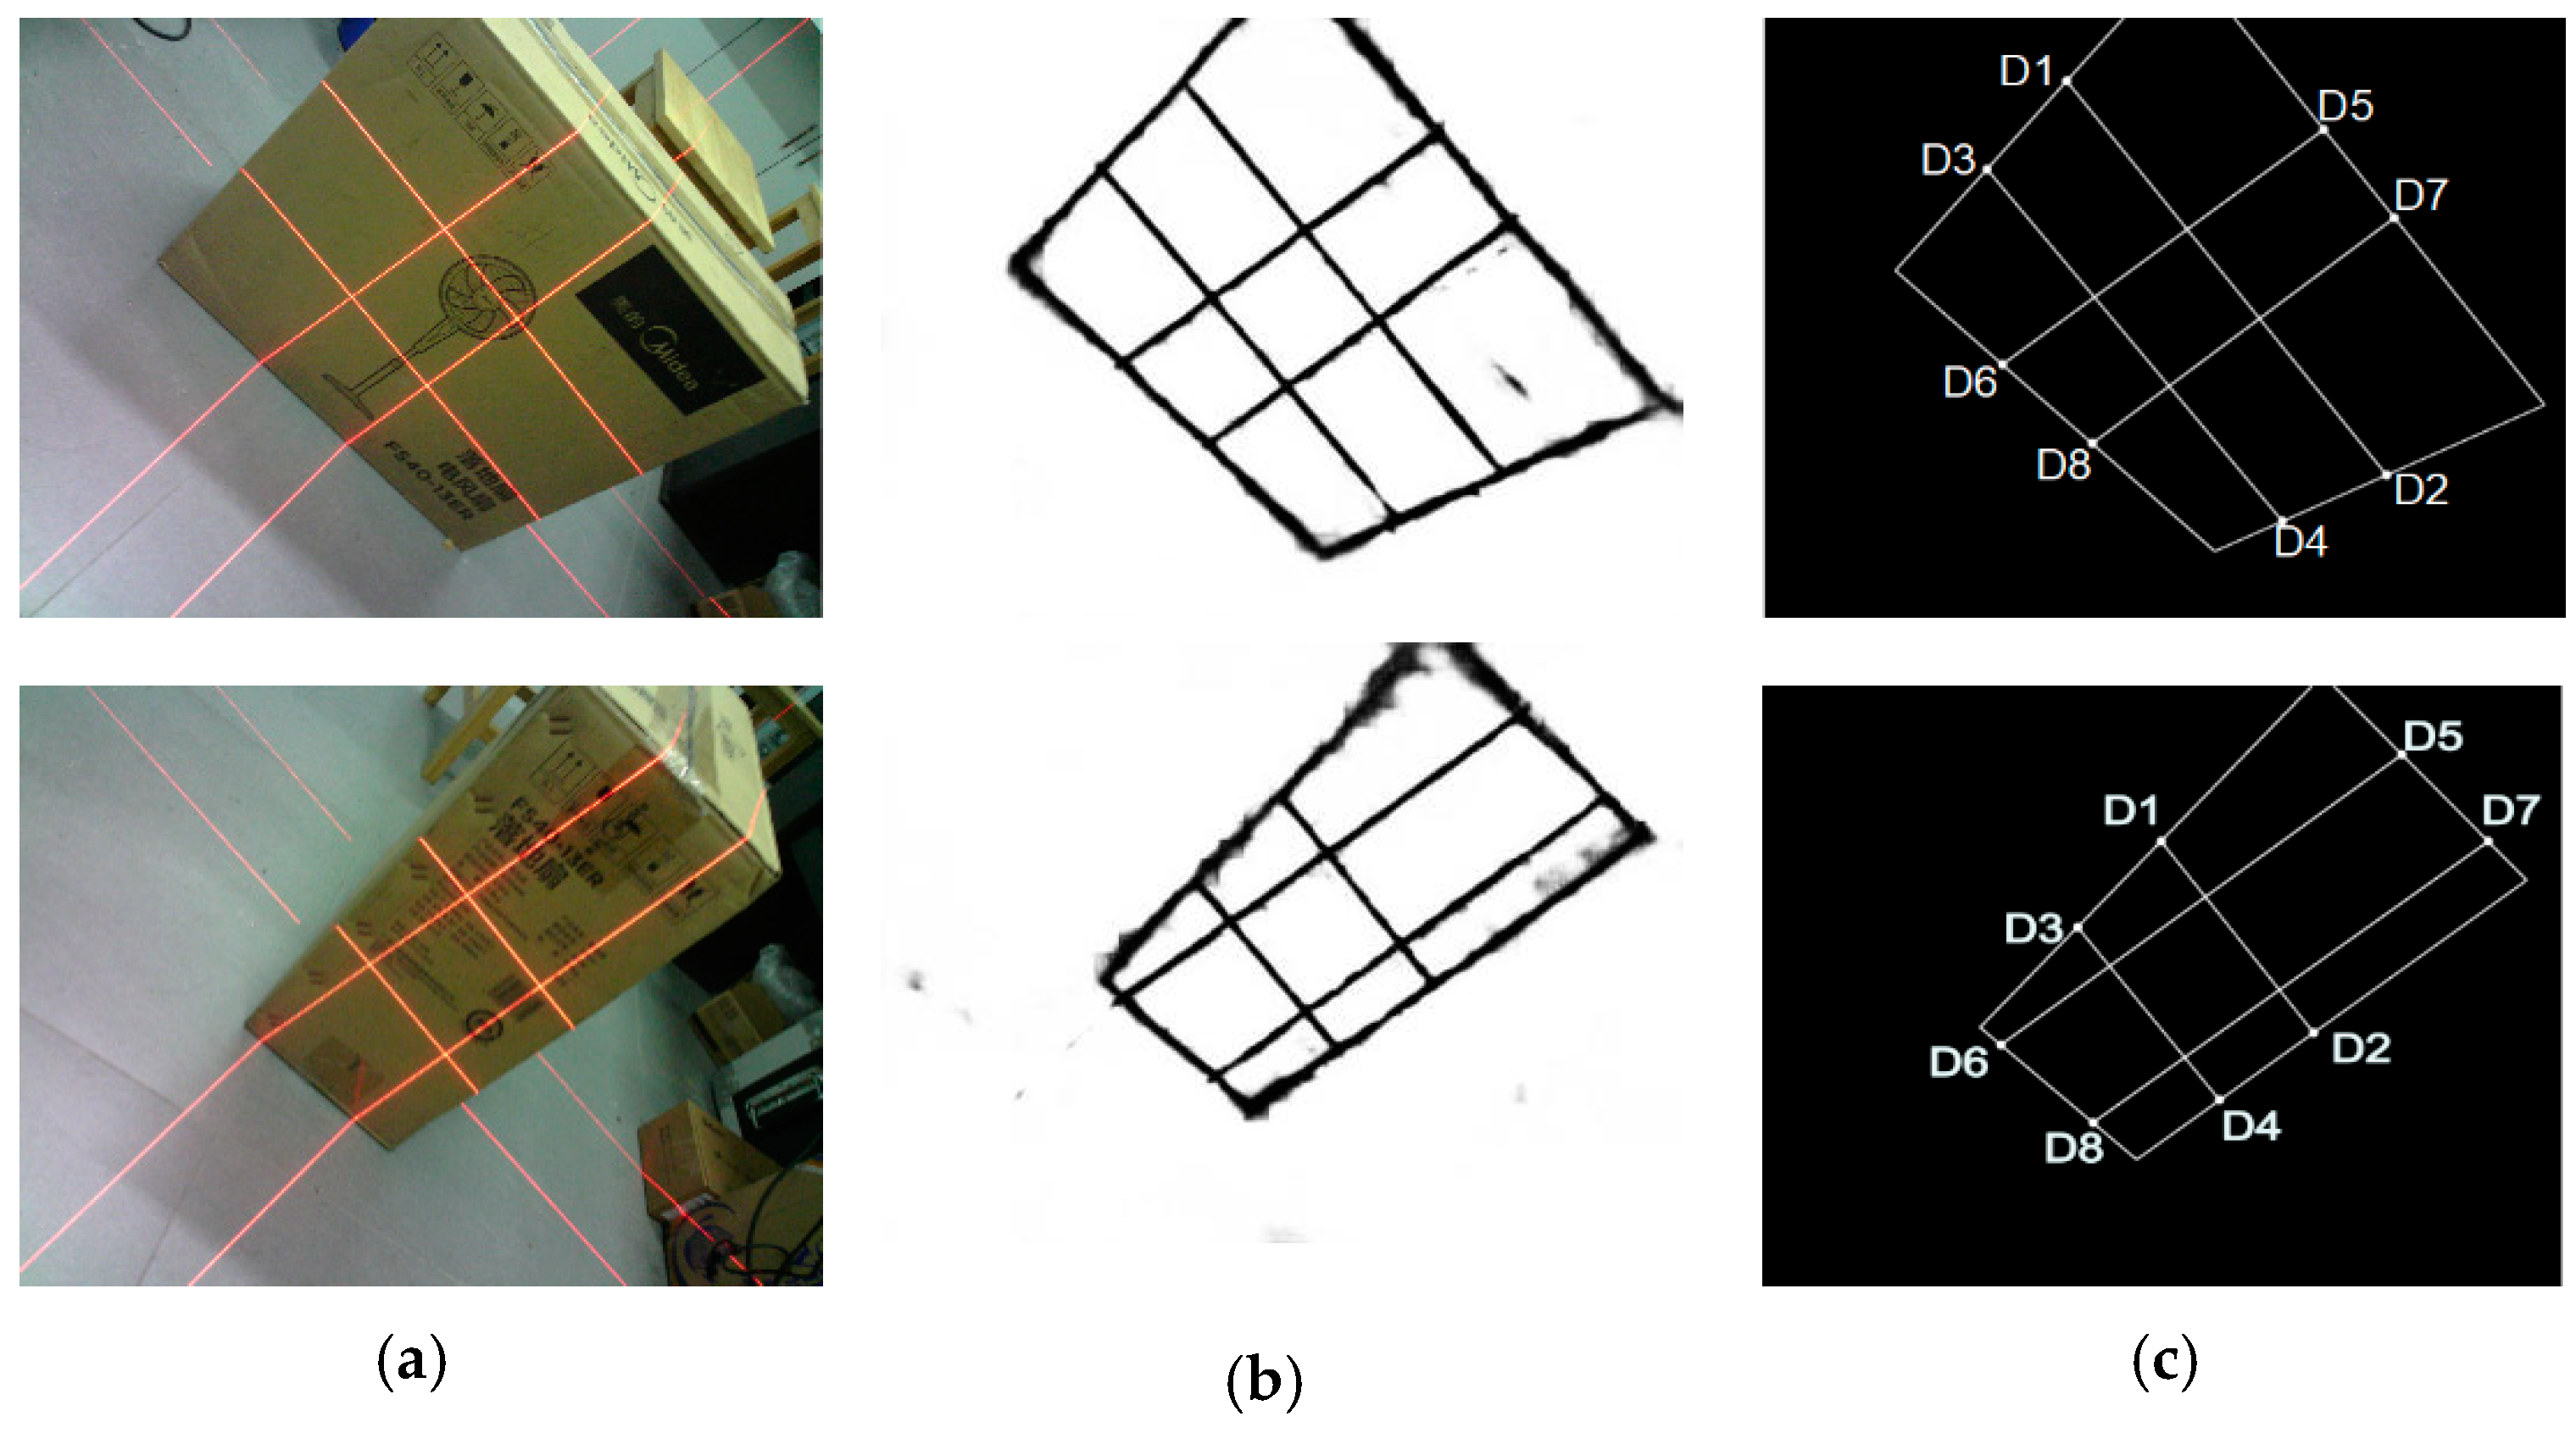
3.4. Laser-Modulated Image Processing
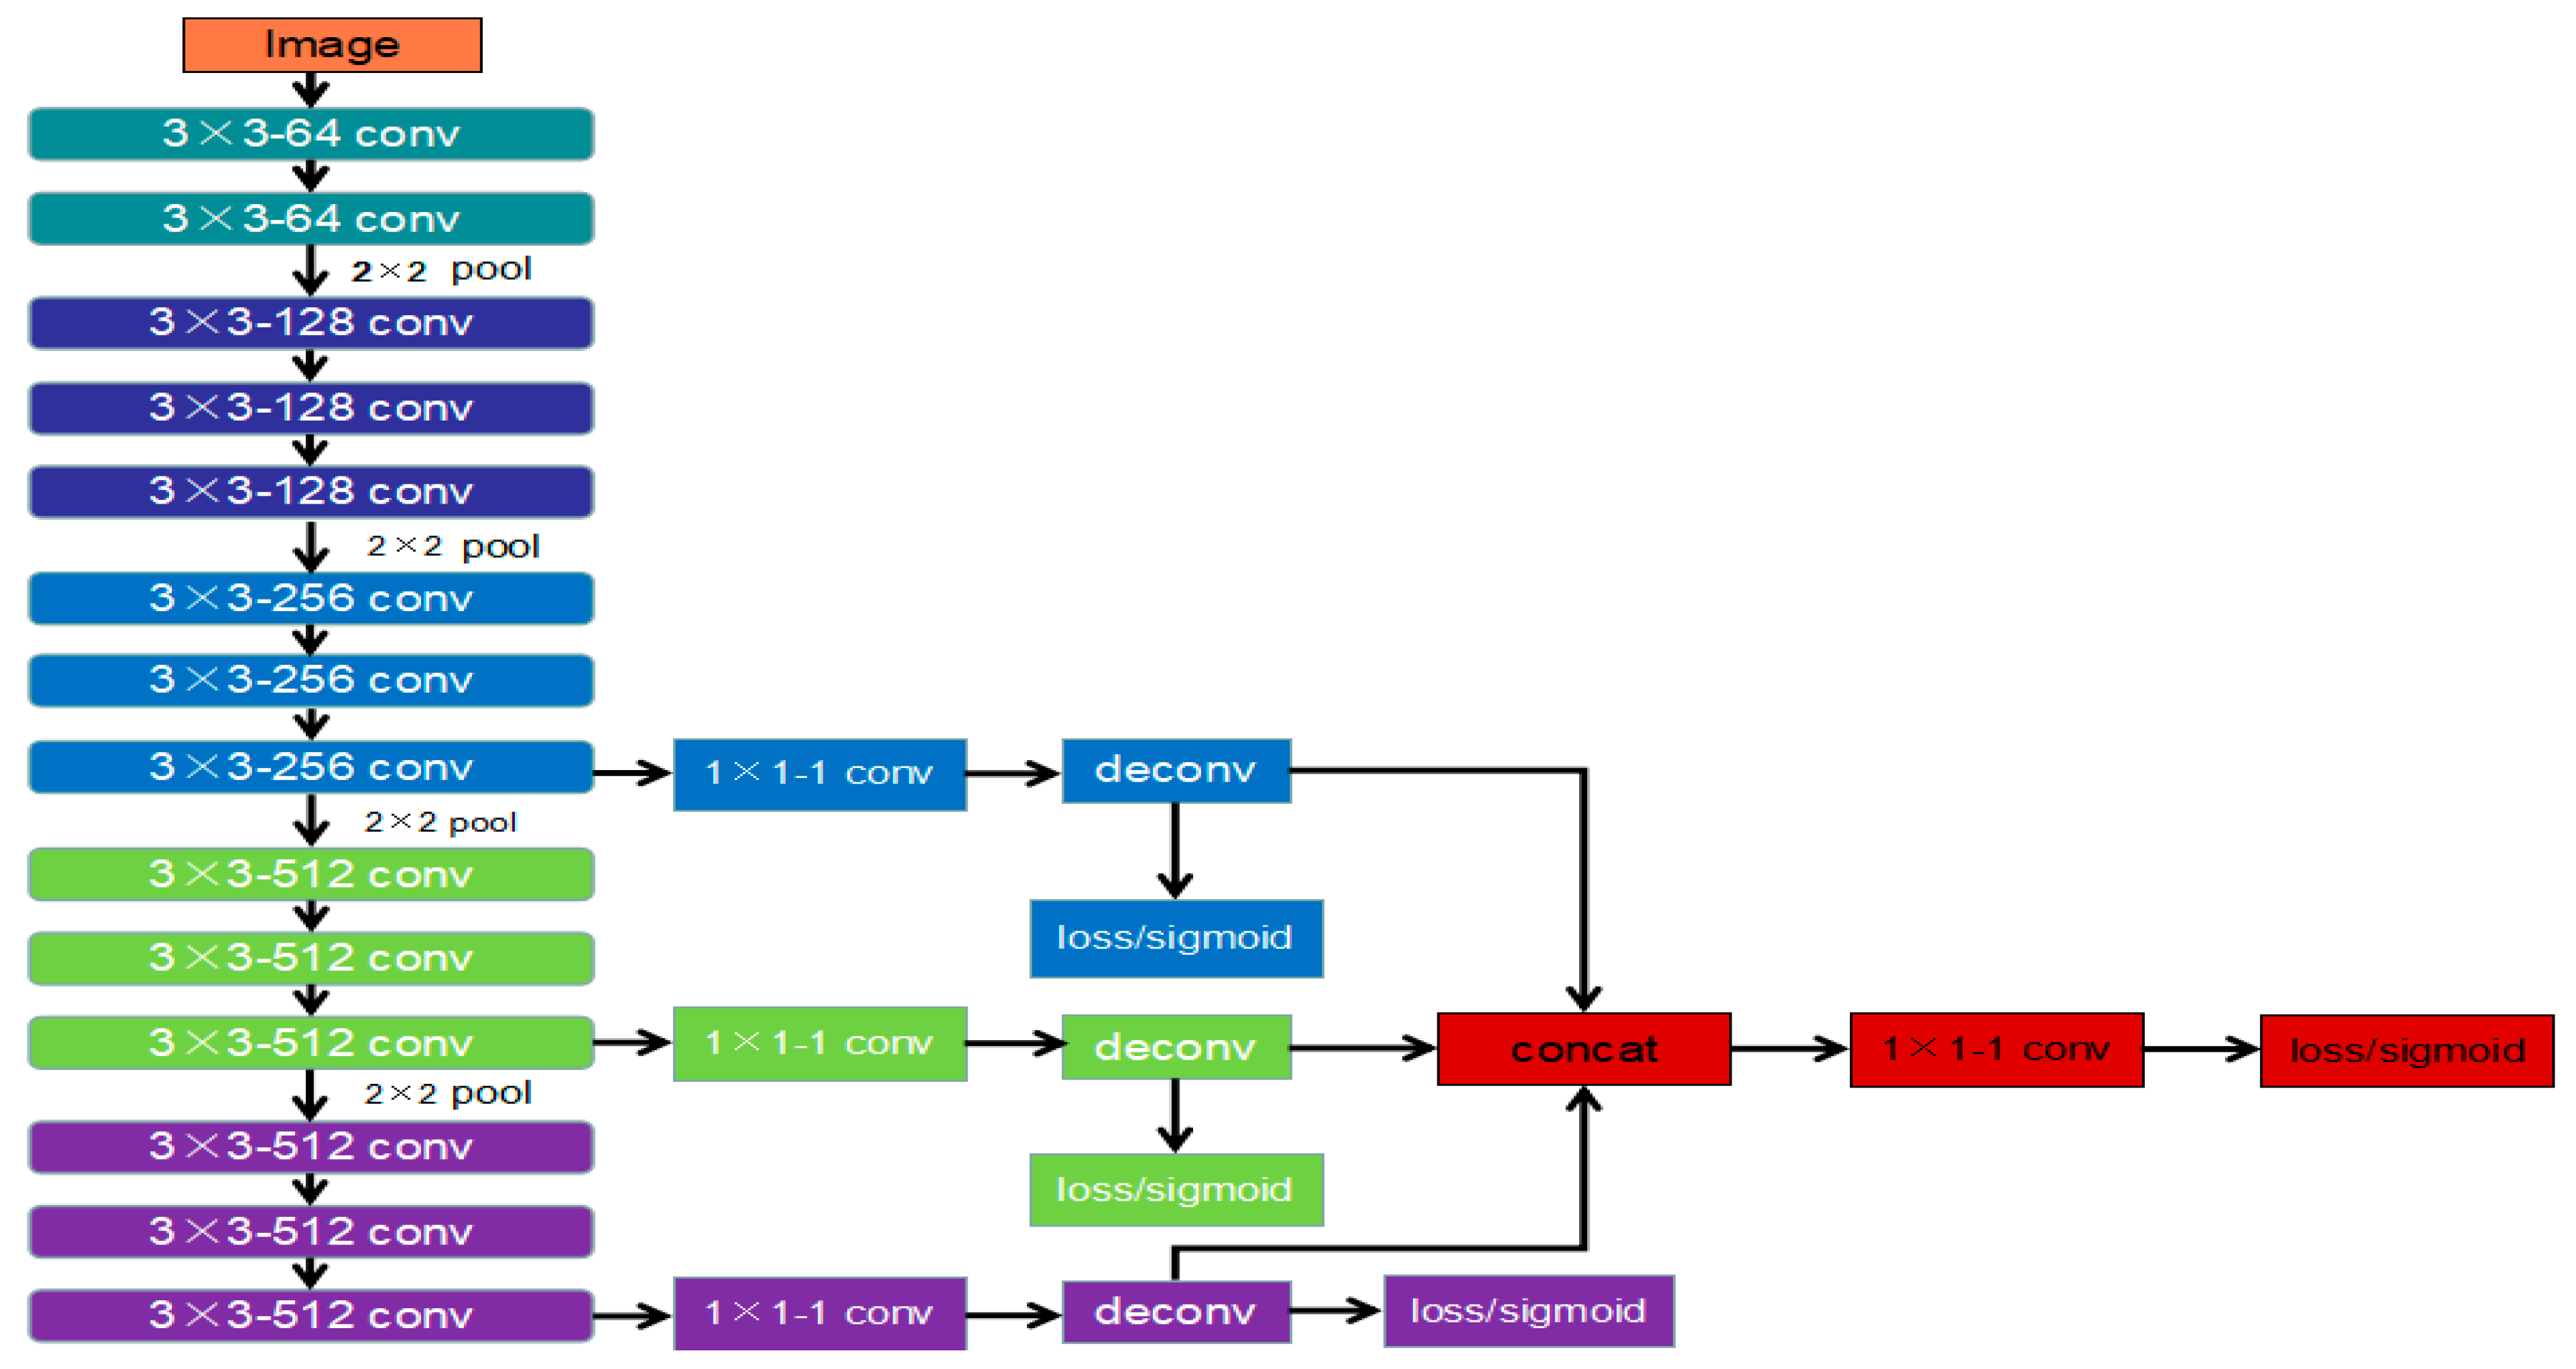
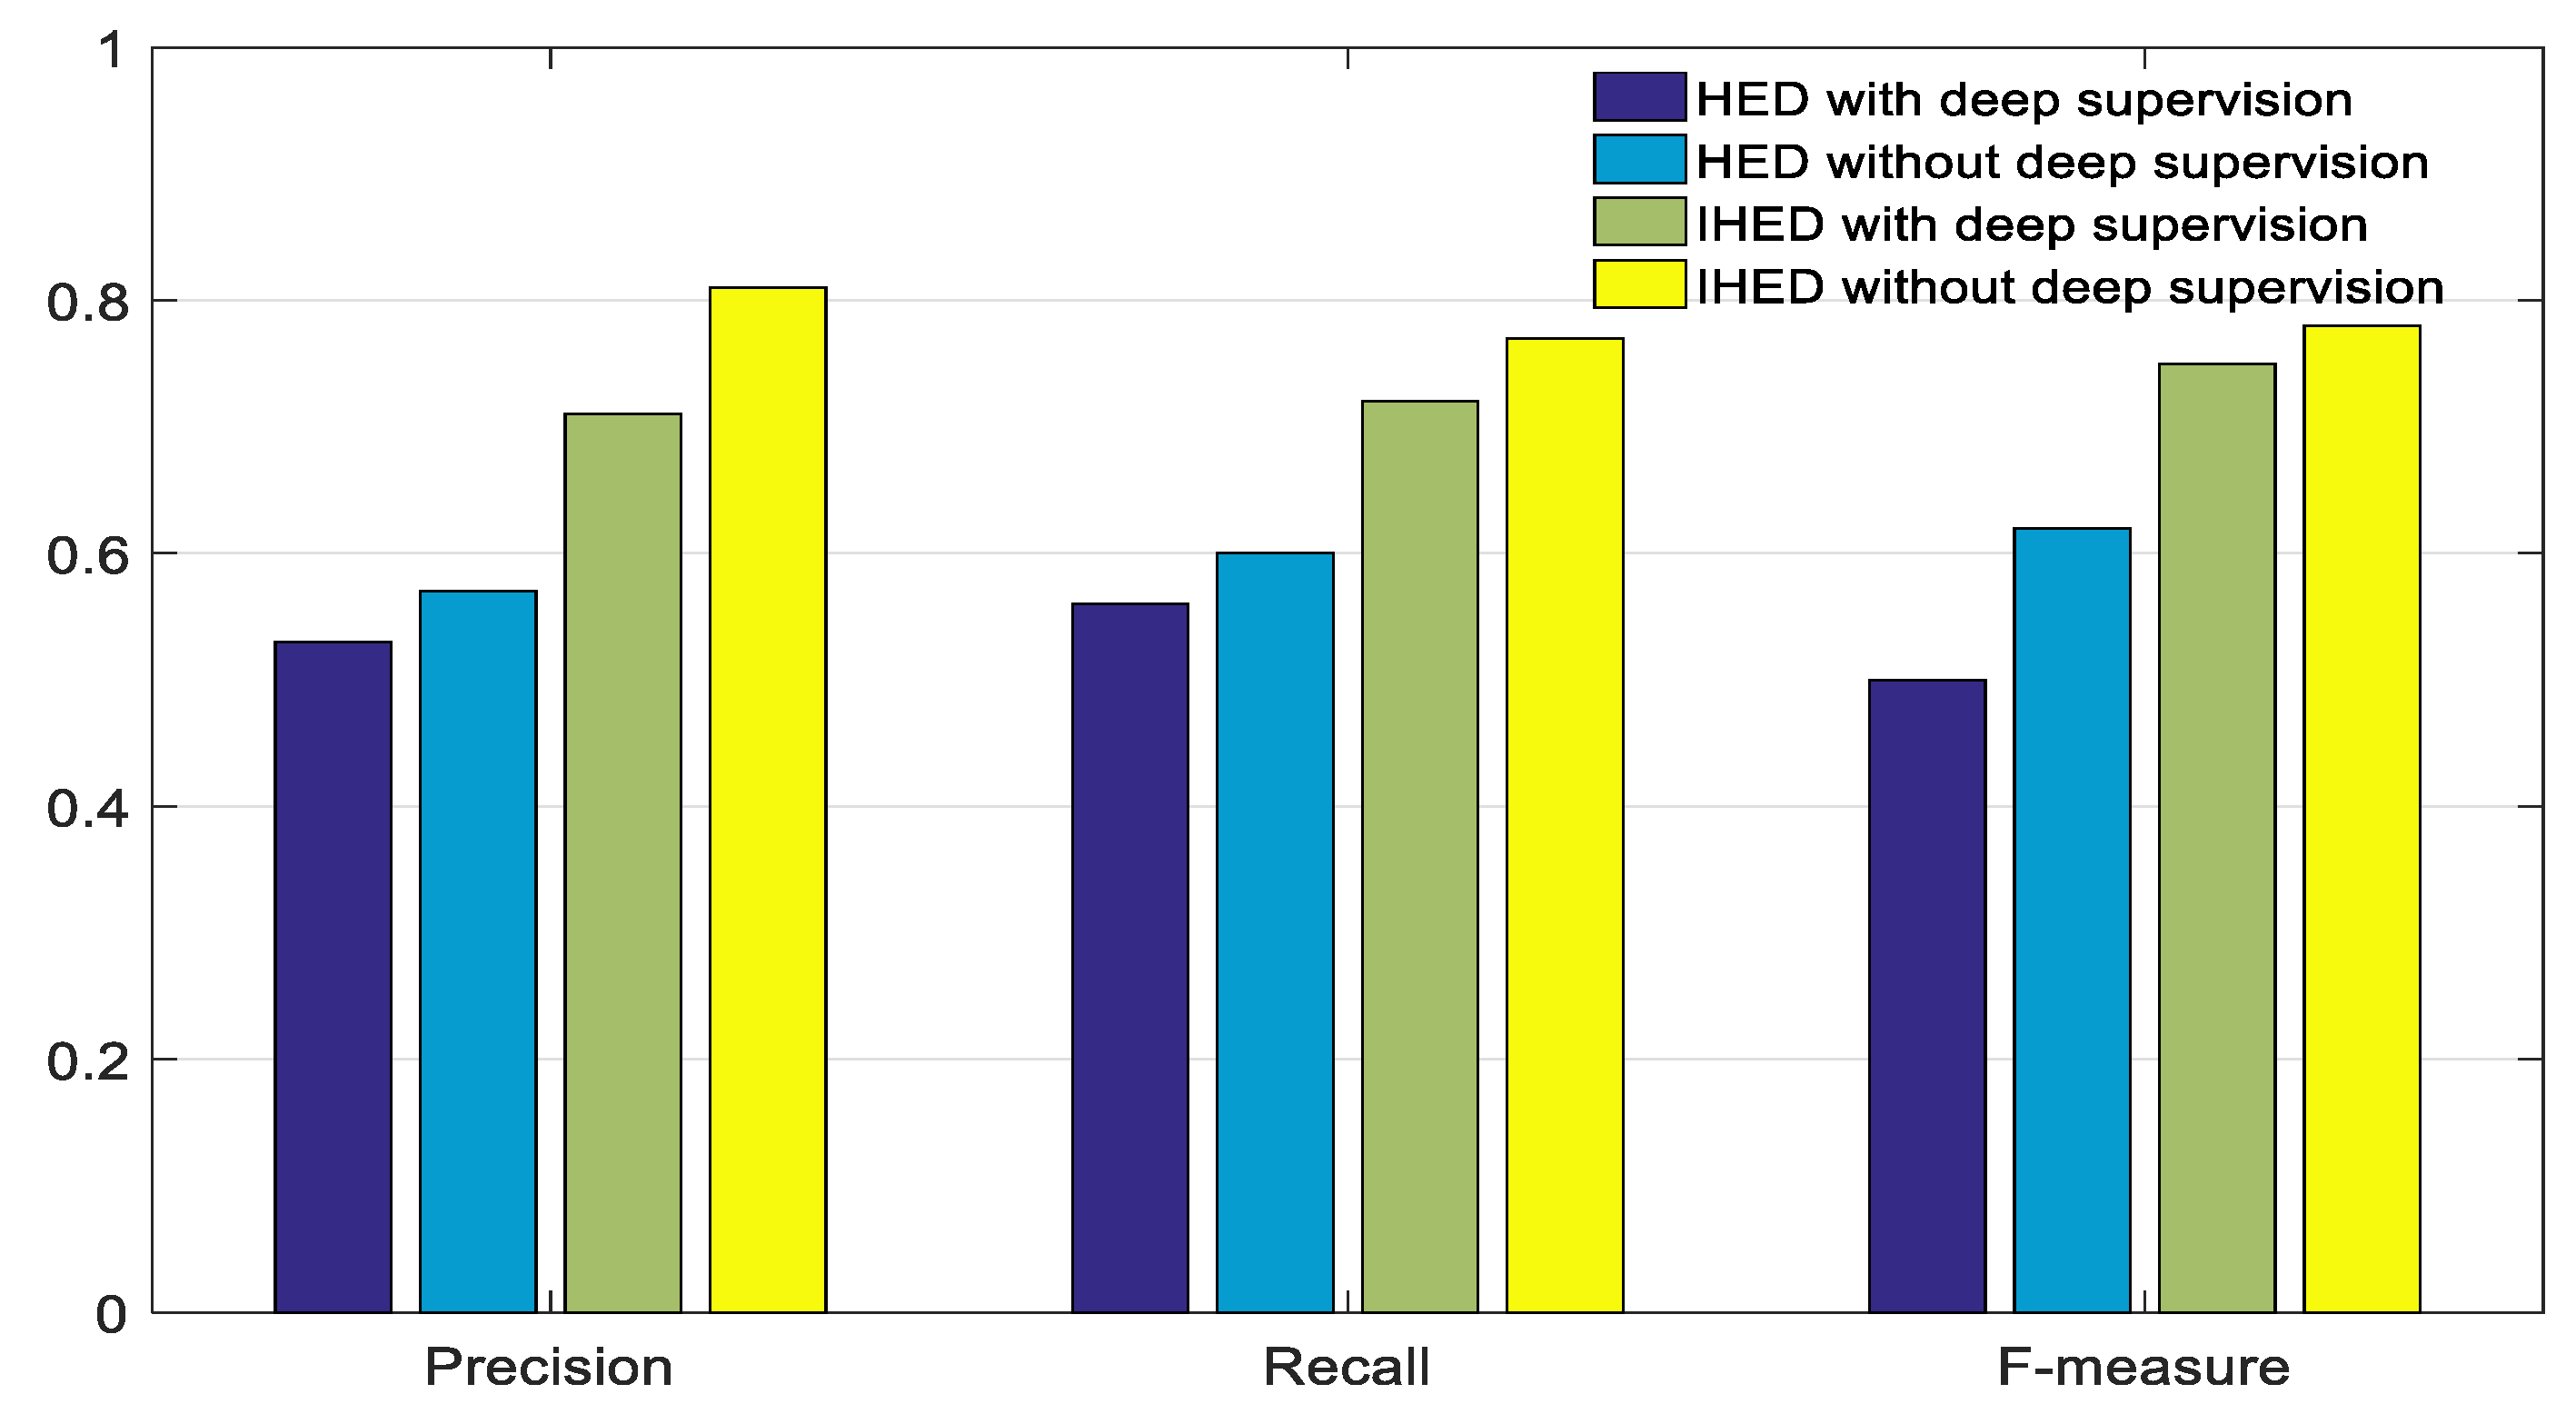
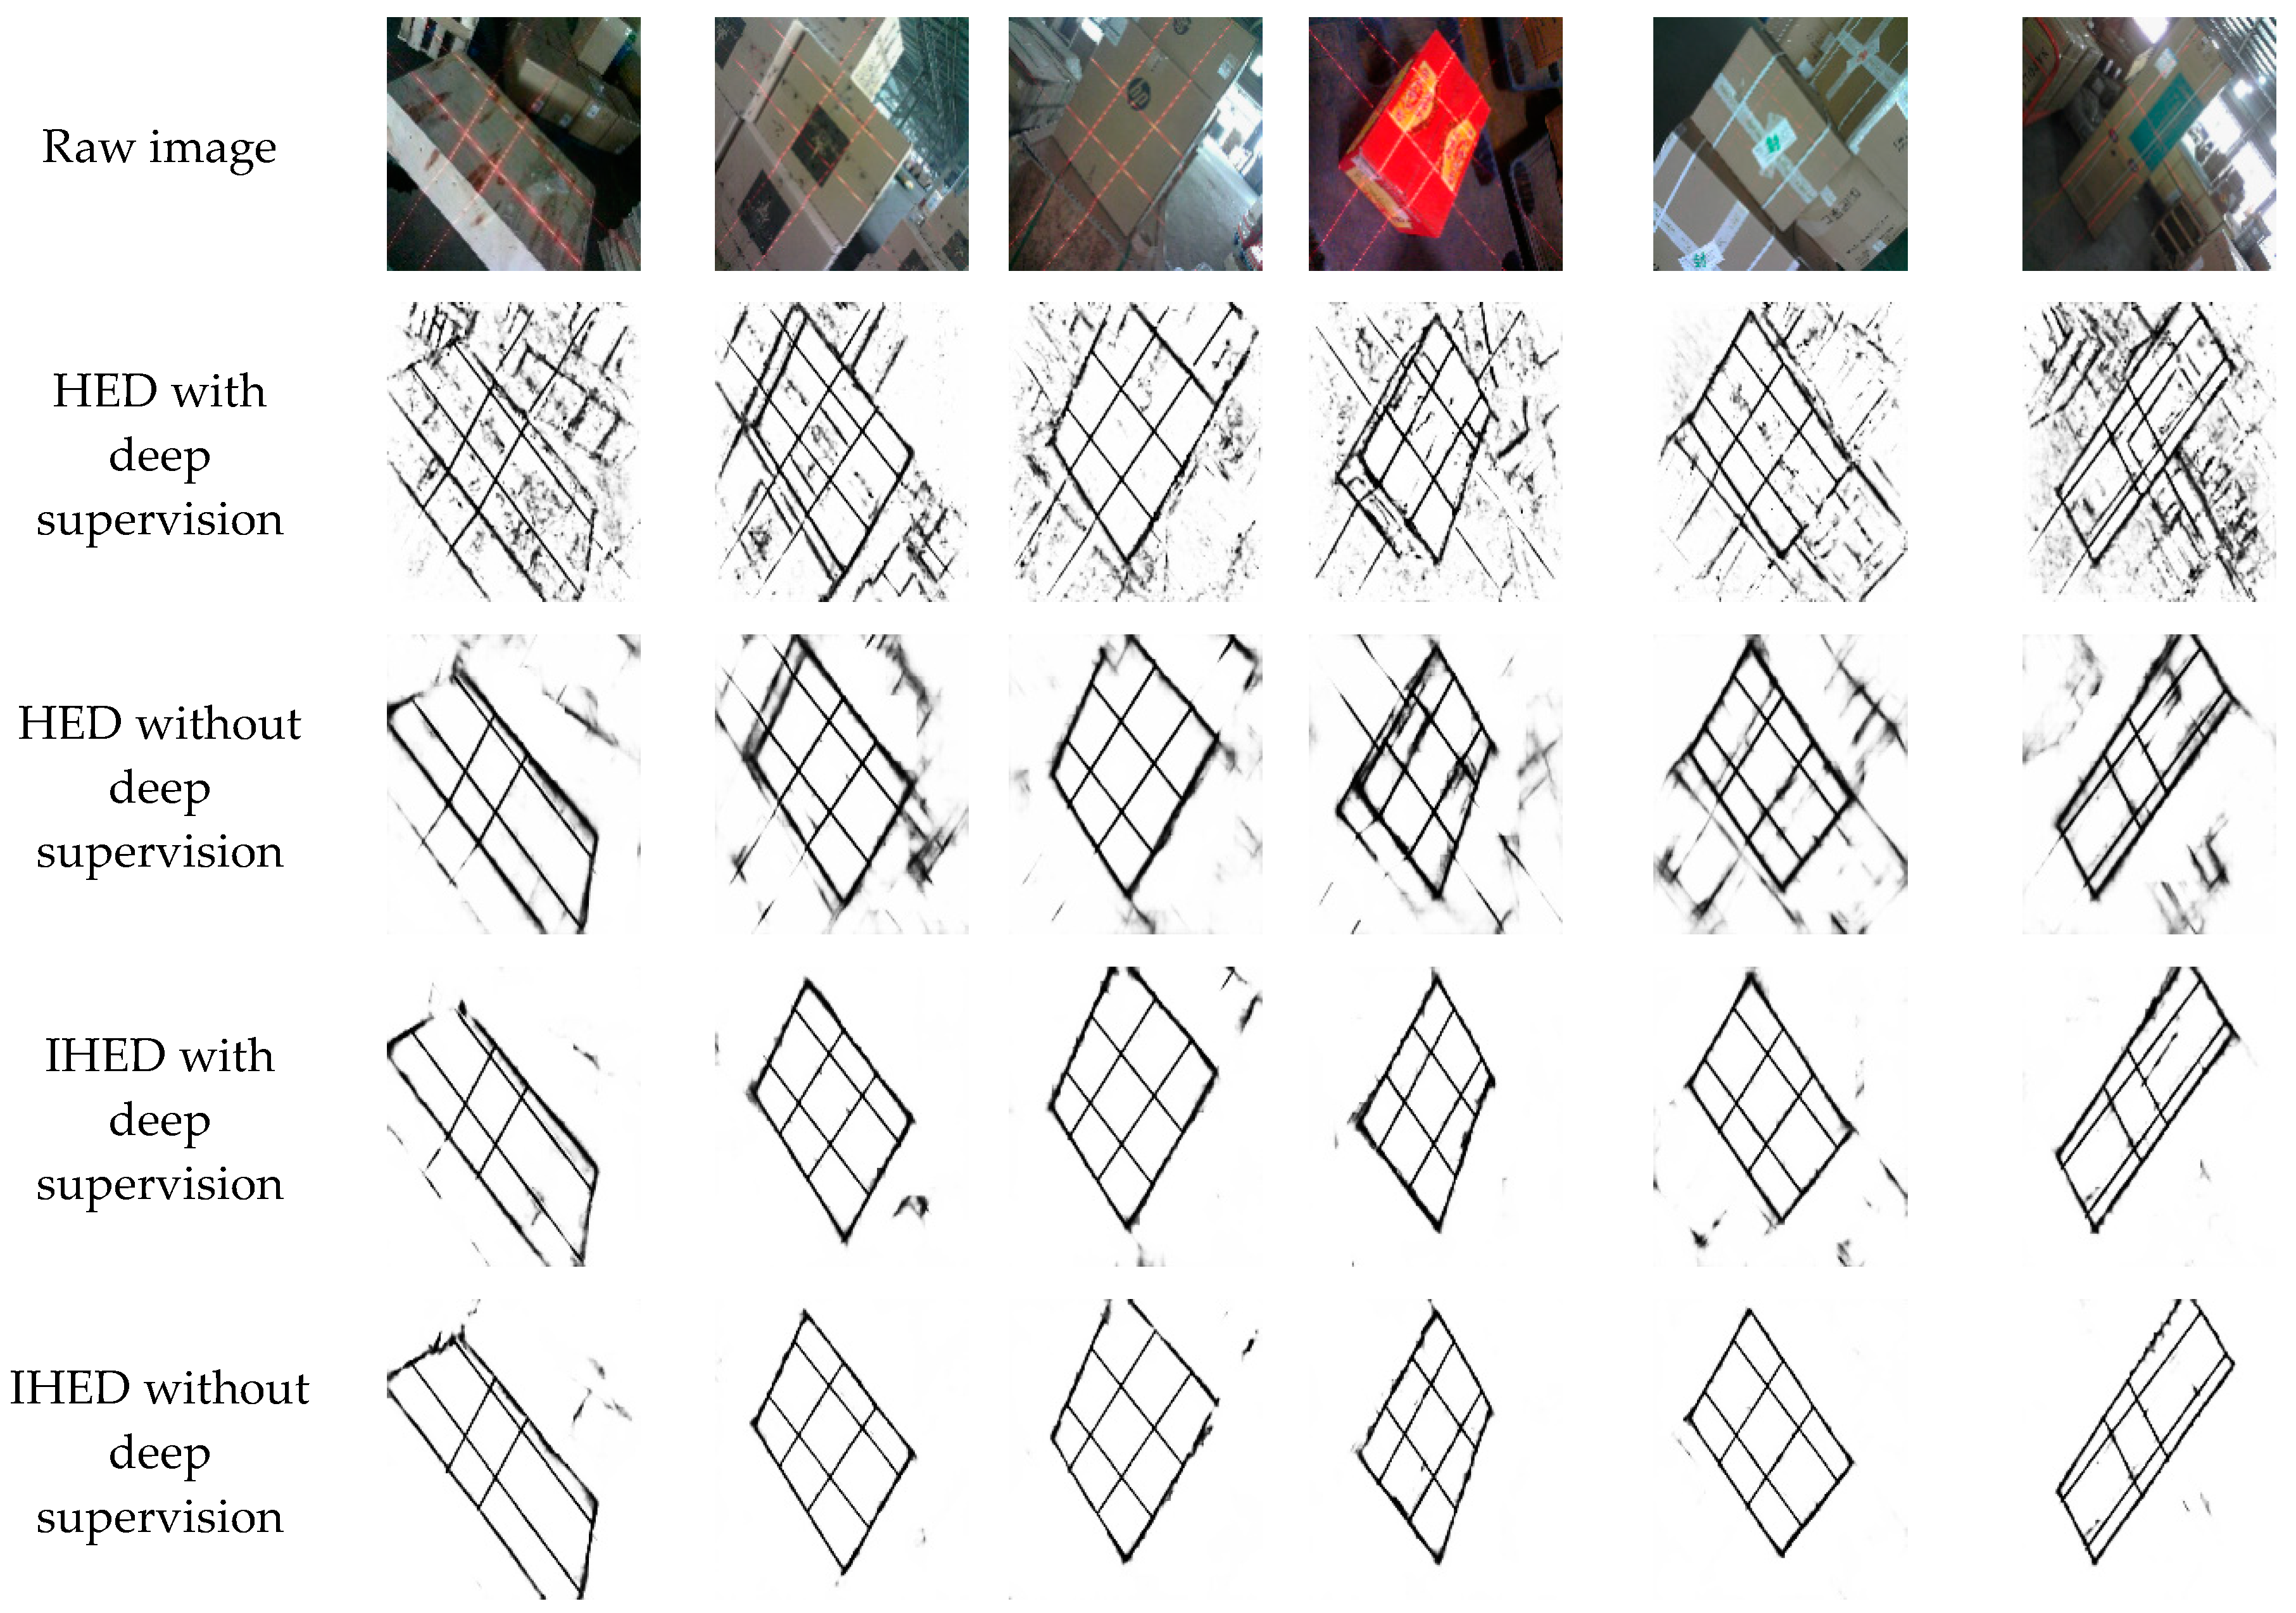
3.4.1. IHED Network for Extracting the Edge of the Laser-Modulated Image
- To achieve the best edge detection effect, we build our own laser-modulated image dataset.
- We cut the first two side output layers. Such an operation can remove considerable low-level edge information.
- A cross-entropy loss/sigmoid layer is connected to the up-sampling layer in each stage without deep supervision.
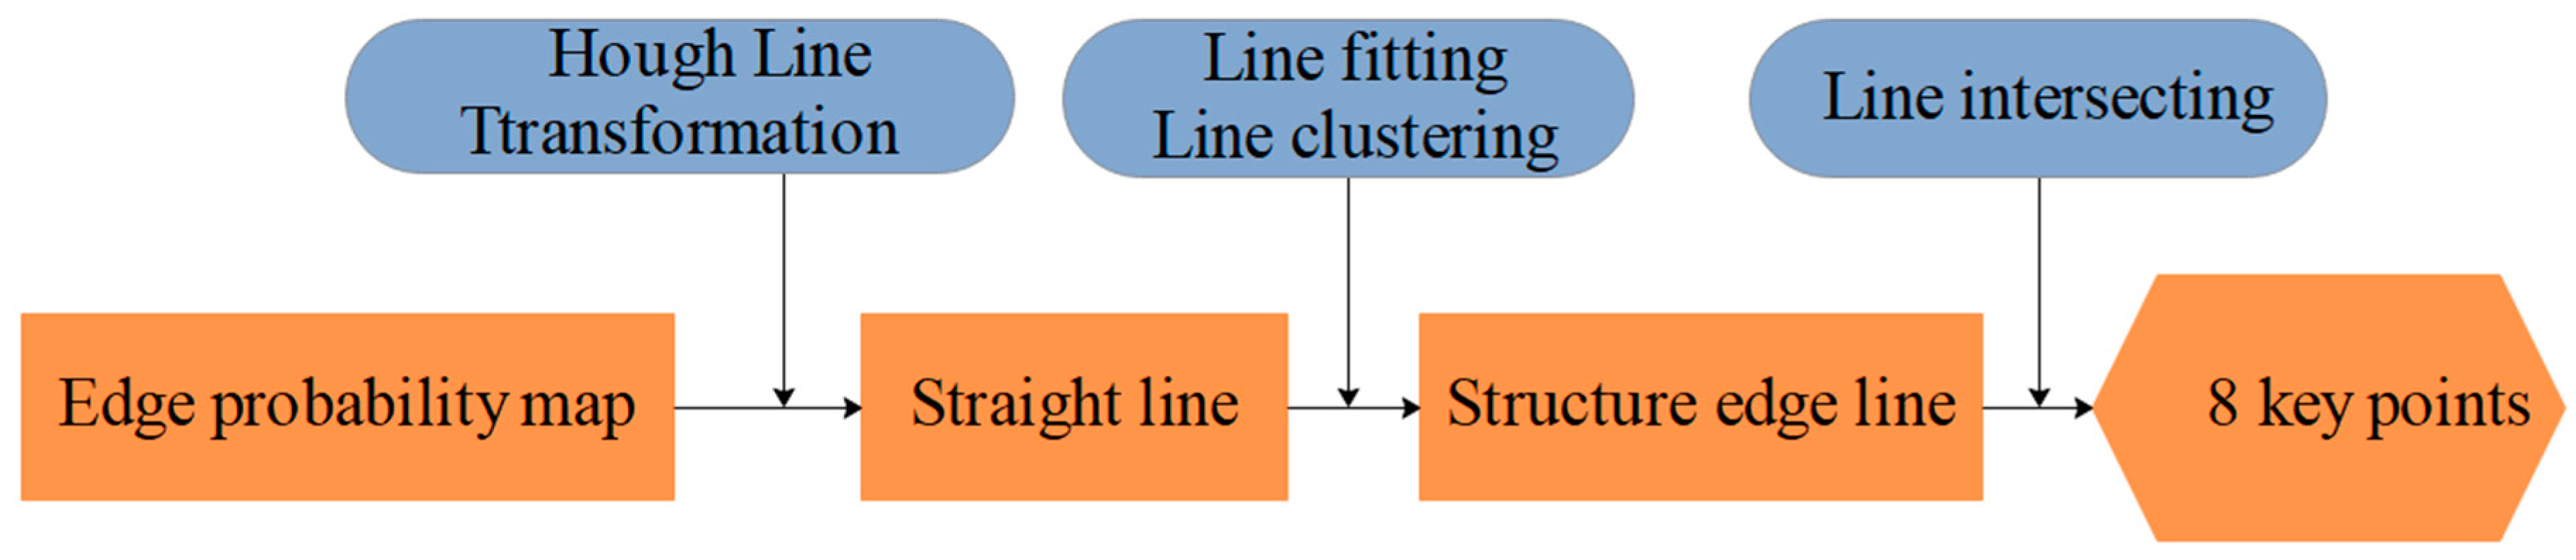
3.4.2. Method for Extracting the 2D Coordinates of the Key Points of the Laser-Modulated Image
4. Experiments
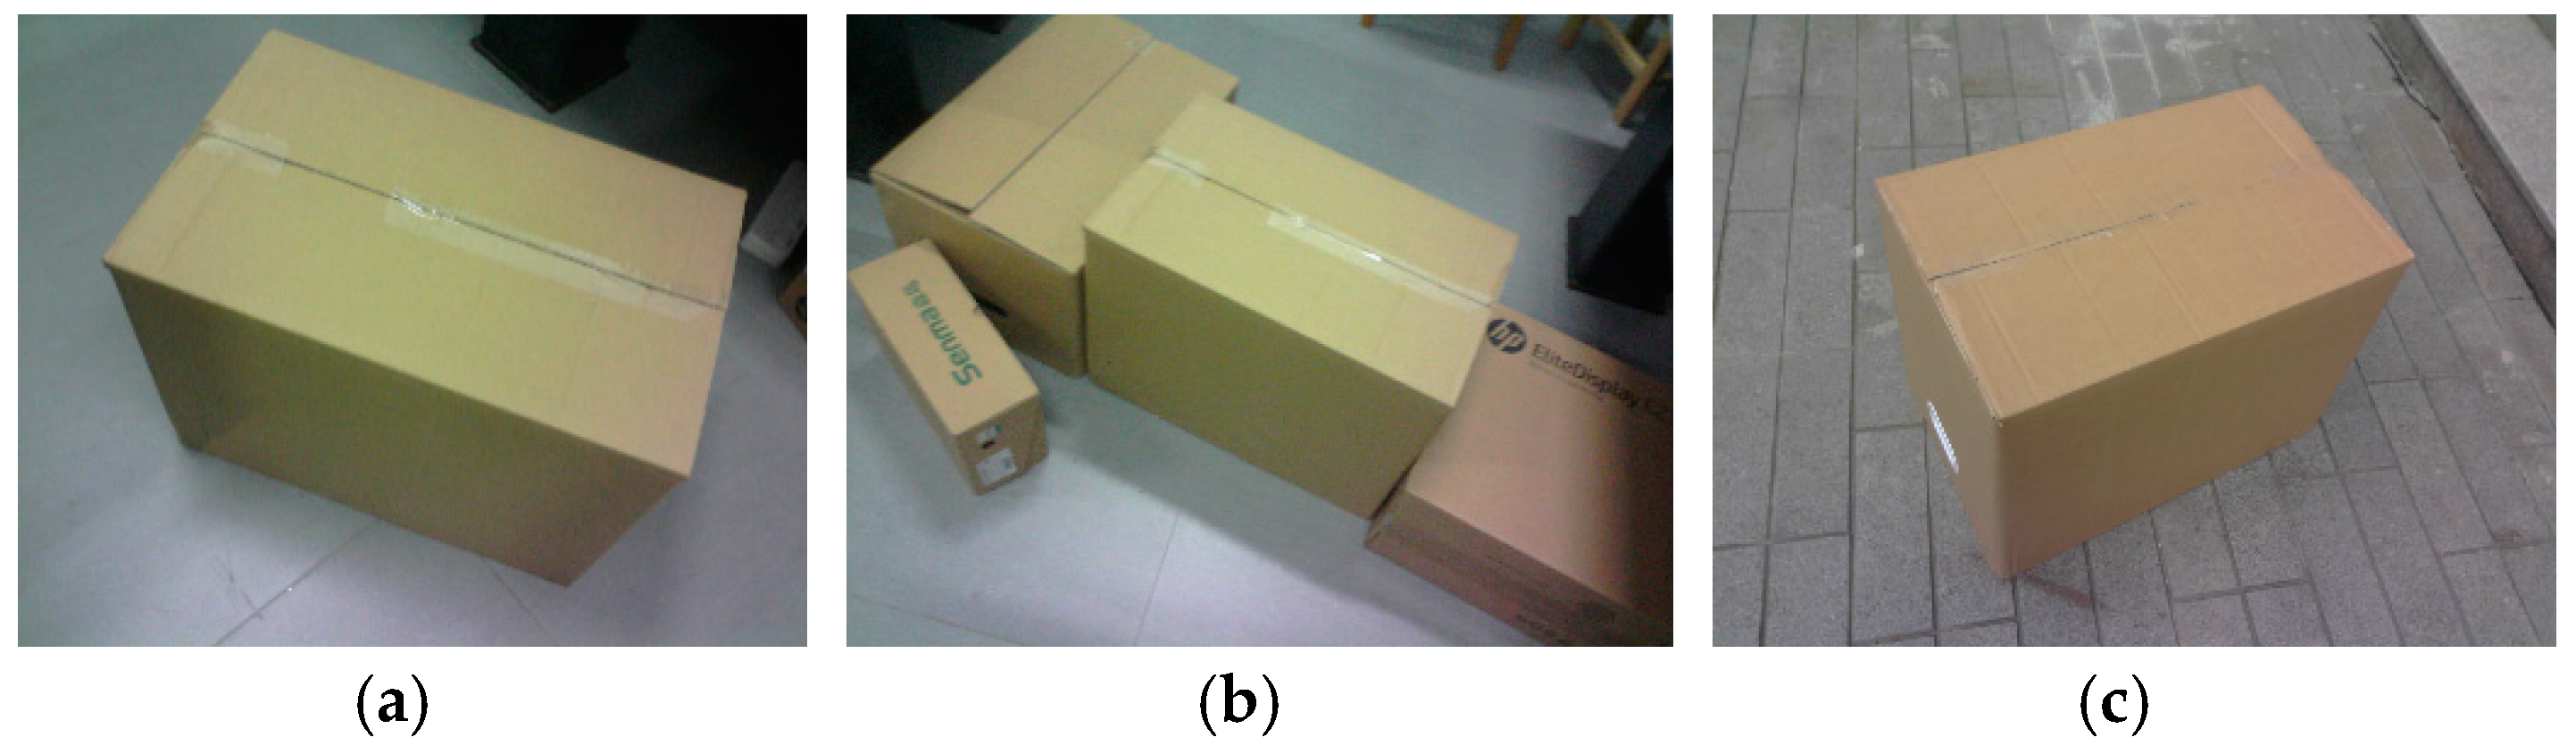
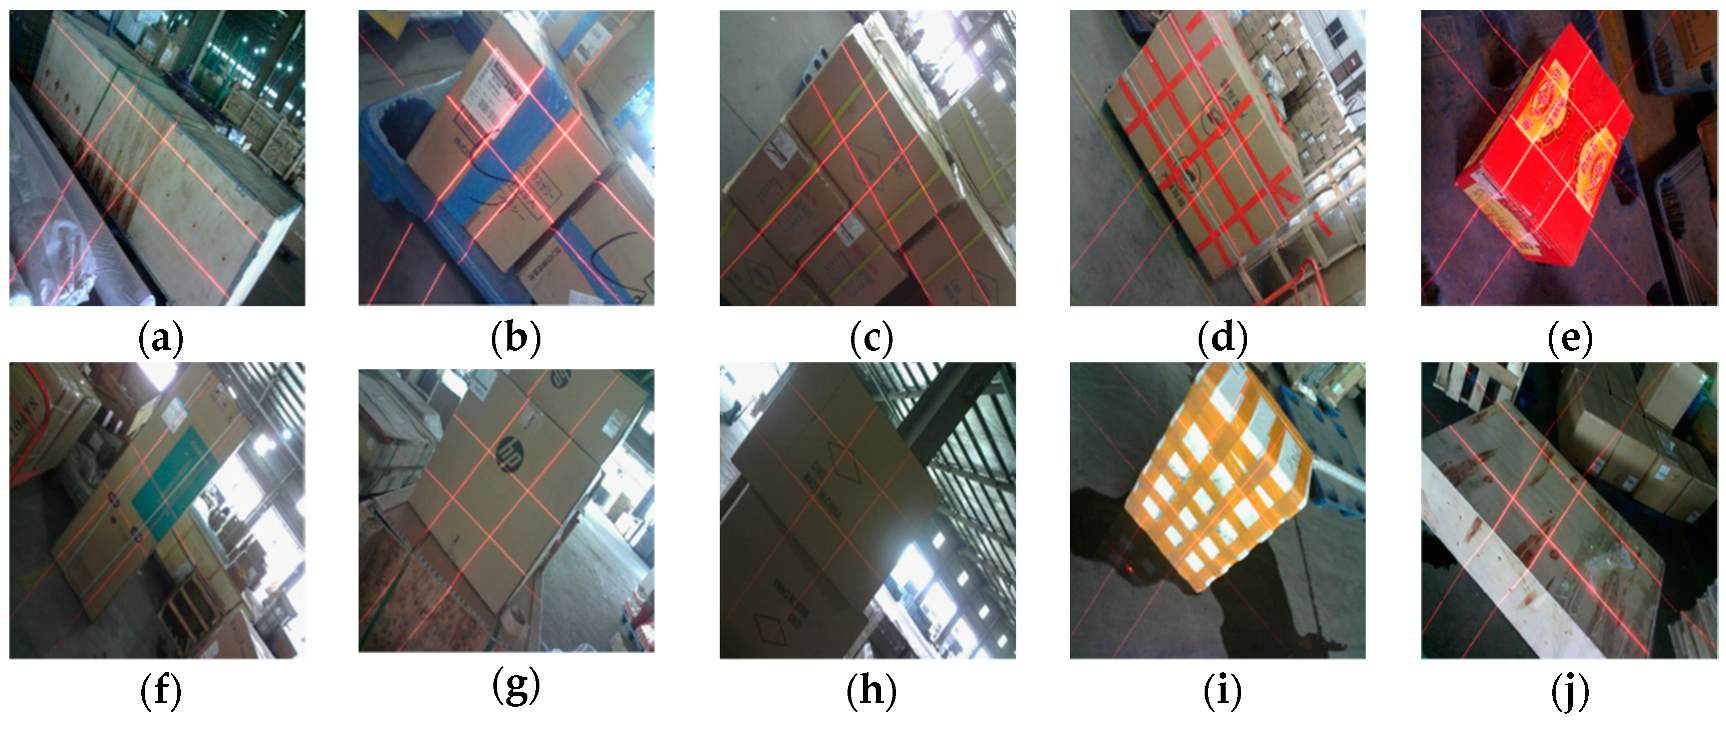
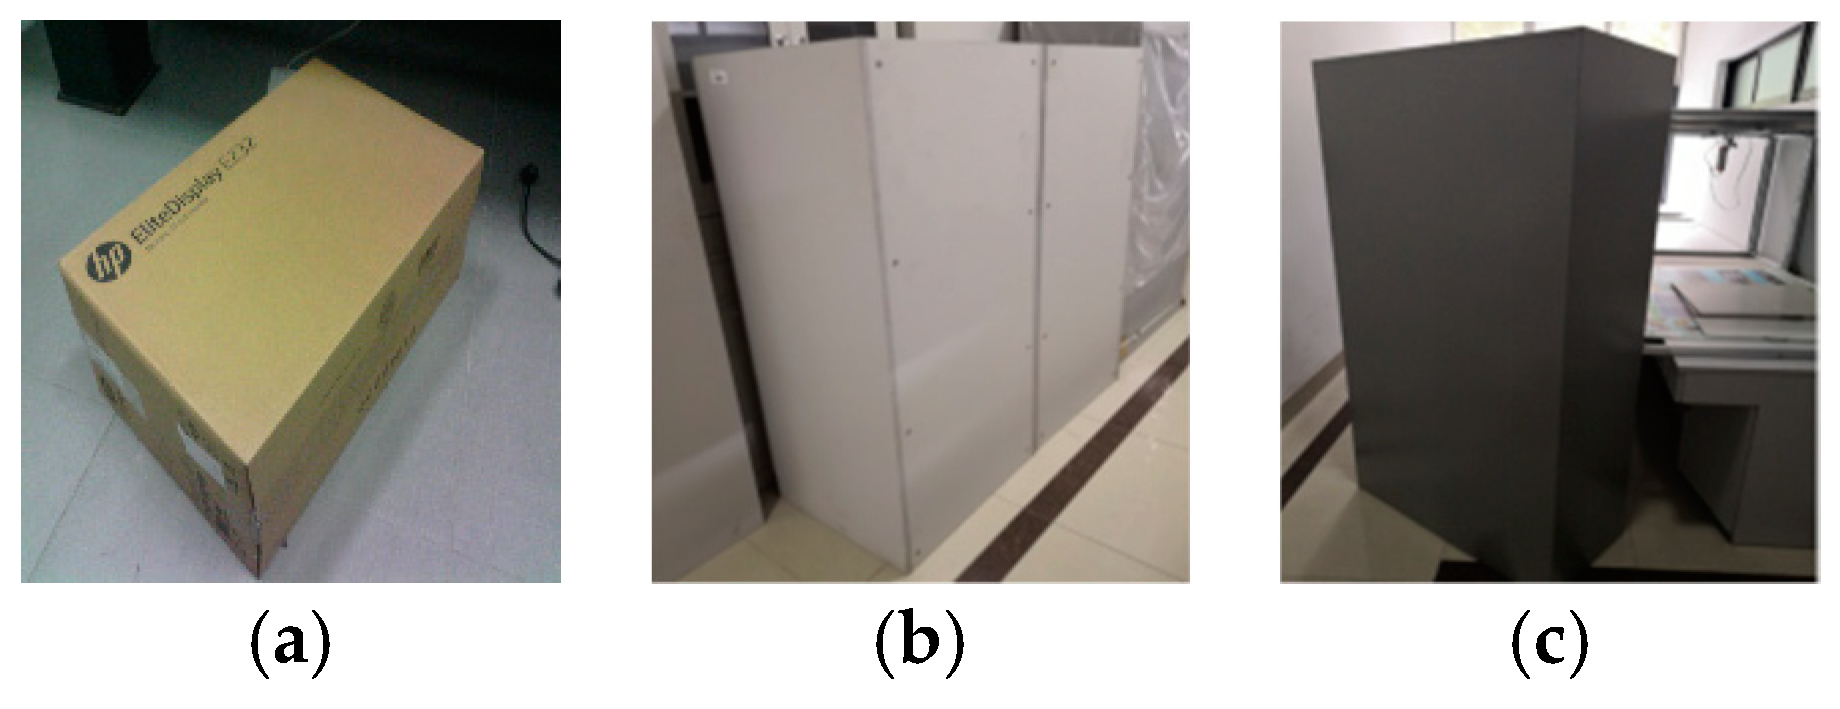
4.1. Measurement Statistical Analysis of Boxes in Complex Scenarios
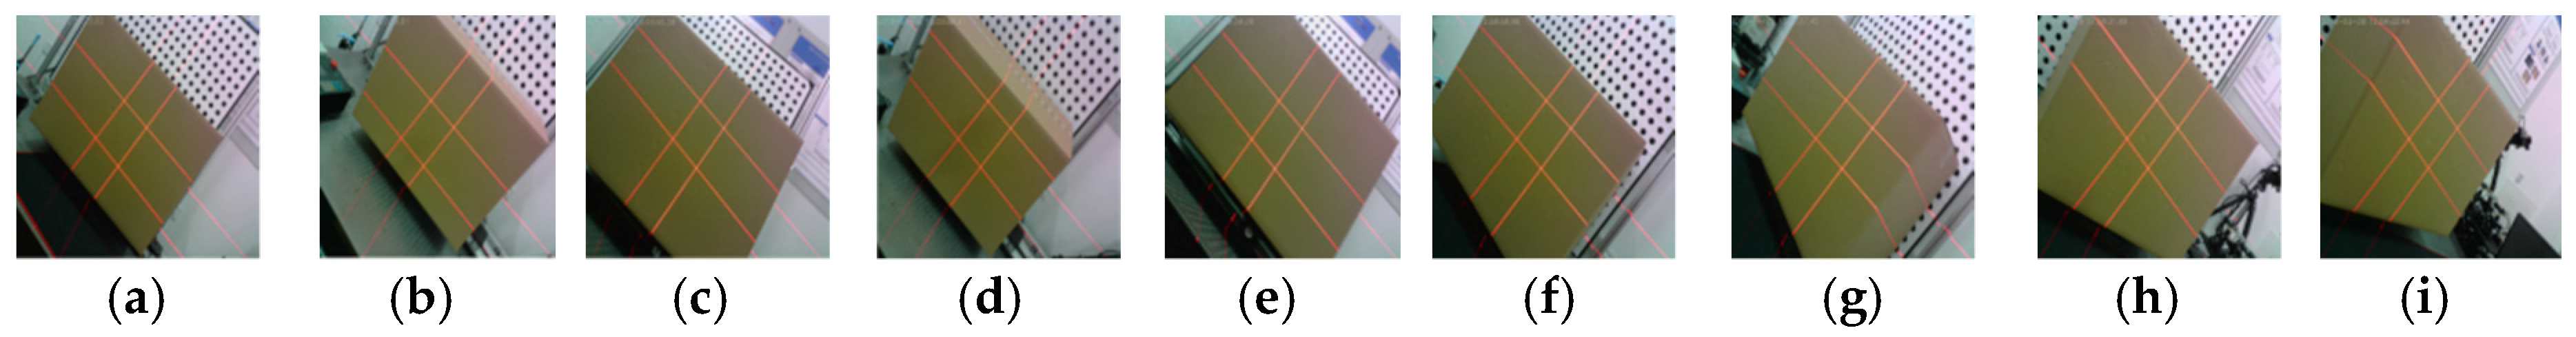
4.2. Pose Stability Testing
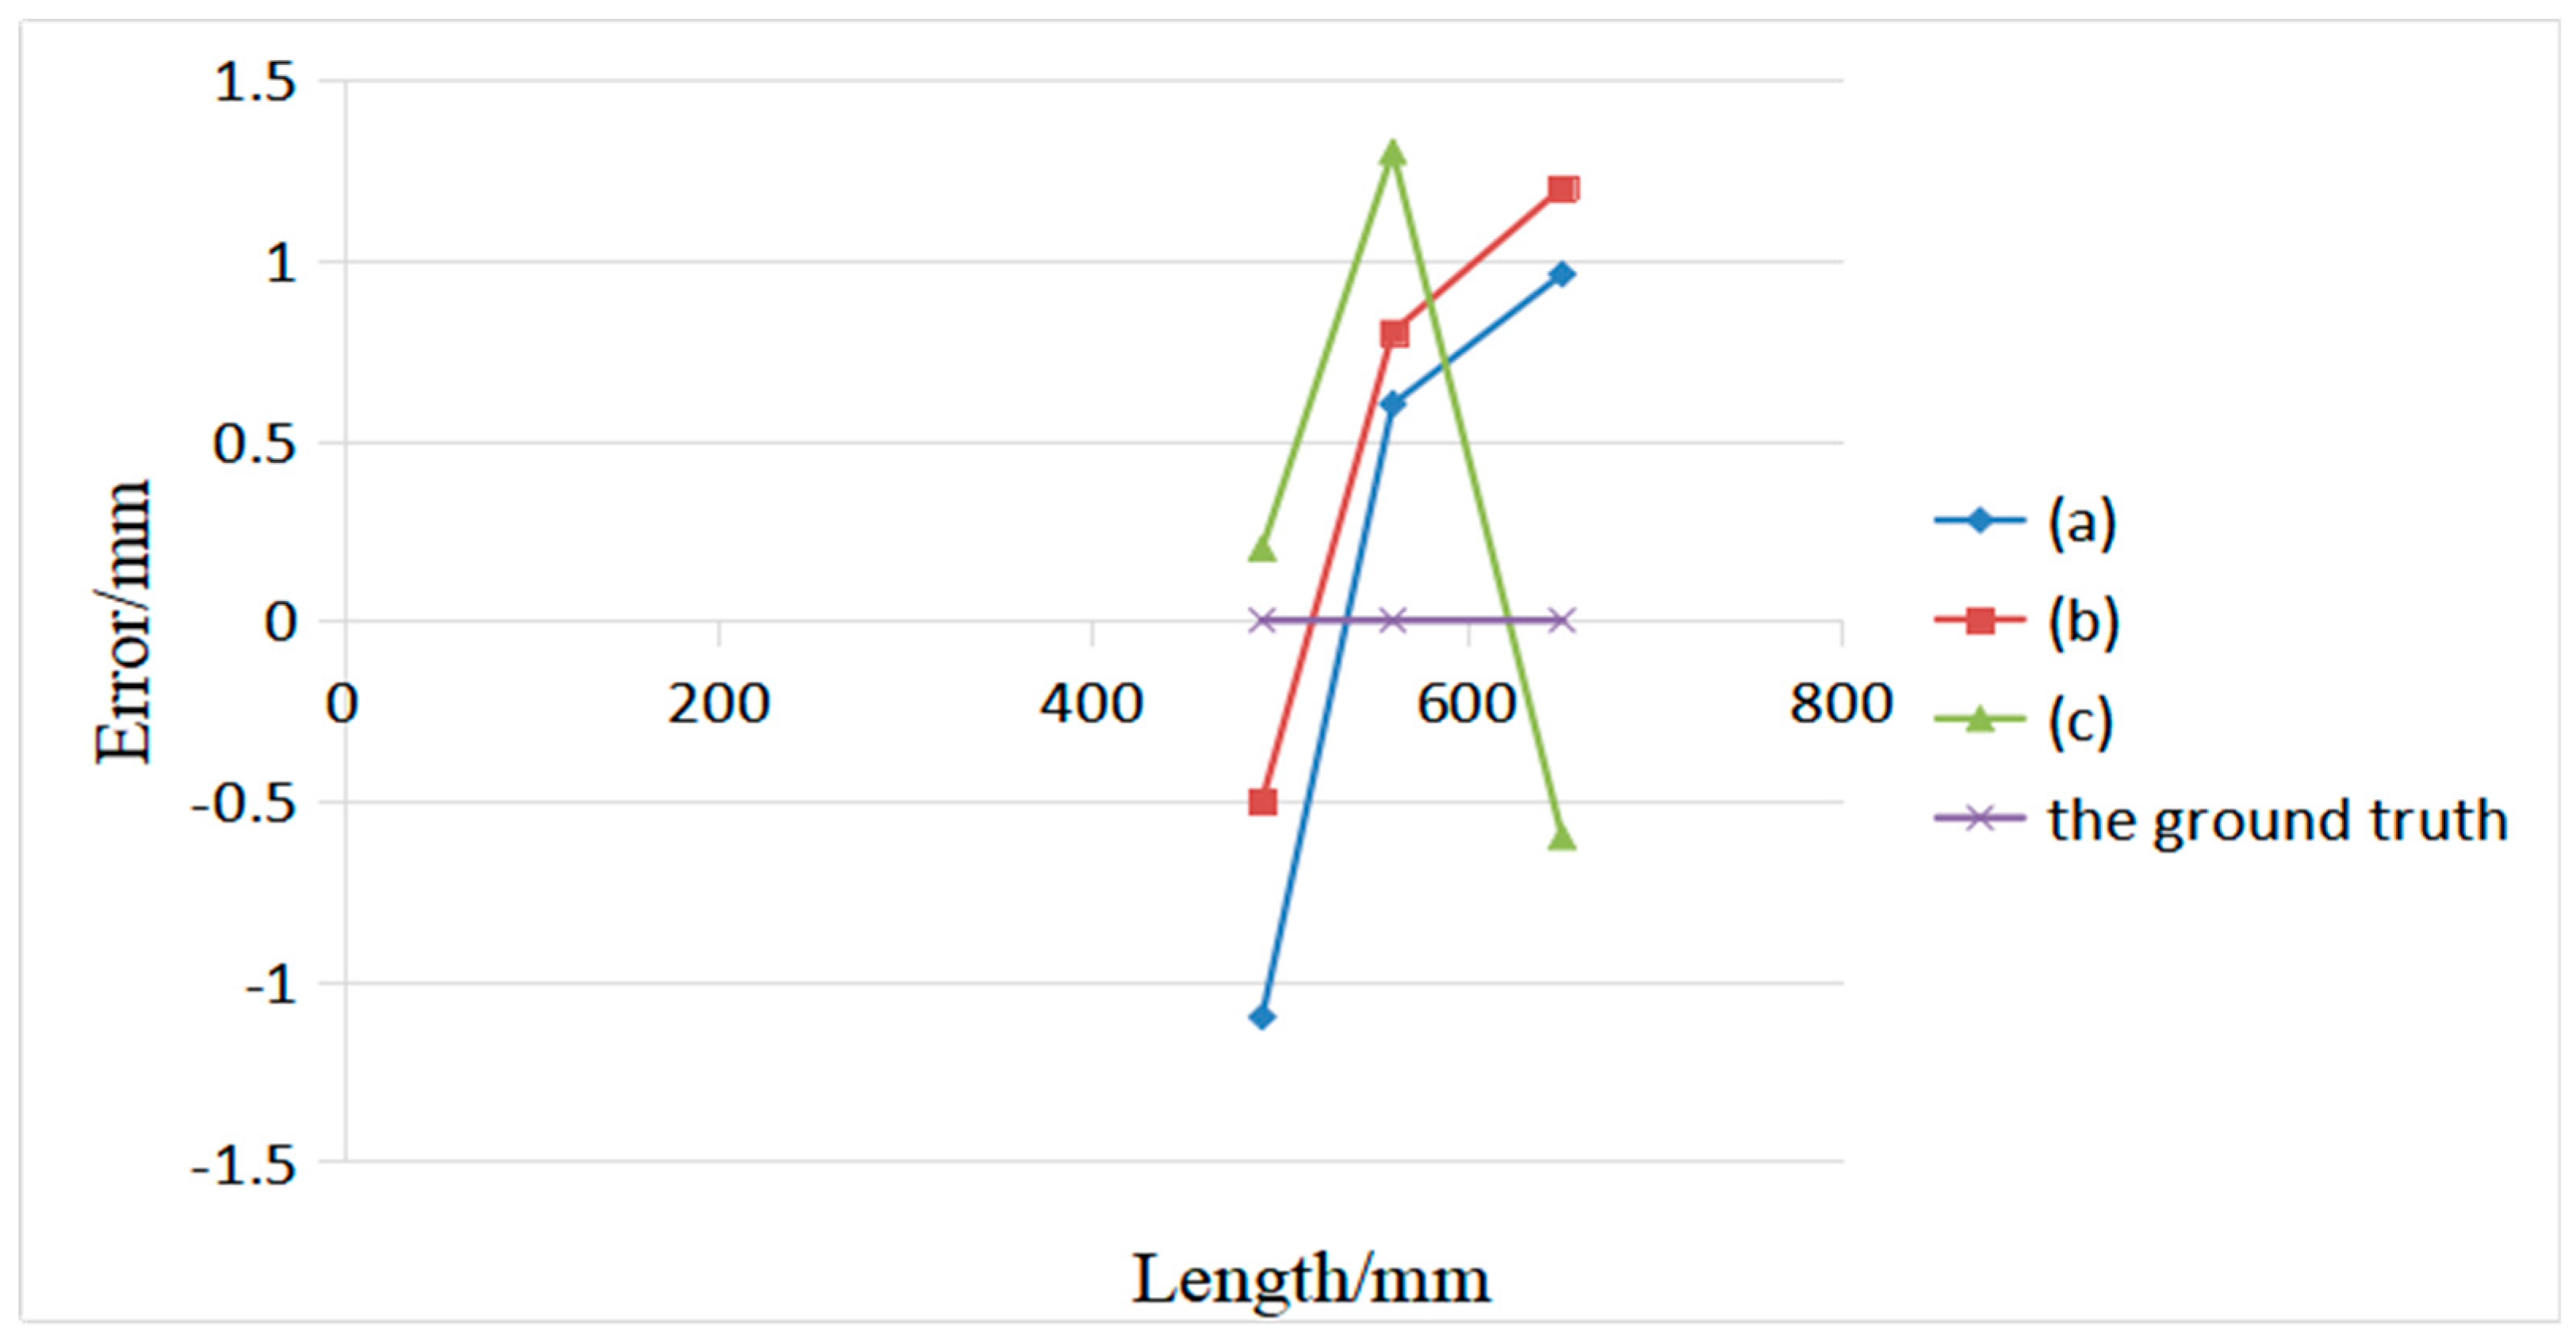
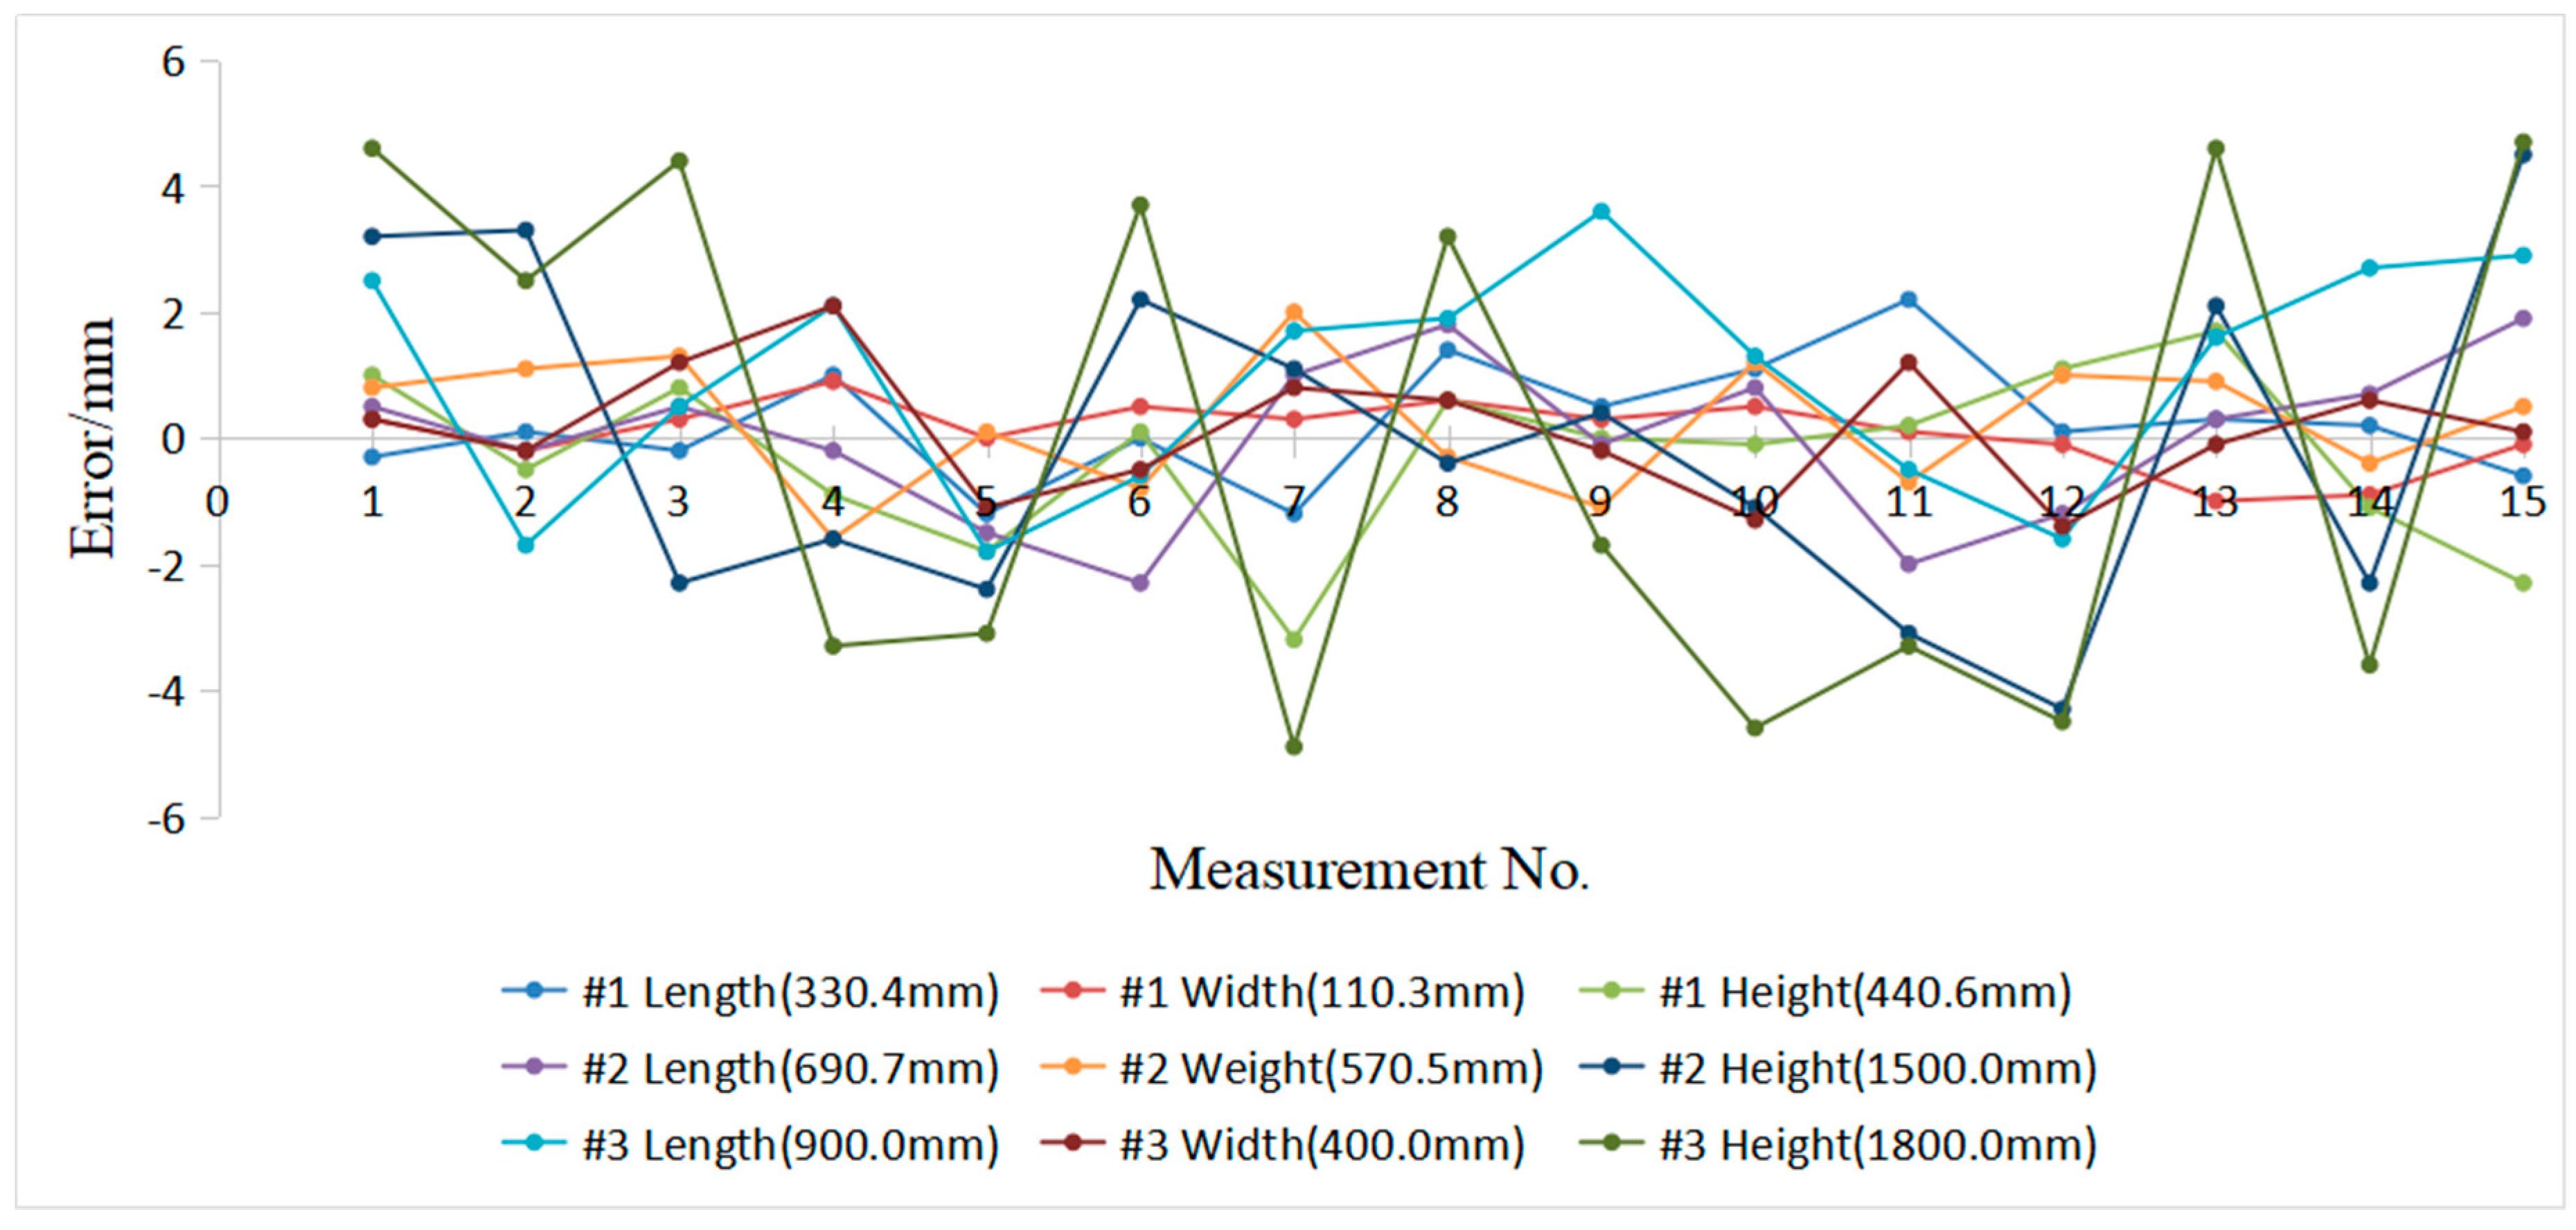
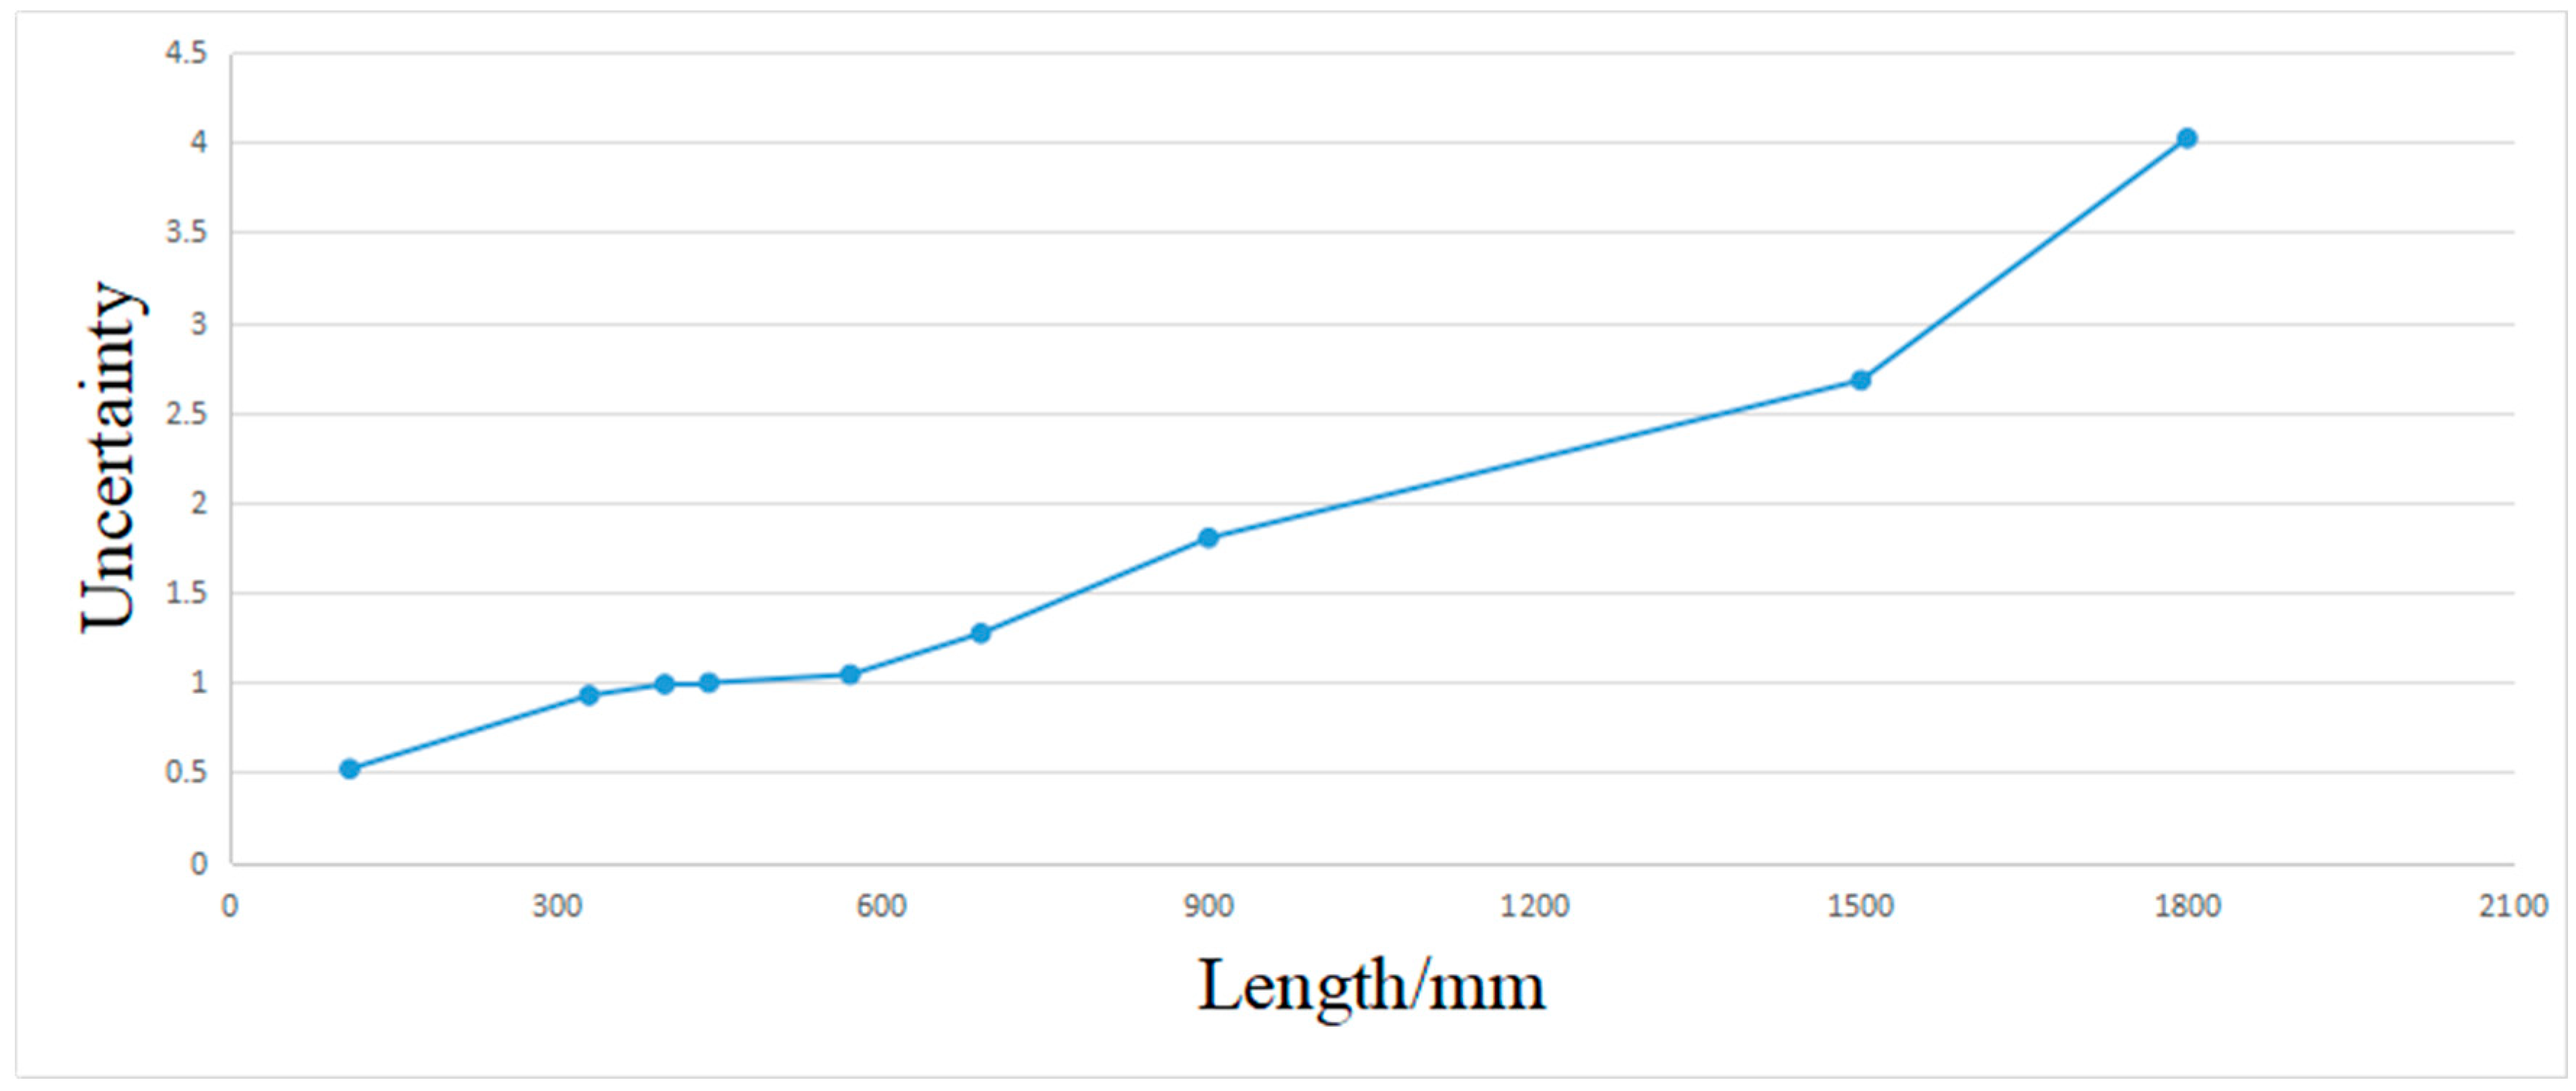
4.3. Error Analysis on Real Box and the Evaluation of Uncertainty in the Measurement Result of Box Volume
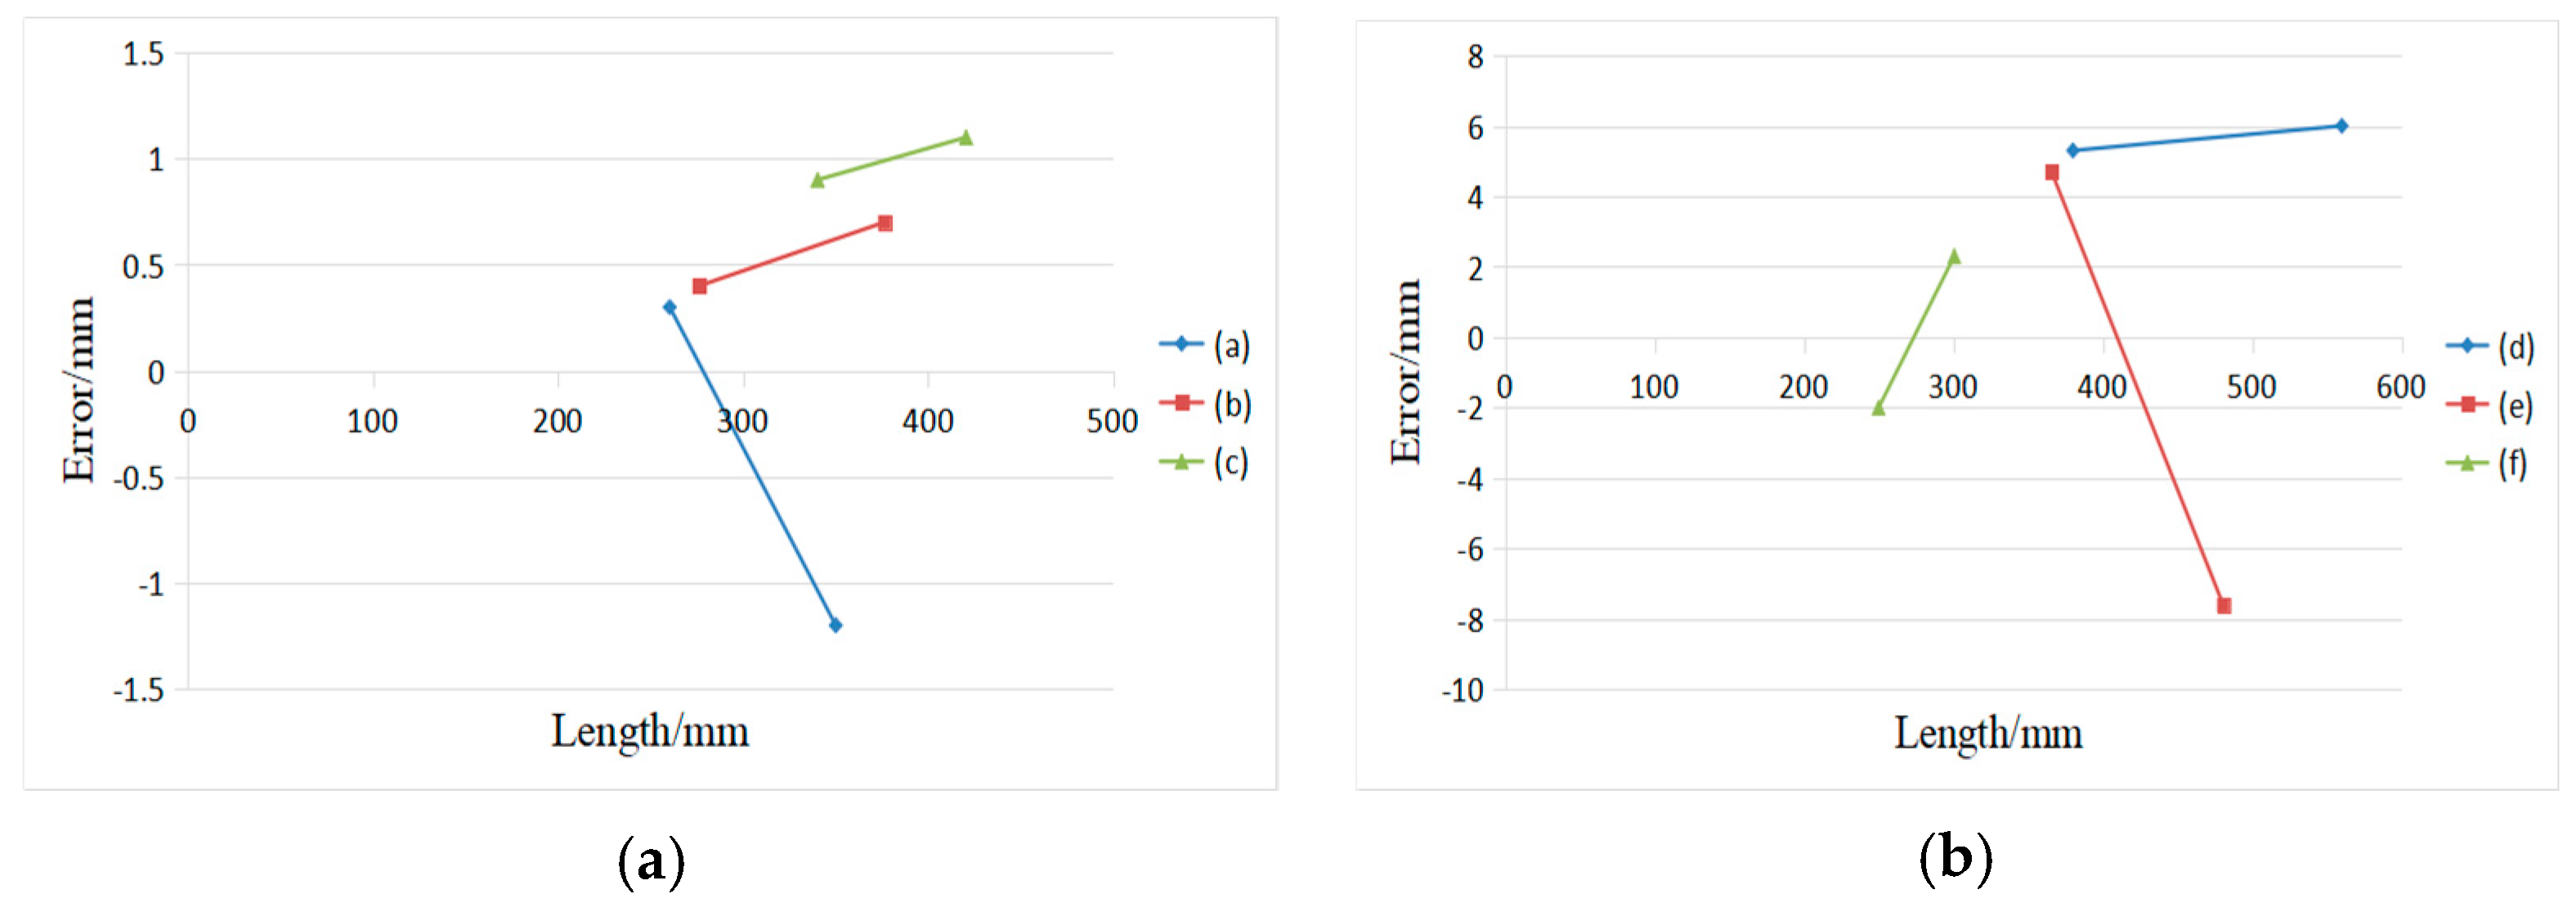
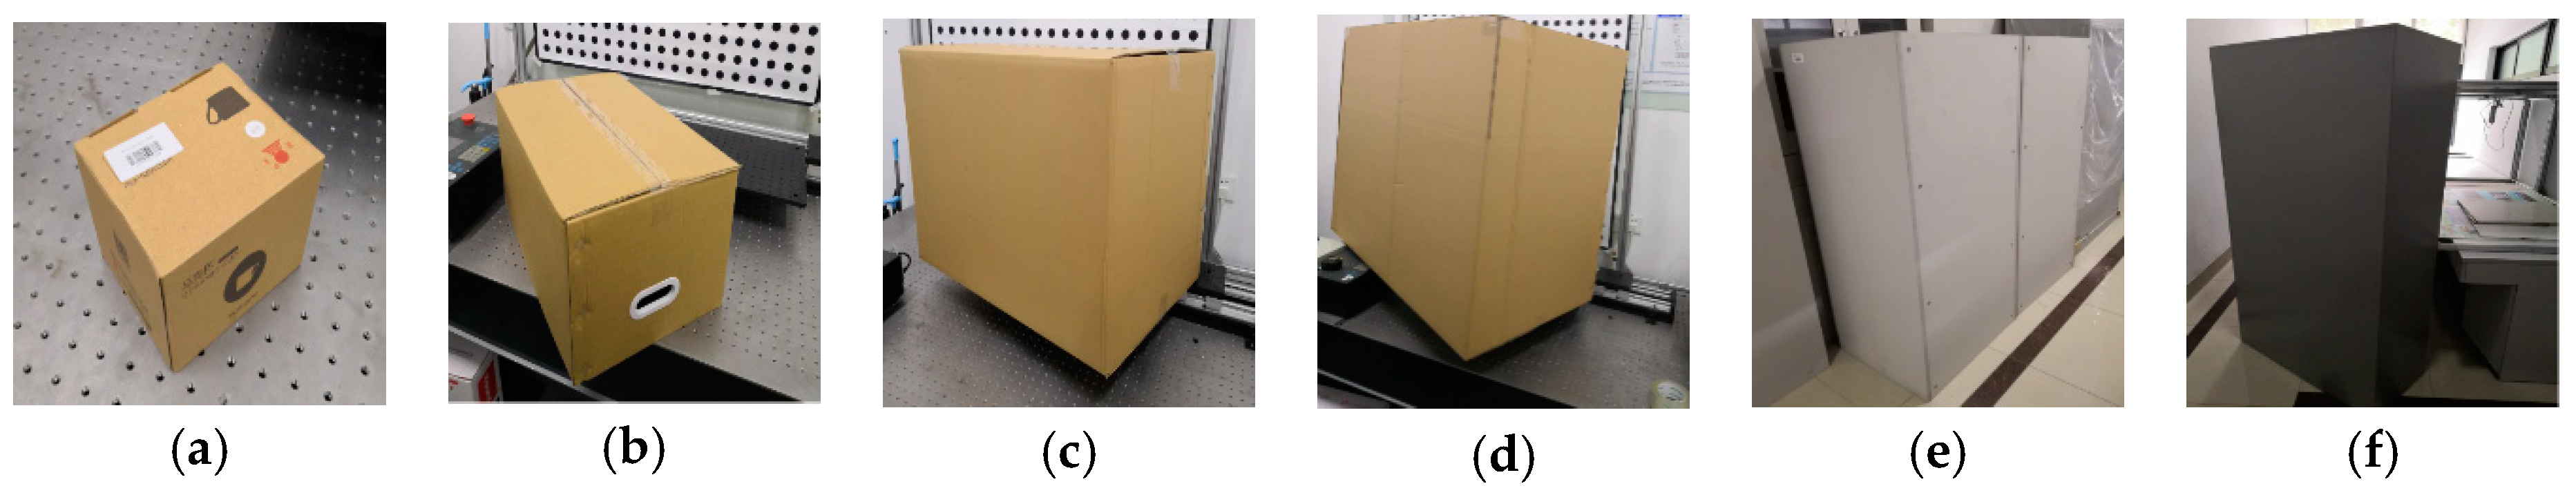
4.4. Measurement Error Analysis of the Optical Quality of the Boxes Surface and the Surface Variation
4.5. Online Measurement Testing
5. Conclusions
Author Contributions
Funding
Conflicts of Interest
References
- Park, H.M.; Van Messemac, A.; De Neveac, W. Box-Scan: An efficient and effective algorithm for box dimension measurement in conveyor systems using a single RGB-D camera. In Proceedings of the 7th IIAE International Conference on Industrial Application Engineering, Kitakyushu, Japan, 26–30 March 2019. [Google Scholar]
- Chan, T.; Lichti, D.; Jahraus, A.; Esfandiari, H.; Lahamy, H.; Steward, J.; Glanzer, M. An Egg Volume Measurement System Based on the Microsoft Kinect. Sensors 2018, 18, 2454. [Google Scholar] [CrossRef] [PubMed]
- Andújar, D.; Dorado, J.; Fernández-Quintanilla, C.; Ribeiro, A. An approach to the use of depth cameras for weed volume estimation. Sensors 2016, 16, 972. [Google Scholar] [CrossRef] [PubMed]
- Leo, M.; Natale, A.; Del-Coco, M.; Carcagnì, P.; Distante, C. Robust estimation of object dimensions and external defect detection with a low-cost sensor. J. Nondestruct. Eval. 2017, 36, 17. [Google Scholar] [CrossRef]
- Ferreira, B.Q.; Griné, M.; Gameiro, D.; Costeira, J.P.; Santos, B.S. VOLUMNECT: Measuring volumes with Kinect. In Three-Dimensional Image Processing, Measurement (3DIPM), and Applications 2014; Proceeding SPIE 9013; SPIE: Bellingham, WA, USA, 2014. [Google Scholar]
- Wang, W.; Liu, P.; Ying, R.; Wang, J.; Qian, J.; Jia, J.; Gao, J. A High-Computational Efficiency Human Detection and Flow Estimation Method Based on TOF Measurements. Sensors 2019, 19, 729. [Google Scholar] [CrossRef] [PubMed]
- Wang, Z.; Walsh, K.; Verma, B. On-tree mango fruit size estimation using RGB-D images. Sensors 2017, 17, 2738. [Google Scholar] [CrossRef] [PubMed]
- Mustafah, Y.M.; Noor, R.; Hasbi, H.; Azma, A.W. Stereo vision images processing for real-time object distance and size measurements. In Proceedings of the 2012 International Conference on Computer and Communication Engineering (ICCCE), Kuala Lumpur, Malaysia, 3–5 July 2012; pp. 659–663. [Google Scholar]
- Ge, L.; Yang, Z.; Sun, Z.; Zhang, G.; Zhang, M.; Zhang, K.; Zhang, C.; Tan, Y.; Li, W. A method for broccoli seedling recognition in natural environment based on binocular stereo vision and gaussian mixture model. Sensors 2019, 19, 1132. [Google Scholar] [CrossRef] [PubMed]
- Makhsous, S.; Mohammad, H.M.; Schenk, J.M.; Mamishev, A.V.; Kristal, A.R. A Novel Mobile Structured Light System in Food 3D Reconstruction and Volume Estimation. Sensors 2019, 19, 564. [Google Scholar] [CrossRef]
- Shang, J.; Duong, M.; Pepin, E.; Zhang, X.; Sandara-Rajan, K.; Mamishev, A.; Kristal, A. A mobile structured light system for food volume estimation. In Proceedings of the 2011 IEEE International Conference on Computer Vision Workshops (ICCV Workshops), Barcelona, Spain, 7 November 2011; pp. 100–101. [Google Scholar]
- Sarbolandi, H.; Lefloch, D.; Kolb, A. Kinect range sensing: Structured-light versus Time-of-Flight Kinect. Comput. Vis. Image Underst. 2015, 139, 20. [Google Scholar] [CrossRef]
- Liberadzki, P.; Adamczyk, M.; Witkowski, M.; Sitnik, R. Structured-Light-Based System for Shape Measurement of the Human Body in Motion. Sensors 2018, 18, 2827. [Google Scholar] [CrossRef]
- Fernandes, L.A.; Oliveira, M.M.; da Silva, R.; Crespo, G.J. A fast and accurate approach for computing the dimensions of boxes from single perspective images. J. Braz. Comput. Soc. 2006, 12, 19–30. [Google Scholar] [CrossRef] [Green Version]
- Wang, X.; Xie, Z.; Wang, K.; Zhou, L. Research on a Handheld 3D Laser Scanning System for Measuring Large-Sized Objects. Sensors 2018, 18, 3567. [Google Scholar] [CrossRef]
- Pan, X.; Liu, Z.; Zhang, G. Reliable and Accurate Wheel Size Measurement under Highly Reflective Conditions. Sensors 2018, 18, 4296. [Google Scholar] [CrossRef] [PubMed]
- Zhang, Z.Y. A flexible new technique for camera calibration. IEEE Trans. Pattern Anal. Mach. Intell. 2000, 22, 1330–1334. [Google Scholar] [CrossRef]
- Santolaria, J.; Guillomía, D.; Cajal, C.; Albajez, J.A.; Aguilar, J.J. Modelling and calibration technique of laser triangulation sensors for integration in robot arms and articulated arm coordinate measuring machines. Sensors 2009, 9, 7374–7396. [Google Scholar] [CrossRef]
- Li, Y.F.; Chen, S.Y. Automatic recalibration of an active structured light vision system. IEEE Trans. Robot. Autom. 2003, 19, 259–268. [Google Scholar] [CrossRef]
- An, Y.; Bell, T.; Li, B.; Xu, J.; Zhang, S. Method for large-range structured light system calibration. Appl. Opt. 2016, 55, 9563–9572. [Google Scholar] [CrossRef] [PubMed]
- Zhang, G.; Liu, Z.; Sun, J.; Wei, Z. Novel calibration method for a multi-sensor visual measurement system based on structured light. Opt. Eng. 2010, 49, 043602. [Google Scholar] [CrossRef]
- Bazargani, H.; Laganière, R. Camera calibration and pose estimation from planes. IEEE Instrum. Meas. Mag. 2015, 18, 20–27. [Google Scholar] [CrossRef]
- Rodríguez, J.A.M.; Mejía Alanís, F.C. Binocular self-calibration performed via adaptive genetic algorithm based on laser line imaging. J. Mod. Opt. 2016, 63, 1219–1232. [Google Scholar] [CrossRef]
- Muñoz-Rodriguez, J.A. Mobile calibration based on laser metrology and approximation networks. Sensors 2010, 10, 7681–7704. [Google Scholar] [CrossRef]
- Muñoz-Rodriguez, J.A. Microscope self-calibration based on micro laser line imaging and soft computing algorithms. Opt. Lasers Eng. 2018, 105, 75–85. [Google Scholar] [CrossRef]
- Long, J.; Shelhamer, E.; Darrell, T. Fully convolutional networks for semantic segmentation. IEEE Trans. Pattern Anal. Mach. Intell. 2014, 39, 640–651. [Google Scholar]
- Shen, W.; Wang, X.; Wang, Y.; Bai, X.; Zhang, Z. Deepcontour: A deep convolutional feature learned by positive-sharing loss for contour detection. In Proceedings of the IEEE Conference on Computer Vision and Pattern Recognition, Boston, MA, USA, 7–12 June 2015; pp. 3982–3991. [Google Scholar]
- Hallman, S.; Fowlkes, C.C. Oriented edge forests for boundary detection. In Proceedings of the IEEE Conference on Computer Vision and Pattern Recognition, Boston, MA, USA, 7–12 June 2015; pp. 1732–1740. [Google Scholar]
- Liu, Y.; Cheng, M.M.; Hu, X.; Wang, K.; Bai, X. Richer convolutional features for edge detection. In Proceedings of the IEEE Conference on Computer Vision and Pattern Recognition, Honolulu, HI, USA, 21–26 July 2017; pp. 3000–3009. [Google Scholar]
- Song, W.; Zhong, B.; Sun, X. Building Corner Detection in Aerial Images with Fully Convolutional Networks. Sensors 2019, 19, 1915. [Google Scholar] [CrossRef] [PubMed]
- Xie, S.; Tu, Z. Holistically-nested edge detection. In Proceedings of the IEEE International Conference on Computer Vision, Santiago, Chile, 7–13 December 2015; pp. 1395–1403. [Google Scholar]
- Zhou, P.; Xu, K.; Wang, D. Rail profile measurement based on line-structured light vision. IEEE Access 2018, 6, 16423–16431. [Google Scholar] [CrossRef]
- Canny, J. A computational approach to edge detection. IEEE Trans. Pattern Anal. Mach. Intell. 1986, 8, 679–698. [Google Scholar] [CrossRef] [PubMed]
- Martin, D.; Fowlkes, C.; Malik, J. Learning to detect natural image boundaries using local brightness, color, and texture cues. IEEE Trans. PAMI 2004, 26, 530–549. [Google Scholar] [CrossRef]
- Simonyan, K.; Zisserman, A. Very deep convolutional networks for large-scale image recognition. arXiv 2014, arXiv:1409.1556. [Google Scholar]
- Duda, R.O.; Hart, P.E. Use of the Hough Transformation to Detect Lines and Curves in Pictures (No. SRI-TN-36); Sri International Artificial Intelligence Center: Menlo Park, CA, USA, 1971. [Google Scholar]
- Kirkup, L.; Frenkel, R.B. An Introduction to Uncertainty in Measurement: Using the GUM (Guide to the Expression of Uncertainty in Measurement); Cambridge University Press: Cambridge, UK, 2006. [Google Scholar]


| Device | Picture of Real Products | Parameters | Number |
|---|---|---|---|
| Digital color camera |  | CCD: S-YUE, 1/1.8″ Resolution: 2592 (H) × 1944 (V) Pixel size: 4.4 μm × 4.4 μm Frame rate: 15 fps Focal length: 3.6 mm Signal-to-noise ratio: 50 db Field of view: 71.9° × 60.4° Size: 32 × 32 × 22 mm Operation temperature: −20 °C–60 °C Shooting distance: 50 mm~inf. | 1 pcs |
| Laser line projector |  | Power: 10 mW (adjustable) Focal length: adjustable Wavelength: 635 nm Size: ϕ5 × 20 mm Fan angle: 60° temperature: −20 °C–60 °C | 4 pcs |
| Title | Value |
|---|---|
| Camera intrinsic | |
| Distortion coefficients | k1 = −0.03415937, k2 = 0.321070446 |
| Pixel error | [0.0654, 0.0845] |
| Laser projector parameters | 0.00792910x + (−0.00817394)y + 0.00018065z = 1 |
| 0.01078476x + (−0.01121147)y + 0.00223845z = 1 | |
| 0.01037354x + 0.00959161y + 0.00170705z = 1 | |
| 0.00799885x + 0.00730513y + (−0.00038506)z = 1 |
| Pose | Actual Length/mm | Average Estimated Length/mm | Error (Length)/mm | Actual Width/mm | Average Estimated Width/mm | Error (Width)/mm |
|---|---|---|---|---|---|---|
| (a) | 800 | 800.6 | +0.6 | 600 | 598.6 | −1.4 |
| (b) | 802.9 | +2.9 | 599.7 | −0.3 | ||
| (c) | 800.2 | +0.2 | 600.5 | +0.5 | ||
| (d) | 799.6 | −0.4 | 600.8 | +0.8 | ||
| (e) | 803.4 | +3.4 | 600.0 | +0.0 | ||
| (f) | 796.2 | −3.8 | 604.8 | +4.8 | ||
| (g) | 803.3 | +3.3 | 602.9 | +2.9 | ||
| (h) | 798.5 | +1.5 | 598.3 | −1.7 | ||
| (i) | 799.7 | +0.3 | 597.2 | −2.8 | ||
| standard deviations | 1.7521 | 1.7175 |
| No. | Length (#1) | Width (#1) | Height (#1) | Length (#2) | Width (#2) | Height (#2) | Length (#3) | Width (#3) | Height (#3) |
|---|---|---|---|---|---|---|---|---|---|
| 1 | 330.1 | 110.6 | 441.6 | 691.2 | 571.3 | 1503.2 | 902.5 | 400.3 | 1804.6 |
| 2 | 330.5 | 110.1 | 440.1 | 690.5 | 571.6 | 1503.3 | 898.3 | 399.8 | 1802.5 |
| 3 | 330.2 | 110.6 | 441.4 | 691.2 | 571.8 | 1497.7 | 900.5 | 401.2 | 1804.4 |
| 4 | 331.4 | 111.2 | 439.7 | 690.5 | 568.9 | 1498.4 | 902.1 | 402.1 | 1796.7 |
| 5 | 329.2 | 110.3 | 438.8 | 689.2 | 570.6 | 1497.6 | 898.2 | 398.9 | 1796.9 |
| 6 | 330.4 | 110.8 | 440.7 | 688.4 | 569.7 | 1502.2 | 899.4 | 399.5 | 1803.7 |
| 7 | 329.2 | 110.6 | 437.4 | 691.7 | 572.5 | 1501.1 | 901.7 | 400.8 | 1795.1 |
| 8 | 331.8 | 110.9 | 441.2 | 692.5 | 570.2 | 1499.6 | 901.9 | 400.6 | 1803.2 |
| 9 | 330.9 | 110.6 | 440.6 | 690.6 | 569.4 | 1500.4 | 903.6 | 399.8 | 1798.3 |
| 10 | 331.5 | 110.8 | 440.5 | 691.5 | 571.7 | 1498.9 | 901.3 | 398.7 | 1795.4 |
| 11 | 332.6 | 110.4 | 440.8 | 688.7 | 569.8 | 1496.9 | 899.5 | 401.2 | 1796.7 |
| 12 | 330.5 | 110.2 | 441.7 | 689.5 | 571.5 | 1495.7 | 898.4 | 398.6 | 1795.5 |
| 13 | 330.7 | 109.3 | 442.3 | 691 | 571.4 | 1502.1 | 901.6 | 399.9 | 1804.6 |
| 14 | 330.6 | 109.4 | 439.5 | 691.4 | 570.1 | 1497.7 | 902.7 | 400.6 | 1796.4 |
| 15 | 329.8 | 110.2 | 438.3 | 692.6 | 571.0 | 1504.5 | 902.9 | 400.1 | 1804.7 |
| Mean | 330.6 | 110.4 | 440.3 | 690.7 | 570.7 | 1500.0 | 901.0 | 400.1 | 1799.9 |
| Standard deviation | 0.8952 | 0.5007 | 0.9630 | 1.2285 | 1.0066 | 2.5868 | 1.7401 | 0.9550 | 3.8859 |
| Uncertainty | 0.9266 | 0.5182 | 0.9968 | 1.2717 | 1.042 | 2.6776 | 1.8012 | 0.9885 | 4.0223 |
| Box | Edge Probability Map | Actual Length/mm | Estimated Length/mm | Error Length/mm | Actual Volume/m3 | Estimated Volume/m3 | Relative Error/% | |
|---|---|---|---|---|---|---|---|---|
| (a) |  |  | 143.4 | 142.2 | −1.2 | 0.0017 | 0.00169 | 2.27 |
| 120.5 | 119.6 | −0.9 | ||||||
 |  | 120.5 | 119.2 | −1.3 | ||||
| 100.0 | 99.3 | −0.7 | ||||||
| (b) | 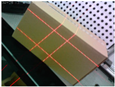 |  | 550.6 | 552.3 | 1.7 | 0.0579 | 0.05779 | 0.18 |
| 300.0 | 299.3 | −0.7 | ||||||
 |  | 300.0 | 301.2 | 1.2 | ||||
| 350.5 | 349.6 | −0.9 | ||||||
| (c) |  |  | 800.0 | 801.6 | 1.6 | 0.2400 | 0.24171 | 0.72 |
| 500.0 | 503.5 | 3.5 | ||||||
 |  | 500.0 | 504.6 | 4.6 | ||||
| 600.0 | 598.9 | −1.1 | ||||||
| (d) | 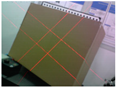 |  | 1200.0 | 1204.6 | 4.6 | 0.7560 | 0.76096 | 0.66 |
| 900.0 | 898.6 | −1.4 | ||||||
 |  | 900.0 | 903.4 | 3.4 | ||||
| 700.0 | 703.0 | 3.0 | ||||||
| (e) | 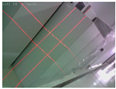 |  | 570.5 | 569.0 | −1.5 | 0.5911 | 0.59221 | 0.19 |
| 1500.0 | 1502.3 | 2.3 | ||||||
 |  | 1500.0 | 1497.6 | −2.4 | ||||
| 690.7 | 692.8 | 2.1 | ||||||
| (f) |  |  | 400.0 | 397.6 | −2.4 | 0.6480 | 0.64179 | 0.96 |
| 1800.0 | 1805.0 | 5.0 | ||||||
 |  | 1800.0 | 1795.5 | −4.5 | ||||
| 900.0 | 899.0 | −1.0 |
© 2019 by the authors. Licensee MDPI, Basel, Switzerland. This article is an open access article distributed under the terms and conditions of the Creative Commons Attribution (CC BY) license (http://creativecommons.org/licenses/by/4.0/).
Share and Cite
Peng, T.; Zhang, Z.; Song, Y.; Chen, F.; Zeng, D. Portable System for Box Volume Measurement Based on Line-Structured Light Vision and Deep Learning. Sensors 2019, 19, 3921. https://doi.org/10.3390/s19183921
Peng T, Zhang Z, Song Y, Chen F, Zeng D. Portable System for Box Volume Measurement Based on Line-Structured Light Vision and Deep Learning. Sensors. 2019; 19(18):3921. https://doi.org/10.3390/s19183921
Chicago/Turabian StylePeng, Tao, Zhijiang Zhang, Yingjie Song, Fansheng Chen, and Dan Zeng. 2019. "Portable System for Box Volume Measurement Based on Line-Structured Light Vision and Deep Learning" Sensors 19, no. 18: 3921. https://doi.org/10.3390/s19183921
APA StylePeng, T., Zhang, Z., Song, Y., Chen, F., & Zeng, D. (2019). Portable System for Box Volume Measurement Based on Line-Structured Light Vision and Deep Learning. Sensors, 19(18), 3921. https://doi.org/10.3390/s19183921