Crop Water Content of Winter Wheat Revealed with Sentinel-1 and Sentinel-2 Imagery


 ,
, 
Abstract
1. Introduction
2. Materials and Methods
2.1. Study Area
2.2. Ground Data
2.3. Sentinel-1/2 Imagery
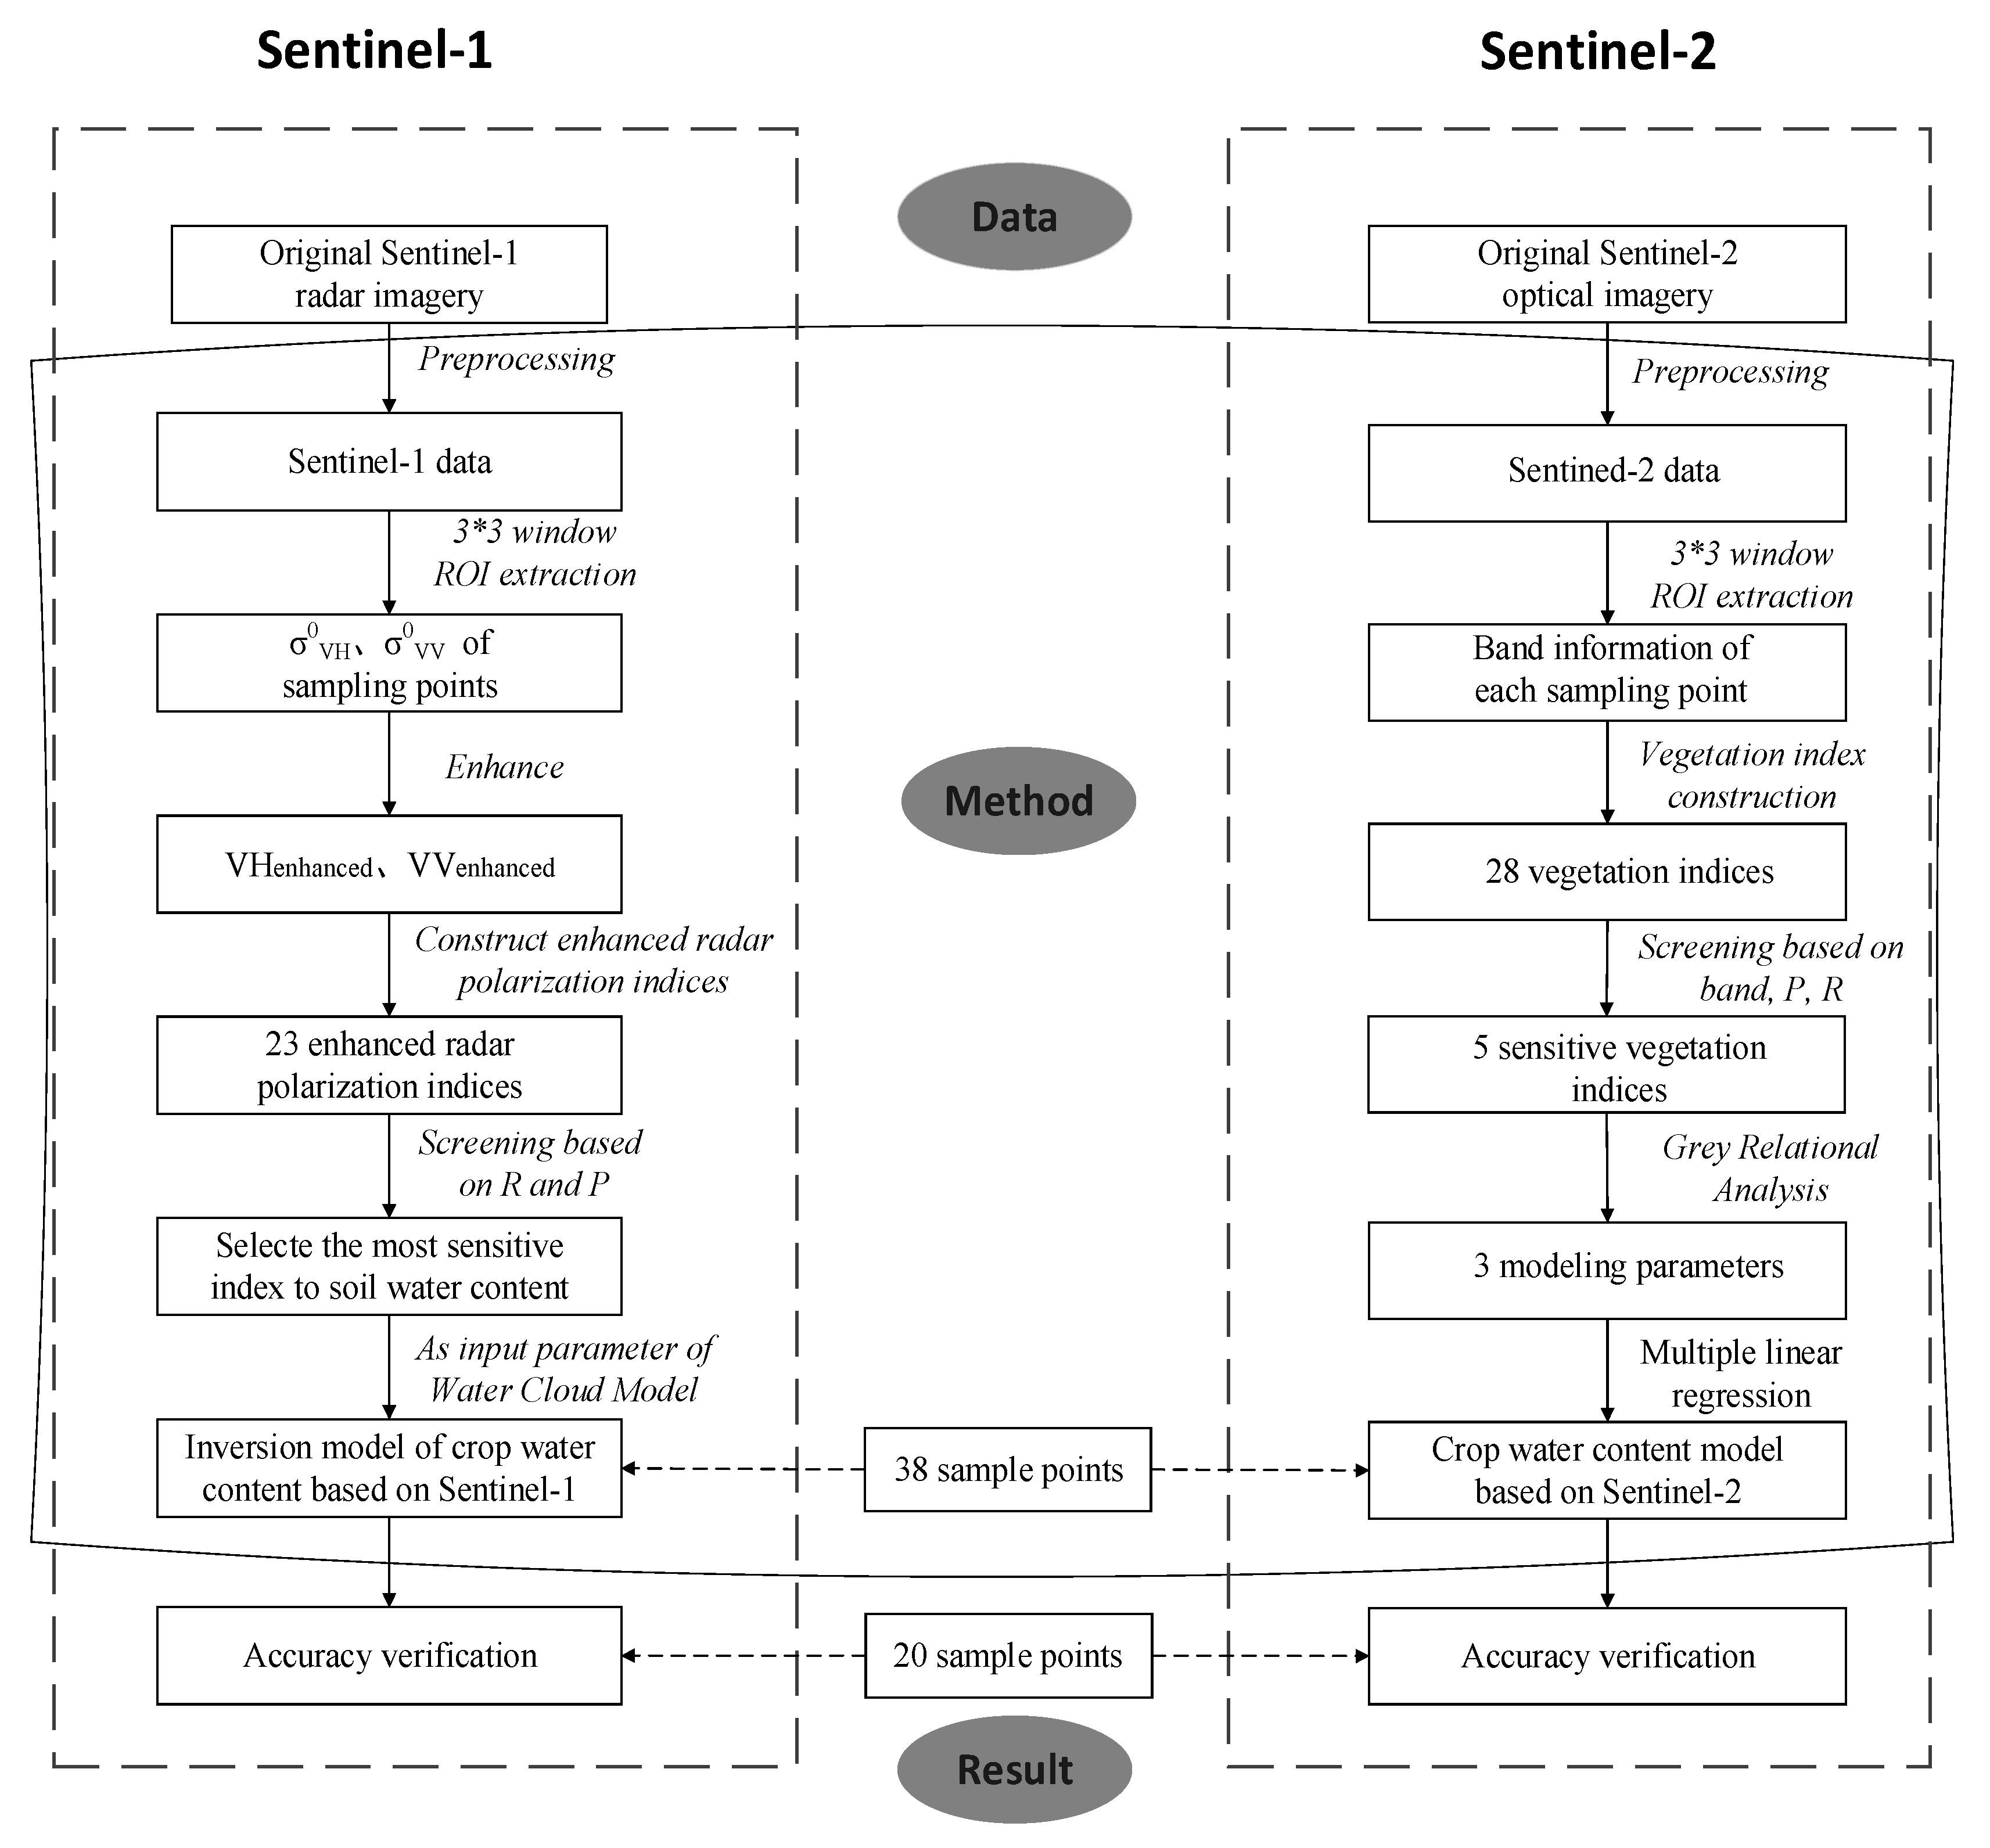
2.4. Modeling Method
2.5. Water Cloud Model for Winter Wheat Water Content Inversion.
2.6. Statistical Analysis
3. Results
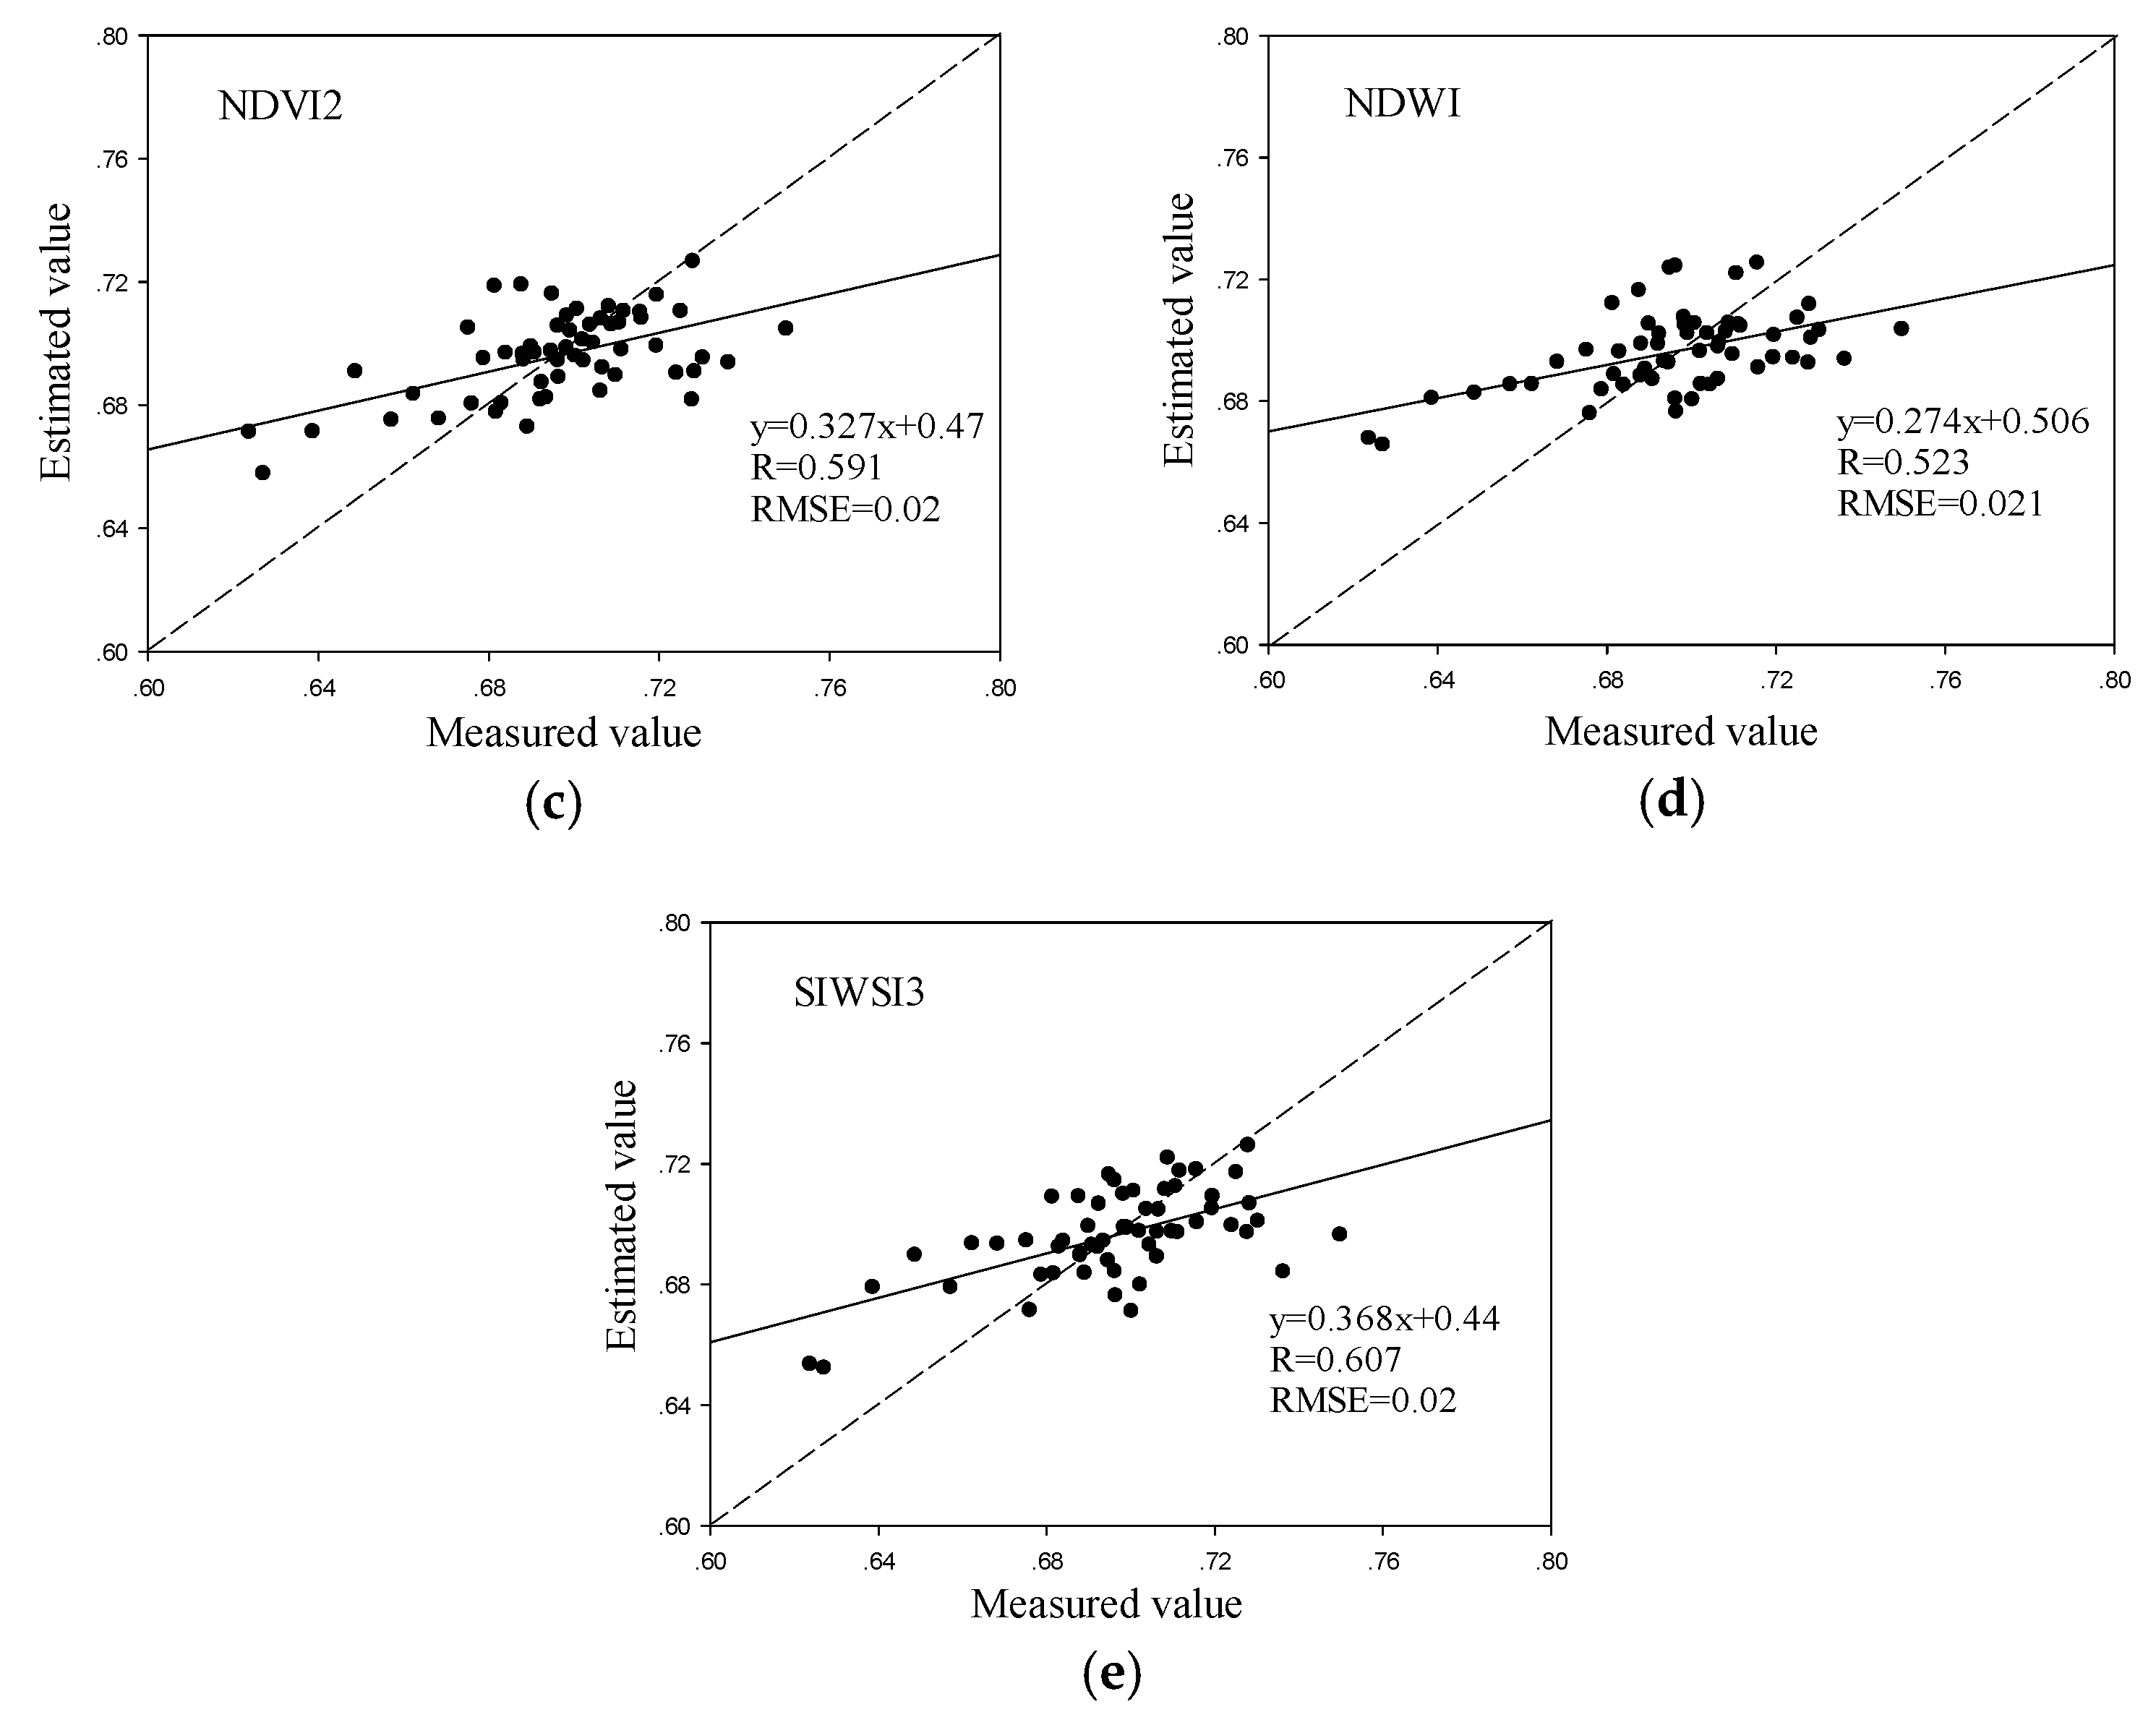
3.1. Choosing the Optical Vegetation Index and SAR Polarization Index
3.2. Inversion of Winter Wheat Water Content Using Sentinel-2 Data
3.3. Inversion of Winter Wheat Water Content Using Sentinel-1 Data
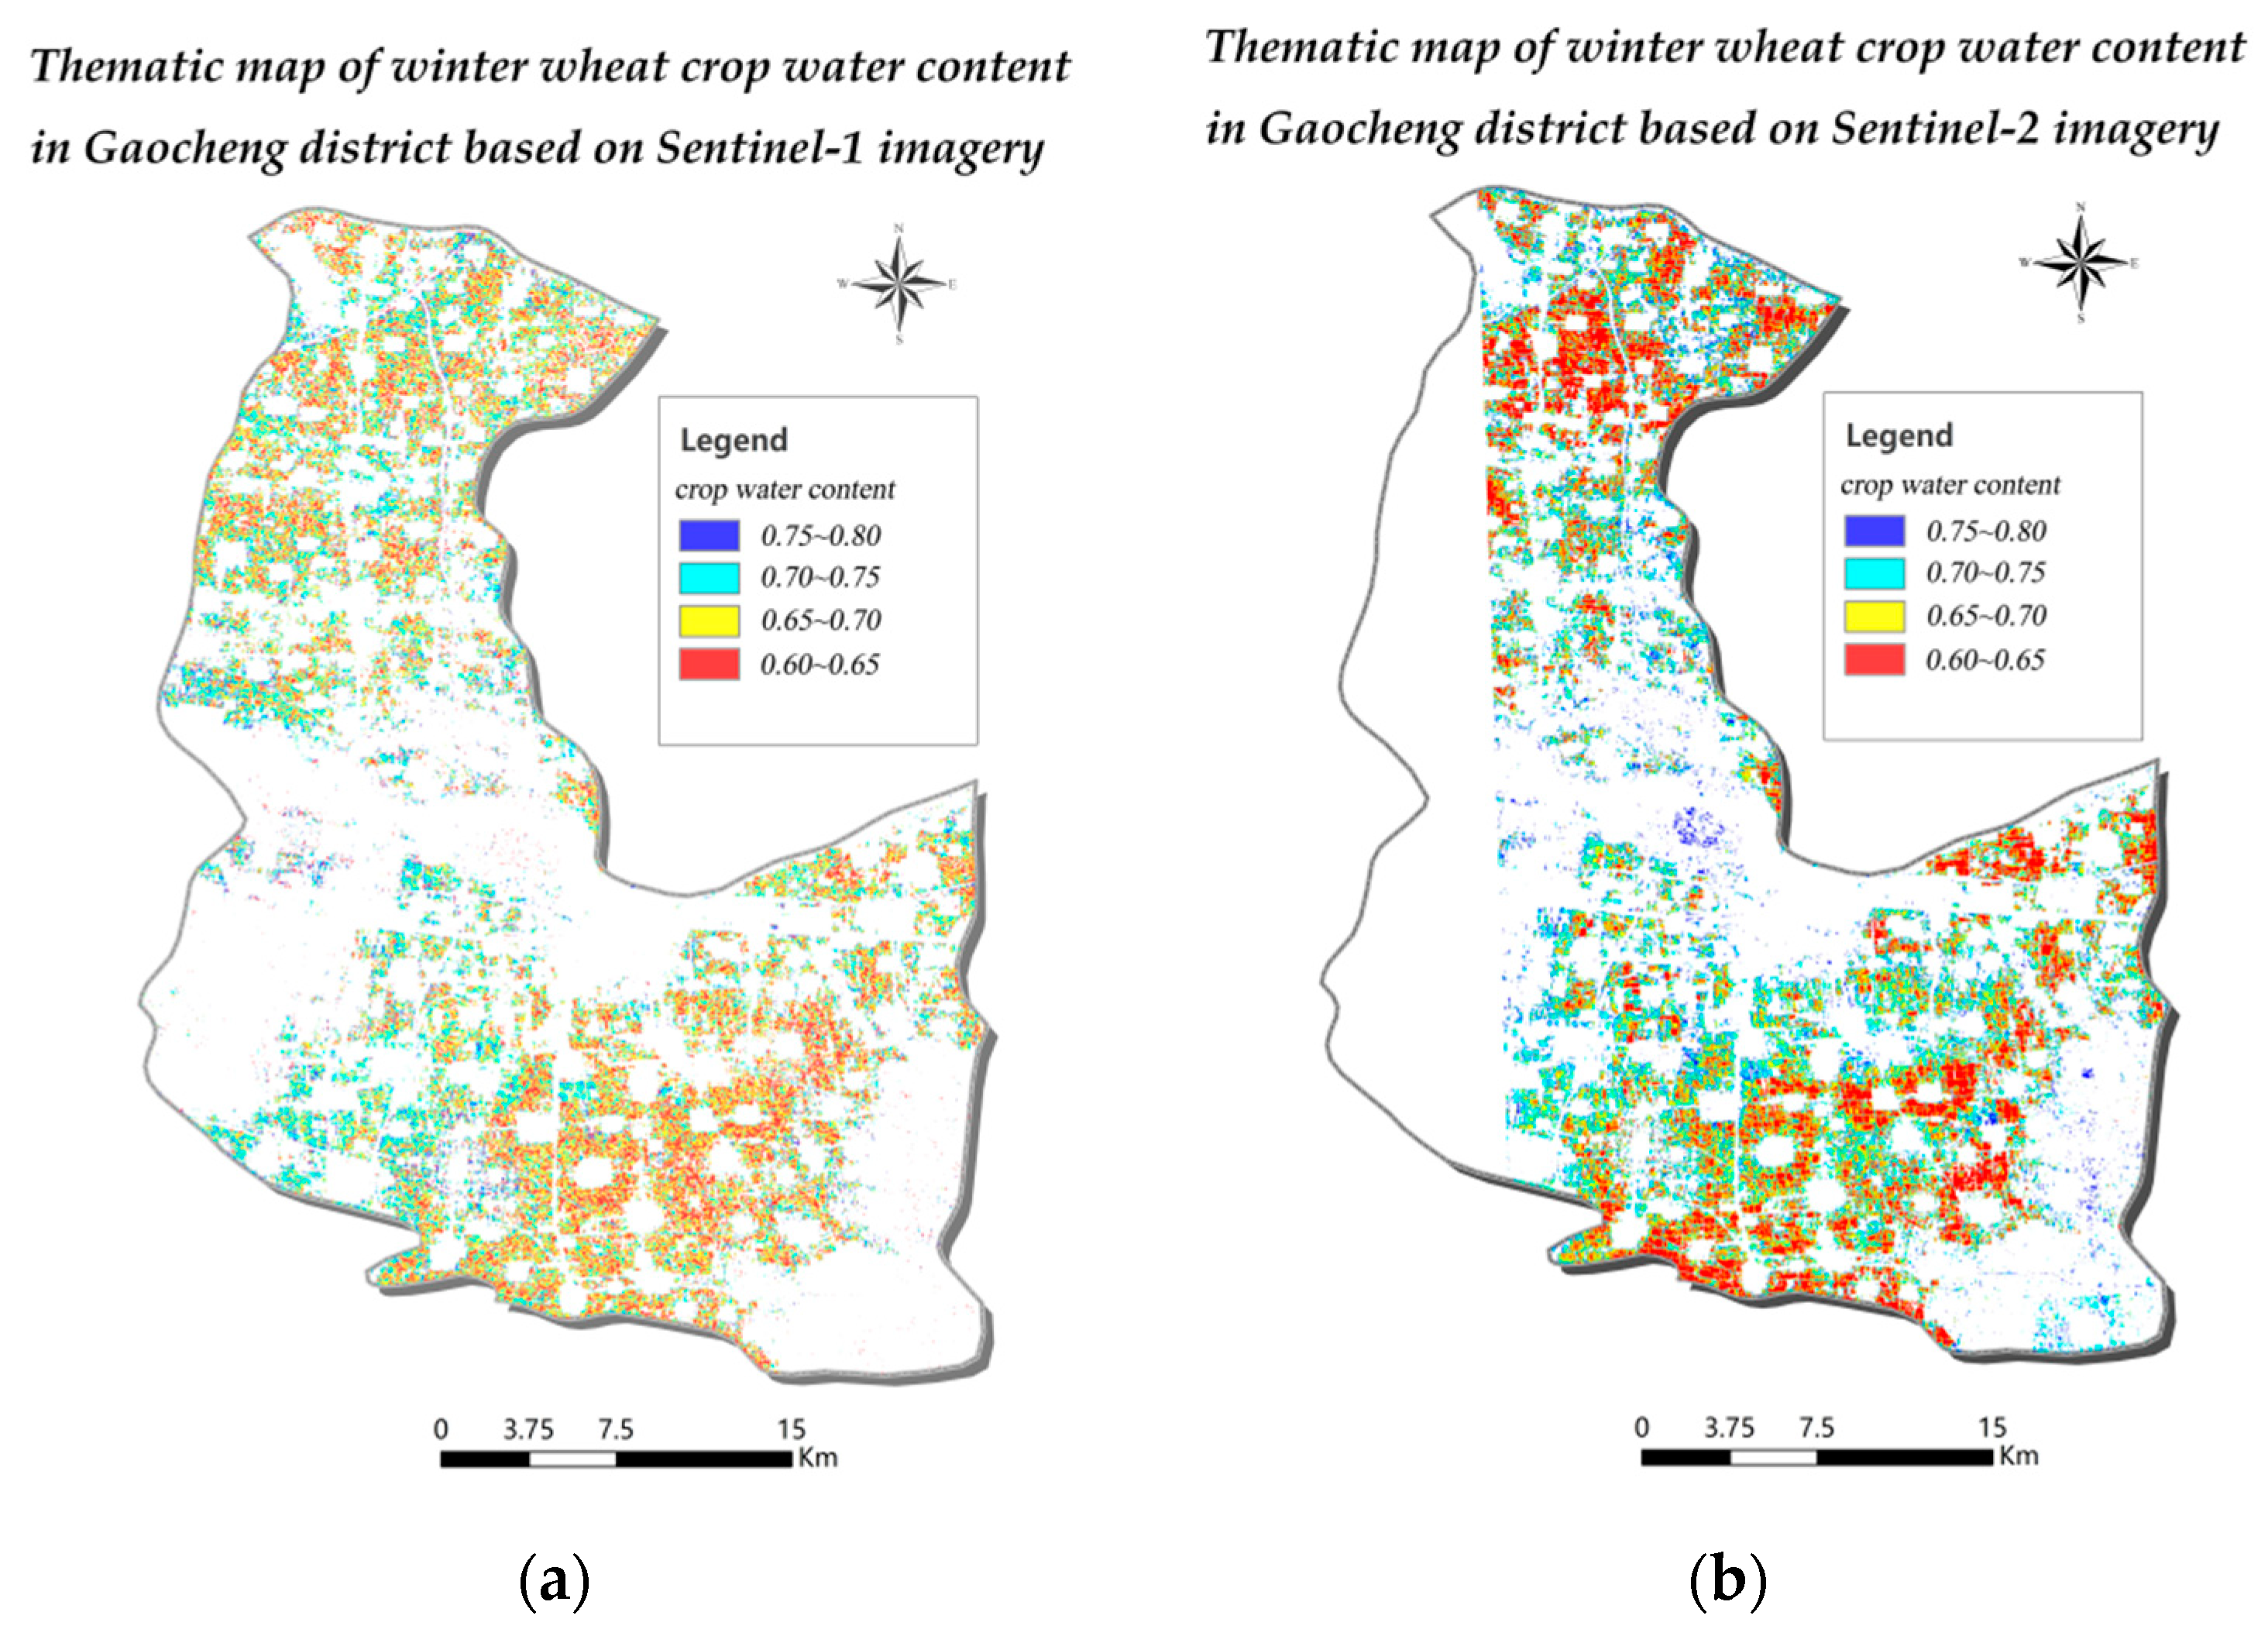
3.4. Mapping the Water Content of Winter Wheat Crops Using Remote Sensing Data from Sentinel Series Satellites
4. Discussion
5. Conclusions
Author Contributions
Funding
Conflicts of Interest
References
- Cheng, Y.B.; Zarco-Tejada, P.J.; Riano, D.; Rueda, C.A.; Ustin, S.L. Estimating vegetation water content with hyperspectral data for different canopy scenarios: Relationships between AVIRIS and MODIS indexes. Remote Sens. Environ. 2006, 105, 354–366. [Google Scholar] [CrossRef]
- Fensholt, R.; Sandholt, I. Derivation of a shortwave infrared water stress index from MODIS near-and shortwave infrared data in a semiarid environment. Remote Sens. Environ. 2003, 87, 111–121. [Google Scholar] [CrossRef]
- Meng, Q.Y.; Xie, Q.X.; Wang, C.M.; Ma, J.X.; Sun, Y.X.; Zhang, L.L. A fusion approach of the improved Dubois model and best canopy water retrieval models to retrieve soil moisture through all maize growth stages from Radarsat-2 and Landsat-8 data. Environ. Earth Sci. 2016, 75, 15. [Google Scholar] [CrossRef]
- Cheng, T.; Riano, D.; Koltunov, A.; Whiting, M.L.; Ustin, S.L.; Rodriguez, J. Detection of diurnal variation in orchard canopy water content using MODIS/ASTER airborne simulator (MASTER) data. Remote Sens. Environ. 2013, 132, 1–12. [Google Scholar] [CrossRef]
- Martin, R.E.; Asner, G.P.; Francis, E.; Ambrose, A.; Baxter, W.; Das, A.J.; Vaughn, N.R.; Paz-Kagan, T.; Dawson, T.; Nydick, K.; et al. Remote measurement of canopy water content in giant sequoias (Sequoiadendron giganteum) during drought. For. Ecol. Manag. 2018, 419, 279–290. [Google Scholar] [CrossRef]
- Clevers, J.G.P.W.; Kooistra, L. Using hyperspectral remote sensing data for retrieving canopy water content. In Proceedings of the 2009 First Workshop on Hyperspectral Image and Signal Processing: Evolution in Remote Sensing, Grenoble, France, 26–28 August 2009. [Google Scholar]
- Song, X.N.; Ma, J.W.; Li, X.T.; Leng, P.; Zhou, F.C.; Li, S. Estimation of vegetation canopy water content using Hyperion hyperspectral data. Spectrosc. Spect. Anal. 2013, 33, 2833–2837. [Google Scholar]
- Thomas, J.R.; Namken, L.N.; Oerther, G.F. Estimating Leaf Water Content by Reflectance Measurement. Agron. J. 1971, 63, 845–847. [Google Scholar] [CrossRef]
- Ceccato, P.; Flasse, S.; Tarantola, S.; Jacquemoud, S.; Gregoire, J.M. Detecting vegetation leaf water content using reflectance in the optical domain. Remote Sens. Environ. 2001, 77, 22–33. [Google Scholar] [CrossRef]
- Idso, S.; Jackson, R.; Pinter, P.; Reginato, R.; Hatfield, J. Normalizing the stress-degree-day parameter for environmental variability. Agric. Meteorol. 1981, 24, 45–55. [Google Scholar] [CrossRef]
- Gao, B.C. NDWI—A normalized difference water index for remote sensing of vegetation liquid water from space. Remote Sens. Environ. 1996, 58, 257–266. [Google Scholar] [CrossRef]
- Jiang, J.-B.; Huang, W.-J.; Chen, Y.-H. Using canopy hyperspectral ratio index to retrieve relative water content of wheat under yellow rust stress. Spectrosc. Spectr. Anal. 2010, 30, 1939–1943. [Google Scholar]
- Jang, J.D.; Viau, A.A.; Anctil, F. Thermal-water stress index from satellite images. Int. J. Remote Sens. 2006, 27, 1619–1639. [Google Scholar] [CrossRef]
- Krishna, G.; Sahoo, R.N.; Singh, P.; Patra, H.; Bajpai, V.; Das, B.; Kumar, S.; Dhandapani, R.; Vishwakarma, C.; Pal, M.; et al. Application of thermal imaging and hyperspectral remote sensing for crop water deficit stress monitoring. Geocarto Int. 2019, 18, 1–14. [Google Scholar] [CrossRef]
- Danner, M.; Berger, K.; Wocher, M.; Mauser, W.; Hank, T. Fitted PROSAIL Parameterization of Leaf Inclinations, Water Content and Brown Pigment Content for Winter Wheat and Maize Canopies. Remote Sens. 2019, 11, 29. [Google Scholar] [CrossRef]
- Das, B.; Sahoo, R.N.; Pargal, S.; Krishna, G.; Verma, R.; Chinnusamy, V.; Sehgal, V.K.; Gupta, V.K. Comparison of different uni- and multi-variate techniques for monitoring leaf water status as an indicator of water-deficit stress in wheat through spectroscopy. Biosyst. Eng. 2017, 160, 69–83. [Google Scholar] [CrossRef]
- Capodici, F.; D’Urso, G.; Maltese, A. Investigating the Relationship between X-Band SAR Data from COSMO-SkyMed Satellite and NDVI for LAI Detection. Remote Sens. 2013, 5, 1389–1404. [Google Scholar] [CrossRef]
- Clevers, J.G.P.W.; Vanleeuwen, H.J.C. Combined use of optical and microwave remote sensing data for crop growth monitoring. Remote Sens. Environ. 1996, 56, 42–51. [Google Scholar] [CrossRef]
- Baghdadi, N.; El Hajj, M.; Zribi, M.; Bousbih, S. Calibration of the Water Cloud Model at C-Band for Winter Crop Fields and Grasslands. Remote Sens. 2017, 9, 969. [Google Scholar] [CrossRef]
- Hosseini, M.; McNairn, H. Using multi-polarization C- and L-band synthetic aperture radar to estimate biomass and soil moisture of wheat fields. Int. J. Appl. Earth Obs. Geoinf. 2017, 58, 50–64. [Google Scholar] [CrossRef]
- Ulaby, F.; Moore, R.; Fung, A. Microwave Remote Sensing: From Theory to Applications; Artech House Publishers: Norwood, MA, USA, 1986. [Google Scholar]
- Bao, Y.; Lin, L.; Wu, S.; Kwal Deng, K.A.; Petropoulos, G.P. Surface soil moisture retrievals over partially vegetated areas from the synergy of Sentinel-1 and Landsat 8 data using a modified water-cloud model. Int. J. Appl. Earth Obs. Geoinf. 2018, 72, 76–85. [Google Scholar] [CrossRef]
- Montzka, C.; Jagdhuber, T.; Horn, R.; Bogena, H.R.; Hajnsek, I.; Reigber, A.; Vereecken, H. Investigation of SMAP Fusion Algorithms With Airborne Active and Passive L-Band Microwave Remote Sensing. IEEE Trans. Geosci. Remote Sens. 2016, 54, 3878–3889. [Google Scholar] [CrossRef]
- Esch, S.; Korres, W.; Reichenau, K.G.; Schneider, K. Soil moisture index from ERS-SAR and its application to the analysis of spatial patterns in agricultural areas. J. Appl. Remote Sens. 2018, 12, 12–23. [Google Scholar] [CrossRef]
- Saatchi, S.S.; van Zyl, J.J.; Asrar, G. Estimation of canopy water content in Konza Prairie grasslands using synthetic aperture radar measurements during FIFE. J. Geophys. Res.-Atmos. 1995, 100, 25481–25496. [Google Scholar] [CrossRef]
- Saatchi, S.S.; Moghaddam, M. Estimation of crown and stem water content and biomass of Boreal forest using polarimetric SAR imagery. IEEE Trans. Geosci. Remote Sens. 2000, 38, 697–709. [Google Scholar] [CrossRef]
- Steele-Dunne, S.C.; Friesen, J.; Van De Giesen, N. Using Diurnal Variation in Backscatter to Detect Vegetation Water Stress. IEEE Trans. Geosci. Remote. Sens. 2012, 50, 2618–2629. [Google Scholar] [CrossRef]
- Van Emmerik, T.; Steele-Dunne, S.C.; Judge, J.; van de Giesen, N. Impact of diurnal variation in vegetation water content on radar backscatter of maize during water stress. IEEE Trans. Geosci. Remote Sens. 2014, 16, 6070. [Google Scholar] [CrossRef]
- Konings, A.G.; Piles, M.; Rötzer, K.; McColl, K.A.; Chan, S.K.; Entekhabi, D. Vegetation optical depth and scattering albedo retrieval using time series of dual-polarized L-band radiometer observations. Remote Sens. Environ. 2016, 172, 178–189. [Google Scholar] [CrossRef]
- Jin, X.; Yang, G.; Xu, X.; Yang, H.; Feng, H.; Li, Z.; Shen, J.; Lan, Y.; Zhao, C. Combined Multi-Temporal Optical and Radar Parameters for Estimating LAI and Biomass in Winter Wheat Using HJ and RADARSAR-2 Data. Remote Sens. 2015, 7, 13251–13272. [Google Scholar] [CrossRef]
- Kussul, N.; Lemoine, G.; Gallego, F.J.; Skakun, S.V.; Lavreniuk, M.; Shelestov, A.Y. Parcel-Based Crop Classification in Ukraine Using Landsat-8 Data and Sentinel-1A Data. IEEE J. Sel. Top. Appl. Earth. Obs. Remote Sens. 2017, 9, 2500–2508. [Google Scholar] [CrossRef]
- Lantzanakis, G.; Mitraka, Z.; Chrysoulakis, N. Comparison of Physically and Image Based Atmospheric Correction Methods for Sentinel-2 Satellite Imagery. In Proceedings of the Fourth International Conference on Remote Sensing and Geoinformation of the Environment, Paphos, Cyprus, 4–8 April 2016. [Google Scholar]
- Atzberger, C.; Richter, K. Spatially constrained inversion of radiative transfer models for improved LAI mapping from future Sentinel-2 imagery. Remote Sens. Environ. 2012, 120, 208–218. [Google Scholar] [CrossRef]
- Han, D.; Yang, H.; Qiu, C.X.; Yang, G.J.; Chen, E.X.; Du, Y.; Yang, W.P.; Zhou, C.Q. Estimating wheat biomass from GF-3 data and a polarized water cloud model. Remote Sens. Lett. 2019, 10, 234–243. [Google Scholar] [CrossRef]
- Ma, H.; Huang, W.; Jing, Y. Wheat powdery mildew forecasting in filling stage based on remote sensing and meteorological data. Trans. CSAE 2016, 32, 165–172. [Google Scholar]
- Deng, J.L. Control problems of grey systems. Syst Contr. Lett. 1982, 1, 288–294. [Google Scholar]
- DeFries, R.S.; Townshend, J.R.G. NDVI-derived land cover classifications at a global scale. Int. J. Remote Sens. 2007, 15, 3567–3586. [Google Scholar] [CrossRef]
- Wang, L.; Qu, J.J.; Hao, X. Forest fire detection using the normalized multi-band drought index (NMDI) with satellite measurements. Agric. For. Meteorol. 2008, 148, 1767–1776. [Google Scholar] [CrossRef]
- Xing, W.Z.; Liu, C.; Alfredo, H. From AVHRR-NDVI to MODIS-EVI: Advances in vegetation index research. Acta Ecol. Sin. 2003, 23, 979–987. [Google Scholar]
- Chai, L.; Chen, Z. A Sensitivity Analysis of NDWI and SRWI to Different types of Vegetation Moisture. In Proceedings of the EGU General Assembly Conference, Vienna, Austria, 23–28 April 2017; p. 12217. [Google Scholar]
- Olsen, J.L.; Stisen, S.; Proud, S.R.; Fensholt, R. Evaluating EO-based canopy water stress from seasonally detrended NDVI and SIWSI with modeled evapotranspiration in the Senegal River Basin. Remote Sens. Environ. 2015, 159, 57–69. [Google Scholar] [CrossRef]
- Wang, Z.; Gang, C.; Li, X.; Chen, Y.; Li, J. Application of a normalized difference impervious index (NDII) to extract urban impervious surface features based on Landsat TM images. Int. J. Remote Sens. 2015, 1–15. [Google Scholar] [CrossRef]
- Vanhellemont, Q.; Ruddick, K. Advantages of high quality SWIR bands for ocean colour processing: Examples from Landsat-8. Remote Sens. Environ. 2015, 161, 89–106. [Google Scholar] [CrossRef]
- Liu, C.A.; Chen, Z.X.; Shao, Y.; Chen, J.S.; Hasi, T.; Pan, H.Z. Research advances of SAR remote sensing for agriculture applications: A review. J. Integr. Agric. 2019, 18, 506–525. [Google Scholar] [CrossRef]
- Kim, Y.; Jackson, T.; Bindlish, R.; Hong, S.; Jung, G.; Lee, K. Retrieval of Wheat Growth Parameters with Radar Vegetation Indices. IEEE Geosci. Remote Sens. Lett. 2014, 11, 808–812. [Google Scholar] [CrossRef]
- Liu, R.; Wen, J.; Wang, X.; Wang, Z.L.; Li, Z.C.; Xie, Y.; Zhu, L.; Li, D.P. Derivation of Vegetation Optical Depth and Water Content in the Source Region of the Yellow River using the FY-3B Microwave Data. Remote Sens. 2019, 11, 18. [Google Scholar] [CrossRef]
- Jia, S.; Kim, S.H.; Nghiem, S.V.; Kafatos, M. Estimating Live Fuel Moisture Using SMAP L-Band Radiometer Soil Moisture for Southern California, USA. Remote Sens. 2019, 11, 1575. [Google Scholar] [CrossRef]
- Guo, X.; Li, K.; Shao, Y.; Wang, Z.; Li, H.; Yang, Z.; Liu, L.; Wang, S. Inversion of Rice Biophysical Parameters Using Simulated Compact Polarimetric SAR C-Band Data. Sensors 2018, 18, 2271. [Google Scholar] [CrossRef] [PubMed]
- Yang, G.; Shi, Y.; Zhao, C.; Wang, J. Estimation of soil moisture from multi-polarized SAR data over wheat coverage areas. In Proceedings of the First International Conference on Agro-Geoinformatics, Shanghai, China, 2–4 August 2012. [Google Scholar] [CrossRef]
- Xie, Q.; Meng, Q.; Zhang, L.; Wang, C.; Qiao, W.; Zhao, S. Combining of the H/A/Alpha and Freeman–Durden Polarization Decomposition Methods for Soil Moisture Retrieval from Full-Polarization Radarsat-2 Data. Adv. Meteorol. 2018, 2018, 1–17. [Google Scholar] [CrossRef]


| Sentinel-1 Imagery | ||||||
| Date | Acquisition Time (UTC) | Imaging Mode | Frequency (GHZ) | Spatial Resolution (m) | IncidenceAngle (°) | Orbit Direction |
| 25 May 2017 | 10:20:58 | VH, VV | 5.045 | 5 × 20 | 42.45 | Ascending |
| Sentinel-2 Imagery | ||||||
| Date | Acquisition Time (UTC) | Spatial Resolution (m) | Orbit Direction | Spectrum range (um) | Width (km) | FOV (°) |
| 28 May 2017 | 03:16:29 | 10–60 | Descending | 0.4–2.4 | 290 | 20.6 |
| Vegetation Index | Formula | Reference |
|---|---|---|
| Enhanced difference water index (NDWI) | [11] | |
| Enhanced difference vegetation index (NDVI) | [37] | |
| Enhanced multi-band drough index (NMDI) | [38] | |
| Enhanced vegetation index (EVI) | [39] | |
| Simple ratio water index (SRWI) | [40] | |
| Shortwave infrared water stress index (SIWSI) | [41] | |
| Enhanced difference red edge vegetation index (NDVIRed edge) | ||
| Enhanced difference infrared index (NDII) | [42] | |
| Mositure stress index (MSI) | [3] | |
| Shortwave infrared ratio (SWIR) | [43] | |
| Enhanced difference water index (NDWISwir) | ||
| Vegetation Index | Stem and Leaf Water Content | Ear Water Content | Crop Water Content | Enhanced Radar Polarization Indices | Soil Water Content |
|---|---|---|---|---|---|
| SRWI | 0.250 | 0.446 ** | 0.451 ** | 0.115 | |
| MSI1 | 0.082 | 0.034 | 0.069 | 0.064 | |
| MSI2 | −0.411 ** | −0.45 ** | −0.575 ** | 0.103 | |
| MSI3 | −0.133 | 0.041 | −0.08 | −0.012 | |
| NDII1 | 0.217 | 0.414 ** | 0.402 ** | 0.050 | |
| NDII2 | −0.034 | 0.305 * | 0.154 | 0.037 | |
| NDII3 | −0.142 | 0.035 | −0.09 | 0.013 | |
| NDVI | 0.309 | 0.487 ** | 0.516 ** | 0.016 | |
| NDVI1 | 0.288 | 0.419 ** | 0.459 ** | −0.077 | |
| NDVI2 | 0.362 | 0.460 ** | 0.562 ** | −0.355 * | |
| NDVI3 | 0.159 | −0.003 | 0.174 | −0.059 | |
| NDWI | −0.316 | −0.513 ** | −0.523 ** | −0.076 | |
| NDWI1 | −0.178 | −0.399 ** | −0.347 ** | −0.034 | |
| NDWI2 | 0.220 | −0.048 | 0.159 | −0.279 * | |
| NDWI3 | 0.223 | 0.142 | 0.268 * | 0.018 | |
| SWIRR1 | 0.278 | 0.38 * | 0.384 ** | −0.094 | |
| SWIRR2 | 0.242 | 0.313 * | 0.362 ** | −0.136 | |
| SWIRR3 | 0.161 | 0.297 | 0.299 * | −0.193 | |
| EVI | 0.141 | −0.033 | 0.144 | −0.062 | |
| NMDI1 | −0.037 | 0.068 | −0.013 | −0.192 | |
| NMDI2 | 0.023 | 0.096 | 0.039 | −0.181 | |
| NMDI3 | 0.343 ** | 0.409 ** | 0.480 ** | 0.072 | |
| SIWSI1 | 0.396 ** | 0.451 ** | 0.557 ** | −0.293 * | |
| SIWSI2 | 0.397 ** | 0.451 ** | 0.560 ** | / | / |
| SIWSI3 | 0.431 ** | 0.480 ** | 0.607 ** | / | / |
| SIWSI4 | 0.388 ** | 0.441 ** | 0.551 ** | / | / |
| SIWSI5 | 0.394 ** | 0.473 ** | 0.528 ** | / | / |
| SIWSI6 | 0.362 ** | 0.429 ** | 0.526 ** | / | / |
| Vegetation Index | Correlation | Sort | Recommended Number of Vegetation Indices |
|---|---|---|---|
| NDWI | 0.834 | 1 | 3 |
| NDVI | 0.811 | 2 | |
| SIWSI3 | 0.759 | 3 | |
| SMI2 | 0.713 | 4 | |
| NDVI2 | 0.709 | 5 |
| Model Coefficient | Value | Precision Index | Value |
|---|---|---|---|
| A | −5.7113 | R | 0.471 |
| B | 0.0417 | RMSE | 0.022 |
| C | 0.3545 | nRMSE | 19.98% |
| D | 0.0005 | F-statistics | 2.648 |
| Enhanced Radar Polarization Index | Stem-Leaf Water Content | Ear Water Content | Crop Water Content | Soil Water Content | Original Radar Polarization Index & Soil Water Content |
|---|---|---|---|---|---|
| 0.150 | 0.001 | 0.195 | −0.355 * | −0.033 | |
| 0.151 | 0.011 | 0.167 | −0.279 * | 0.063 | |
| 0.286 * | 0.016 | 0.186 | −0.293 * | 0.015 |
© 2019 by the authors. Licensee MDPI, Basel, Switzerland. This article is an open access article distributed under the terms and conditions of the Creative Commons Attribution (CC BY) license (http://creativecommons.org/licenses/by/4.0/).
Share and Cite
Han, D.; Liu, S.; Du, Y.; Xie, X.; Fan, L.; Lei, L.; Li, Z.; Yang, H.; Yang, G. Crop Water Content of Winter Wheat Revealed with Sentinel-1 and Sentinel-2 Imagery. Sensors 2019, 19, 4013. https://doi.org/10.3390/s19184013
Han D, Liu S, Du Y, Xie X, Fan L, Lei L, Li Z, Yang H, Yang G. Crop Water Content of Winter Wheat Revealed with Sentinel-1 and Sentinel-2 Imagery. Sensors. 2019; 19(18):4013. https://doi.org/10.3390/s19184013
Chicago/Turabian StyleHan, Dong, Shuaibing Liu, Ying Du, Xinrui Xie, Lingling Fan, Lei Lei, Zhenhong Li, Hao Yang, and Guijun Yang. 2019. "Crop Water Content of Winter Wheat Revealed with Sentinel-1 and Sentinel-2 Imagery" Sensors 19, no. 18: 4013. https://doi.org/10.3390/s19184013
APA StyleHan, D., Liu, S., Du, Y., Xie, X., Fan, L., Lei, L., Li, Z., Yang, H., & Yang, G. (2019). Crop Water Content of Winter Wheat Revealed with Sentinel-1 and Sentinel-2 Imagery. Sensors, 19(18), 4013. https://doi.org/10.3390/s19184013