3D FEM Analysis of High-Frequency AlN-Based PMUT Arrays on Cavity SOI
Abstract
:1. Introduction
2. FEM Simulations
2.1. Structural Design
2.2. 3D FEM Model
2.3. Simulation Method
3. Experiments
3.1. Fabricated PMUT Array
3.2. Experimental Setup
4. Results and Discussion
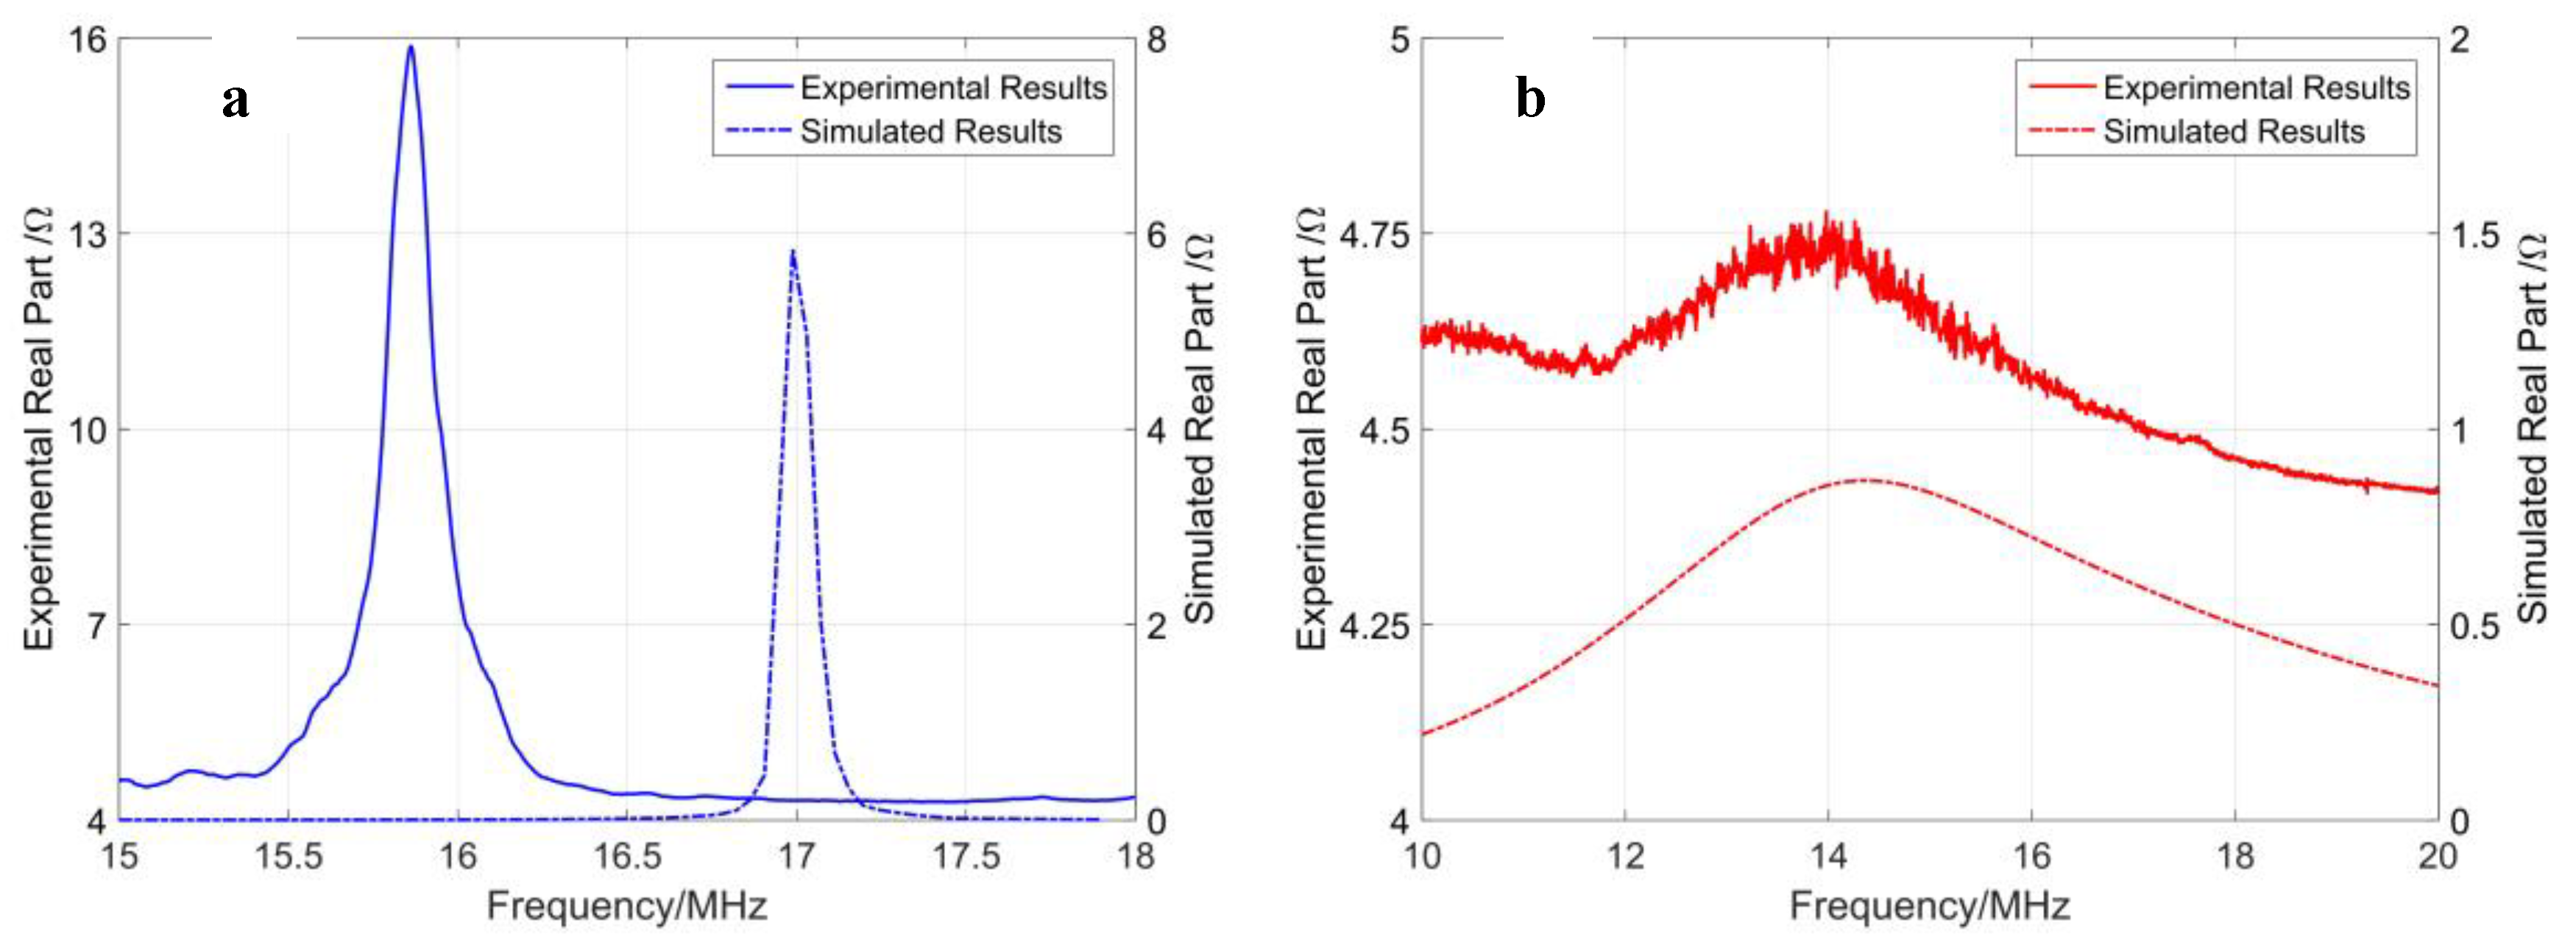
4.1. Comparison of Analytical Method, FEM, and Experimental Results
4.2. FEM Analysis of a High-Frequency PMUT Array
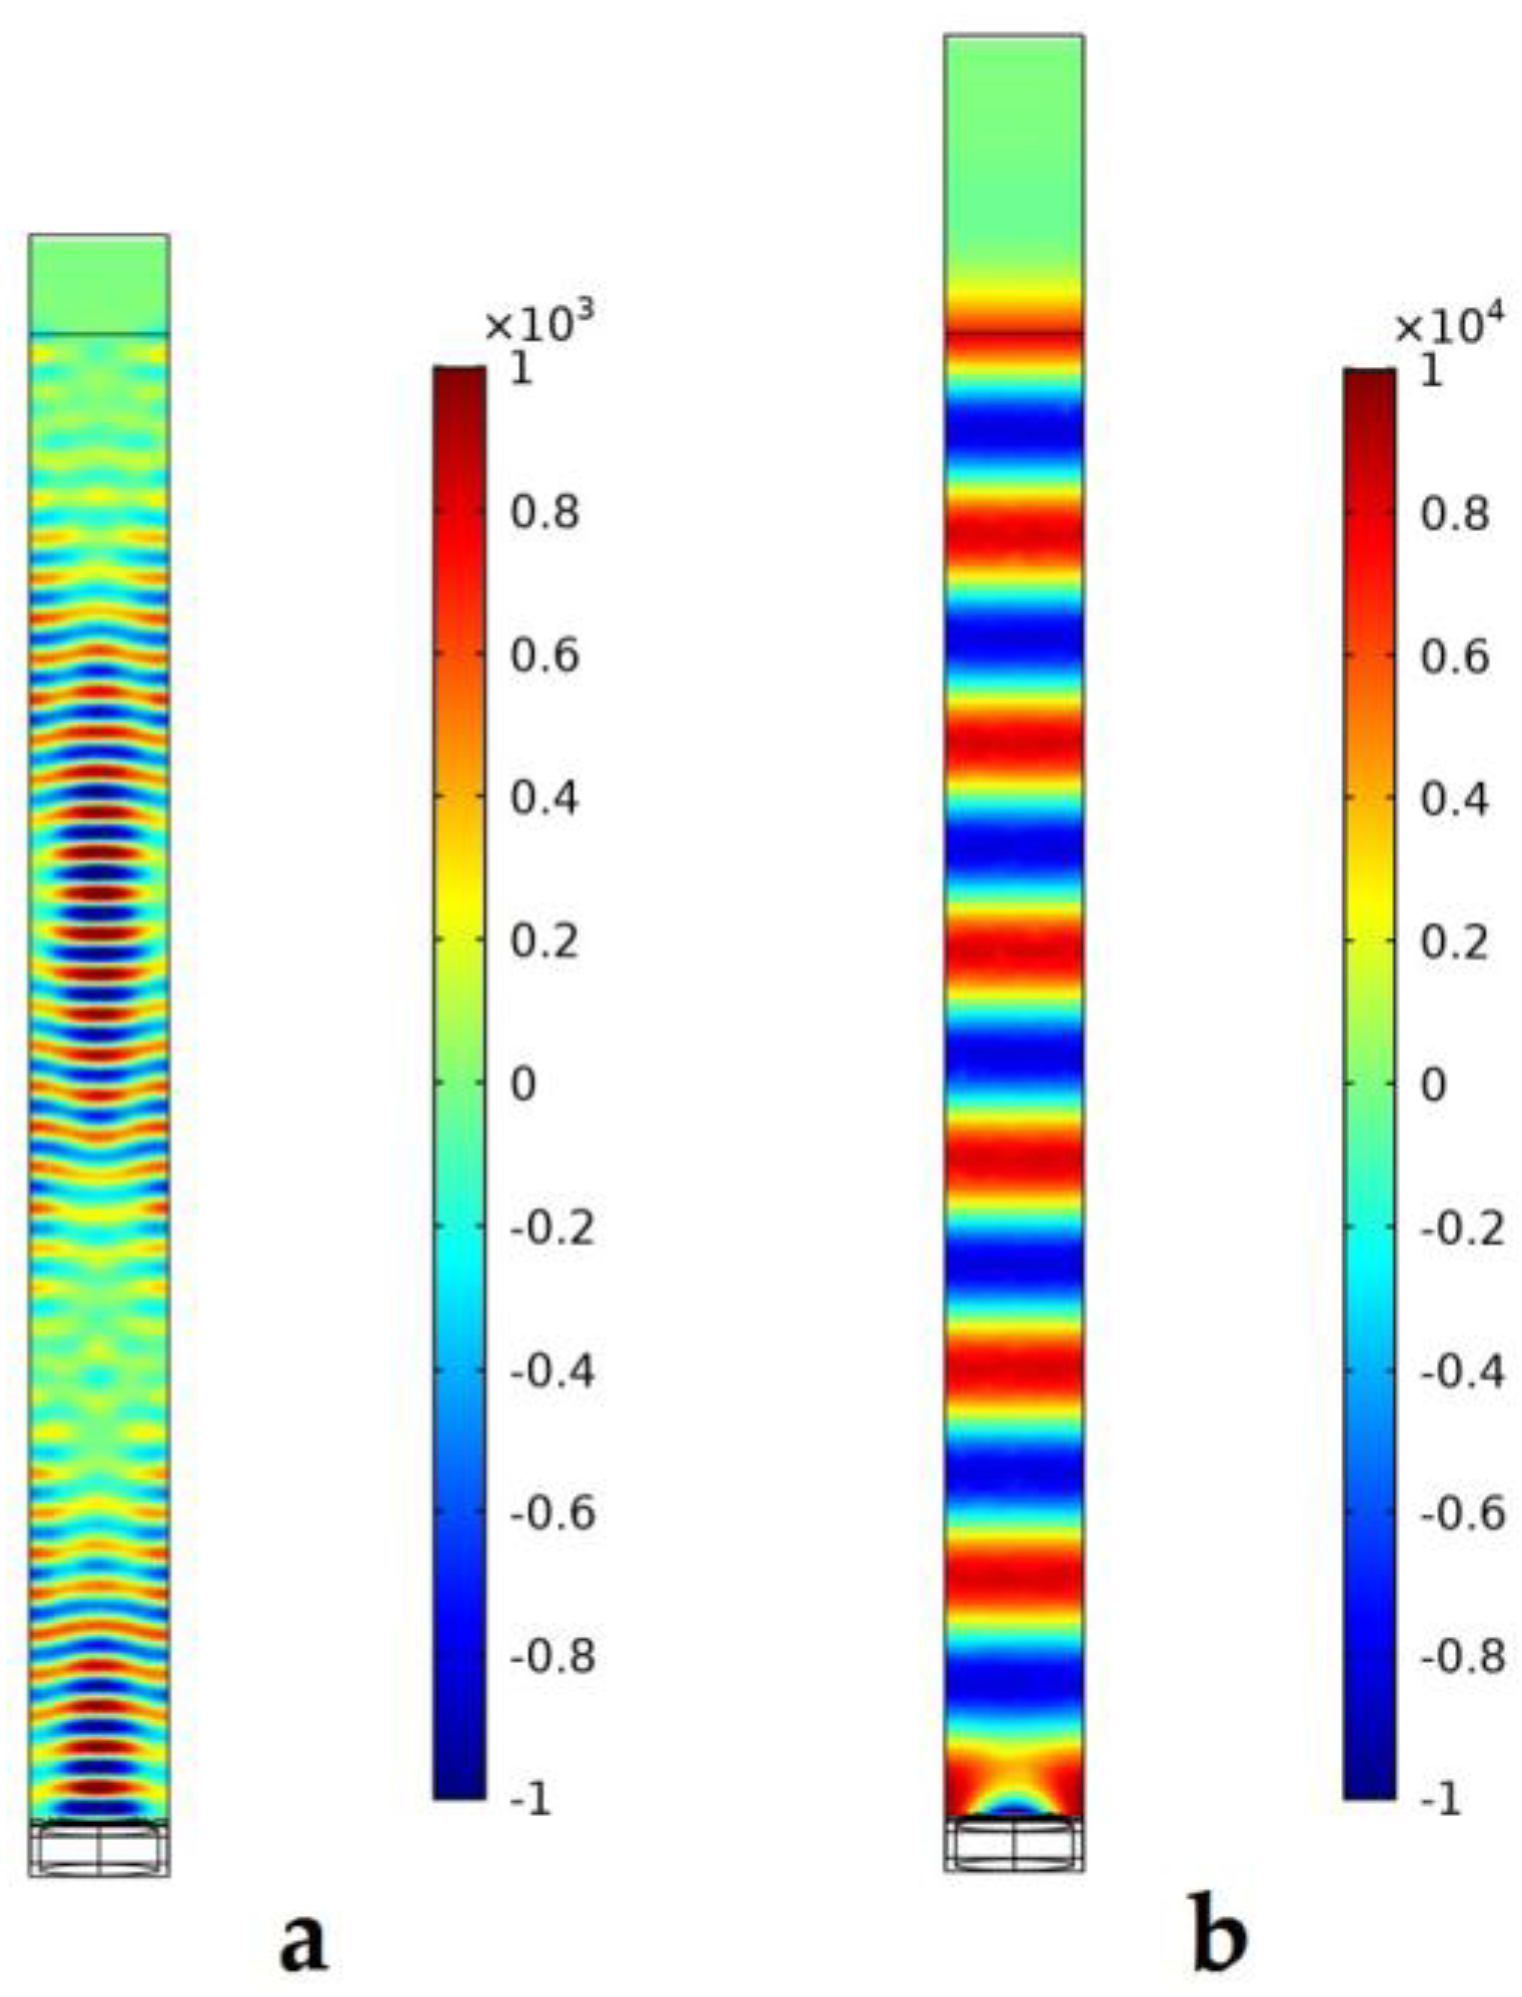
4.3. Electromechanical‒Acoustic Analysis of a High-Frequency PMUT Array
5. Conclusions
Author Contributions
Funding
Acknowledgments
Conflicts of Interest
Appendix A. Principle of Operation of Plates
References
- Hunt, J.W.; Arditi, M.; Foster, F.S. Ultrasound Transducers for Pulse-Echo Medical Imaging. IEEE Trans. Biomed. Eng. 1983, BME-30, 453–481. [Google Scholar] [CrossRef]
- Silk, M.G. Ultrasonic Transducers for Nondestructive Testing; Adam Hilger Ltd.: Boston, MA, USA, 1984. [Google Scholar]
- Przybyla, R.J.; Shelton, S.E.; Guedes, A.; Izyumin, I.I.; Kline, M.H.; Horsley, D.A.; Boser, B.E. In-Air Rangefinding With an AlN Piezoelectric Micromachined Ultrasound Transducer. IEEE Sens. J. 2011, 11, 2690–2697. [Google Scholar] [CrossRef]
- Przybyla, R.J.; Tang, H.Y.; Shelton, S.E.; Horsley, D.A.; Boser, B.E. 12.1 3D ultrasonic gesture recognition. In Proceedings of the 2014 IEEE International Solid-State Circuits Conference Digest of Technical Papers (ISSCC), San Francisco, CA, USA, 9–13 February 2014; pp. 210–211. [Google Scholar]
- Lu, Y.; Tang, H.; Fung, S.; Wang, Q.; Tsai, J.M.; Daneman, M.; Boser, B.E.; Horsley, D.A. Ultrasonic fingerprint sensor using a piezoelectric micromachined ultrasonic transducer array integrated with complementary metal oxide semiconductor electronics. Appl. Phys. Lett. 2015, 106, 263503. [Google Scholar] [CrossRef] [Green Version]
- Mina, I.G.; Kim, H.; Kim, I.; Park, S.K.; Choi, K.; Jackson, T.N.; Tutwiler, R.L.; Trolier-McKinstry, S. High frequency piezoelectric MEMS ultrasound transducers. IEEE Trans. Ultrason Ferroelectr. Freq. Control 2007, 54, 2422–2430. [Google Scholar] [CrossRef] [PubMed]
- Shung, K.K. High Frequency Ultrasonic Imaging. J. Med. Ultrasound 2009, 17, 25–30. [Google Scholar] [CrossRef] [Green Version]
- Chandrana, C.; Talman, J.; Pan, T.; Roy, S.; Fleischman, A. Design and analysis of MEMS based PVDF ultrasonic transducers for vascular imaging. Sensors 2010, 10, 8740–8750. [Google Scholar] [CrossRef] [PubMed]
- Dausch, D.E.; Gilchrist, K.H.; Carlson, J.B.; Hall, S.D.; Castellucci, J.B.; von Ramm, O.T. In vivo real-time 3-D intracardiac echo using PMUT arrays. IEEE Trans. Ultrason. Ferroelectr. Freq. Control 2014, 61, 1754–1764. [Google Scholar] [CrossRef]
- Arnau, A. Piezoelectric Transducer and Applications, 2nd ed.; Springer: Berlin/Heidelberg, Germany, 2008; pp. 99–116. [Google Scholar] [CrossRef]
- Muralt, P.; Ledermann, N.; Paborowski, J.; Barzegar, A.; Gentil, S.; Belgacem, B.; Petitgrand, S.; Bosseboeuf, A.; Setter, N. Piezoelectric micromachined ultrasonic transducers based on PZT thin films. IEEE Trans. Ultrason. Ferroelectr. Freq. Control. 2005, 52, 2276–2288. [Google Scholar] [CrossRef]
- Lemmerhirt, D.F.; Cheng, X.; White, R.D.; Rich, C.A.; Zhang, M.; Fowlkes, J.B.; Kripfgans, O.D. A 32 × 32 capacitive micromachined ultrasonic transducer array manufactured in standard CMOS. IEEE Trans. Ultrason. Ferroelectr. Freq. Control. 2012, 59, 1521–1536. [Google Scholar] [CrossRef]
- Jiang, X.; Tang, H.Y.; Lu, Y.; Ng, E.; Tsai, J.; Boser, B.; Horsley, D. Ultrasonic Fingerprint Sensor with Transmit Beamforming Based on a PMUT Array Bonded to CMOS Circuitry. IEEE Trans. Ultrason. Ferroelectr. Freq. Control. 2017, 66, 1401–1408. [Google Scholar] [CrossRef]
- Dausch, D.E.; Gilchrist, K.H.; Carlson, J.R.; Castellucci, J.B.; Chou, D.R.; von Ramm, O.T. Improved pulse-echo imaging performance for flexure-mode pMUT arrays. In Proceedings of the 2010 IEEE International Ultrasonics Symposium, San Diego, CA, USA, 11–14 October 2010; pp. 451–454. [Google Scholar]
- Smyth, K.; Bathurst, S.; Sammoura, F.; Kim, S.G. Analytic solution for N-electrode actuated piezoelectric disk with application to piezoelectric micromachined ultrasonic transducers. IEEE Trans. Ultrason. Ferroelectr. Freq. Control. 2013, 60, 1756–1767. [Google Scholar] [CrossRef] [PubMed]
- Sammoura, F.; Smyth, K.; Kim, S.-G. Optimizing the electrode size of circular bimorph plates with different boundary conditions for maximum deflection of piezoelectric micromachined ultrasonic transducers. Ultrasonics 2013, 53, 328–334. [Google Scholar] [CrossRef] [PubMed]
- Dangi, A.; Pratap, R. System level modeling and design maps of PMUTs with residual stresses. Sens. Actuator A-Phys. 2017, 262, 18–28. [Google Scholar] [CrossRef]
- Eriksson, T.J.R.; Ramadas, S.N.; Dixon, S.M. Experimental and simulation characterisation of flexural vibration modes in unimorph ultrasound transducers. Ultrasonics 2016, 65, 242–248. [Google Scholar] [CrossRef] [Green Version]
- Massimino, G.; Colombo, A.; D’Alessandro, L.; Procopio, F.; Ardito, R.; Ferrera, M.; Corigliano, A. Multiphysics modelling and experimental validation of an air-coupled array of PMUTs with residual stresses. J. Micromech. Microeng. 2018, 28, 054005. [Google Scholar] [CrossRef]
- Lu, Y.; Tang, H.; Wang, Q.; Fung, S.; Tsai, J.M.; Daneman, M.; Boser, B.E.; Horsley, D.A. Waveguide piezoelectric micromachined ultrasonic transducer array for short-range pulse-echo imaging. Appl. Phys. Lett. 2015, 106, 193506. [Google Scholar] [CrossRef]
- Shieh, B.; Sabra, K.G.; Degertekin, F.L. A Hybrid Boundary Element Model for Simulation and Optimization of Large Piezoelectric Micromachined Ultrasonic Transducer Arrays. IEEE Trans. Ultrason. Ferroelectr. Freq. Control 2018, 65, 50–59. [Google Scholar] [CrossRef]
- Gualtieri, J.G.; Kosinski, J.A.; Ballato, A. Piezoelectric materials for acoustic wave applications. IEEE Trans. Ultrason. Ferroelectr. Freq. Control. 1994, 41, 53–59. [Google Scholar] [CrossRef]
- Hopcroft, M.A.; Nix, W.D.; Kenny, T.W. What is the Young’s Modulus of Silicon? J. Microelectromech. Syst. 2010, 19, 229–238. [Google Scholar] [CrossRef]
- Wang, N.; Xu, J.H.; Zhang, X.L.; Wu, G.Q.; Zhu, Y.; Li, W.; Gu, Y.D. Methods for precisely controlling the residual stress and temperature coefficient of the frequency of a MEMS resonator based on an AlN cavity silicon-on-insulator platform. J. Micromech. Microeng. 2016, 26, 10. [Google Scholar] [CrossRef]
- Xu, J.H.; Zhang, X.L.; Fernando, S.N.; Chai, K.T.; Gu, Y.D. AlN-on-SOI platform-based micro-machined hydrophone. Appl. Phys. Lett. 2016, 109, 5. [Google Scholar] [CrossRef]
- Qiu, Y.; Gigliotti, J.; Wallace, M.; Griggio, F.; Demore, C.; Cochran, S.; Trolier-McKinstry, S. Piezoelectric Micromachined Ultrasound Transducer (PMUT) Arrays for Integrated Sensing, Actuation and Imaging. Sensors 2015, 15, 8020–8041. [Google Scholar] [CrossRef] [PubMed] [Green Version]
- Timoshenko, S.P.; Woinowsky-Krieger, S. Theory of Plates and Shells, 2nd ed.; McGraw-hill: New York, NY, USA, 1959. [Google Scholar]
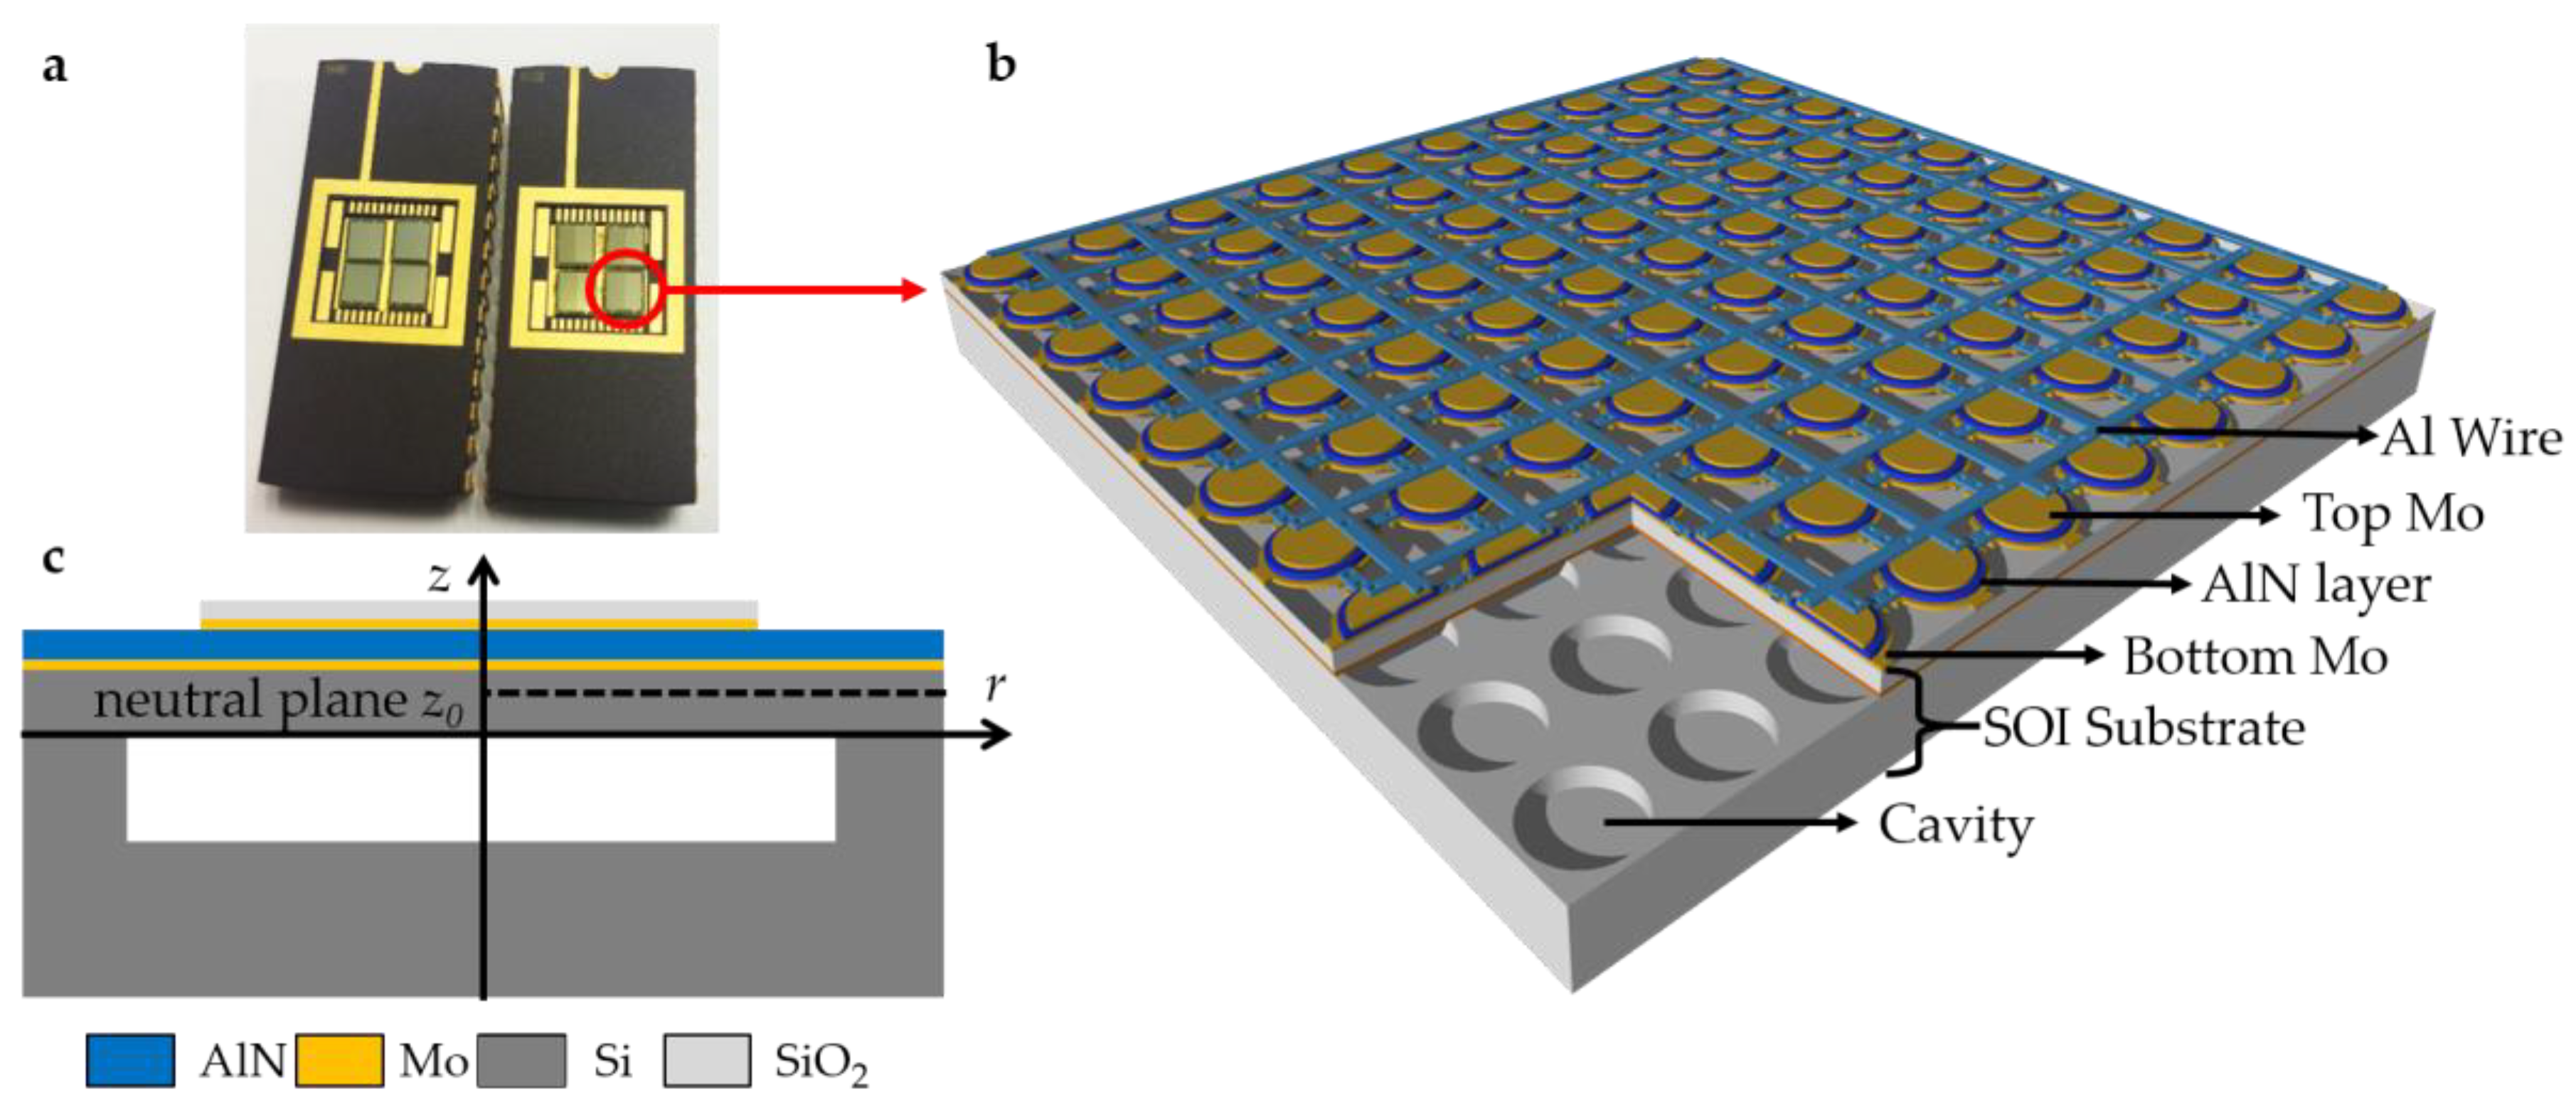
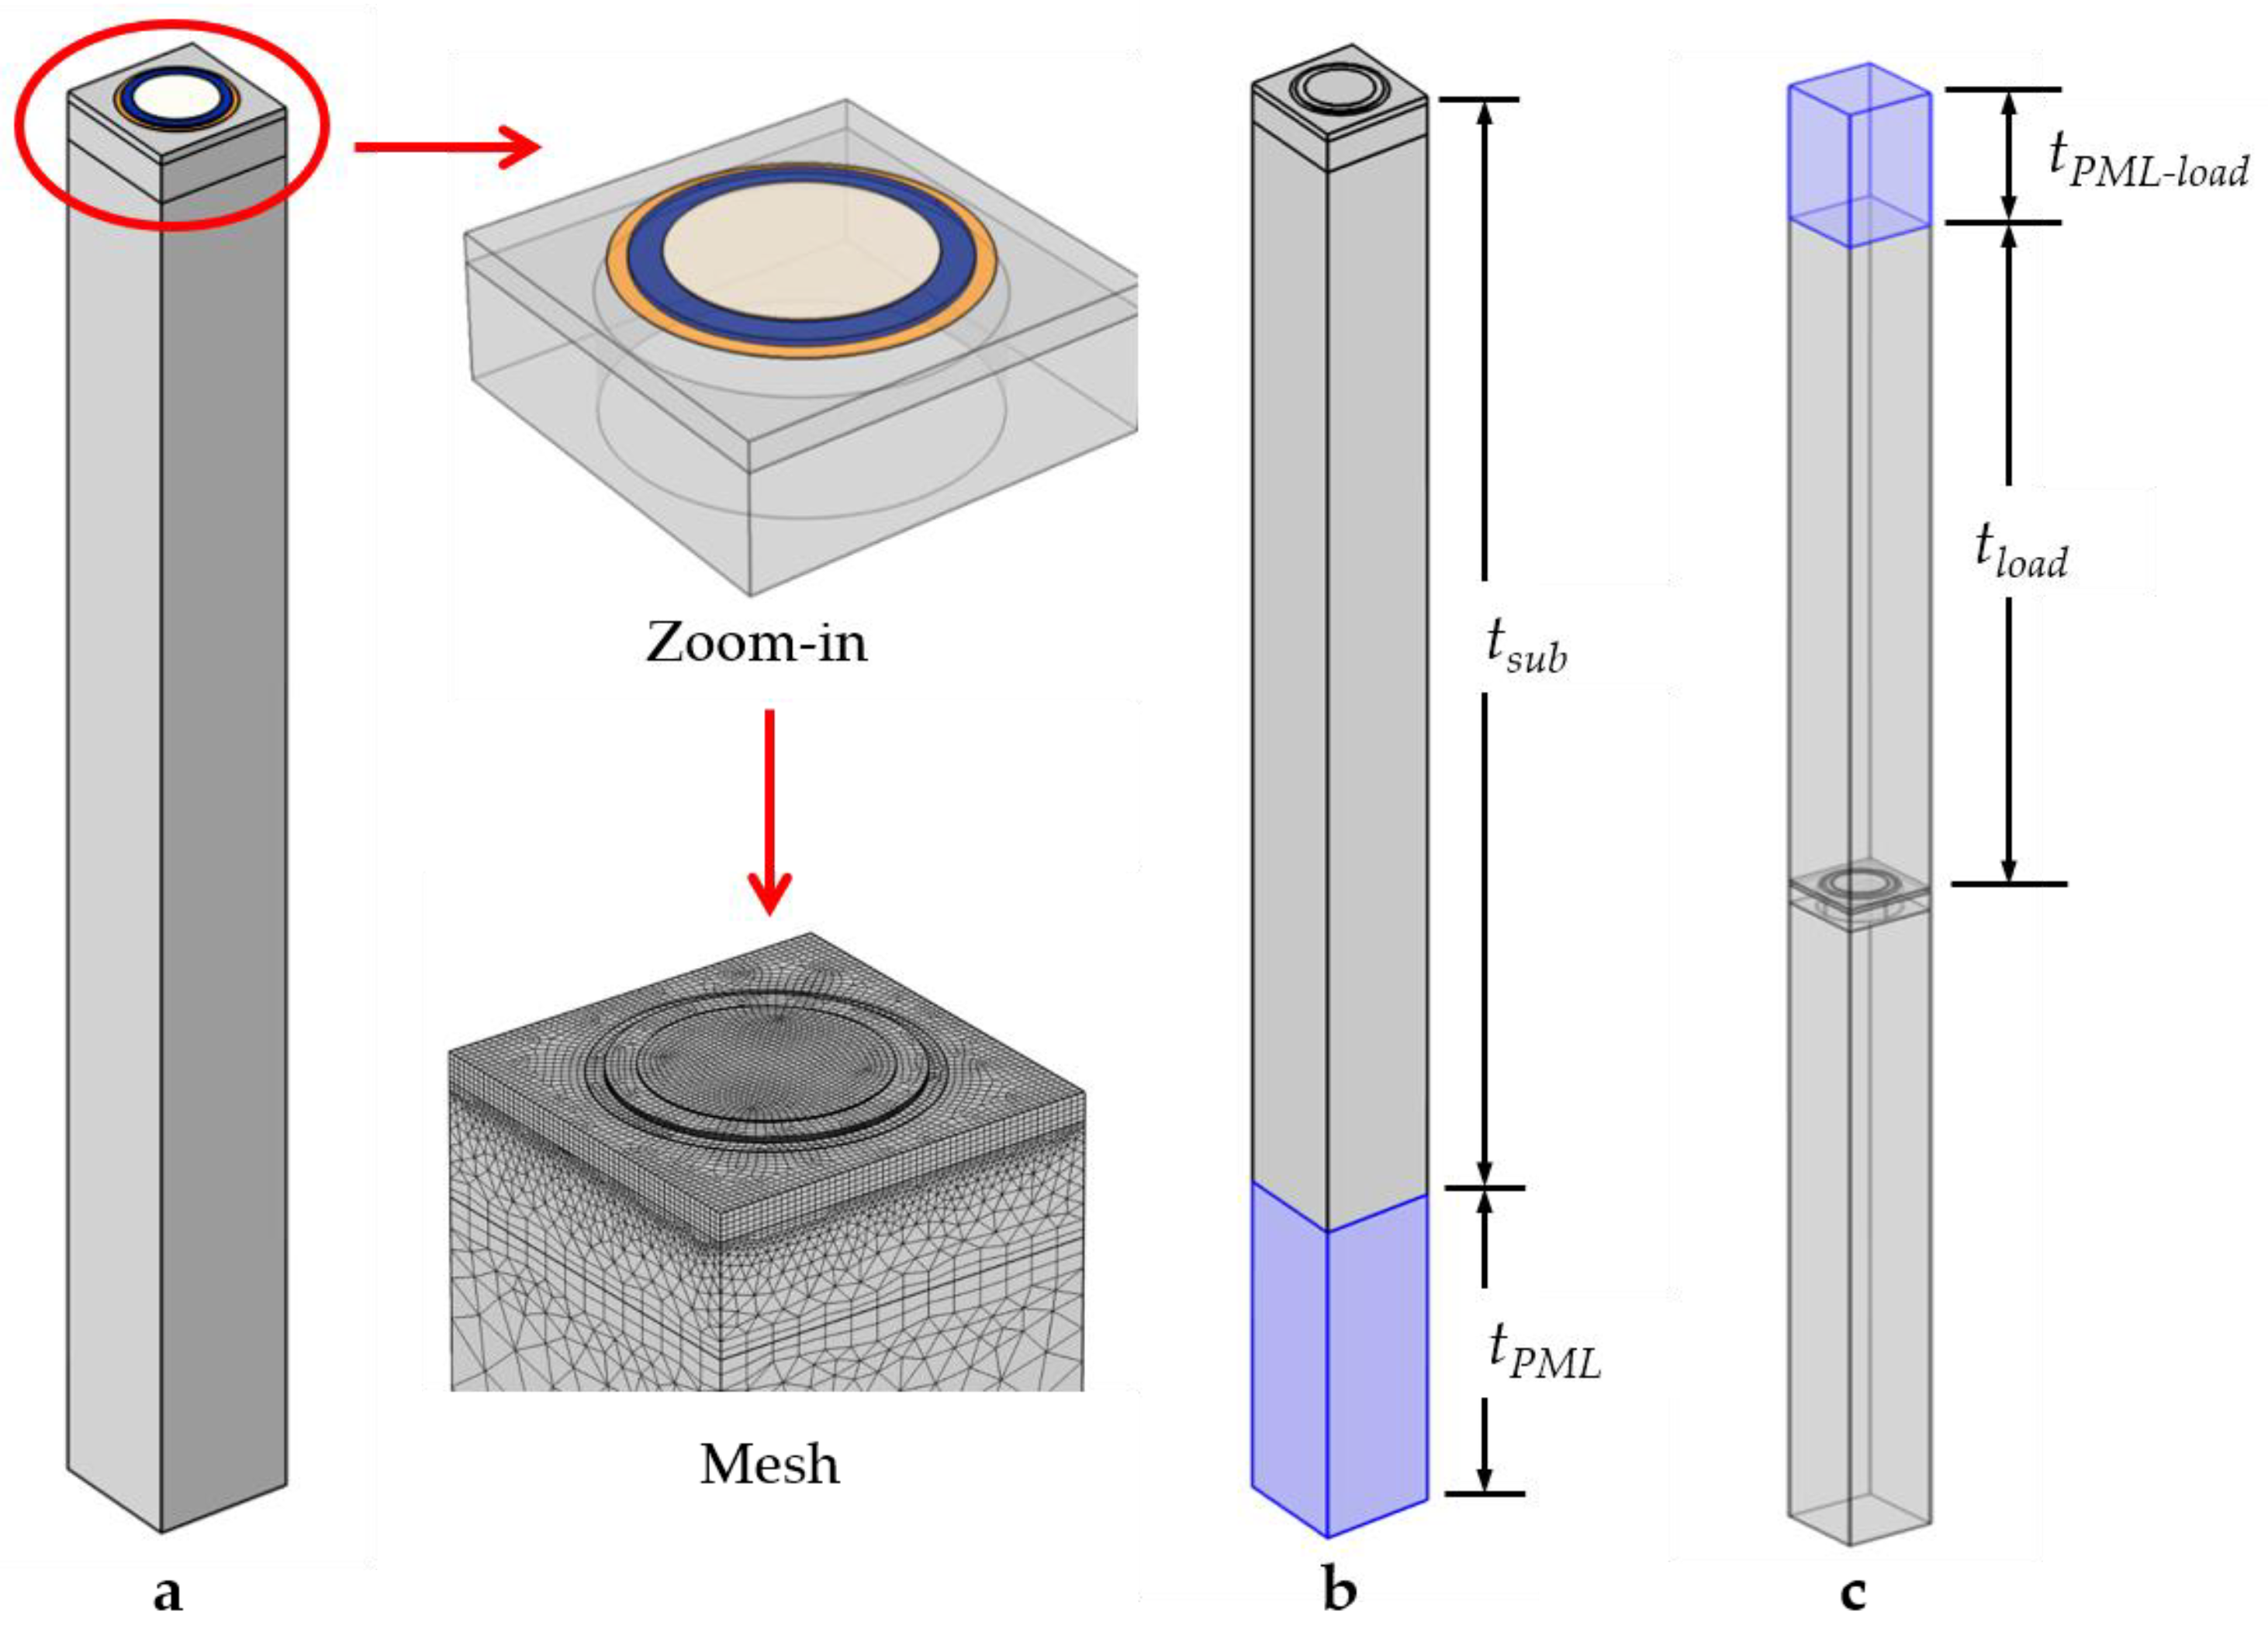


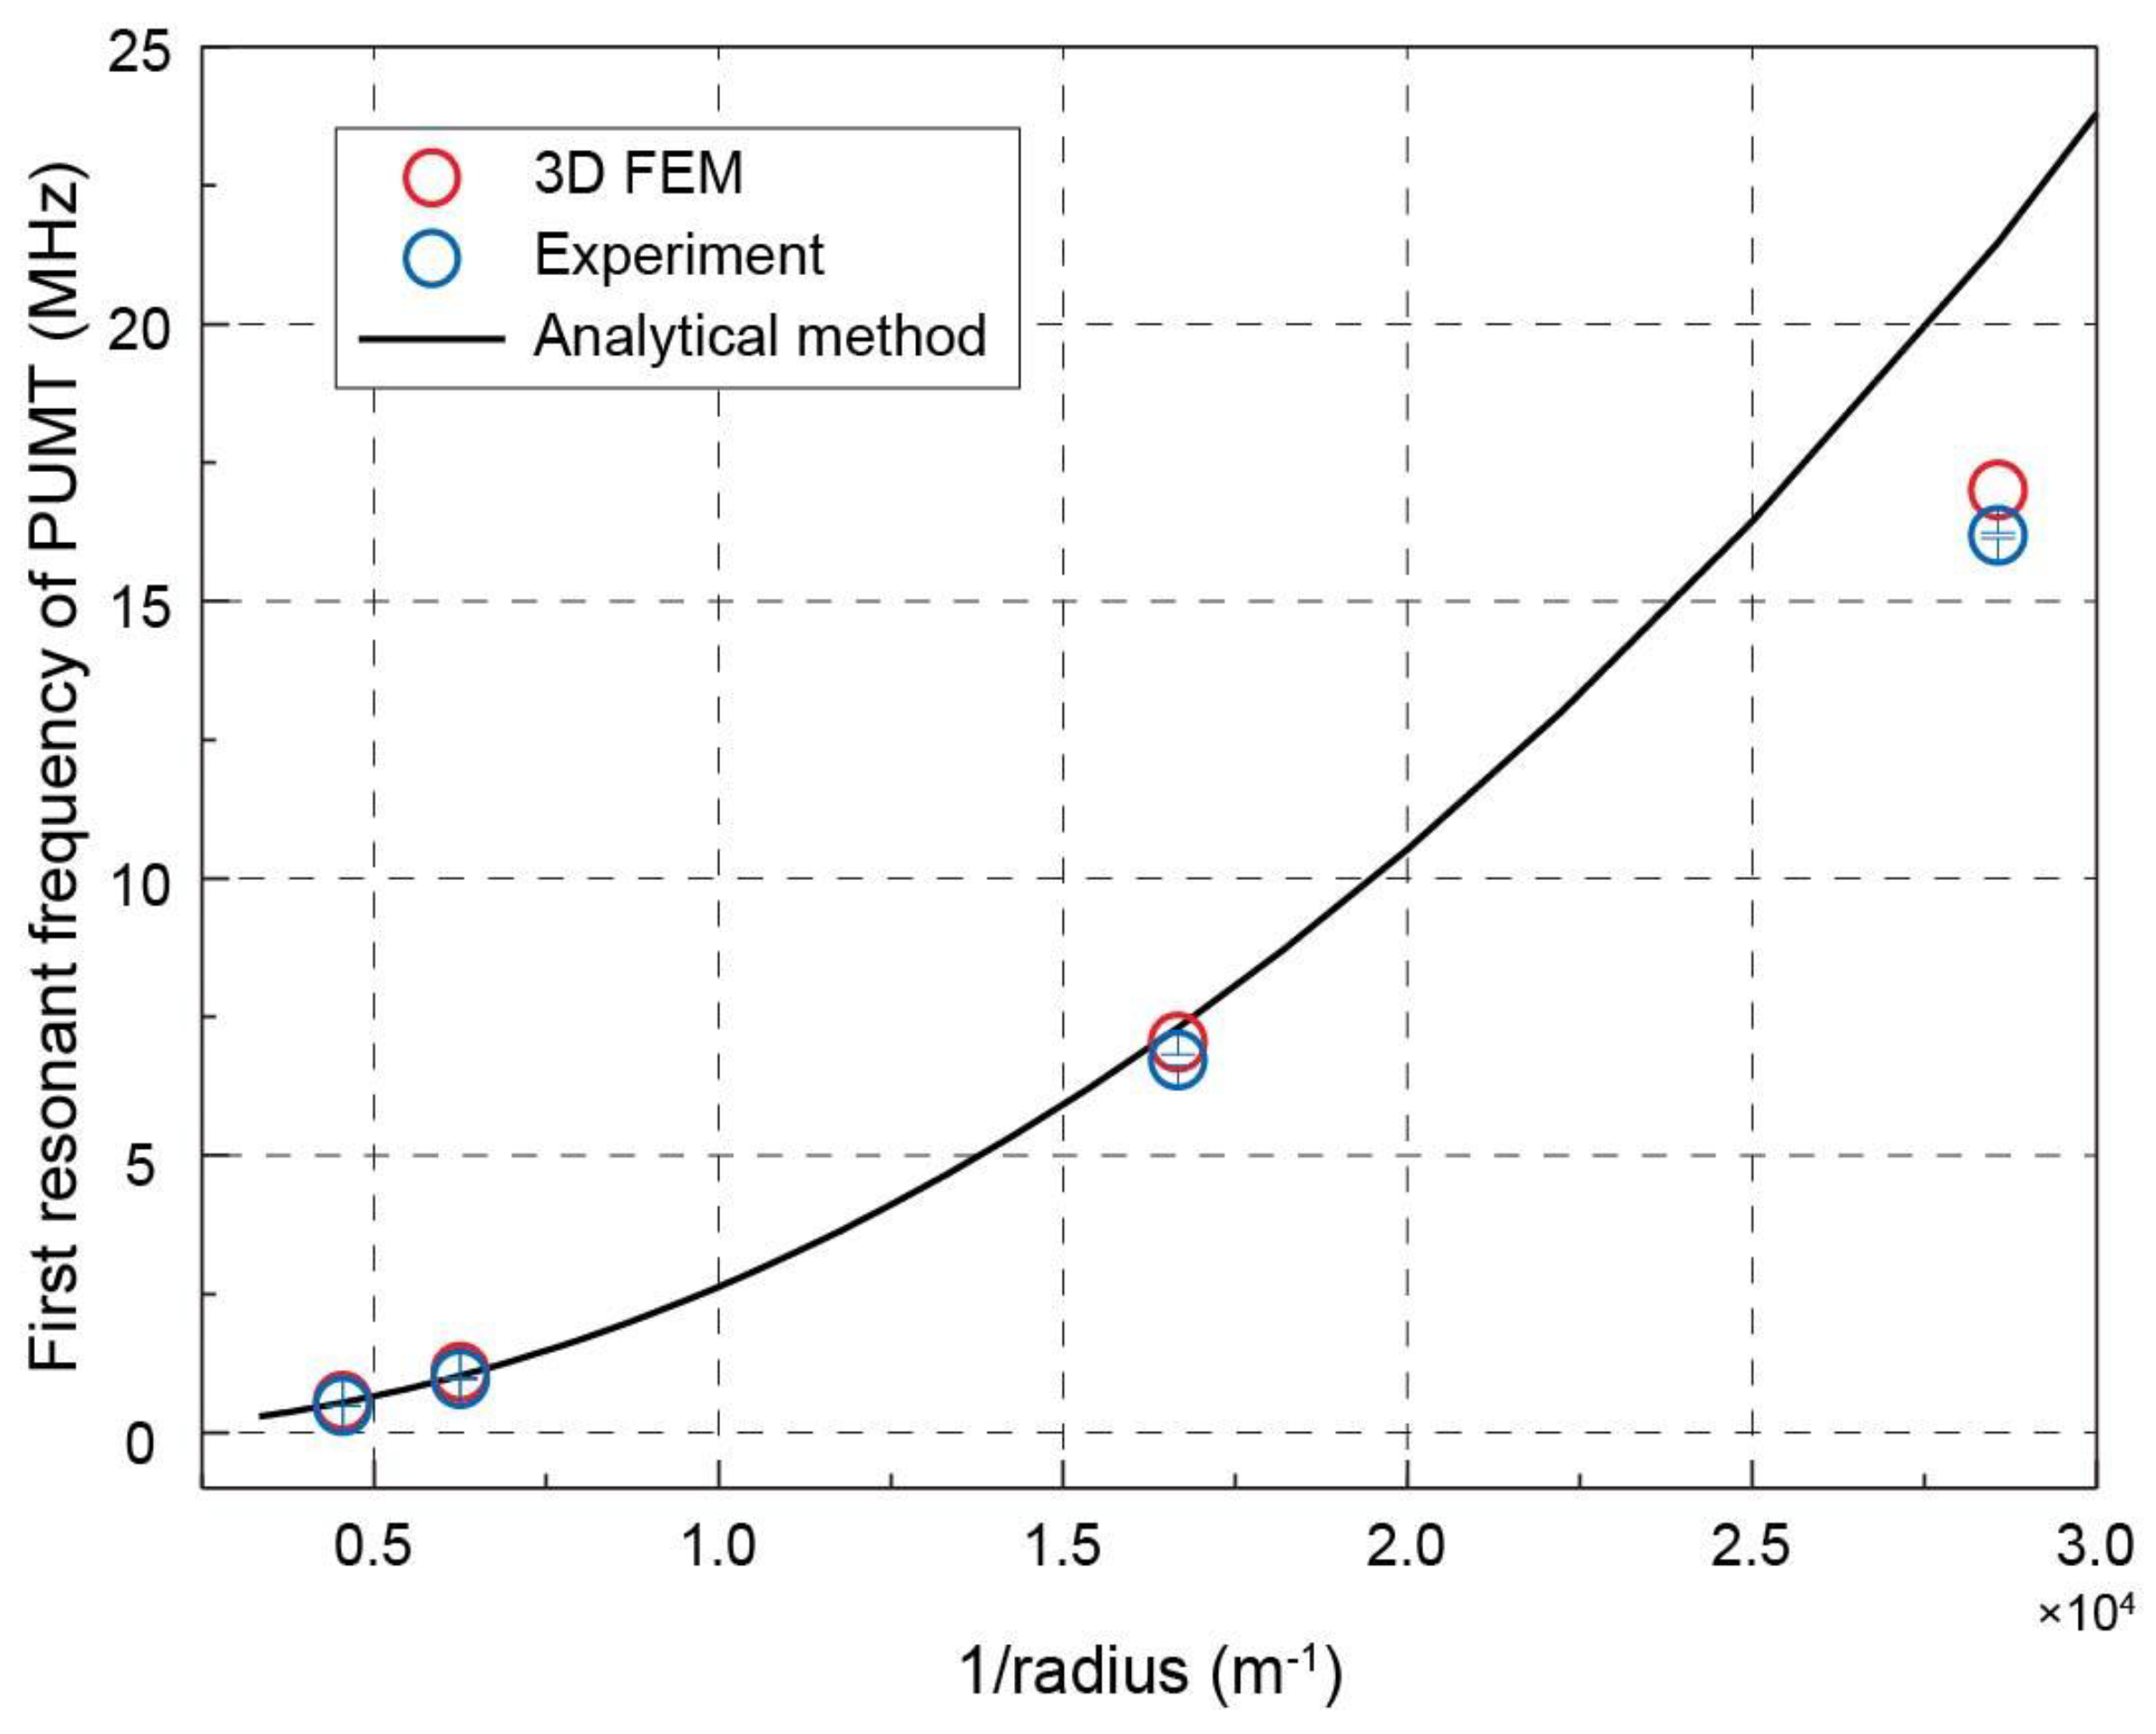

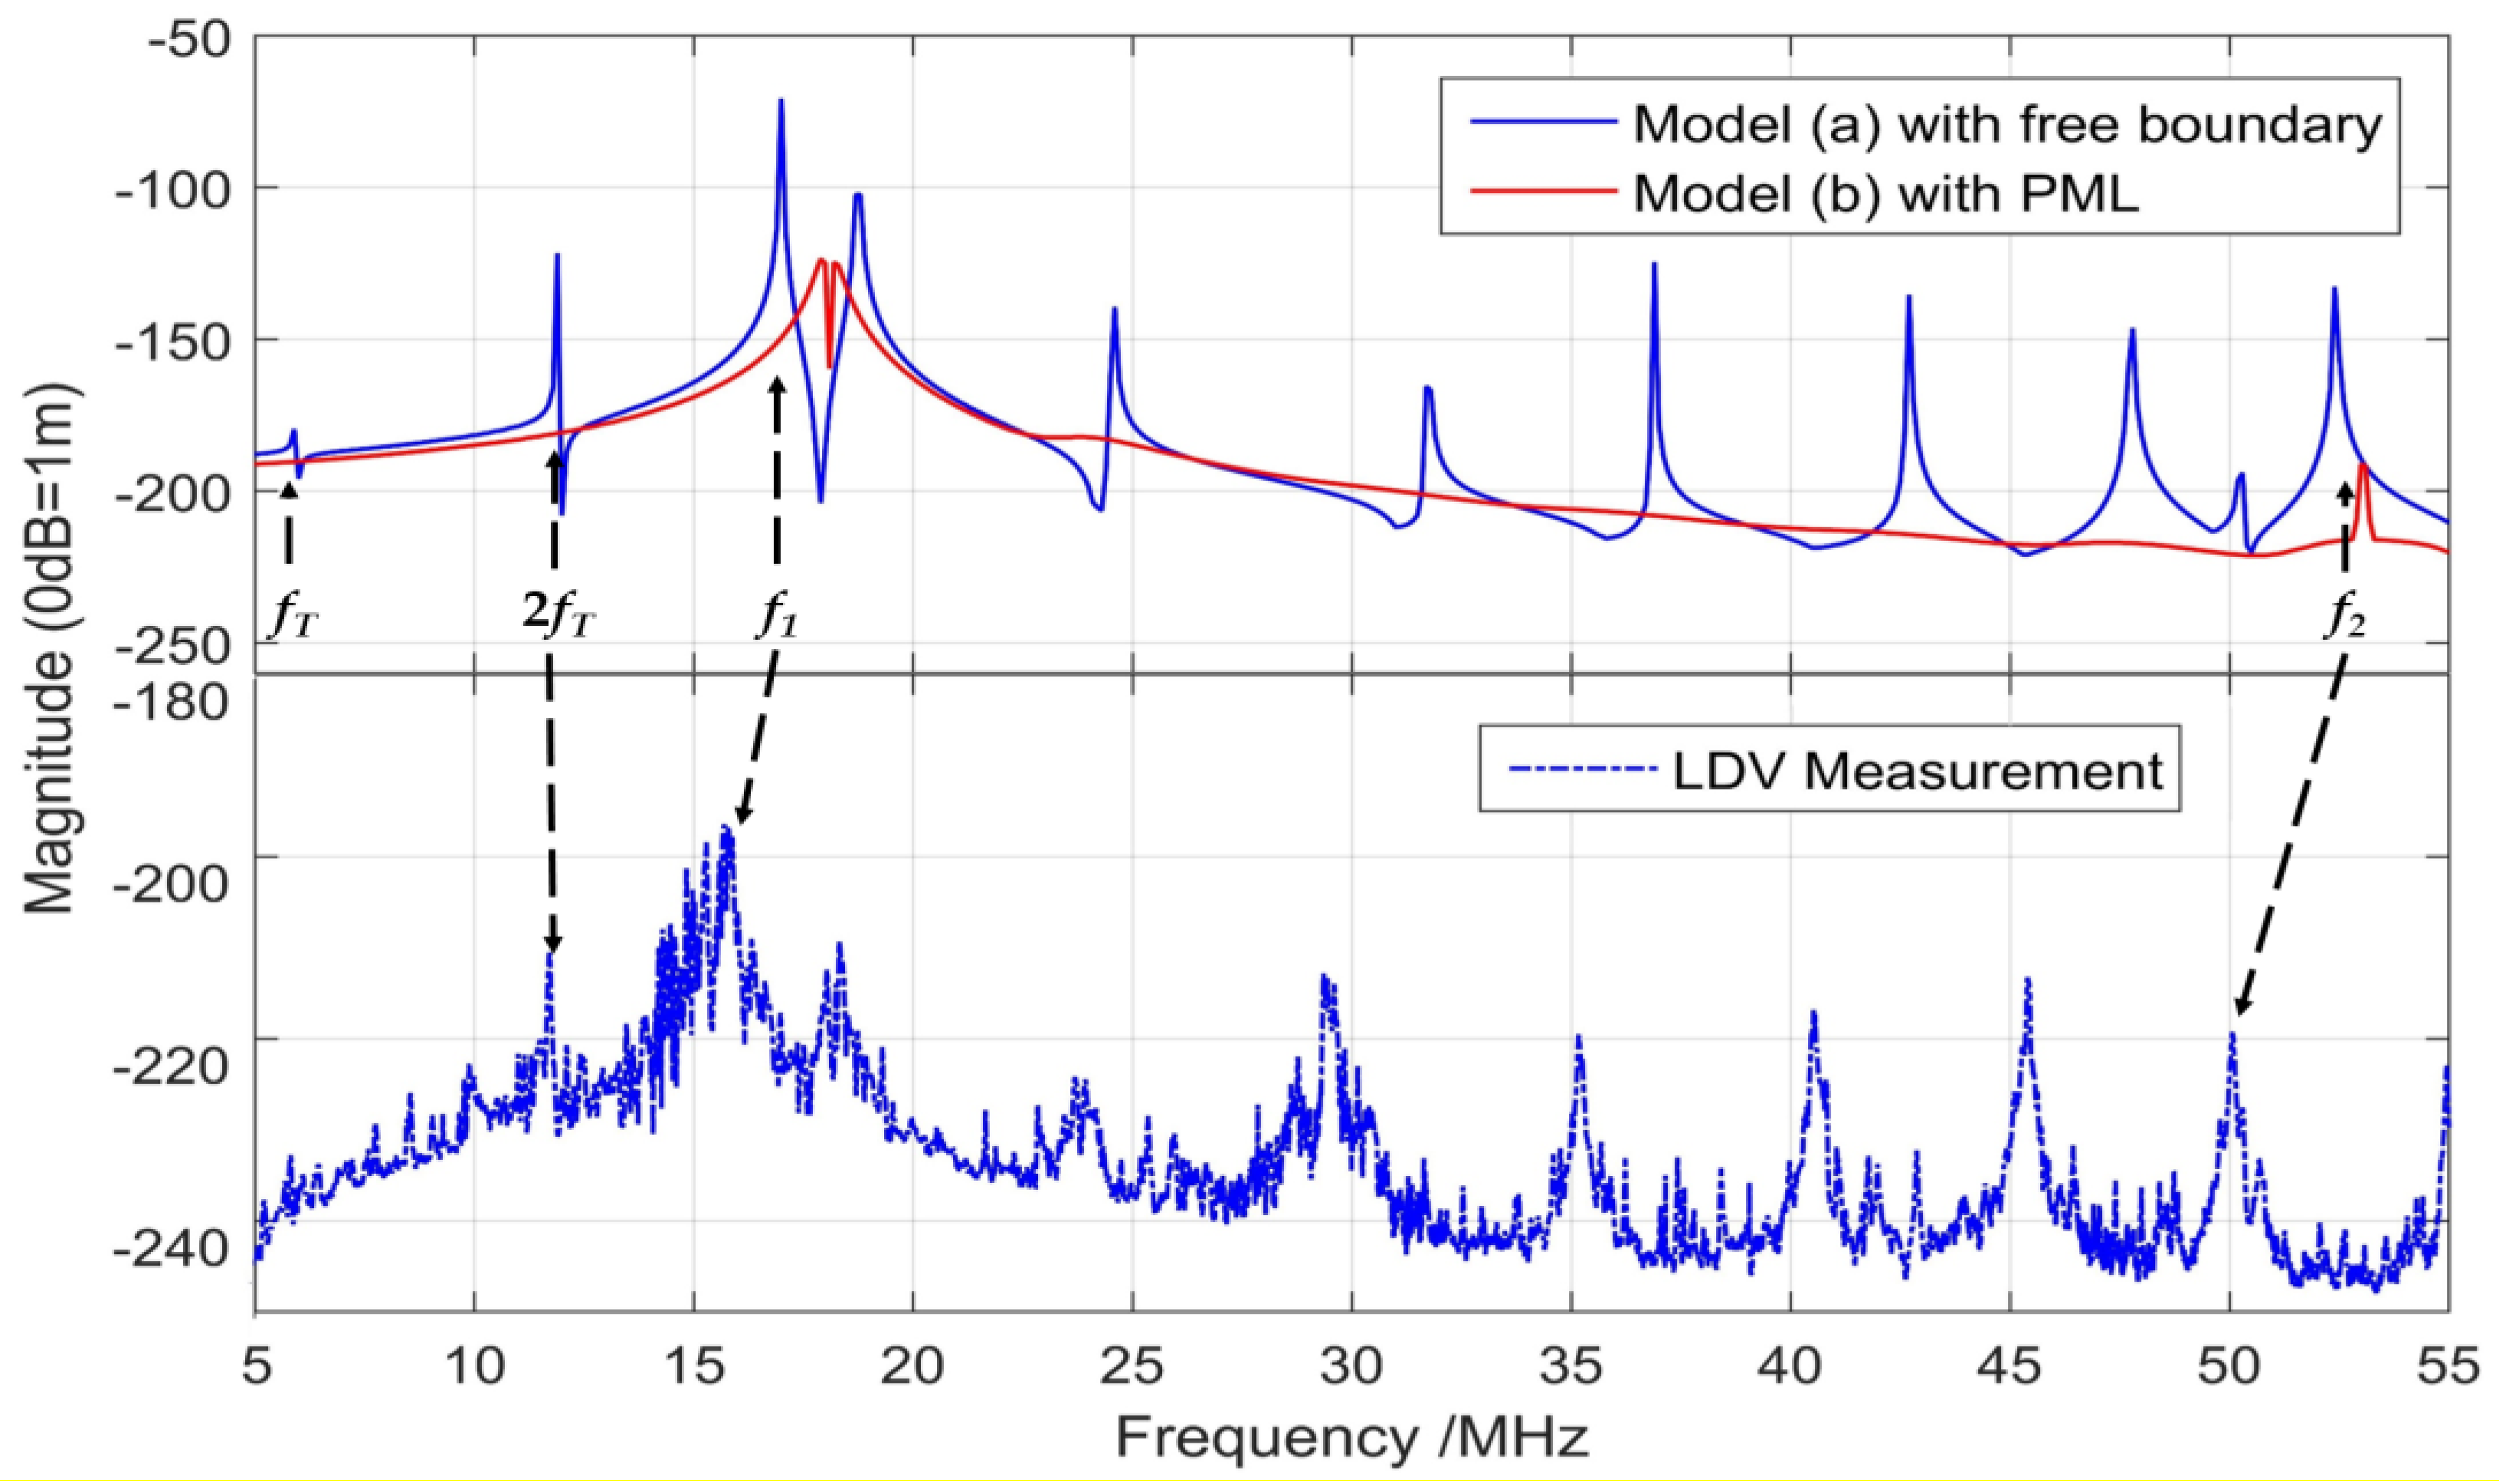
| Material | Top Mo Electrode | AlN | Bottom Mo Electrode | Silicon Membrane | Cavity | Substrate |
|---|---|---|---|---|---|---|
| Radius (μm) | 20 | 25 | 29 | - | 30 | - |
| Thickness (μm) | 0.15 | 1 | 0.15 | 5 | 20 | 715 |
| Property | Symbol | AlN | Si | Mo | SiO2 |
|---|---|---|---|---|---|
| Density (kg/m3) | ρ | 3512 | 2329 | 10,200 | 2200 |
| Poisson ratio | ν | 0.3 | 0.064 | 0.3 | 0.17 |
| Young’s modulus (GPa) | Y | 330 | 170 | 312 | 70 |
| Elastic stiffness matrix (GPa) | c11 | 345 | 195 | ||
| c12 | 125 | 36 | |||
| c13 | 120 | 64 | |||
| c33 | 395 | 166 | |||
| c44 | 118 | 80 | |||
| c66 | 110 | 51 | |||
| Piezoelectric stress matrix (C/m2) | e31 | −0.58 | |||
| e33 | 1.55 | ||||
| e15 | −0.48 | ||||
| Dielectric permittivity (-) | ε/ε0 | 11 |
| Radius (μm) | First Resonant Frequency (in Hz) | Difference | |
|---|---|---|---|
| 3D FEM Model | Experiment | ||
| 220 | 536 k | 486 ± 2 k | 10% |
| 160 | 1060 k | 976 ± 4 k | 8.6% |
| 60 | 7.0 M | 6.6 ± 0.1 M | 6% |
| 35 | 17.0 M | 16.0 ± 0.2 M | 6% |
| Resonance | f1 | f2 |
|---|---|---|
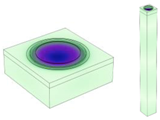
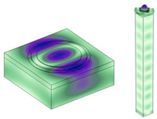
| Numerical | 17.0 MHz | 52.4 MHz |
 |  | |
| Experimental | 15.8 MHz | 50.1 MHz |
 |  |
© 2019 by the authors. Licensee MDPI, Basel, Switzerland. This article is an open access article distributed under the terms and conditions of the Creative Commons Attribution (CC BY) license (http://creativecommons.org/licenses/by/4.0/).
Share and Cite
Liu, W.; He, L.; Wang, X.; Zhou, J.; Xu, W.; Smagin, N.; Toubal, M.; Yu, H.; Gu, Y.; Xu, J.; et al. 3D FEM Analysis of High-Frequency AlN-Based PMUT Arrays on Cavity SOI. Sensors 2019, 19, 4450. https://doi.org/10.3390/s19204450
Liu W, He L, Wang X, Zhou J, Xu W, Smagin N, Toubal M, Yu H, Gu Y, Xu J, et al. 3D FEM Analysis of High-Frequency AlN-Based PMUT Arrays on Cavity SOI. Sensors. 2019; 19(20):4450. https://doi.org/10.3390/s19204450
Chicago/Turabian StyleLiu, Wenjuan, Leming He, Xubo Wang, Jia Zhou, Weijiang Xu, Nikolay Smagin, Malika Toubal, Hao Yu, Yuandong Gu, Jinghui Xu, and et al. 2019. "3D FEM Analysis of High-Frequency AlN-Based PMUT Arrays on Cavity SOI" Sensors 19, no. 20: 4450. https://doi.org/10.3390/s19204450
APA StyleLiu, W., He, L., Wang, X., Zhou, J., Xu, W., Smagin, N., Toubal, M., Yu, H., Gu, Y., Xu, J., Remiens, D., & Ren, J. (2019). 3D FEM Analysis of High-Frequency AlN-Based PMUT Arrays on Cavity SOI. Sensors, 19(20), 4450. https://doi.org/10.3390/s19204450


