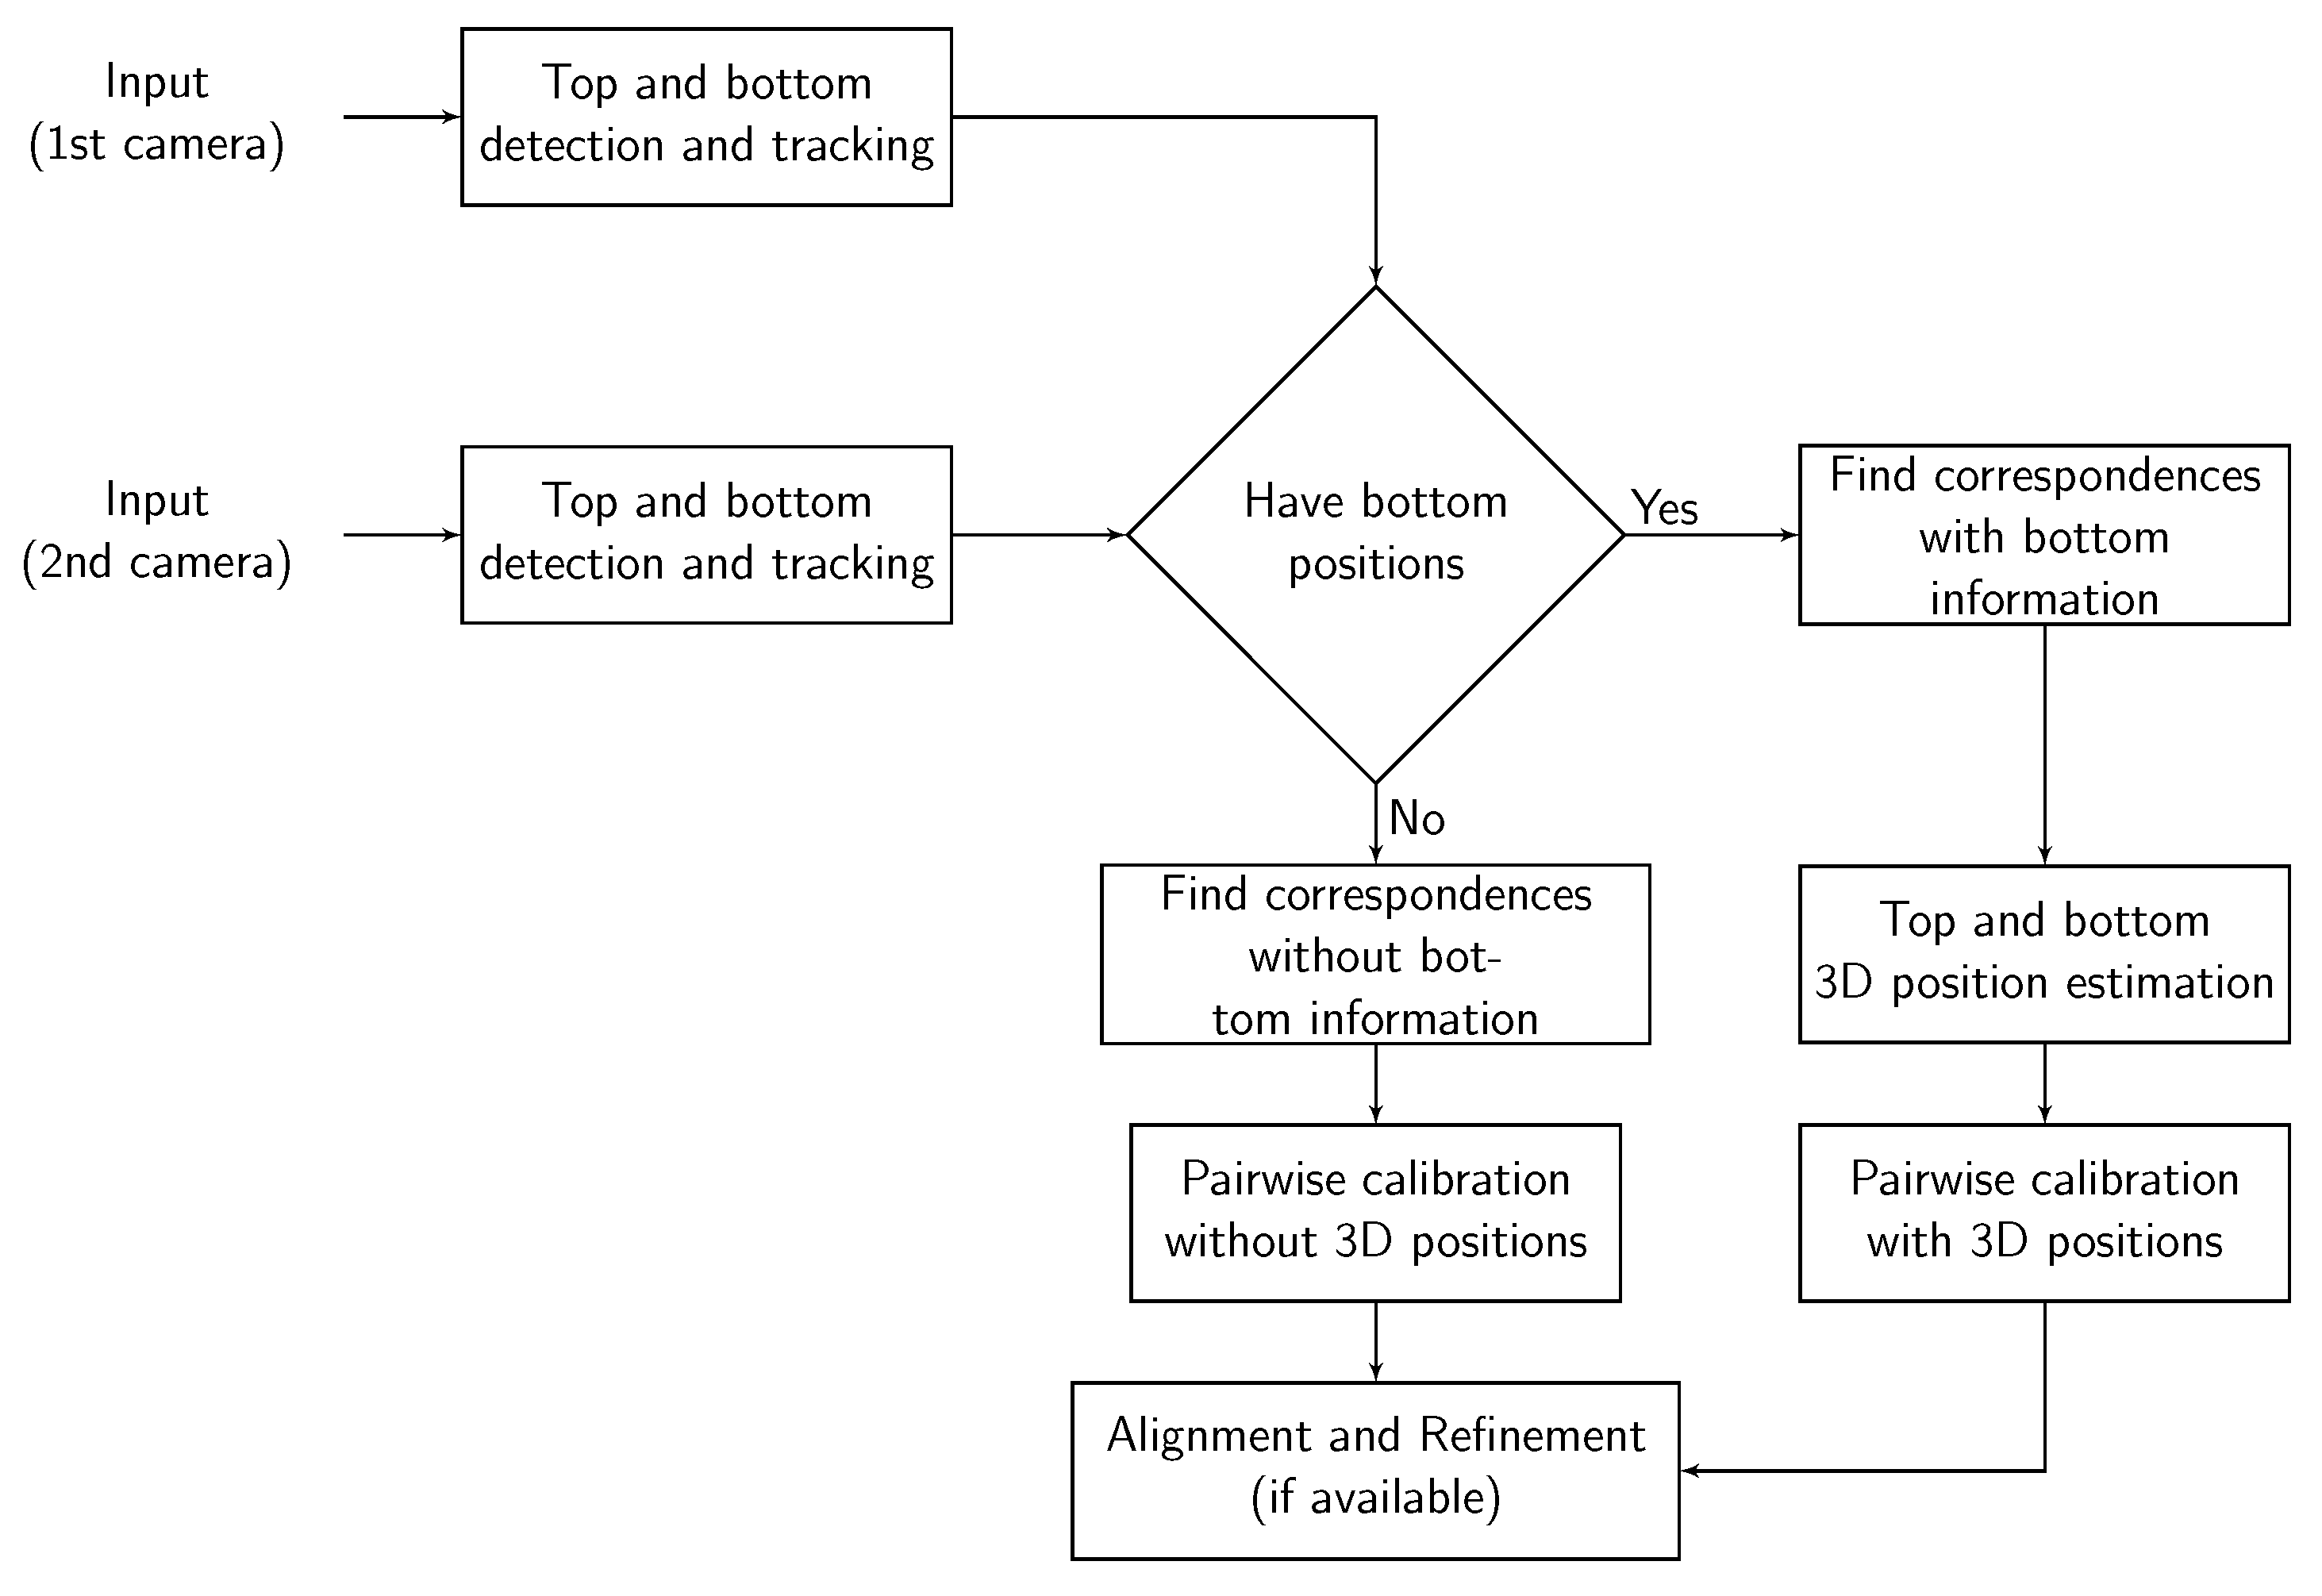
Figure 1.
Block scheme of the proposed calibration method.
Figure 1.
Block scheme of the proposed calibration method.
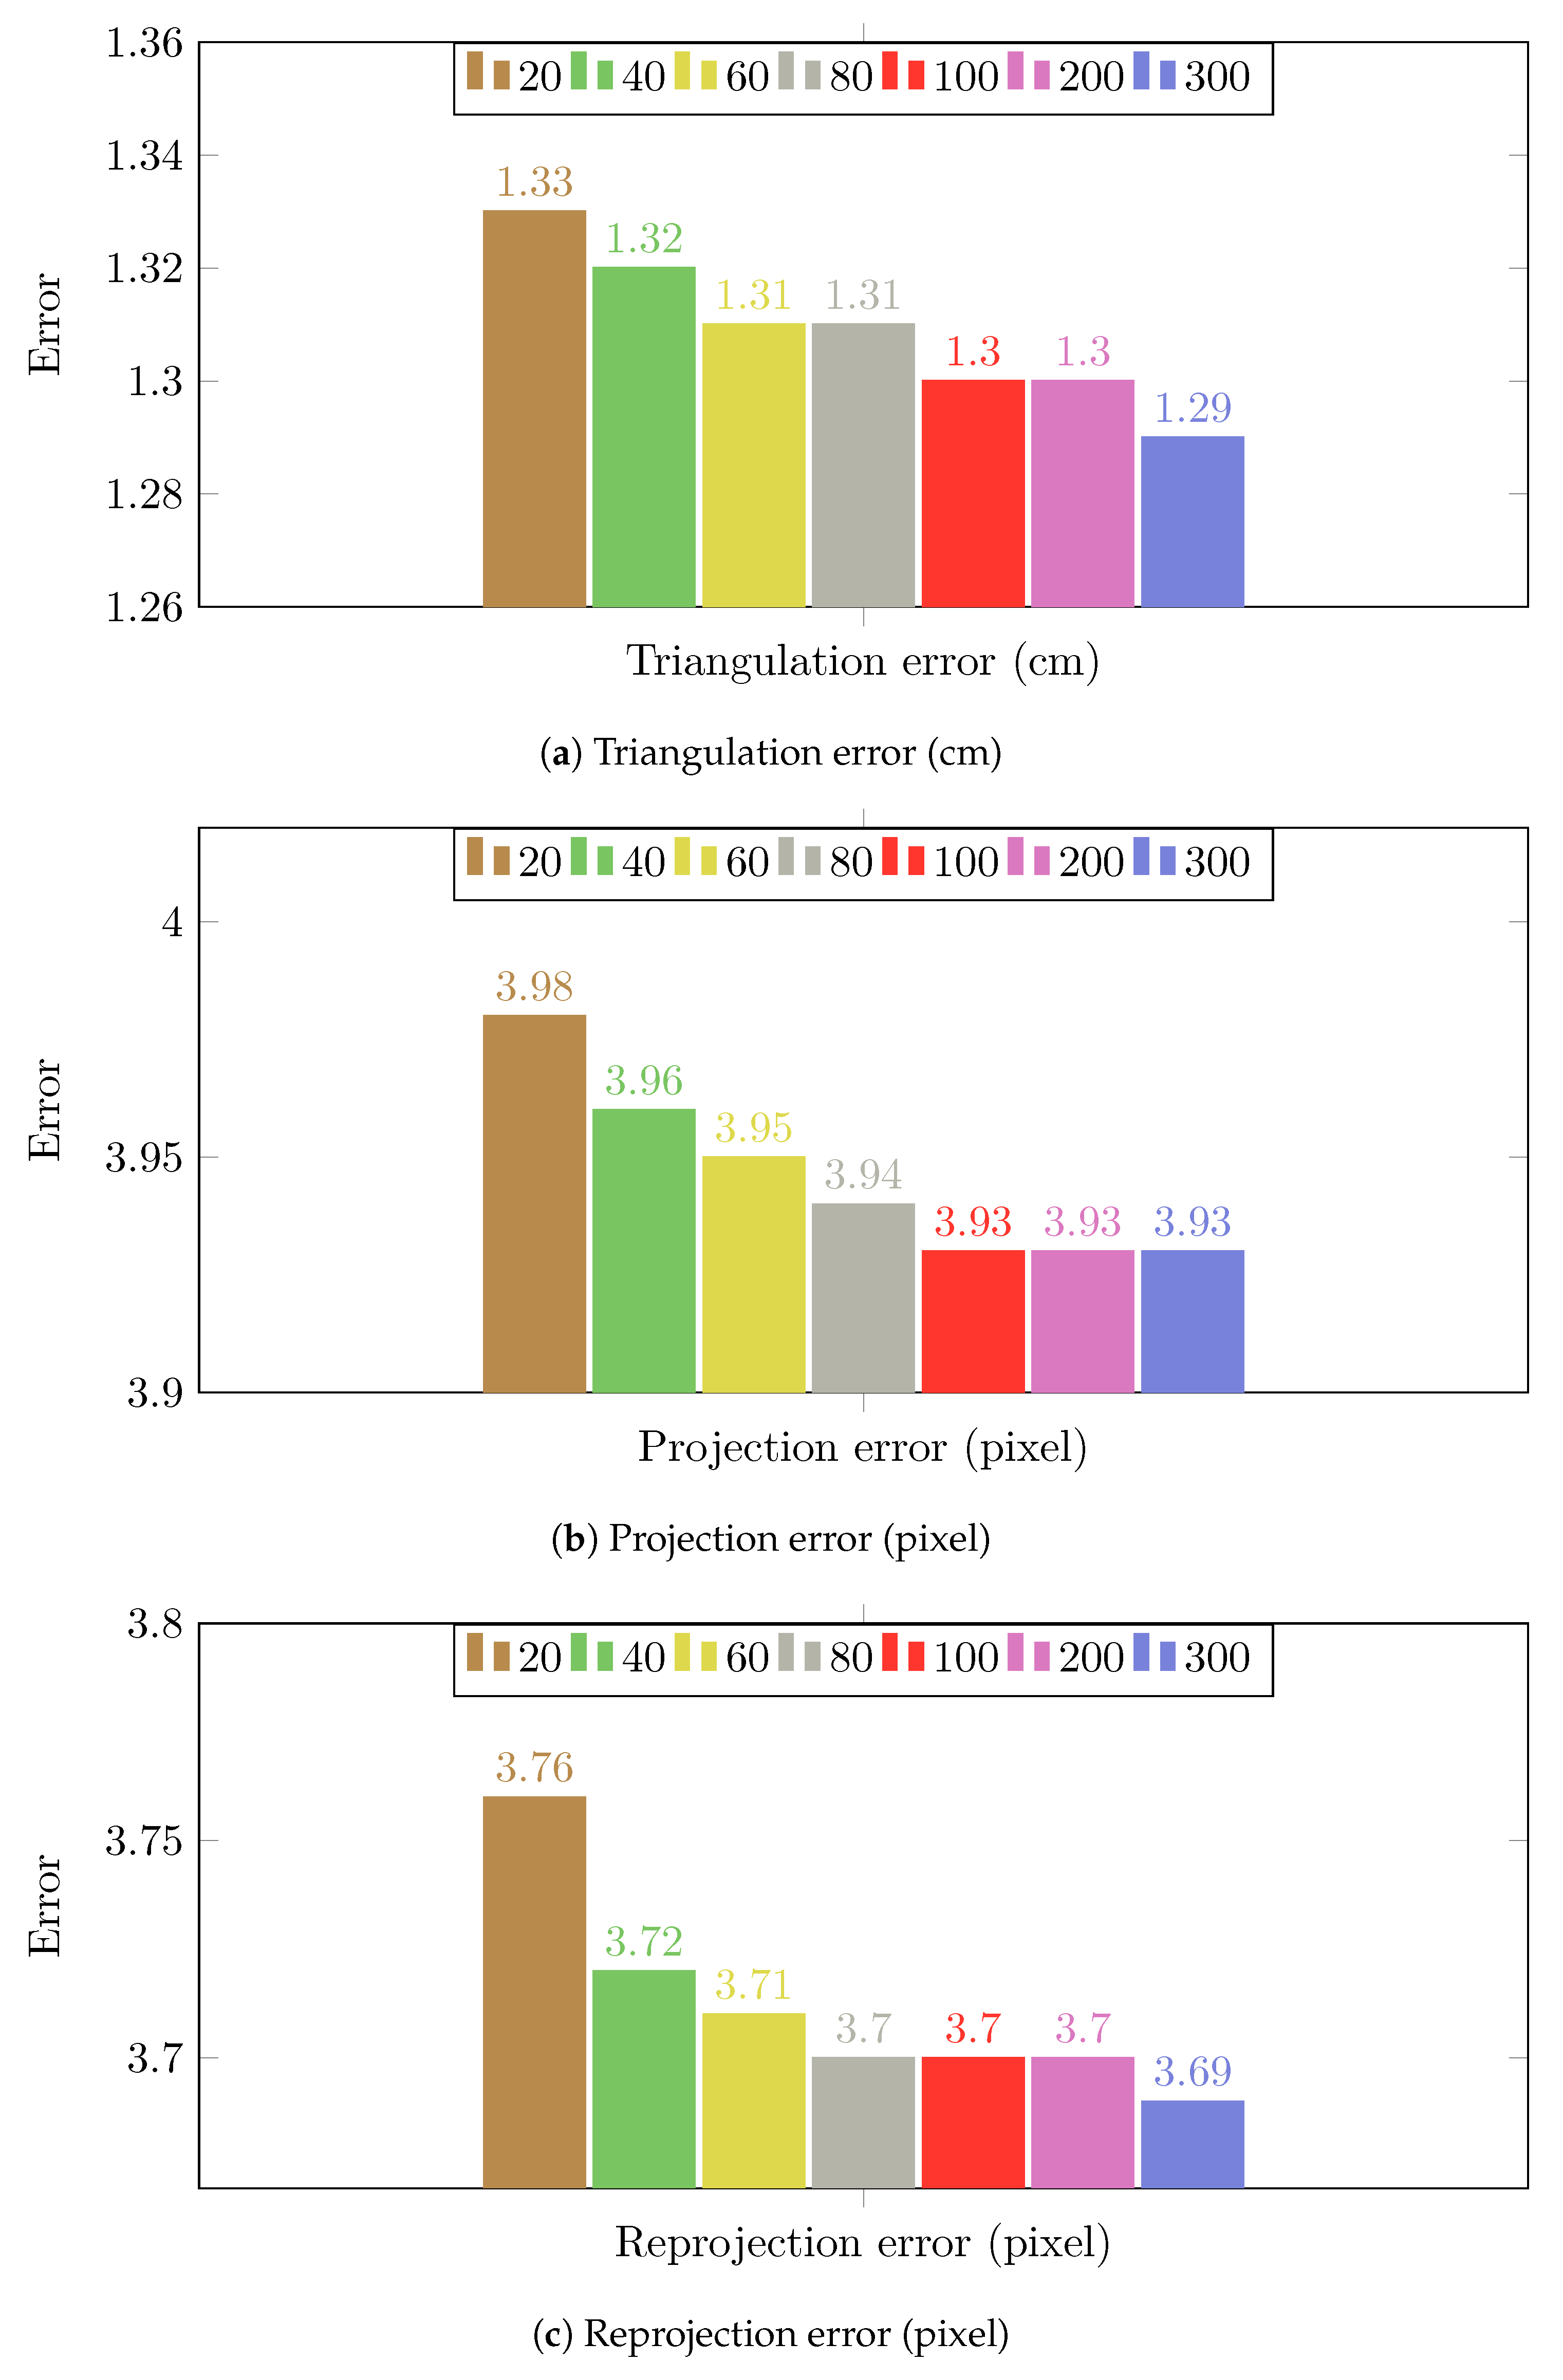
Figure 2.
The calibration results of the proposed method on Camera Network 1 (multiple people walking in an empty room) by using different number of random locations. Each location yields two calibration samples (top and bottom).
Figure 2.
The calibration results of the proposed method on Camera Network 1 (multiple people walking in an empty room) by using different number of random locations. Each location yields two calibration samples (top and bottom).
Figure 3.
Example of detected the bottom and top positions of the pedestrians of Camera Network 1—single person walking in an empty room. Red color represents detected positions by the human pose estimation method. Green color represents the detected reprojected positions.
Figure 3.
Example of detected the bottom and top positions of the pedestrians of Camera Network 1—single person walking in an empty room. Red color represents detected positions by the human pose estimation method. Green color represents the detected reprojected positions.
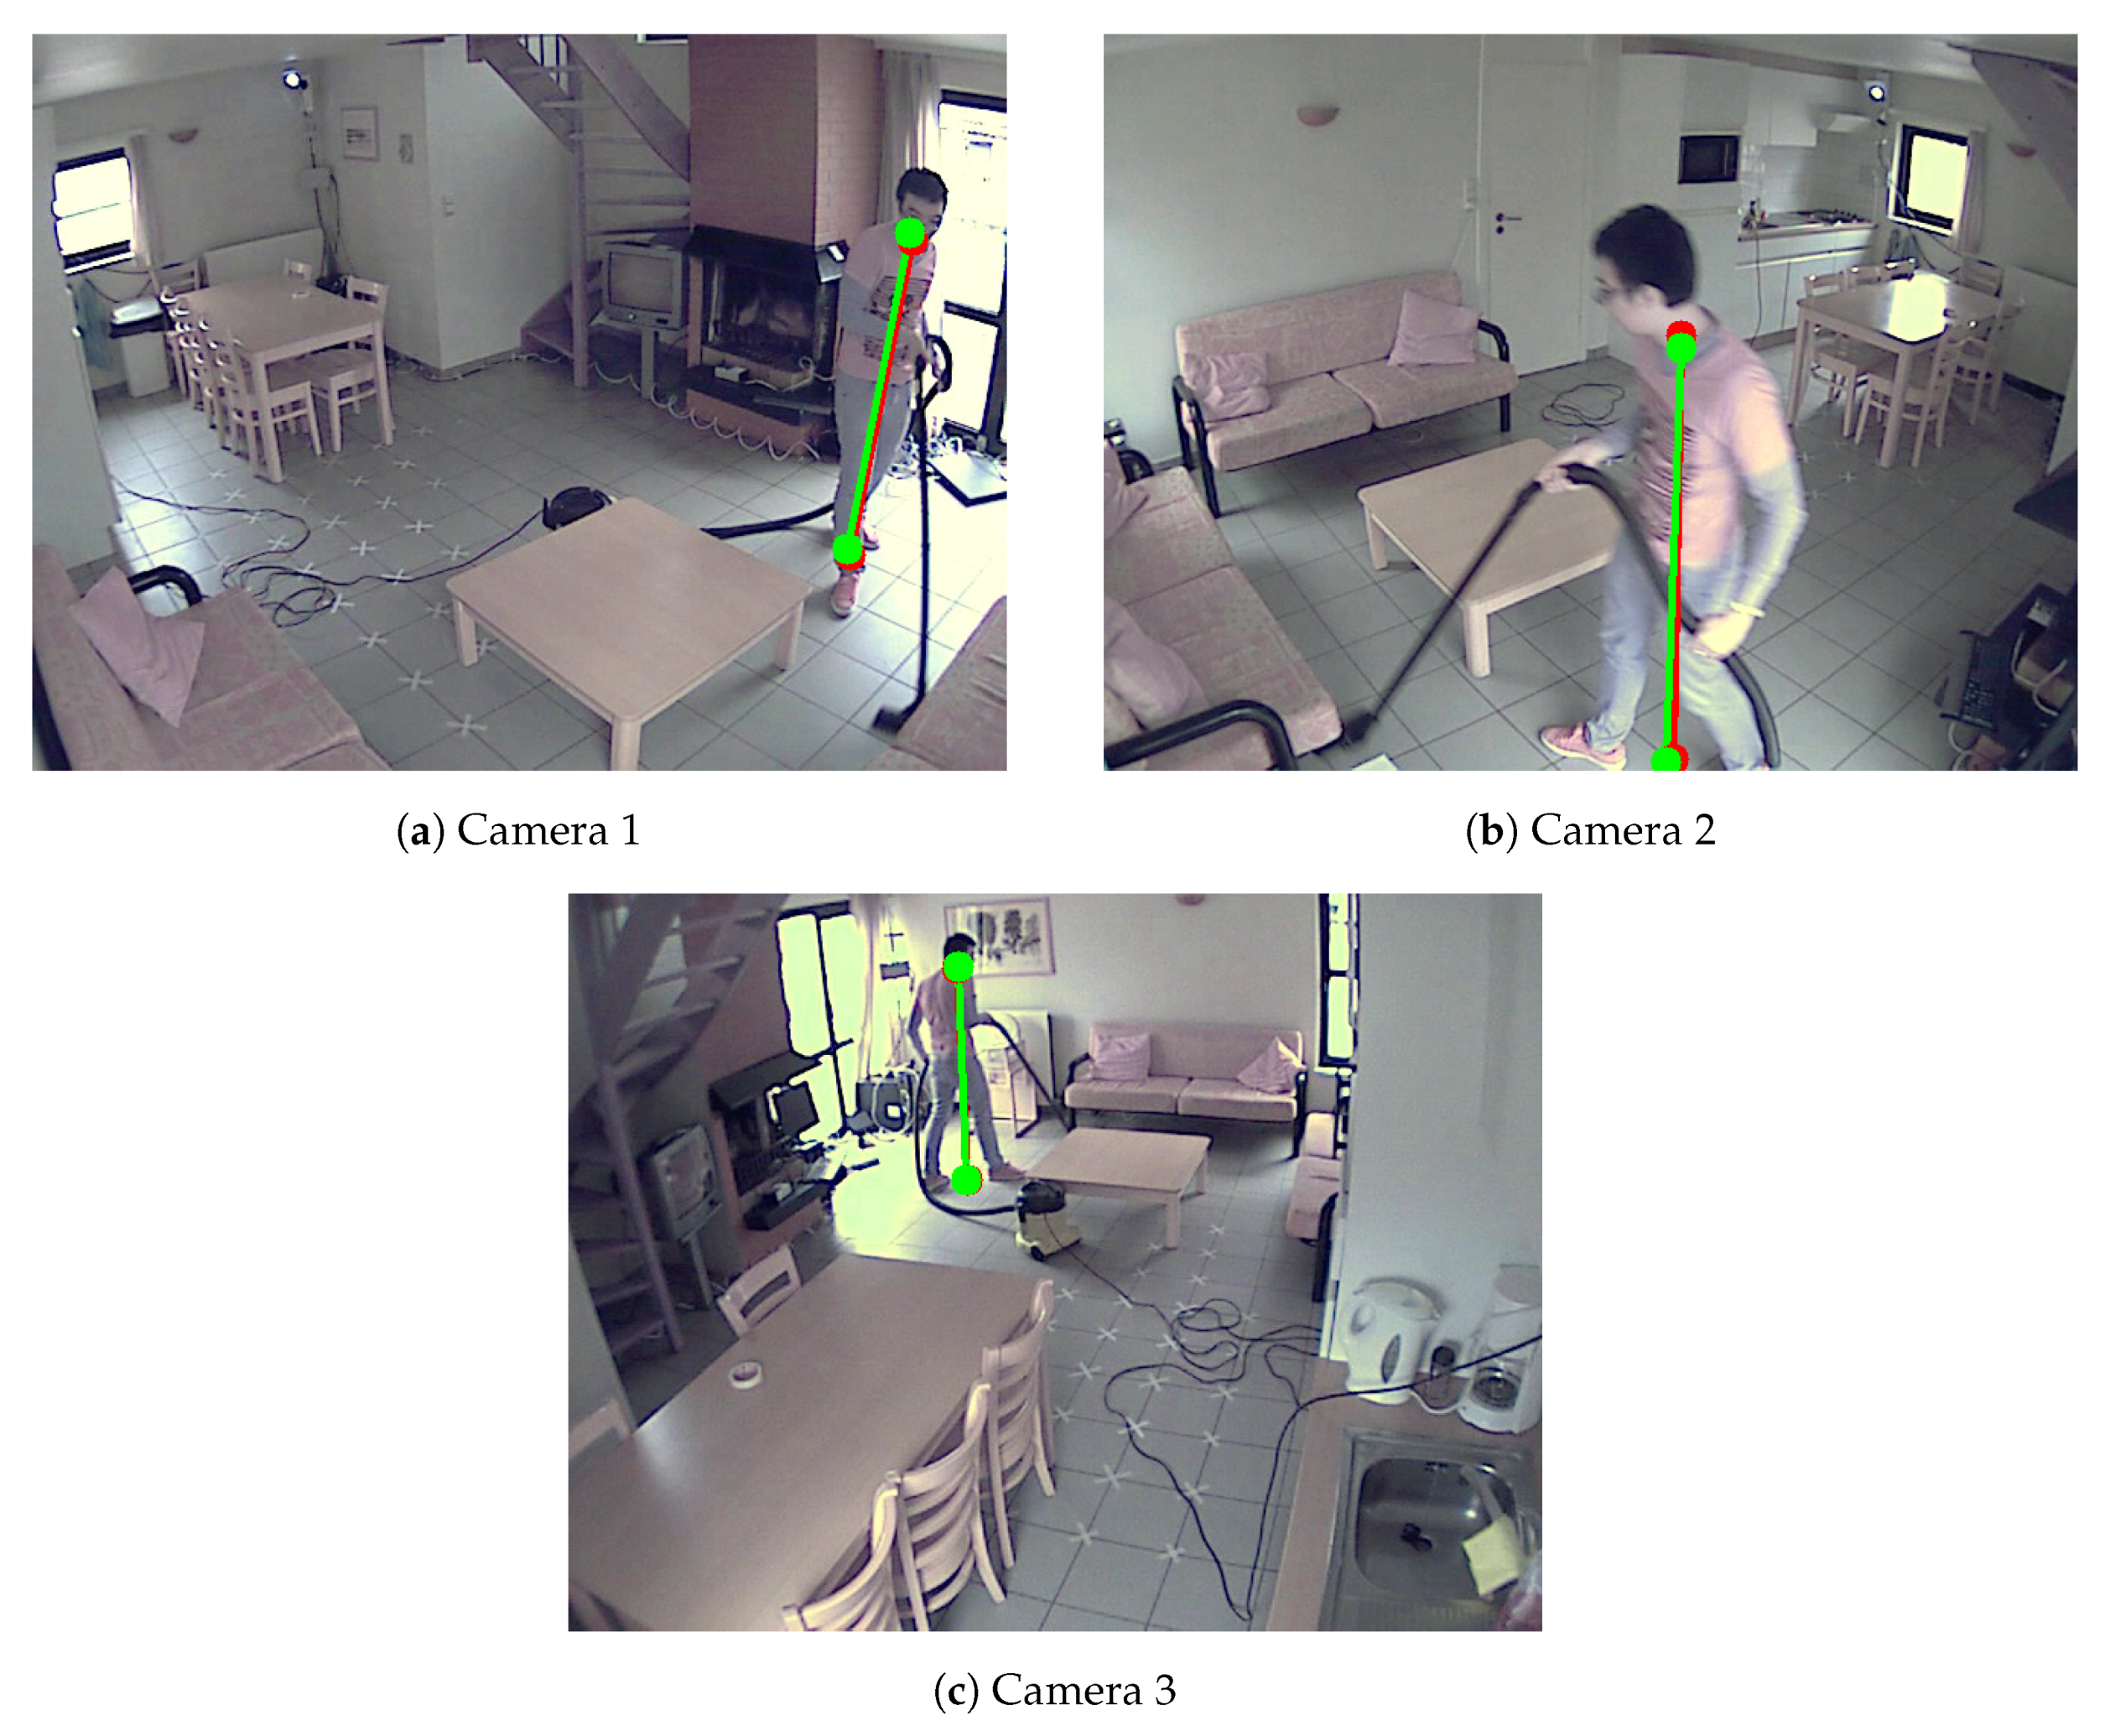
Figure 4.
Example of detected the bottom and top positions of the pedestrians of Camera Network 2—single person doing household work in an kitchen room. Red color represents detected positions by the human pose estimation method. Green color represents the detected reprojected positions.
Figure 4.
Example of detected the bottom and top positions of the pedestrians of Camera Network 2—single person doing household work in an kitchen room. Red color represents detected positions by the human pose estimation method. Green color represents the detected reprojected positions.
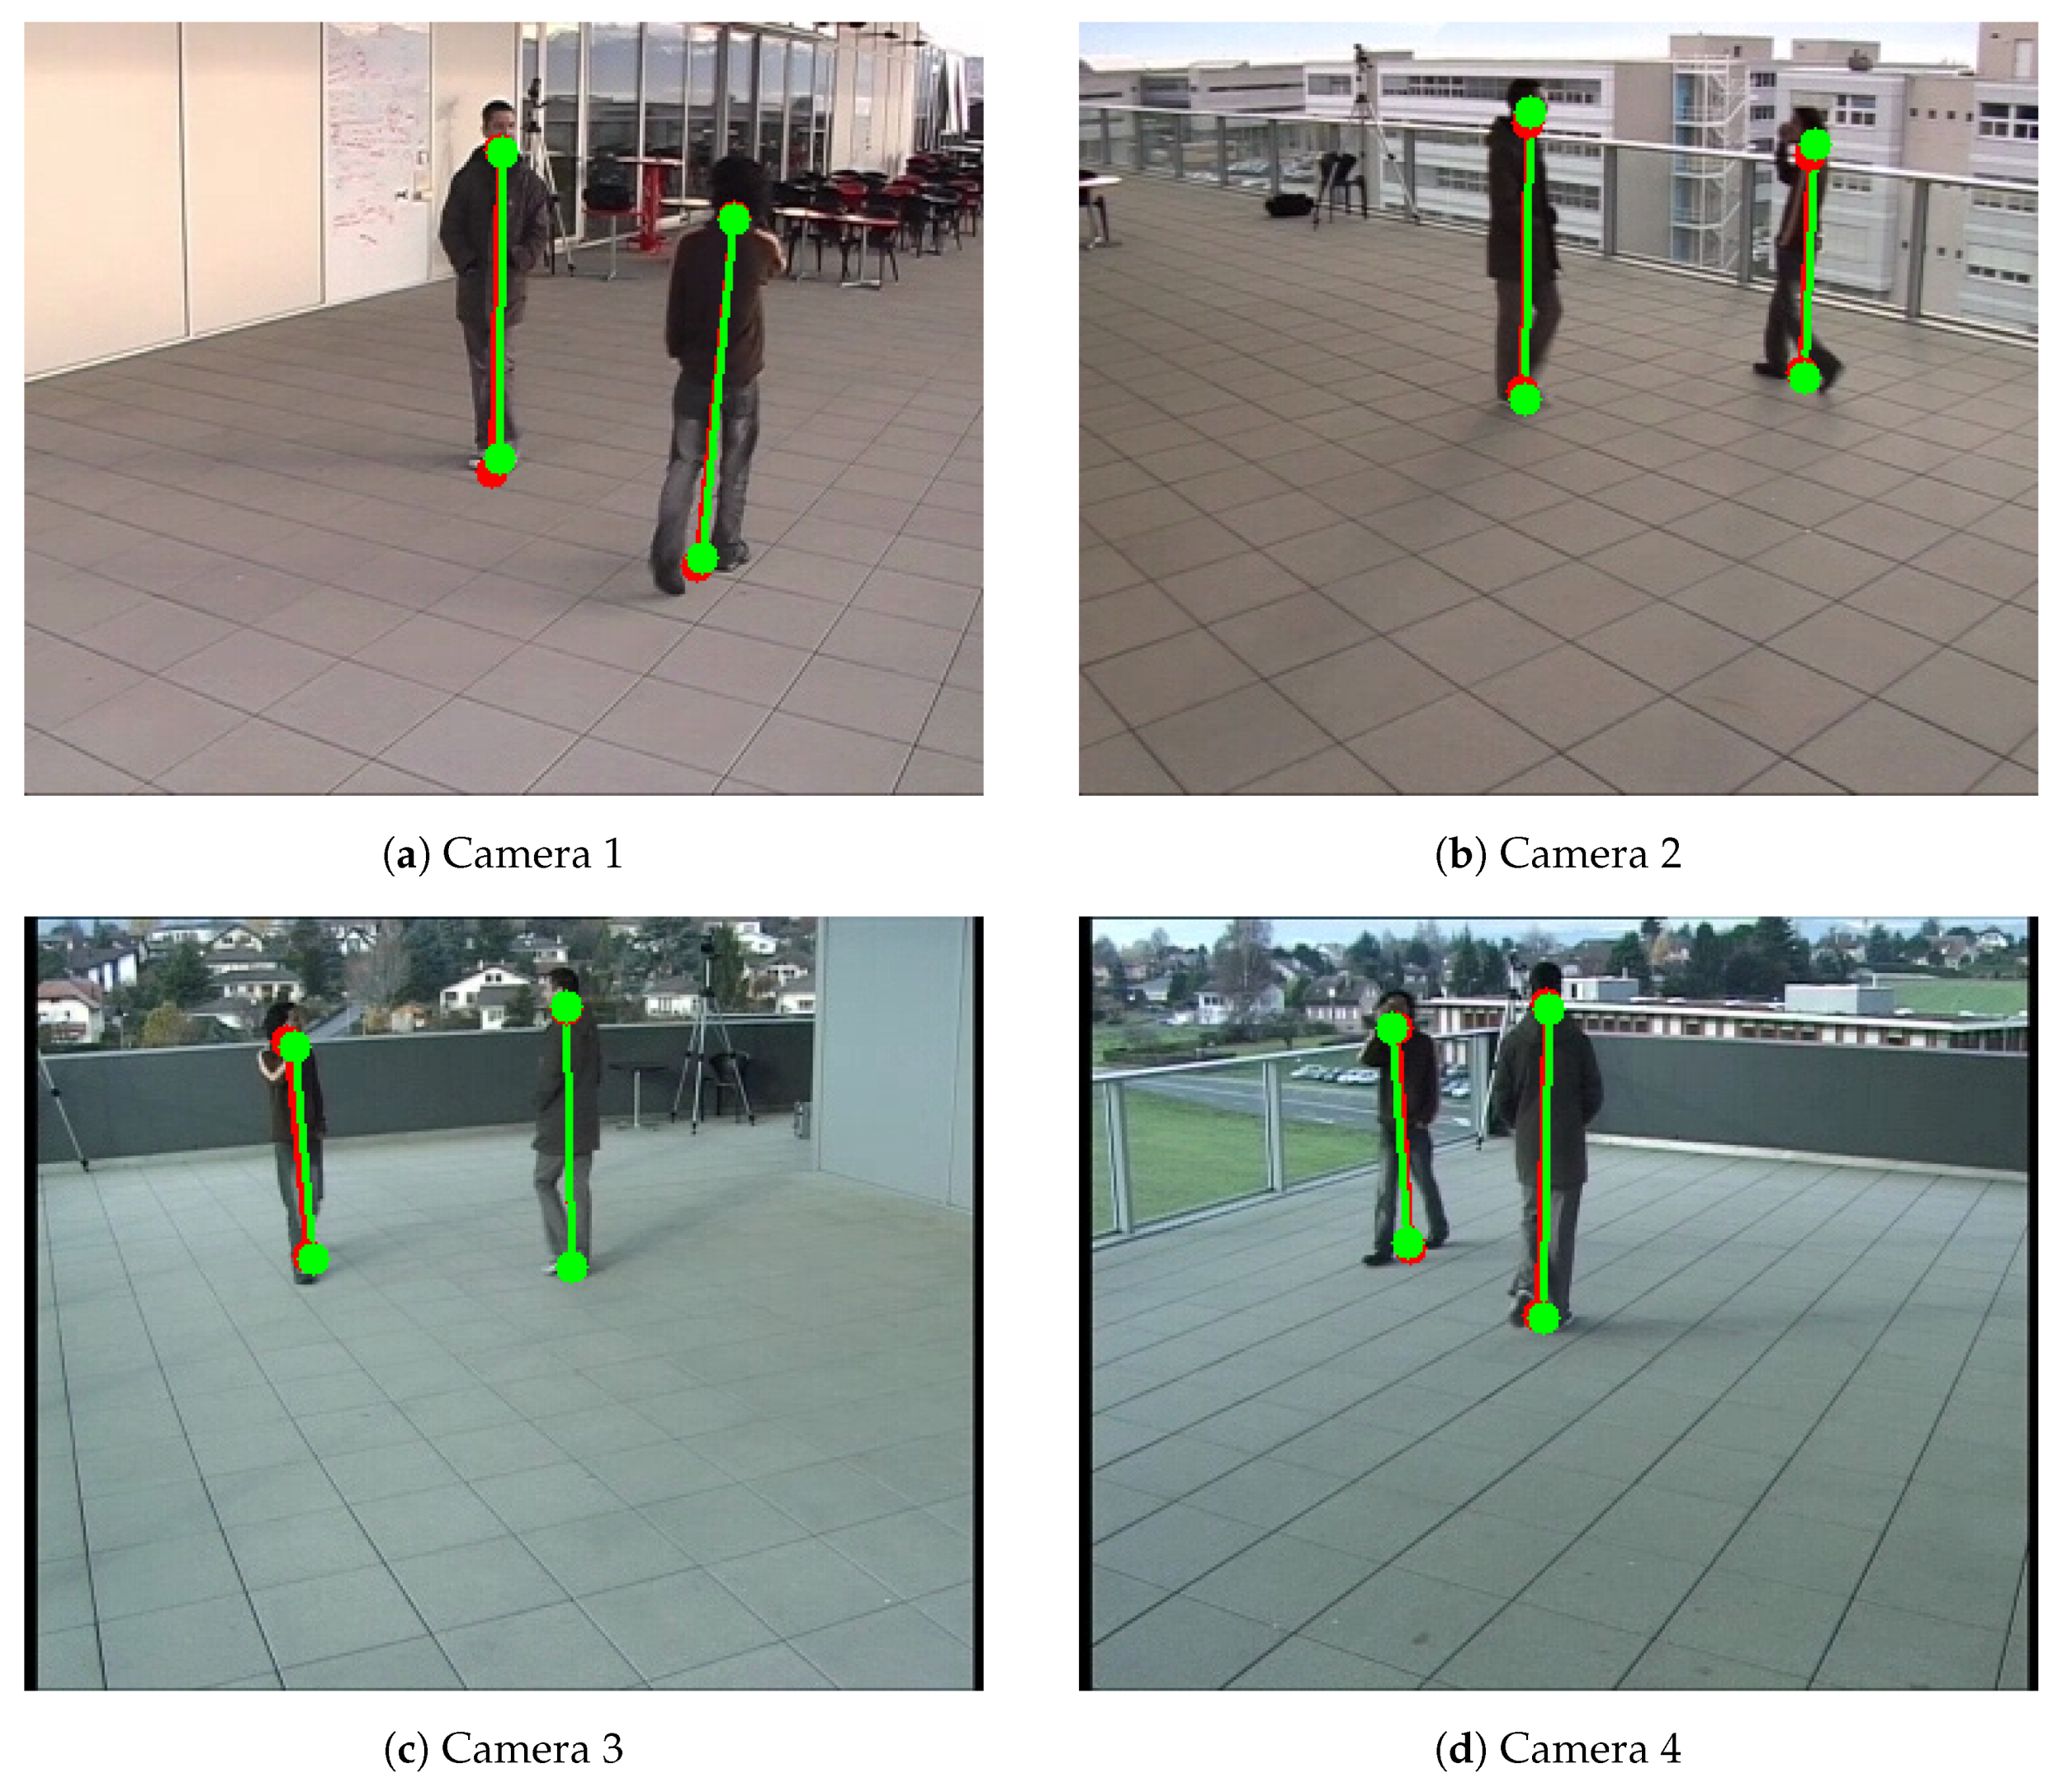
Figure 5.
Example of detected the bottom and top positions of the pedestrians of Camera Network 3—EPFL-Terrace dataset [
37]. Red color represents detected positions by the human pose estimation method. Green color represents the detected reprojected positions.
Figure 5.
Example of detected the bottom and top positions of the pedestrians of Camera Network 3—EPFL-Terrace dataset [
37]. Red color represents detected positions by the human pose estimation method. Green color represents the detected reprojected positions.
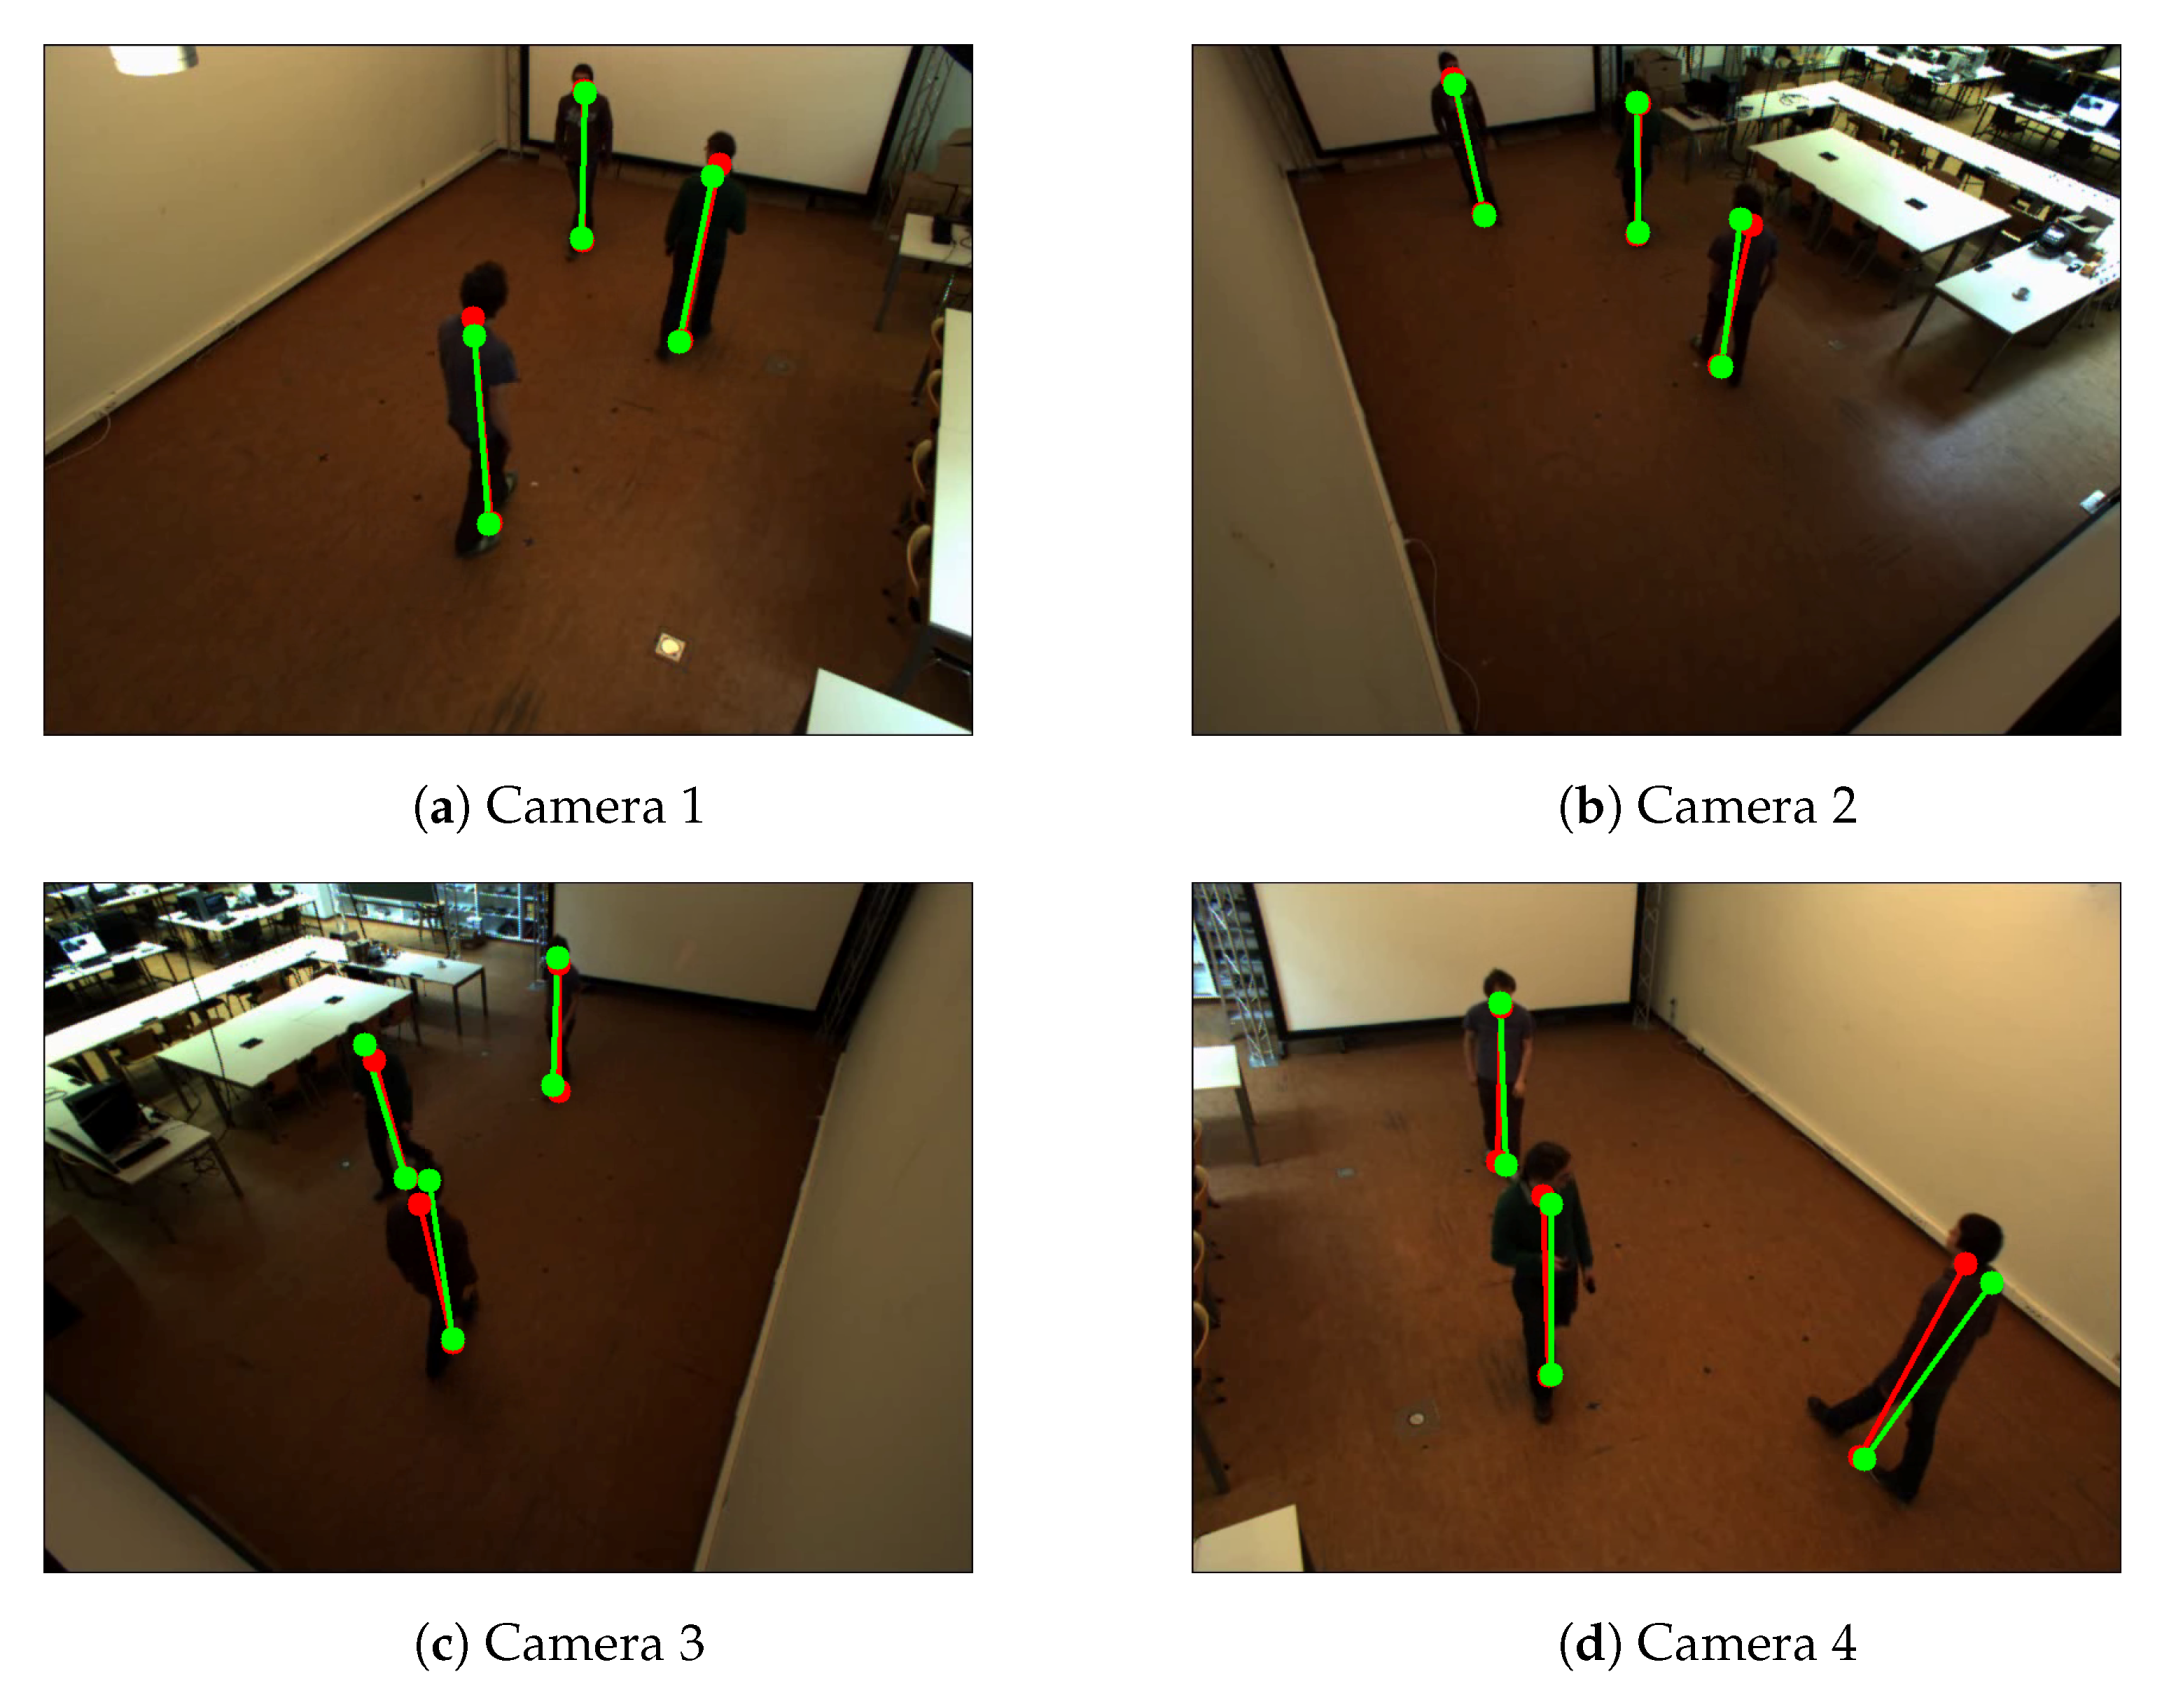
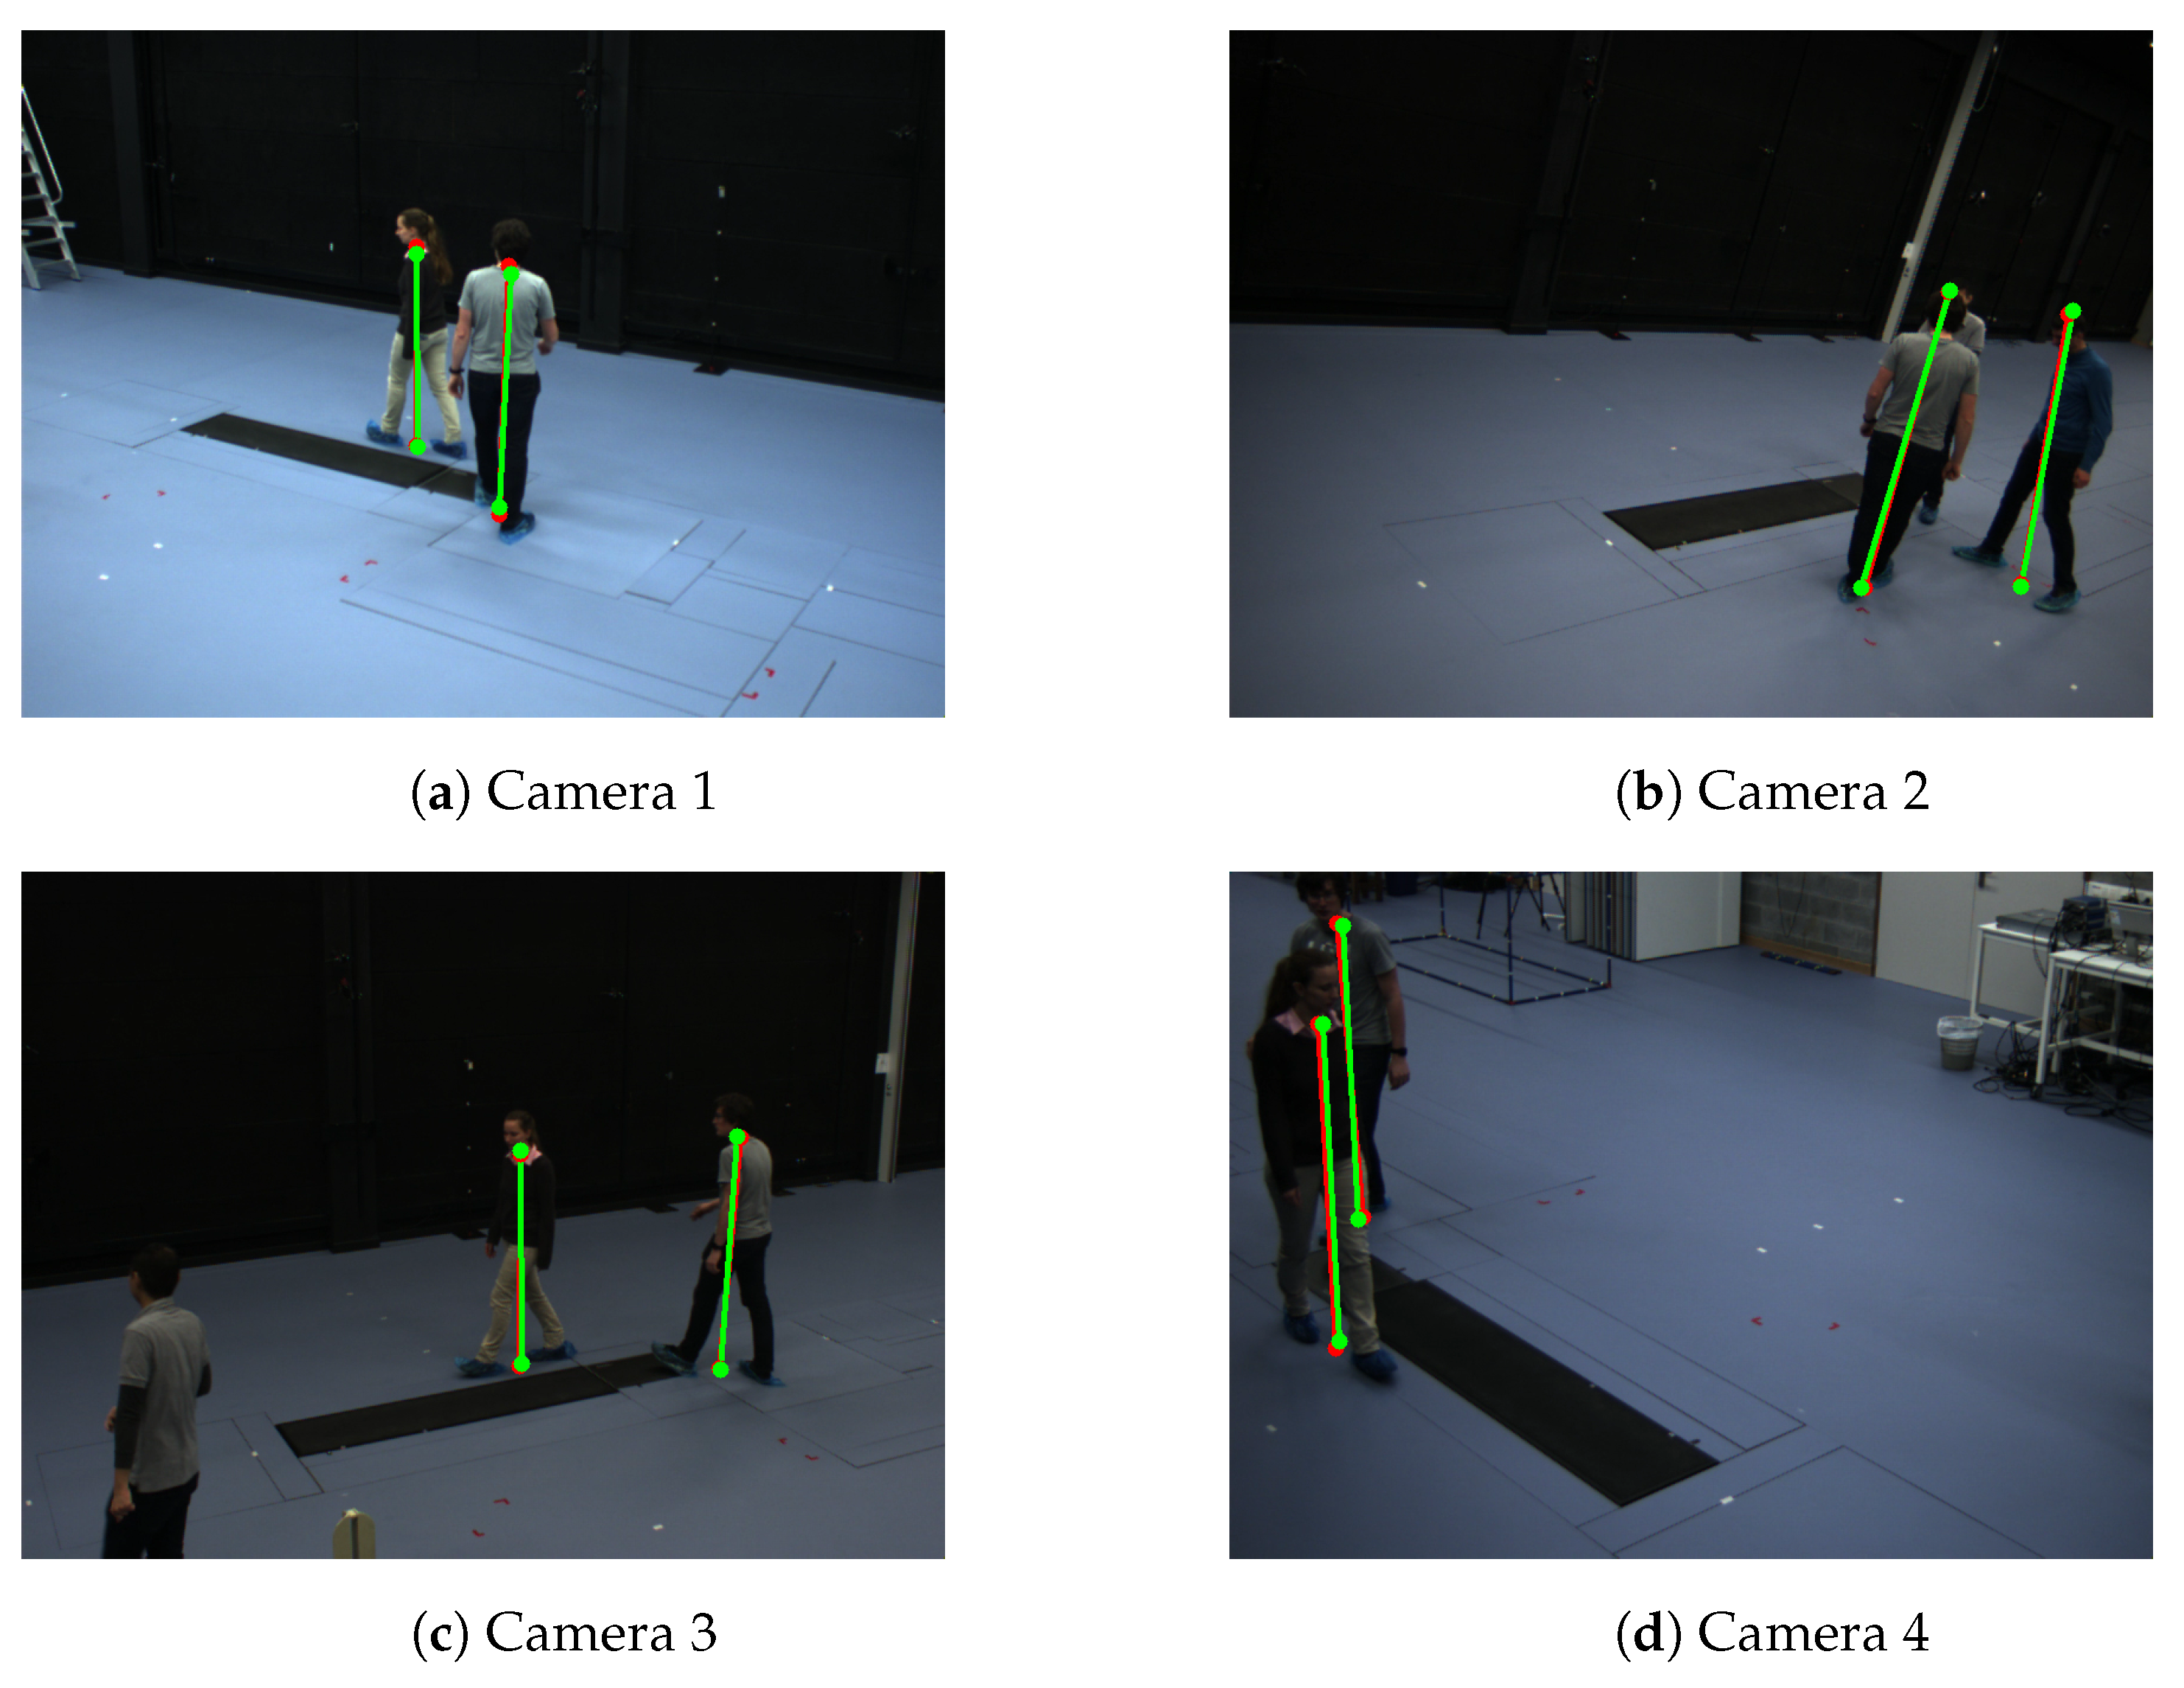
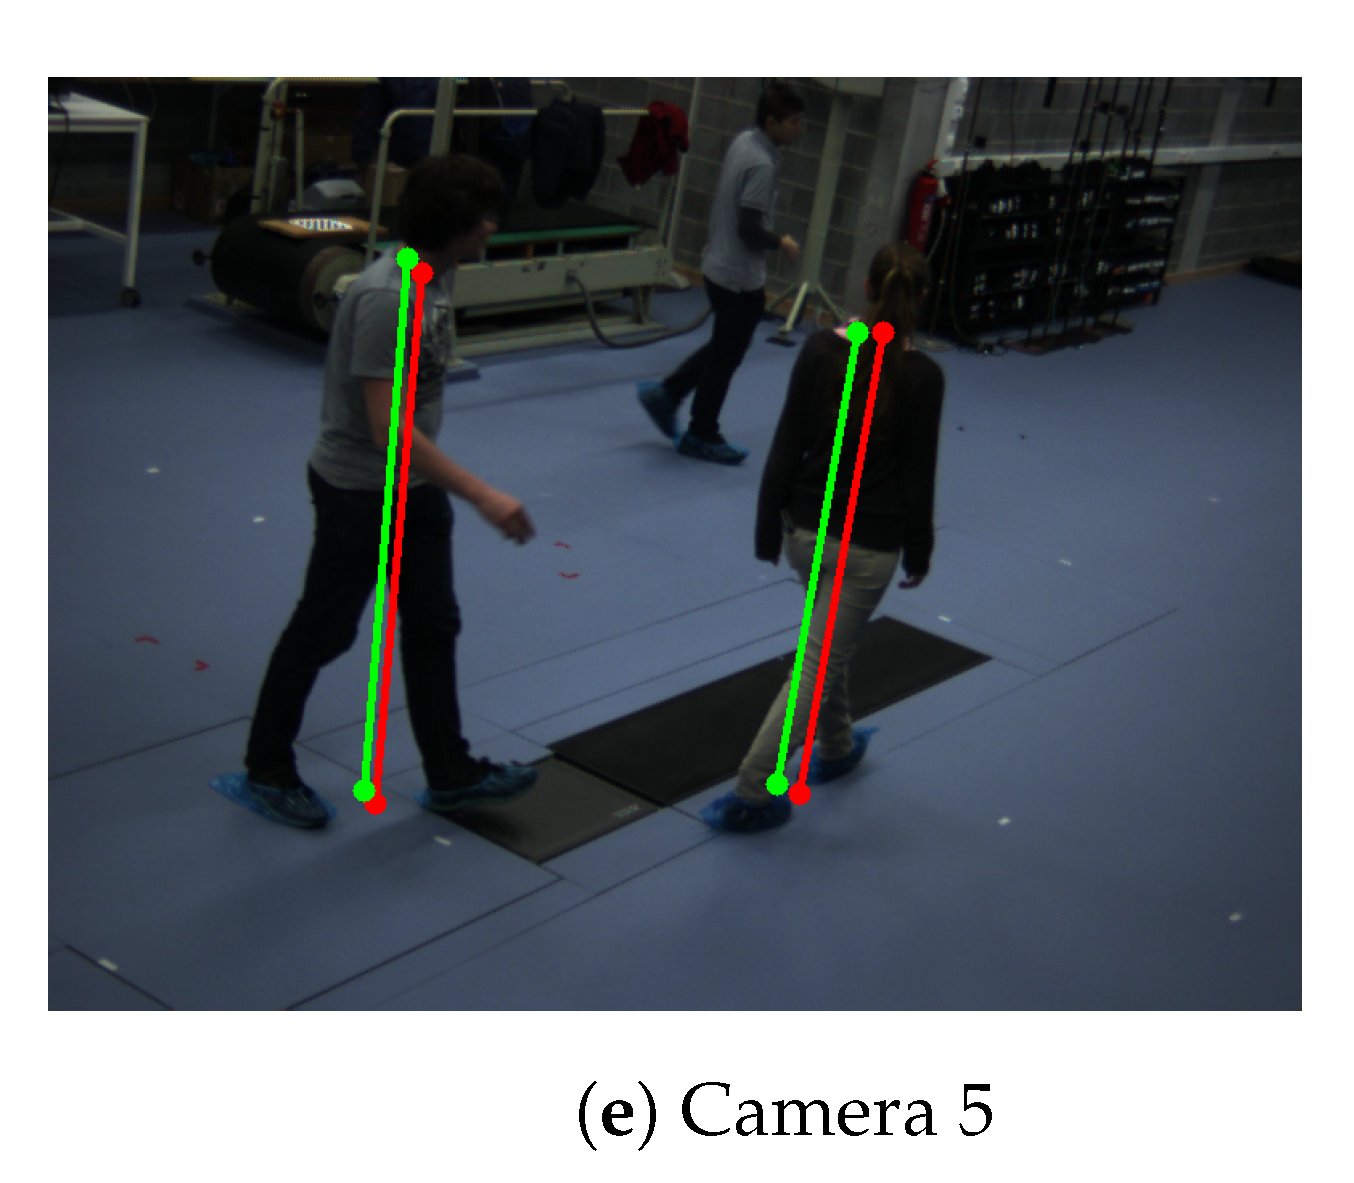
Figure 6.
Example of detected the bottom and top positions of the pedestrians of Camera Network 1—multiple people walking in an empty room. Red color represents detected positions by the human pose estimation method. Green color represents the detected reprojected positions.
Figure 6.
Example of detected the bottom and top positions of the pedestrians of Camera Network 1—multiple people walking in an empty room. Red color represents detected positions by the human pose estimation method. Green color represents the detected reprojected positions.
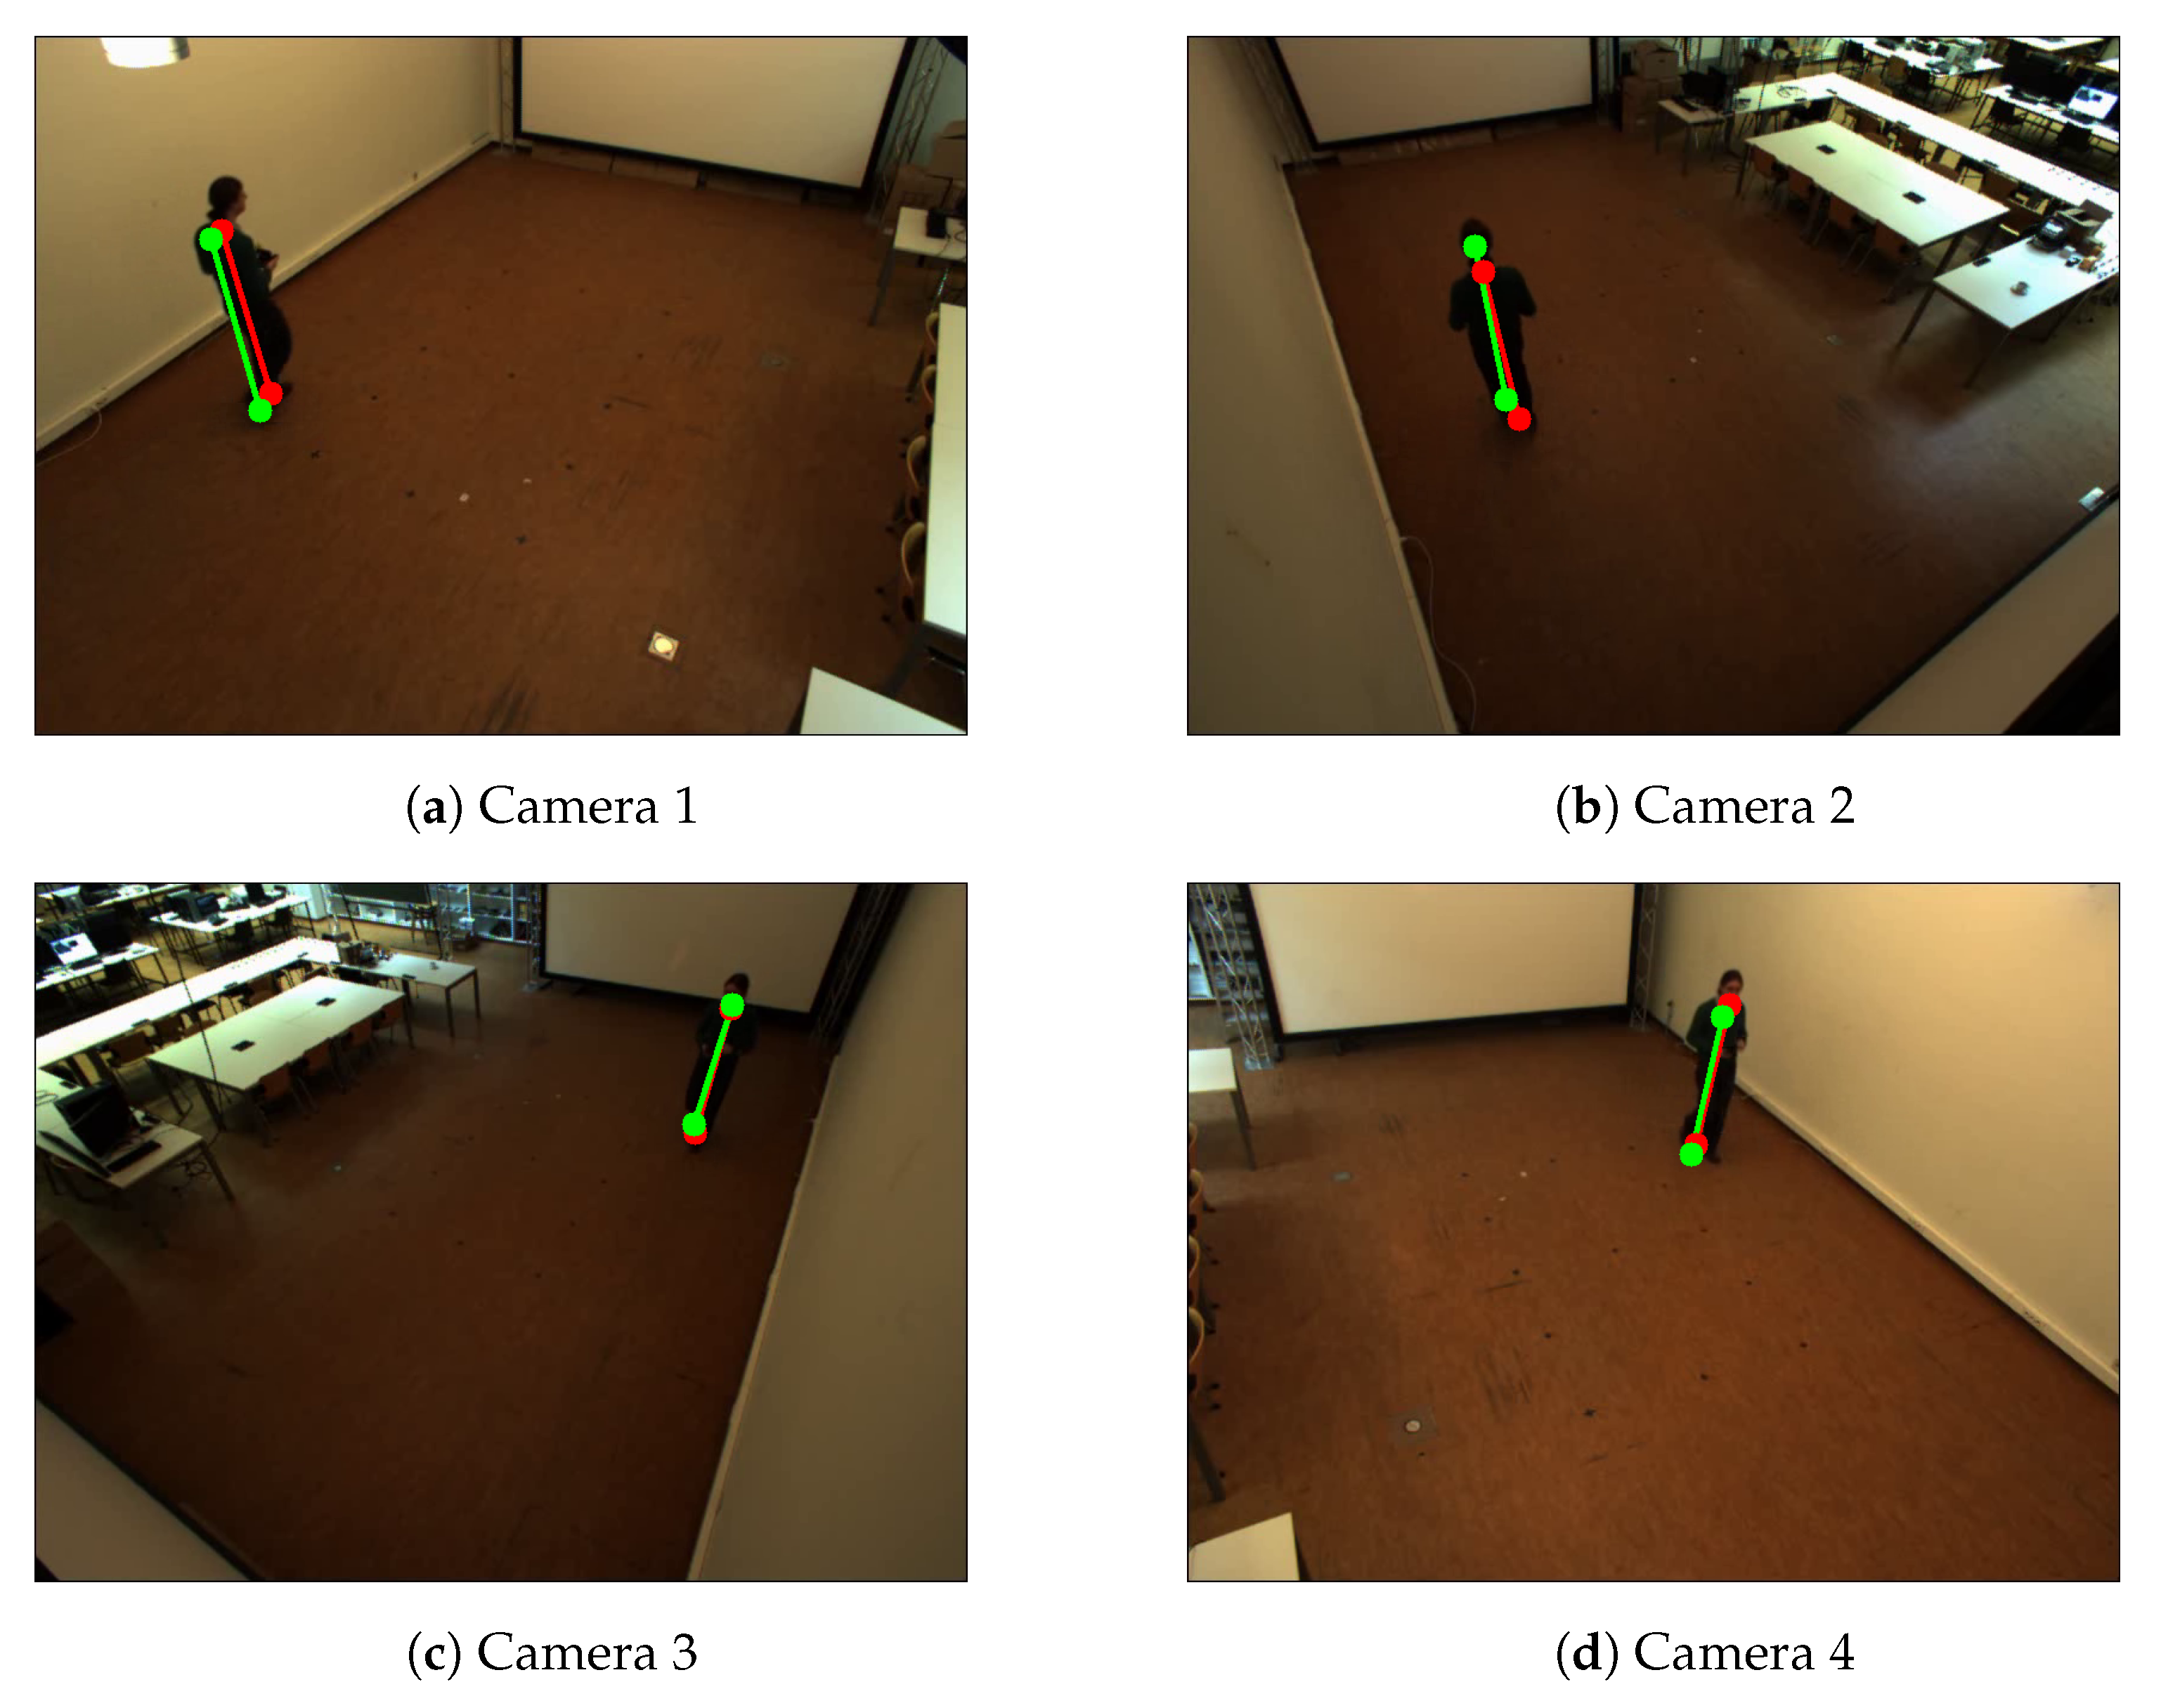
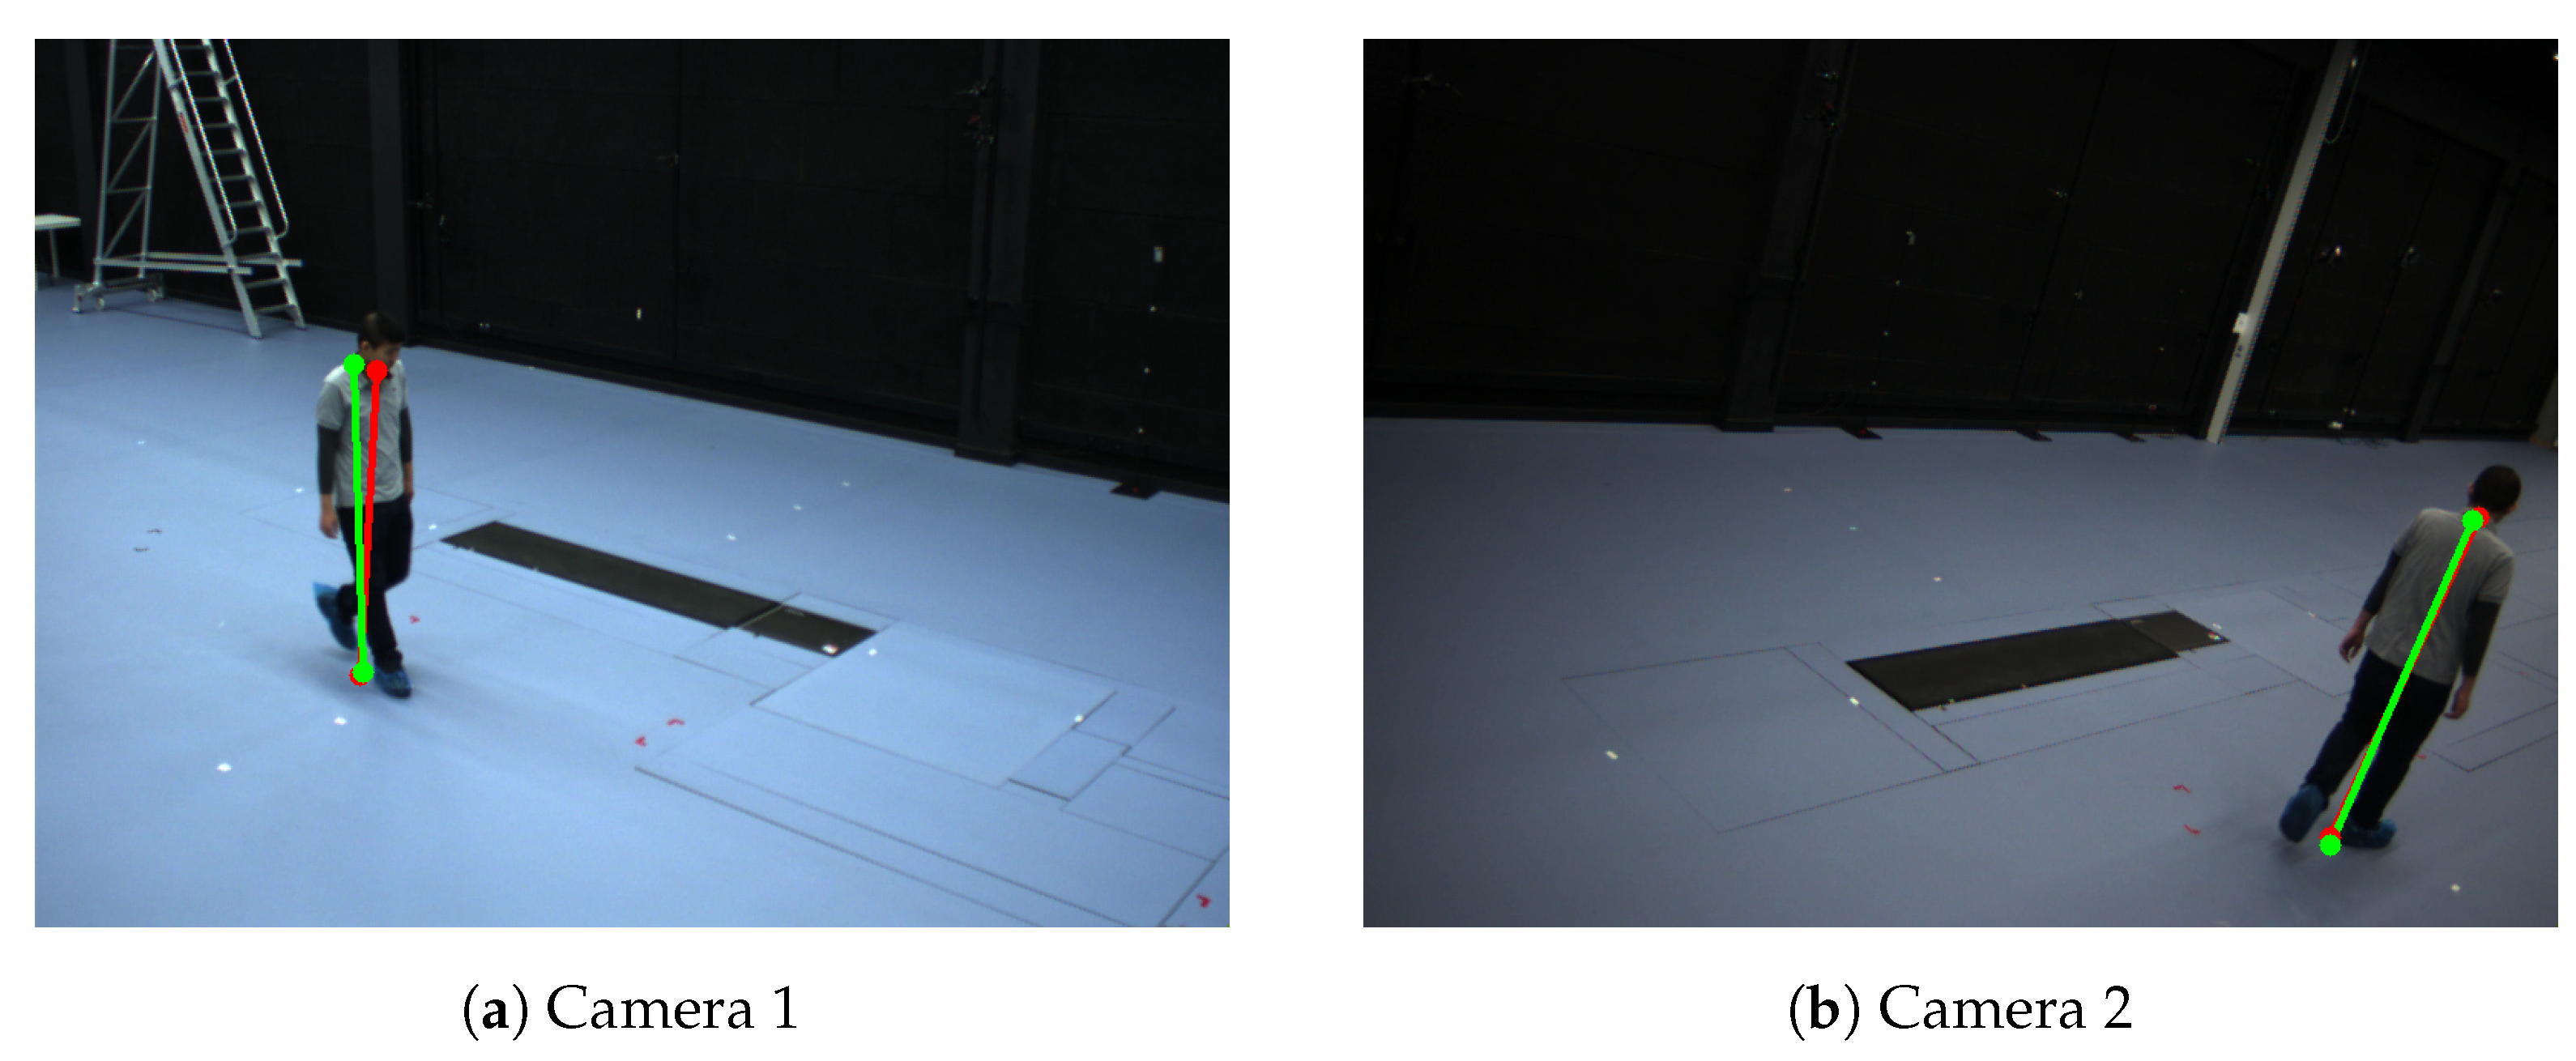
Figure 7.
Example of detected the bottom and top positions of the pedestrians of Camera Network 4—single person in an empty room. Red color represents detected positions by the human pose estimation method. Green color represents the detected reprojected positions.
Figure 7.
Example of detected the bottom and top positions of the pedestrians of Camera Network 4—single person in an empty room. Red color represents detected positions by the human pose estimation method. Green color represents the detected reprojected positions.
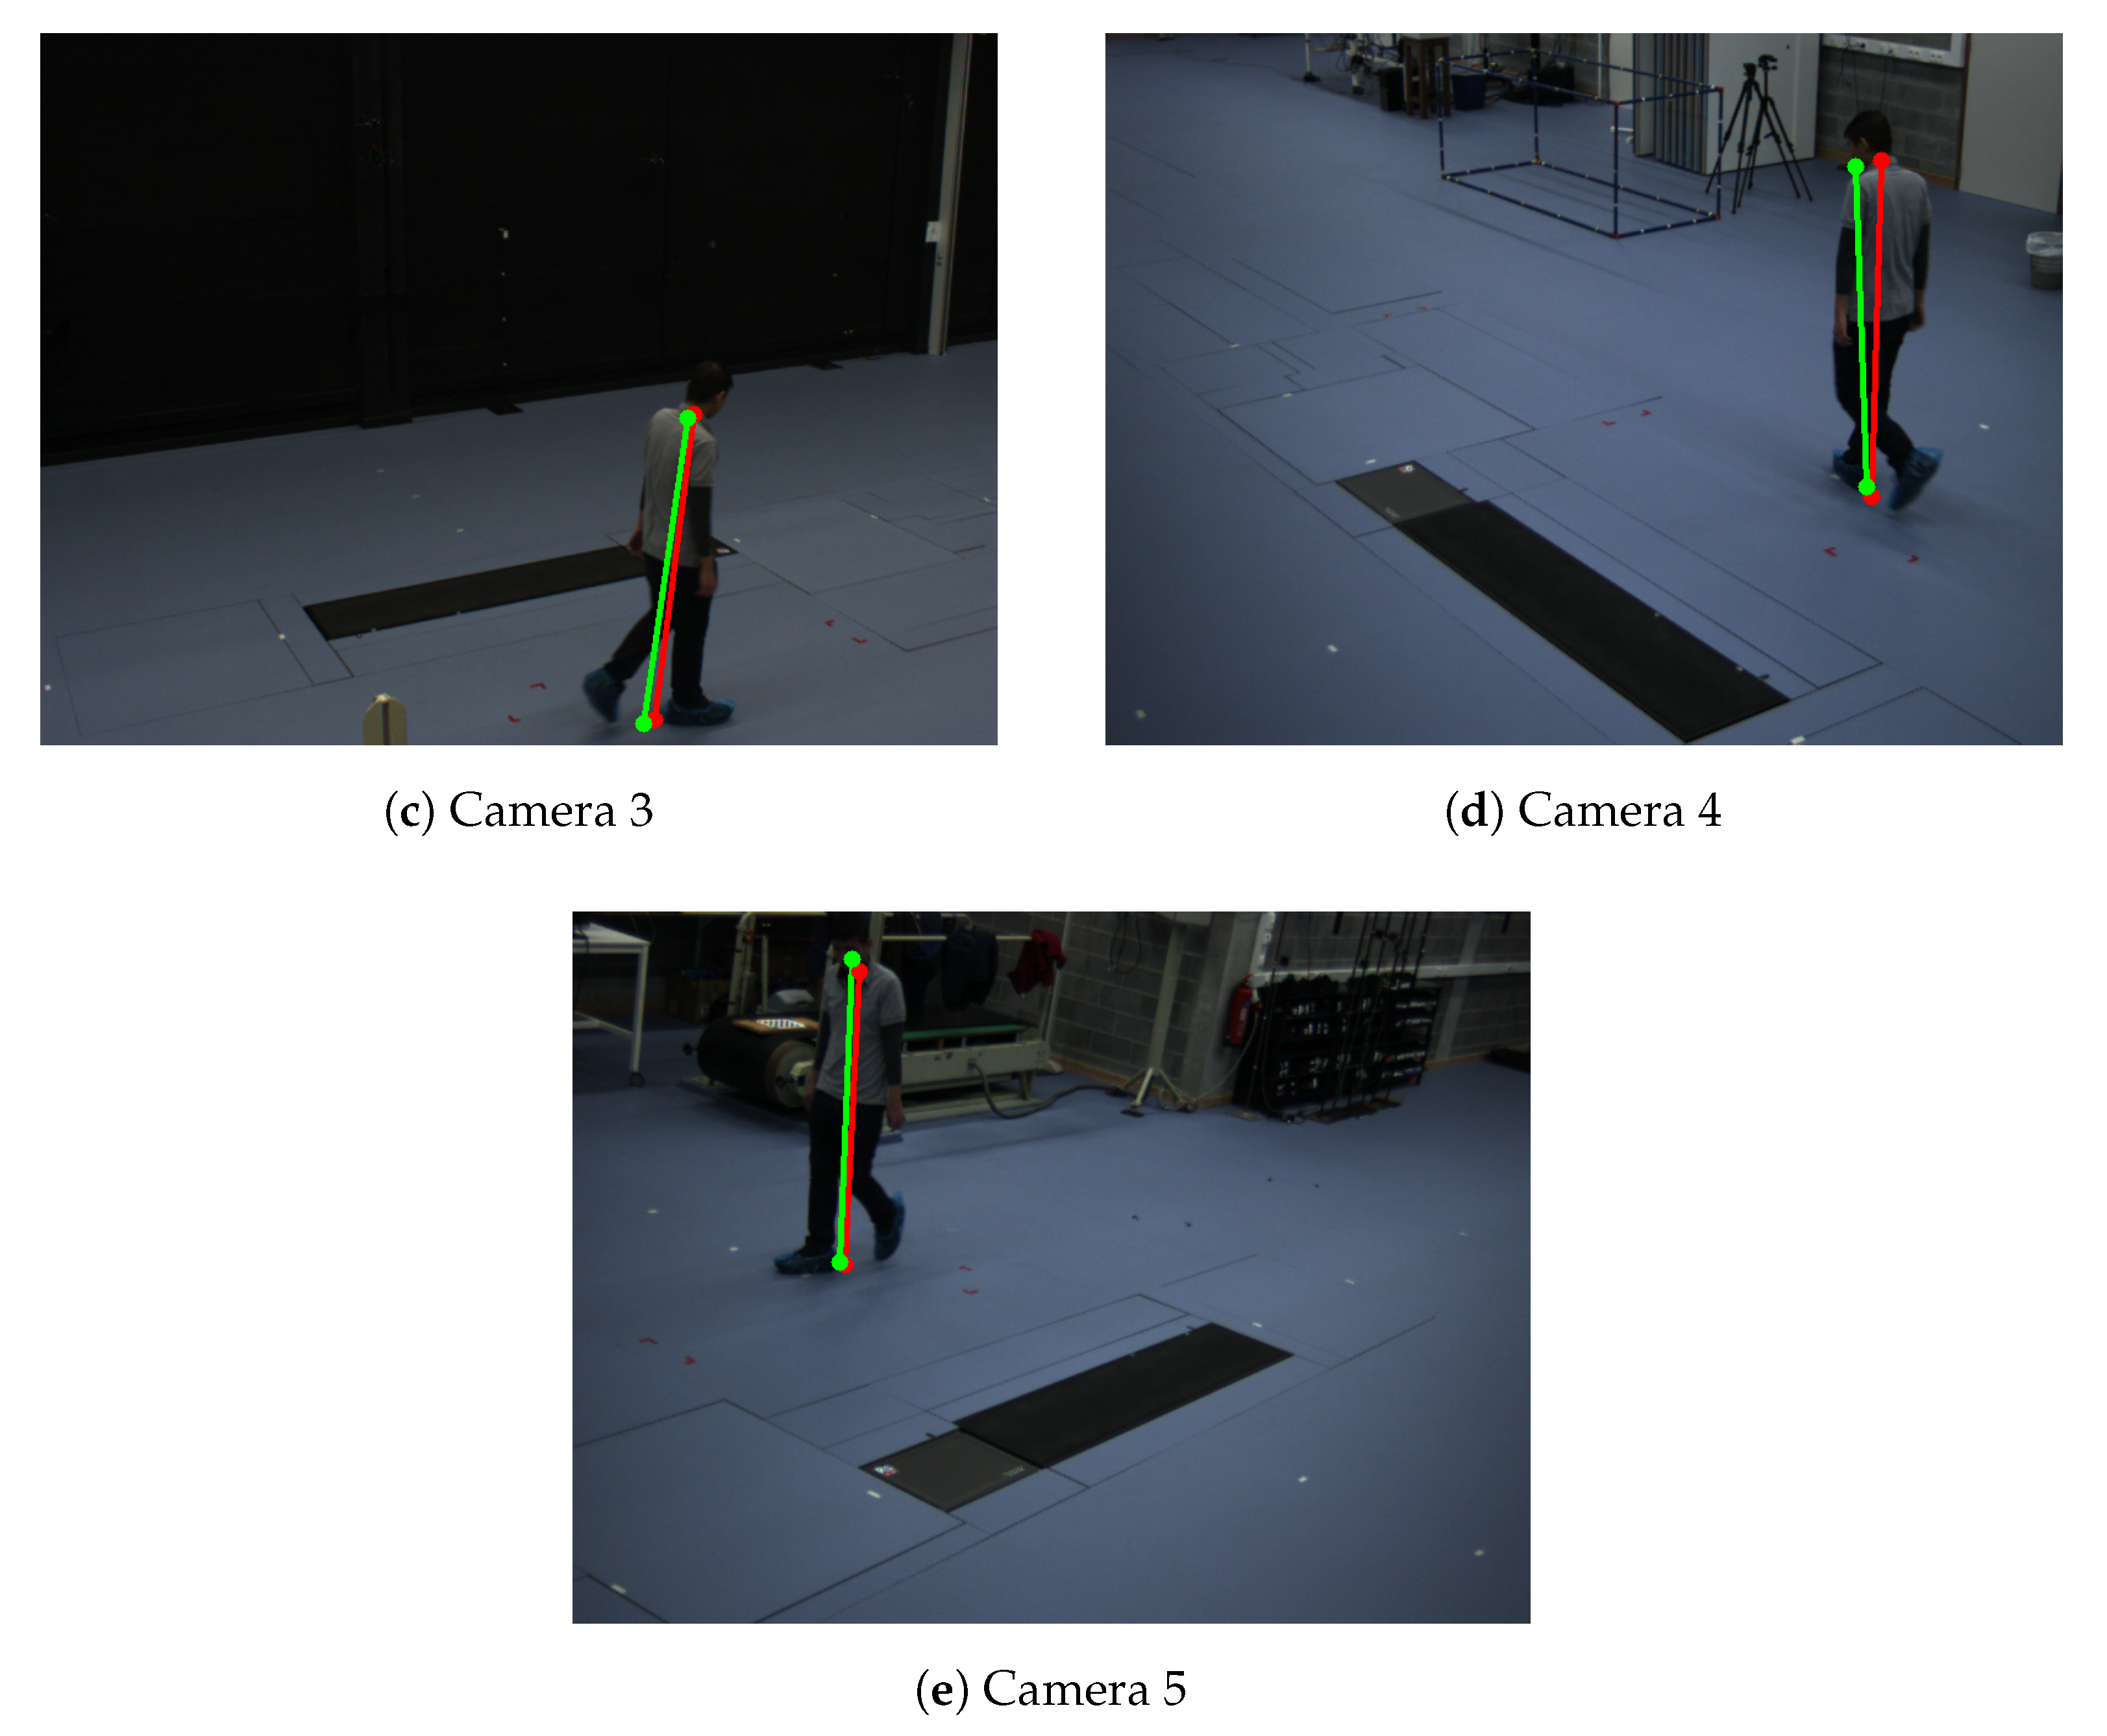
Figure 8.
Example of detected the bottom and top positions of the pedestrians of Camera Network 4—single person in an empty room. Red color represents detected positions by the human pose estimation method. Green color represents the detected reprojected positions.
Figure 8.
Example of detected the bottom and top positions of the pedestrians of Camera Network 4—single person in an empty room. Red color represents detected positions by the human pose estimation method. Green color represents the detected reprojected positions.
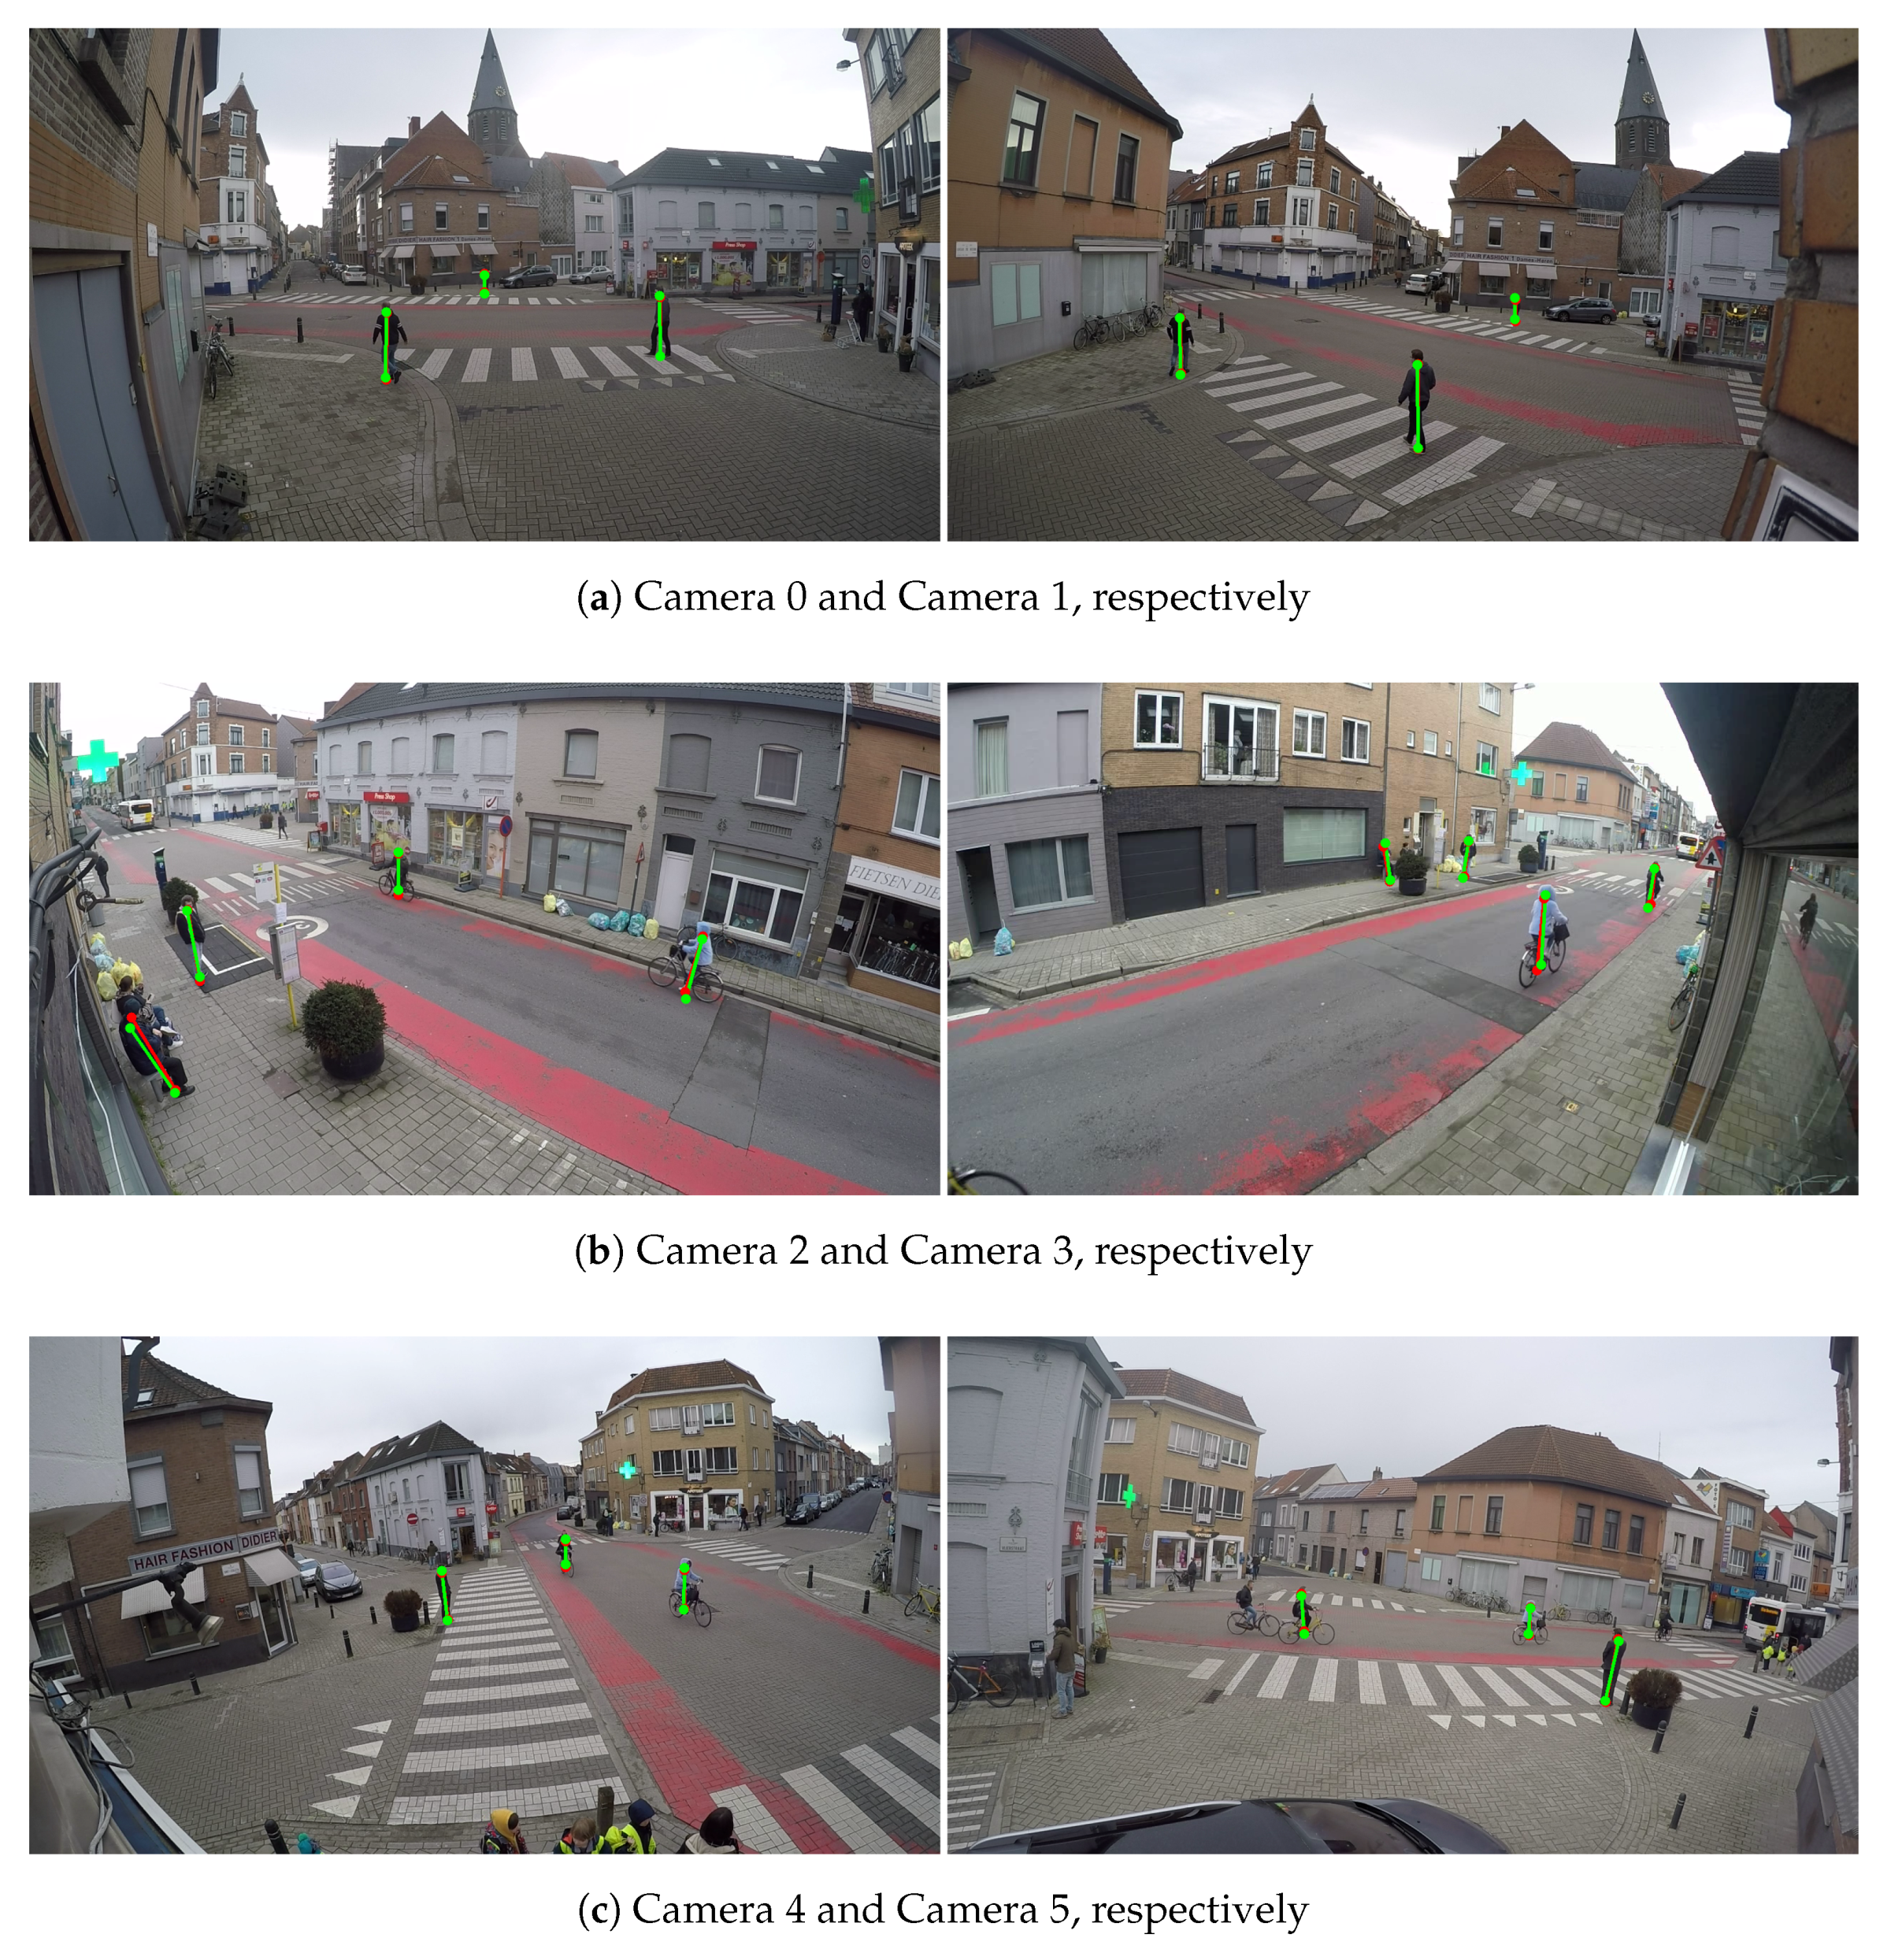
Figure 9.
Example of detected the bottom and top positions of the pedestrians of Camera network 5—multiple pedestrians at an intersection. Red color represents detected positions by the human pose estimation method. Green color represents the detected reprojected positions.
Figure 9.
Example of detected the bottom and top positions of the pedestrians of Camera network 5—multiple pedestrians at an intersection. Red color represents detected positions by the human pose estimation method. Green color represents the detected reprojected positions.
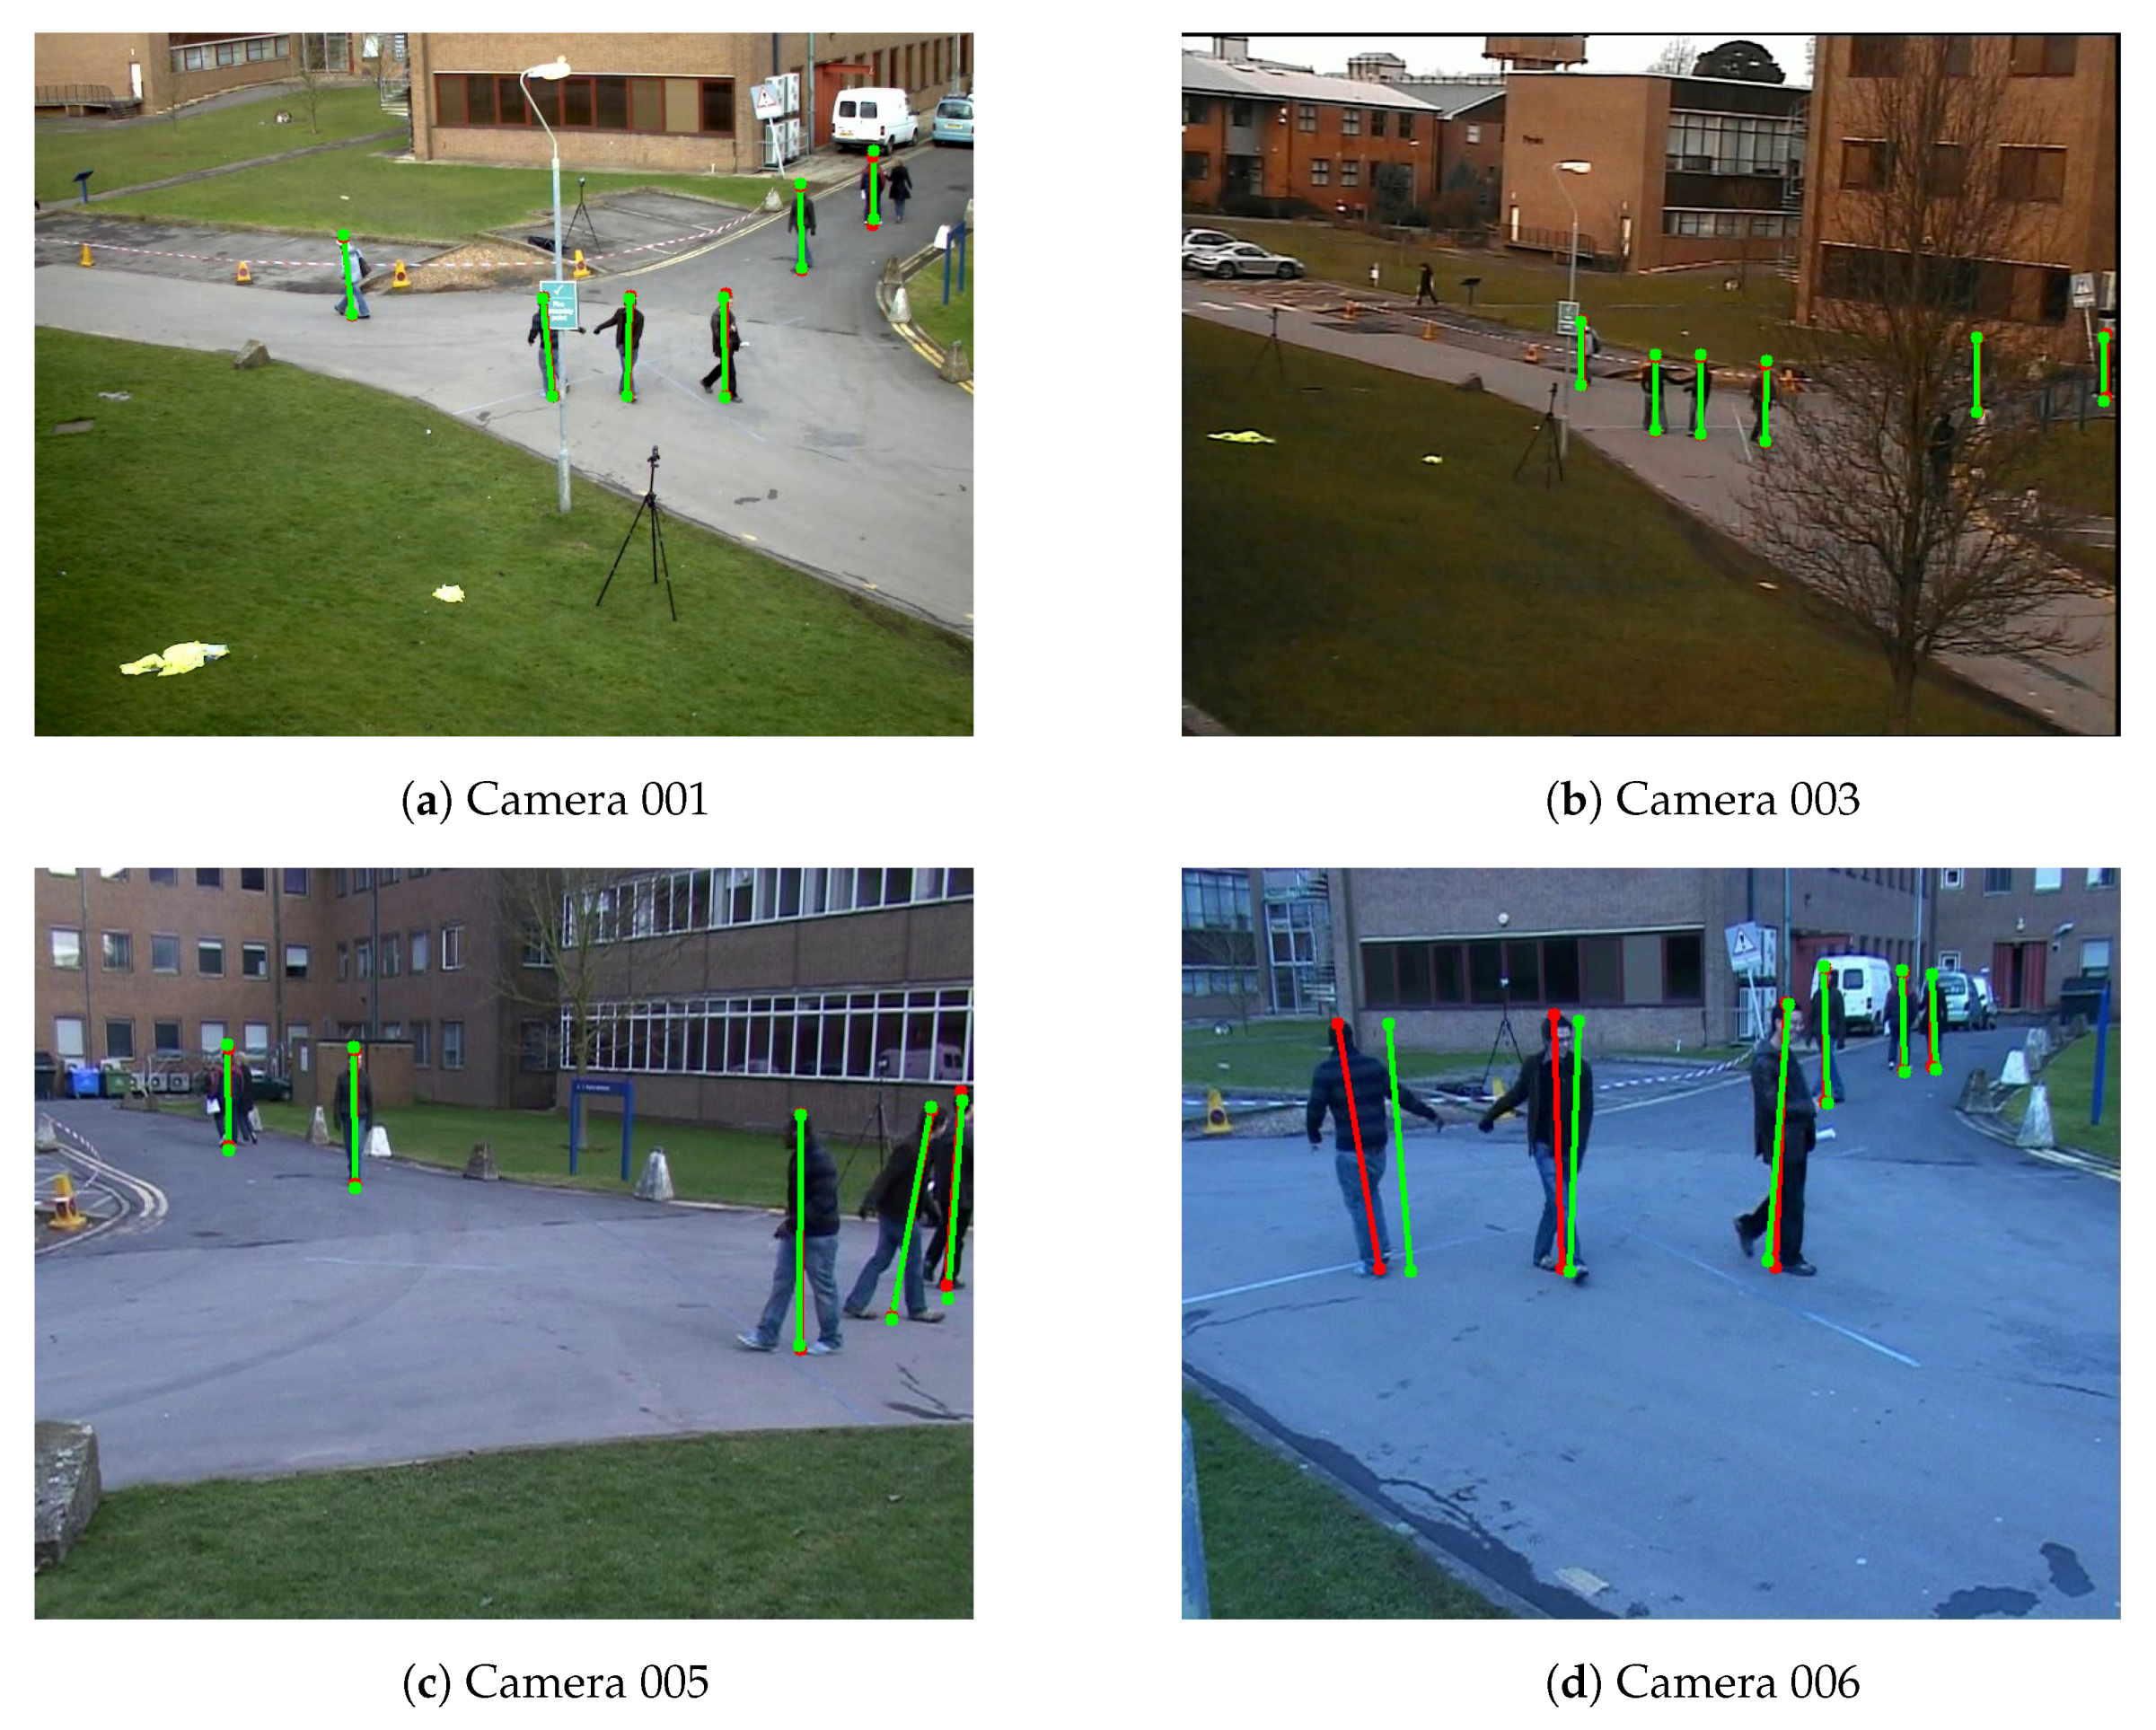
Figure 10.
Example of detected the bottom and top positions of the pedestrians of Camera Network 6—PETS2009-S2L1 dataset. Red color represents detected positions by the human pose estimation method. Green color represents the detected reprojected positions.
Figure 10.
Example of detected the bottom and top positions of the pedestrians of Camera Network 6—PETS2009-S2L1 dataset. Red color represents detected positions by the human pose estimation method. Green color represents the detected reprojected positions.
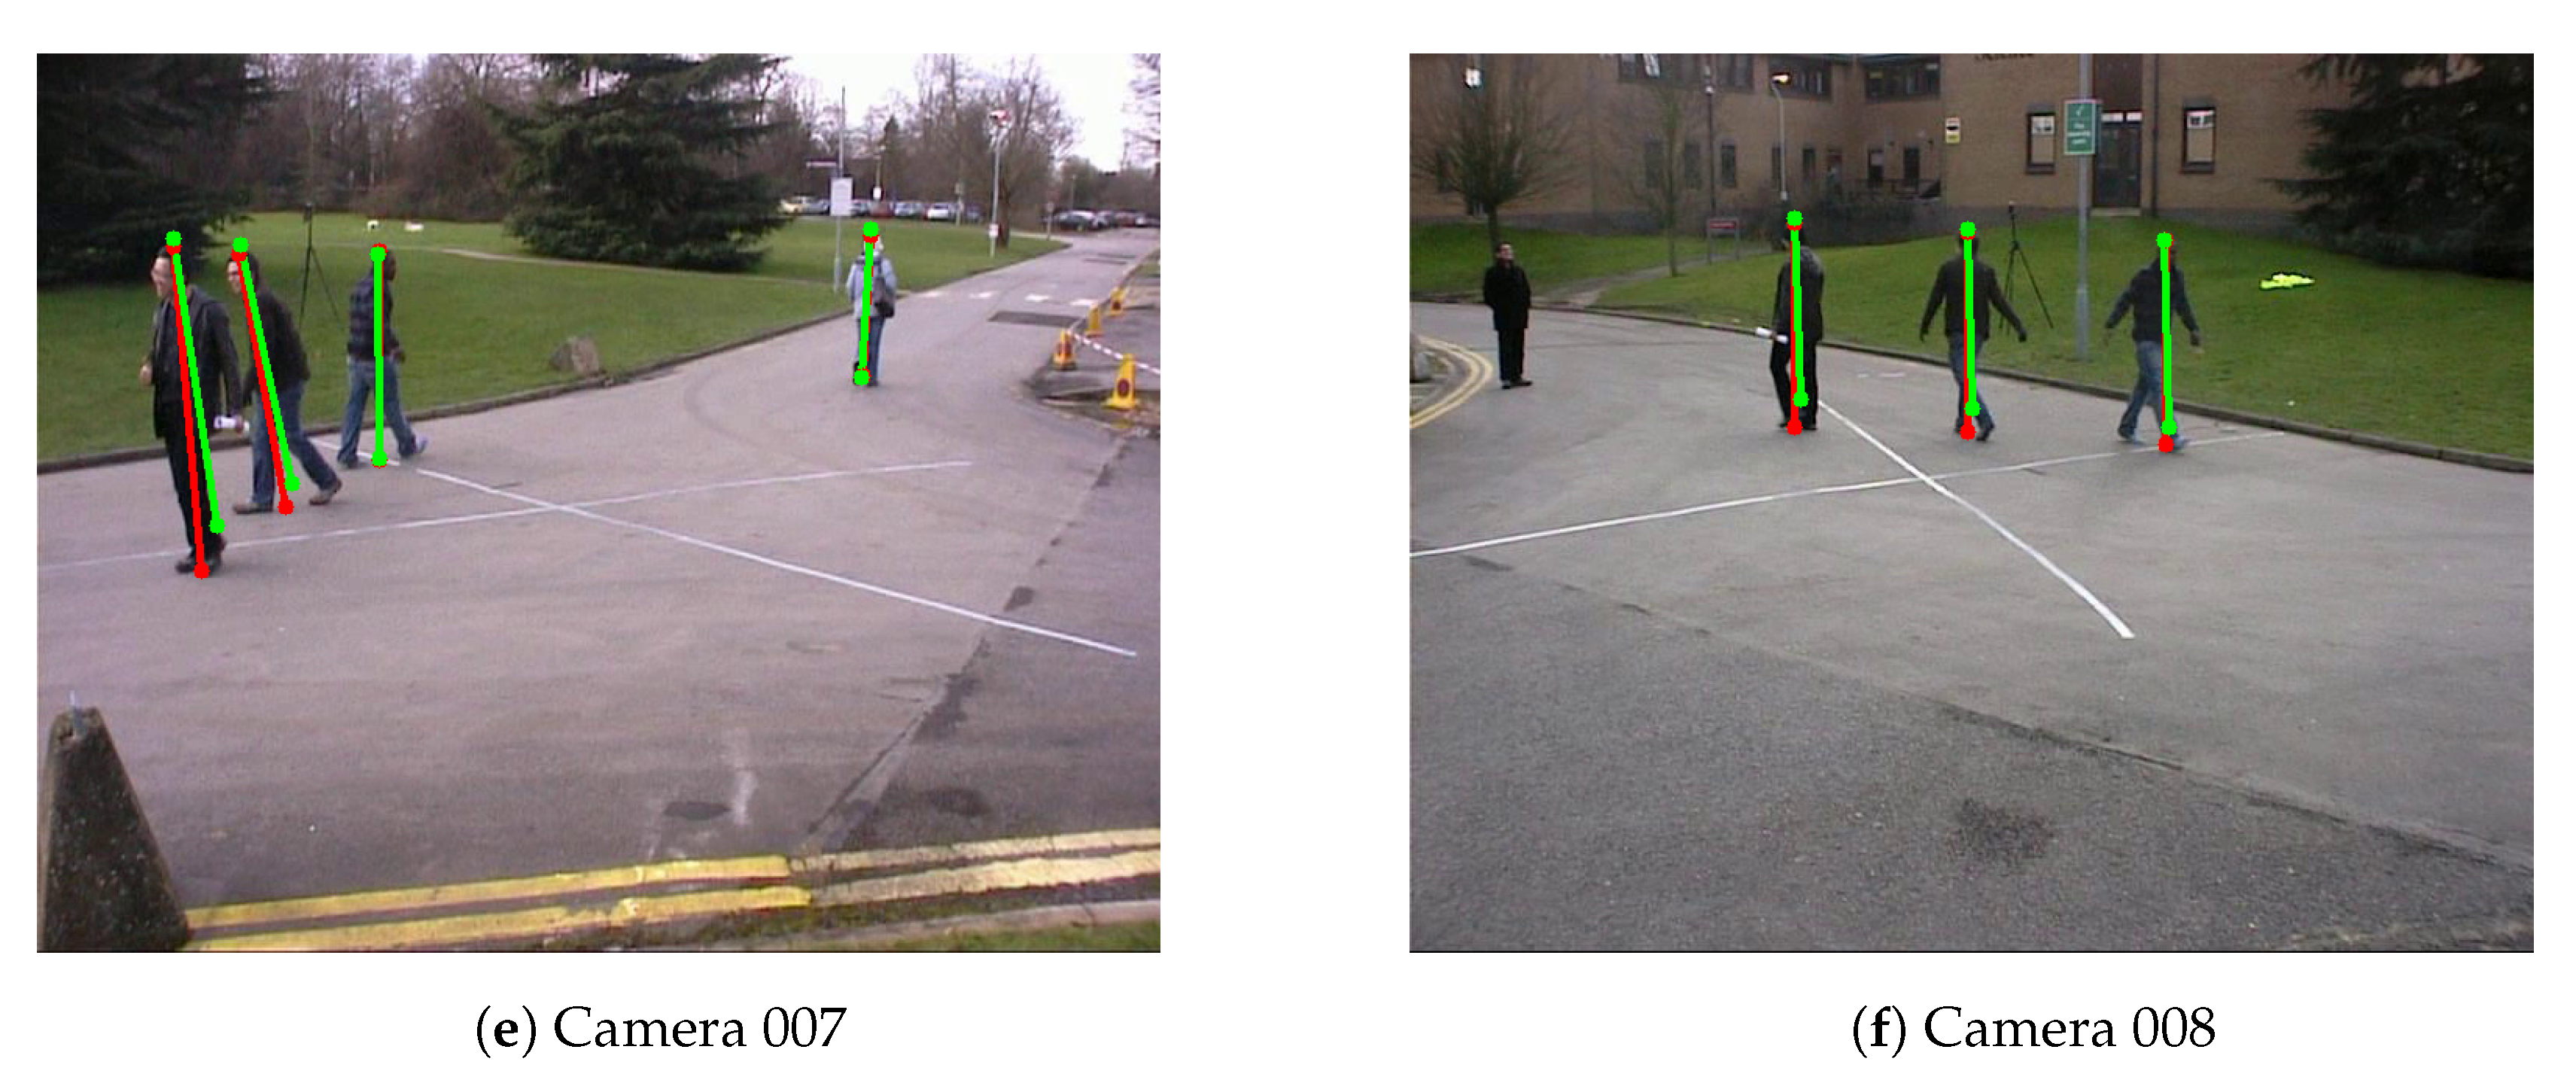
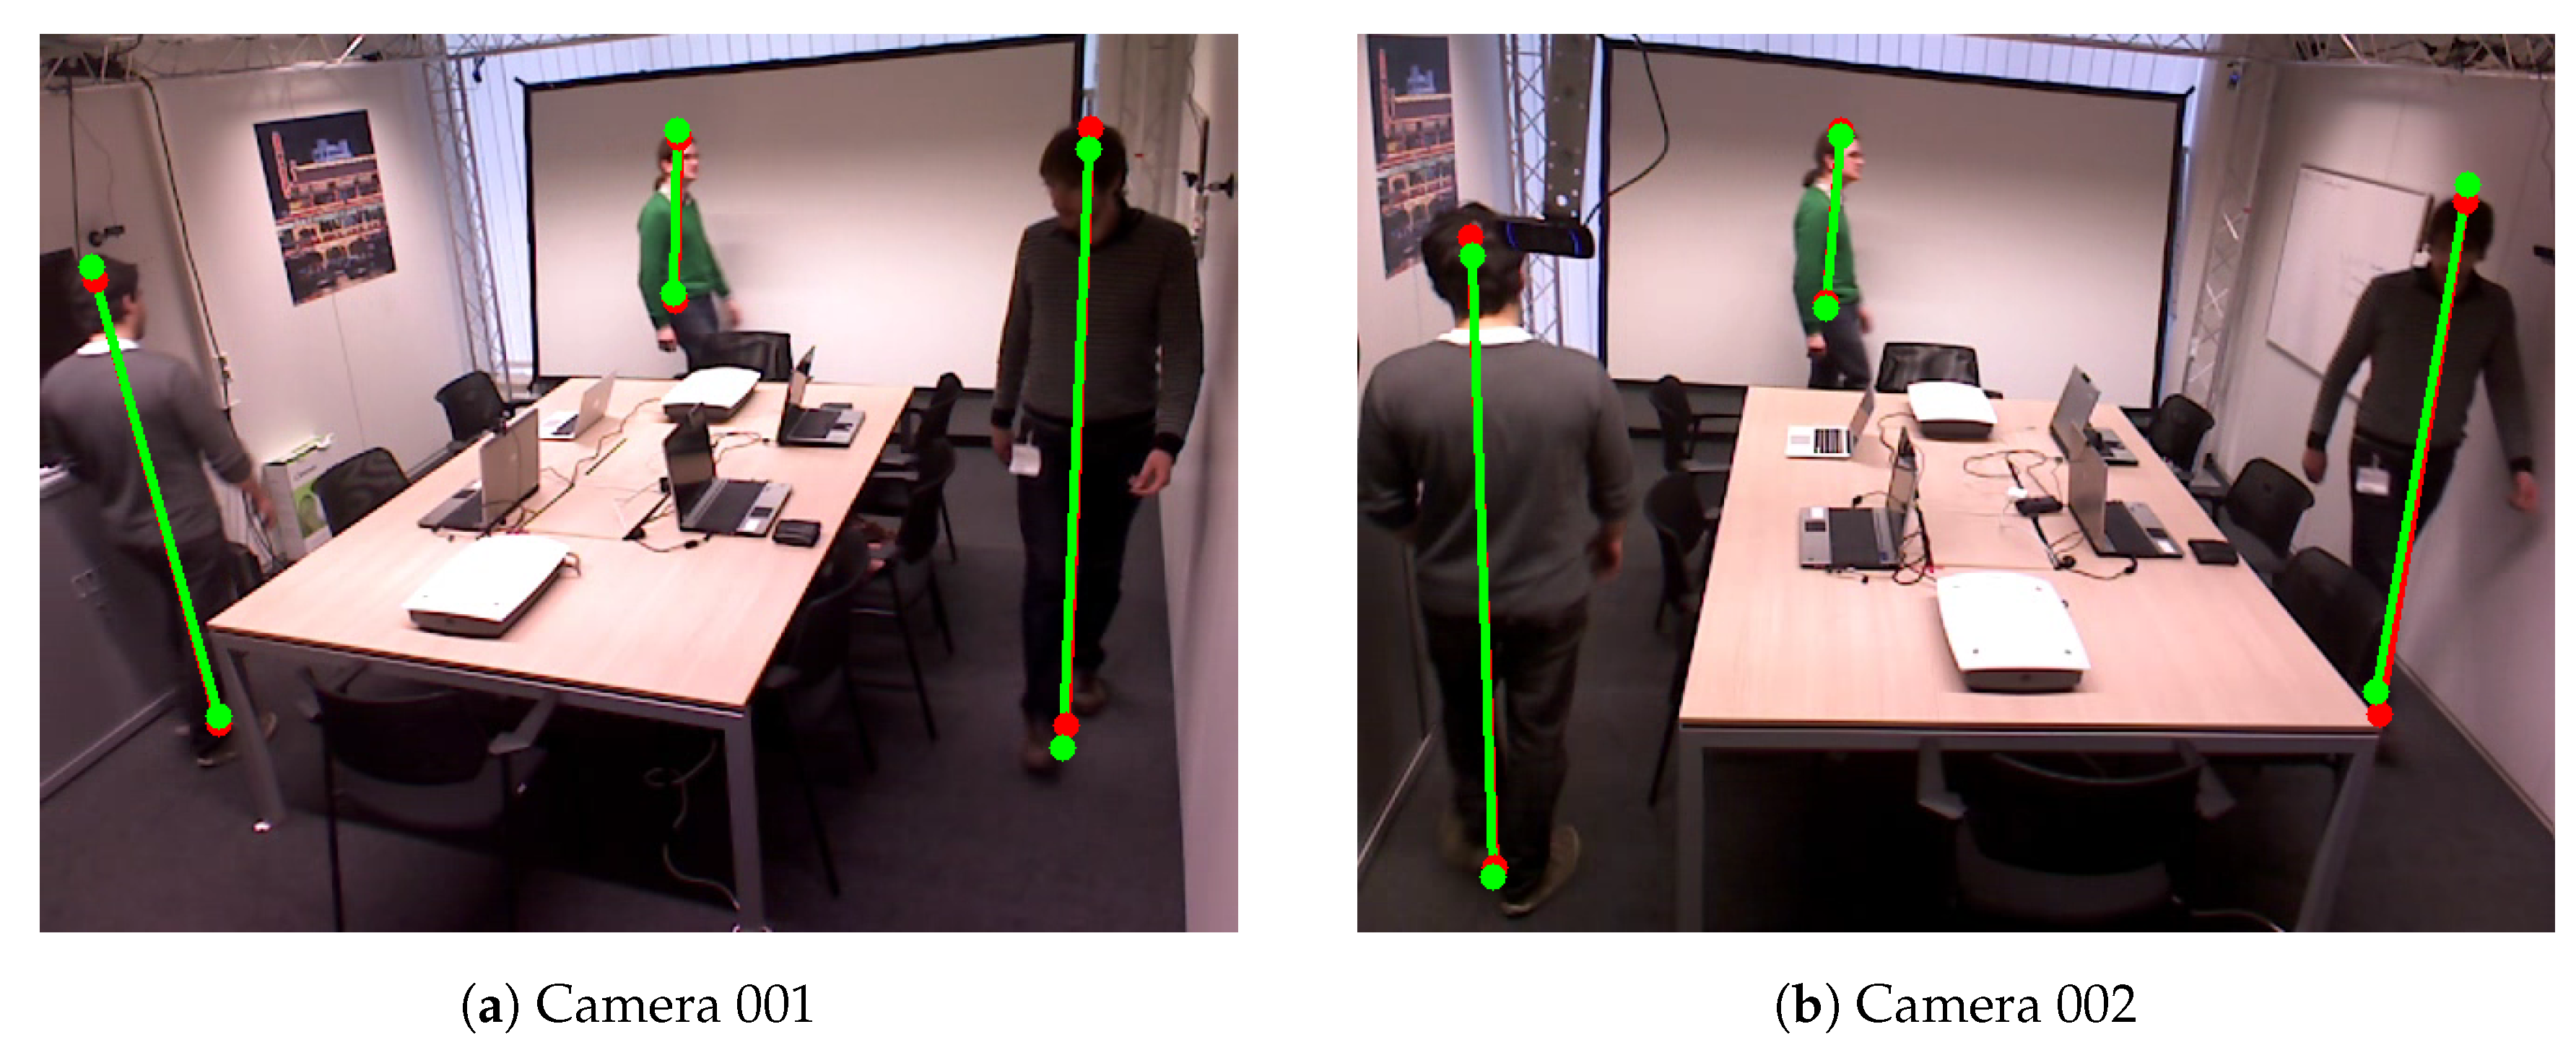
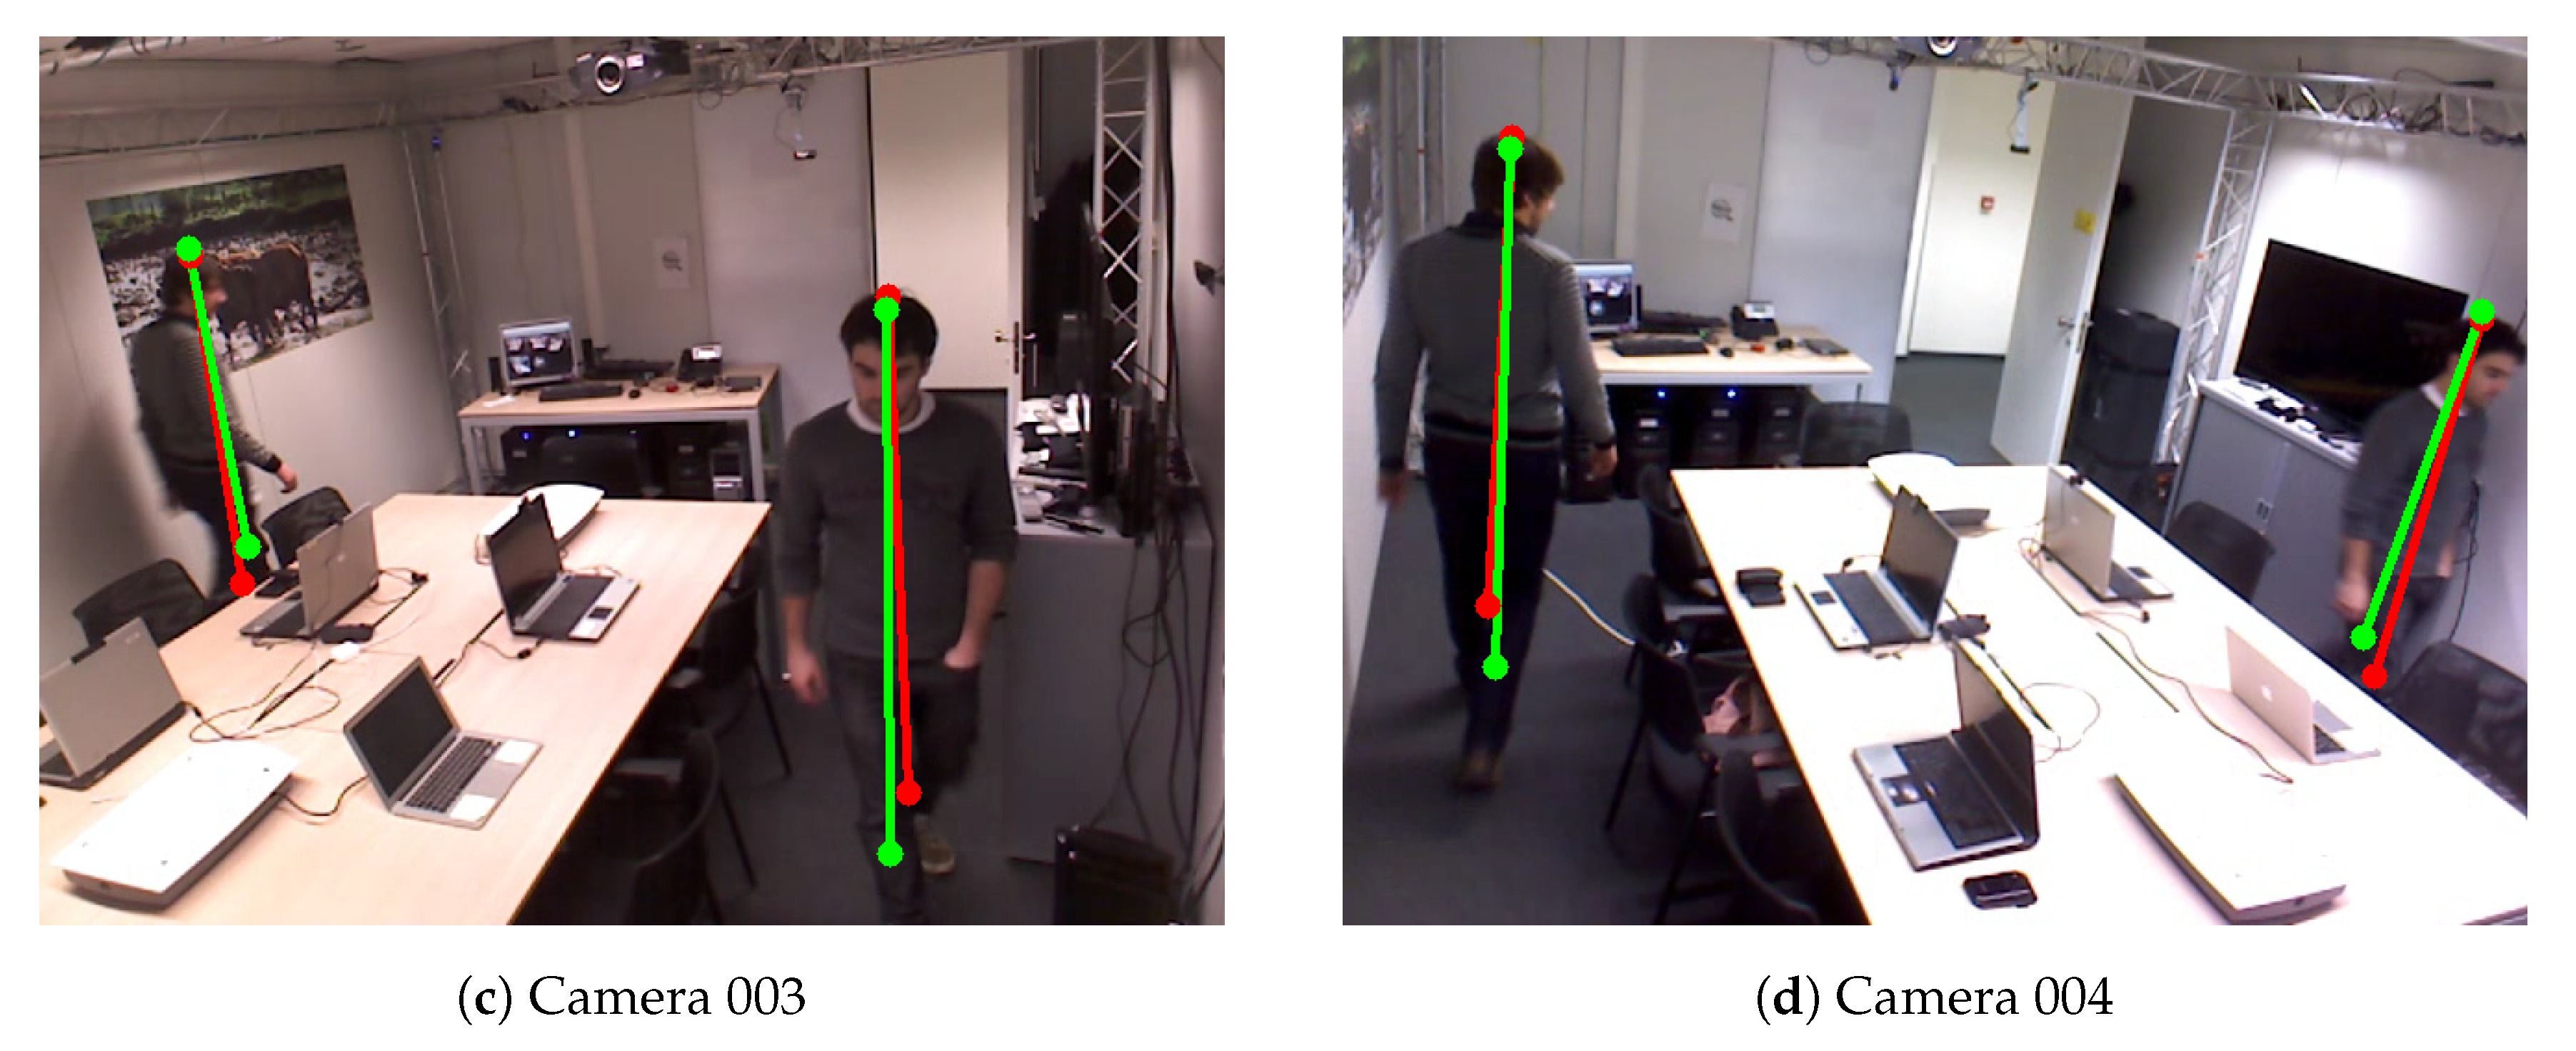
Figure 11.
Example of detected the bottom and top positions of the pedestrians of Camera Network 7. Red color represents detected positions by the human pose estimation method. Green color represents the detected reprojected positions.
Figure 11.
Example of detected the bottom and top positions of the pedestrians of Camera Network 7. Red color represents detected positions by the human pose estimation method. Green color represents the detected reprojected positions.
Table 1.
The calibration results on Camera Network 1 (CN1) within 1000 experiments of the proposed method. , , , and denotes the triangulation error, projection error, reprojection error, and relative reprojection error, respectively.
Table 1.
The calibration results on Camera Network 1 (CN1) within 1000 experiments of the proposed method. , , , and denotes the triangulation error, projection error, reprojection error, and relative reprojection error, respectively.
| Collecting Data Time (s) | 10 | 20 | 30 | 40 | 50 |
|---|
| Using all Locations |
| (cm) | 5.203 | 2.443 | 1.655 | 1.540 | 1.533 |
| (pixel) | 15.005 | 9.006 | 4.863 | 4.648 | 4.627 |
| (pixel) | 52.804 | 7.544 | 4.581 | 4.341 | 4.316 |
| Random Samples |
| (cm) | 2.465 | 1.742 | 1.582 | 1.585 | 1.544 |
| (pixel) | 5.952 | 4.839 | 4.670 | 4.613 | 4.595 |
| (pixel) | 5.435 | 4.496 | 4.355 | 4.300 | 4.280 |
Table 2.
Comparison between our method, the method of Guan et al. [
14], and the method of Hödlmoser et al. [
24] on Camera Network 1 (CN1), Camera Network 2 (CN2). We randomly select
locations of the pedestrians in the scene to calibrate the CN1, and CN2.
,
,
, and
denotes the triangulation error, projection error, reprojection error, and relative reprojection error, respectively. The bold numbers are the best results among the mentioned methods.
| | Proposed Method (Feet) | Proposed Method (Hip) | Guan et al. [14] | Hödlmoser et al. [24] |
|---|
| | CN1 | CN2 | CN1 | CN2 | CN1 | CN2 | CN1 | CN2 |
| (cm) | 1.33 | 2.2 | 1.45 | 2.2 | 1.30 | | 1.30 | |
| (pixel) | 3.98 | 5.8 | 4.60 | 5.8 | | | | |
| (pixel) | 3.76 | 5.0 | 4.33 | 5.0 | | | | |
| —top (%) | 1.8 | 1.7 | 1.8 | 1.7 | 1.9 | 7.0 | 1.9 | 43 |
| —bottom (%) | 2.8 | 2.0 | 2.8 | 2.0 | 3.0 | 4.1 | 3.0 | 39 |
Table 3.
Success percentages (the triangulation error is below 15 cm) within 1000 experiments of the proposed method for the Camera Network 1.
Table 3.
Success percentages (the triangulation error is below 15 cm) within 1000 experiments of the proposed method for the Camera Network 1.
| Accumulated Moving Distance (cm) | 650 | 1000 | 2000 | 2500 | 4000 |
| Successful Percentage | 0.35 | 0.83 | 0.97 | 0.99 | 1.0 |
Table 4.
The calibration results on Camera Network 2 (CN2) within 1000 experiments of the proposed method. The table shows the results of our method on video sequence where the subject was cleaning the room. , , , and denotes the triangulation error, projection error, reprojection error, and relative reprojection error, respectively.
| Collecting Data Time (s) | 10 | 20 | 30 | 40 | 50 |
|---|
| Using all Locations |
| (cm) | 17.979 | 14.245 | 11.940 | 10.448 | 11.198 |
| (pixel) | 214.329 | 182.073 | 364.136 | 115.872 | 165.385 |
| (pixel) | 196.218 | 129.085 | 289.050 | 104.330 | 90.784 |
| Random Samples |
| (cm) | 5.320 | 4.511 | 3.041 | 3.243 | 2.912 |
| (pixel) | 35.694 | 27.482 | 13.196 | 13.649 | 12.623 |
| (pixel) | 37.039 | 36.265 | 12.655 | 12.592 | 12.099 |
Table 5.
The calibration results on Camera Network 2 (CN2) within 1000 experiments of the proposed method. The table shows the results of our method on video sequence where the subject was walking in the room. , , , and denotes the triangulation error, projection error, reprojection error, and relative reprojection error, respectively.
| Collecting Data Time (s) | 10 | 20 | 30 | 40 | 50 |
|---|
| Using All Locations |
| (cm) | 4.499 | 3.602 | 2.689 | 2.504 | 2.456 |
| (pixel) | 37.253 | 22.162 | 15.705 | 10.922 | 9.818 |
| (pixel) | 39.925 | 21.332 | 13.780 | 10.096 | 8.927 |
| Random Samples |
| (cm) | 2.618 | 2.224 | 2.144 | 2.169 | 2.161 |
| (pixel) | 14.634 | 11.331 | 9.198 | 7.933 | 7.156 |
| (pixel) | 15.643 | 11.242 | 8.783 | 7.412 | 6.567 |
Table 6.
Success percentages (the triangulation error is below 15 cm) within 1000 experiments of the proposed method which is conducted with the Camera Network 1 (CN1), and Camera Network 2 (CN2).
Table 6.
Success percentages (the triangulation error is below 15 cm) within 1000 experiments of the proposed method which is conducted with the Camera Network 1 (CN1), and Camera Network 2 (CN2).
| Collecting Data Time (s) | 10 | 20 | 30 | 40 | 50 |
|---|
| All locations |
| CN1—Successful Percentage | 0.896 | 0.972 | 0.995 | 1.0 | 1.0 |
| CN2 (cleaning the Floor)—Successful Percentage | 0.339 | 0.489 | 0.539 | 0.62 | 0.607 |
| CN2 (walking)—Successful Percentage | 0.836 | 0.929 | 0.980 | 1.0 | 1.0 |
| Random Samples |
| CN1—Successful Percentage | 0.975 | 0.998 | 1.0 | 1.0 | 1.0 |
| CN2 (Cleaning the Floor)—Successful Percentage | 0.590 | 0.736 | 0.786 | 0.807 | 0.868 |
| CN2 (Walking)—Successful Percentage | 0.910 | 0.978 | 0.999 | 1.0 | 1.0 |
Table 7.
The calibration results on EPFL-Terrace (CN3) and Camera Network 5 (CN5). For EPFL-Terrace (CN3) and Camera Network 5 (CN5), we apply the proposed method on the first half of the video to obtain the extrinsic parameters. , , are not available for these sequences. Thus, the denotes relative reprojection error is the only one available for these sequences.
| | Proposed Method | Proposed Method |
|---|
| | (Feet) | (Hip) |
|---|
| | CN3 | CN5 | CN3 | CN5 |
| —top (%) | 2.1 | 12.6 | 2.1 | 12.6 |
| —bottom (%) | 2.3 | 17.2 | 2.1 | 12.6 |
Table 8.
Calibration results of camera calibration based on single person of the Camera Network 4. , , , and denotes the triangulation error, projection error, reprojection error, and relative reprojection error, respectively.
Table 8.
Calibration results of camera calibration based on single person of the Camera Network 4. , , , and denotes the triangulation error, projection error, reprojection error, and relative reprojection error, respectively.
| | Proposed Method (Feet) | Proposed Method (Hip) |
|---|
| | S1 | S2 | S3 | S4 | S5 | S1 | S2 | S3 | S4 | S5 |
| (cm) | 5.14 | 3.88 | 5.22 | 4.92 | 8.52 | 5.60 | 6.71 | 6.99 | 7.66 | 8.09 |
| (pixel) | 6.04 | 5.52 | 6.31 | 6.21 | 10.67 | 6.35 | 8.39 | 8.92 | 9.84 | 10.86 |
| (pixel) | 2.21 | 3.40 | 2.09 | 2.27 | 4.74 | 2.10 | 3.71 | 3.96 | 3.53 | 5.55 |
| —top (%) | 2.3 | 2.2 | 2.4 | 2.7 | 3.1 | 2.8 | 2.2 | 2.6 | 2.7 | 2.7 |
| —bottom (%) | 1.7 | 2.8 | 1.9 | 2.3 | 2.5 | 2.2 | 2.5 | 2.1 | 3.1 | 3.3 |
Table 9.
Calibration results of camera calibration based on multiple walking people of the Camera Network 1 and the Camera Network 4. Note that, for Camera Network 1, we also apply the refinement method which proposed in [
14] to obtain the final extrinsic parameters.
,
,
, and
denotes the triangulation error, projection error, reprojection error, and relative reprojection error, respectively.
| | Proposed Method | Proposed Method |
|---|
| | (Feet) | (Hip) |
|---|
| | CN1 | S1 | S2 | S3 | S4 | S5 | CN1 | S1 | S2 | S3 | S4 | S5 |
| (cm) | 4.75 | 7.79 | 6.49 | 5.13 | 5.84 | 10.24 | 1.45 | 5.84 | 7.85 | 8.15 | 9.37 | 7.25 |
| (pixel) | 5.23 | 10.52 | 7.53 | 6.22 | 6.55 | 11.58 | 4.61 | 7.09 | 9.20 | 10.03 | 10.66 | 8.71 |
| (pixel) | 3.08 | 5.37 | 1.88 | 2.49 | 1.57 | 2.88 | 4.33 | 3.40 | 3.85 | 3.73 | 3.58 | 3.93 |
| —top (%) | 2.1 | 5.8 | 2.2 | 2.9 | 2.7 | 6.4 | 2.5 | 3.5 | 2.8 | 4.4 | 3.4 | 3.3 |
| —bottom (%) | 2.2 | 5.8 | 1.8 | 2.0 | 2.0 | 5.7 | 2.3 | 2.6 | 1.7 | 2.5 | 2.2 | 2.2 |
Table 10.
Calibration results of camera calibration based on multiple walking people of the Camera Network 6. denotes the relative reprojection error.
Table 10.
Calibration results of camera calibration based on multiple walking people of the Camera Network 6. denotes the relative reprojection error.
| | 001-003 | 001-005 | 001-006 | 001-007 | 001-008 |
|---|
| —Top (%) | 2.5 | 5.1 | 8.6 | 7.4 | 6.0 |
| —Bottom (%) | 1.9 | 5.9 | 7.3 | 12.5 | 10.0 |
Table 11.
Calibration results of camera calibration based on multiple walking people of the Camera Network 7. The extrinsic parameters was estimated based on the proposed method in
Section 3.2 hip joints and the proposed method in
Section 3.5 without both hip and feet information.
denotes the relative reprojection error.
| | Single Person | Multiple People |
|---|
| | 001-002 | 003-004 | 001-002 | 003-004 |
| | Without Hip | Hip | Without Hip | Hip | Without Hip | Hip | Without Hip | Hip |
| —top (%) | 2.8 | 1.2 | 7.7 | N/A | 2.7 | 1.4 | 1.3 | 1.2 |
| —bottom (%) | 6.7 | 6.4 | 8.4 | N/A | 7.5 | 8.5 | 7.6 | 10.6 |

 ,
, 


