Abstract
Combustible gases, such as CH4 and CO, directly or indirectly affect the human body. Thus, leakage detection of combustible gases is essential for various industrial sites and daily life. Many types of gas sensors are used to identify these combustible gases, but since gas sensors generally have low selectivity among gases, coupling issues often arise which adversely affect gas detection accuracy. To solve this problem, we built a decoupling algorithm with different gas sensors using a machine learning algorithm. Commercially available semiconductor sensors were employed to detect CH4 and CO, and then support vector machine (SVM) applied as a supervised learning algorithm for gas classification. We also introduced a pairing plot scheme to more effectively classify gas type. The proposed model classified CH4 and CO gases 100% correctly at all levels above the minimum concentration the gas sensors could detect. Consequently, SVM with pairing plot is a memory efficient and promising method for more accurate gas classification.
1. Introduction
The need for the detection of various gases in industrial and public areas has been continuously increasing as environment, health, and safety issues arise. Combustible gas detection is the most important due to the risk of fire and explosion [1,2,3,4]. Various gas sensor types have been used to detect combustible gases in the atmosphere including electrochemical, semiconductor, photoelectric, and MEMS sensors [5,6]. Semiconductor gas sensors offer many advantages, including low cost, small size, wide range of detectable gases, fast response time, and high sensitivity to combustible gases. However, high and broad sensitivity leads to relatively low selectivity and, consequently, to coupling problems where the sensor reacts to another gas in duplicate or cross-response. Sensor response can be greatly degraded by coupling. Considerable research and development efforts have been focused on physical parameters, such as materials, sensor structure, and sensor driving conditions, etc., to solve this problem, but these approaches have not yet achieved a technical level of commercialization. Therefore, a gas classification algorithm to compensate for the coupling problem may be a more viable solution. Consequently, many studies have considered gas classification models incorporating various machine learning methods [7,8,9,10,11,12,13].
In this study, we constructed a decoupling algorithm with two different SnO2 semiconductor gas sensors based on support vector machine (SVM) to classify CH4 and CO as representative combustible gases. We also introduced a new pairing plot scheme in the gas classification algorithm to obtain gas detection signal behavior patterns that could be classified into two classes by SVM. An experimental calibrating gas environment was set up and gas sensing experiments were conducted under specific gas injection conditions. After data acquisition, first data selection (FDS) was applied to include only meaningful data in the classification model, and then behavior patterns for each gas were analyzed using pairing plots. Gas sensor responses showed distinguishable patterns. Subsequently, second data selection (SDS) was performed to reduce computational costs. Finally, we built a gas classification model based on non-linear SVM and verified reliability for the final model using a confusion matrix.
2. Materials and Methods
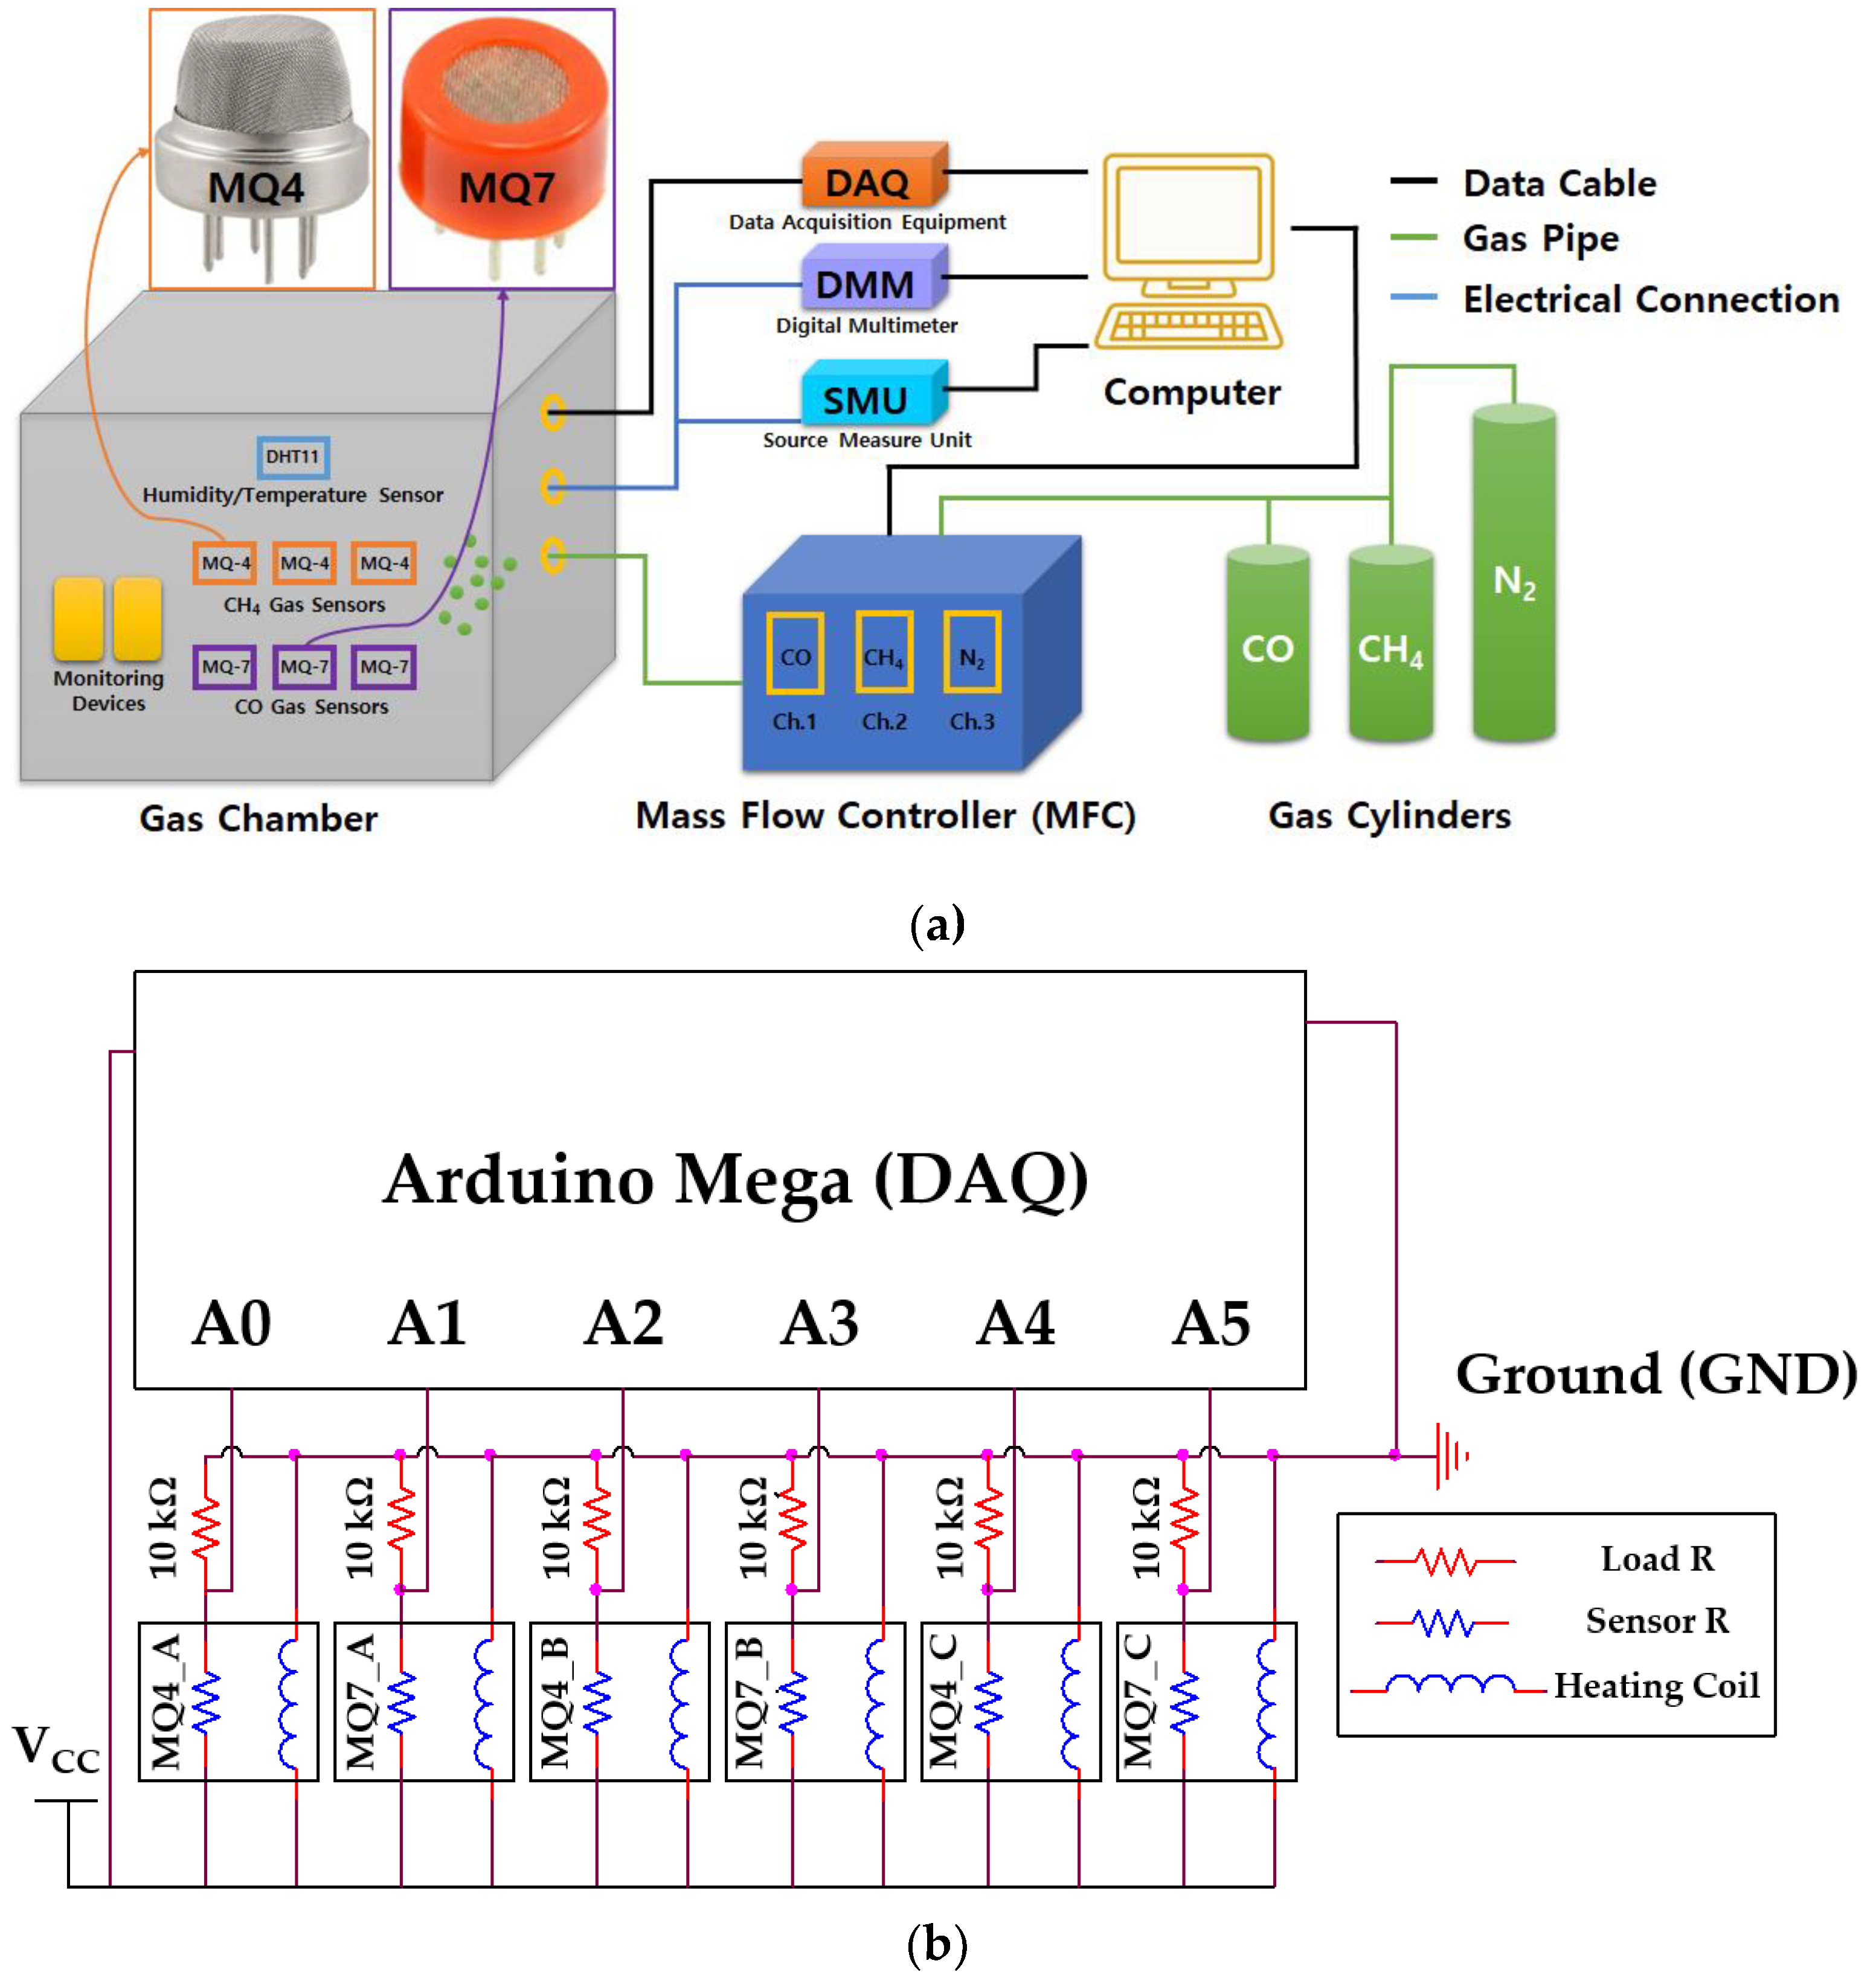
We designed the experimental setup to provide a controllable gas environment, as shown in Figure 1a. The setup included a gas chamber connected with gas cylinders, data acquisition equipment (DAQ) for gas sensor control and measurement, digital multimeter (DMM) to verify electrical signals in the circuit, source measure unit (SMU) for specific voltage supply to the circuit, mass flow controller (MFC) for accurate CH4 and CO flow control, and a computer to control these components and run gas classification algorithms.
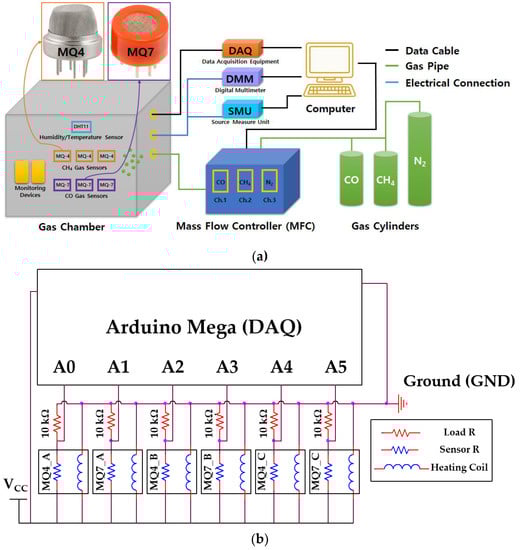
Figure 1.
Experiment schematics for gas detection: (a) experiment equipment setup including data acquisition equipment (DAQ), digital multimeter (DMM), source measure unit (SMU), and mass flow controller (MFC) and (b) gas sensor array and circuit block diagram.
We employed commercially available MQ4 and MQ7 sensors [14,15] (Zhengzhou Winsen Electronics Technology Corporation, Zhengzhou, China) to detect CH4 and CO, respectively, as shown in Figure 1a. These are SnO2-based n-type semiconductor sensors [16,17,18,19] which operate based on reactions with combustible gases around the SnO2 surface. When the sensor is heated up, oxygen is actively adsorbed on the surface, taking electrons from the SnO2 surface, forming an electron depletion region beneath the surface. When CH4 and CO gases are present around SnO2 with sufficient energy, they react with adsorbed oxygen atoms, subsequently releasing electrons to SnO2 and, hence, reducing sensor resistance. Therefore, a load resistor is required in the data collection circuit, and voltage drops across the load resistor increase as the sensor resistance reduces due to the gas interaction. Thus, we collected load resistor voltages as gas detection signals. The load resistance was set 10 kΩ to obtain high sensing resolution which can be determined by following equations:
where Vr is the output signal range, VCC is the operating voltage, RL is the load resistance, Rs_max is the maximum sensor resistance, and Rs_min is the minimum sensor resistance.
Next, maximum Vr in Equation (2) can be obtained by calculating only the minimum value of because VCC, Rs_min, and Rs_max are constant.
As shown in Equations (3) and (4), by using arithmetic–geometric mean inequality, the minimum value of is calculated and RL is decided.
Moreover, the operating temperature also affects the sensors’ performance [20,21,22]. Practically, the best temperatures for CH4 and CO to be adsorbed on the SnO2 surface are very different, presenting less cross-selectivity with respect to other gases. However, even if sensors operate at the best operating temperature for each gas, the cross-selectivity issue still cannot be fully ignored. This study employed the selectivity differences among the two types of sensor for decoupling. Thus, the operating temperature of each sensor should be constant by fixing an operating voltage of 5 V (Vcc) and the heating coil resistance of each gas sensor. Figure 1b shows that the sensor circuit comprised three cross-arranged MQ4 and MQ7 sensors for effective gas detection.
In this study, we conducted the gas detection experiments for a single gas environment. More specifically, a situation was assumed to identify whether it was CH4 or CO when multiple semiconductor gas sensors were employed. Gas injection experiments commenced with aging time to heat and, hence, stabilize the sensors. After sufficient aging time, gas was injected at specific rates (standard cubic centimeter per minute (sccm)) for 20 s. Injection then stopped and a 5 min reaction time was allowed to ensure the gas sensors fully reacted. The same cycle was repeated with increasing gas levels until the target gas concentration was attained. The experiments were carried out under ambient atmosphere, i.e., air for both CH4 and CO gas detections since the metal oxide semiconductor sensors are not operational without oxygen. Moreover, N2 gas was only employed to purge and remove CH4 and CO gases remaining in the gas lines. After conducting each gas experiment, we evacuated CH4 or CO gas inside the chamber to initialize the experimental environment. Table 1 shows gas injection conditions for CH4 and CO gas detection experiments.

Table 1.
CH4 and CO gas injection conditions for gas detection experiments.
The experimental setup was carried out for each gas concentration within a range that could be fatal to humans by assuming CH4 or CO gas was leaked at actual industrial sites or public places. Thus, the target gas concentrations were different, because the human hazardous concentration of CH4 gas is higher than the CO gas according to the dangerous concentration criteria of the Korea Gas Safety Corporation and Korea Environment Corporation.
We designed the SVM for classifying CH4 and CO gases using MATLAB®. In general, SVM is a machine learning method classifying two or more data classes [23,24,25,26,27]. This study built a classification model with non-linear SVM to classify curved behavioral patterns. In the SVM algorithm, kernel function helps modeling for non-linear hyperplane with reduced computational costs. Thus, we employed a Gaussian RBF kernel function, which is one of the generally used and high-performance functions, which can be expressed as;
where Xi and Yi are data set vectors corresponding to CH4 and CO gas, respectively; and γ is a parameter controlling the deviation of the Gaussian function [28,29]. After gas classification modeling, we verified the classification model’s reliability using a confusion matrix with test data sets extracted from a distinct gas detection experiment [30,31,32]. A confusion matrix is a visualization method for classification of model performance and reliability. The model’s reliability verification using the confusion matrix proceeded with new data sets that did not belong to the training data. The confusion matrix visualizes the matches between the predicted class and the true class. We also used several dummy data sets to double check classification model reliability.
3. Results
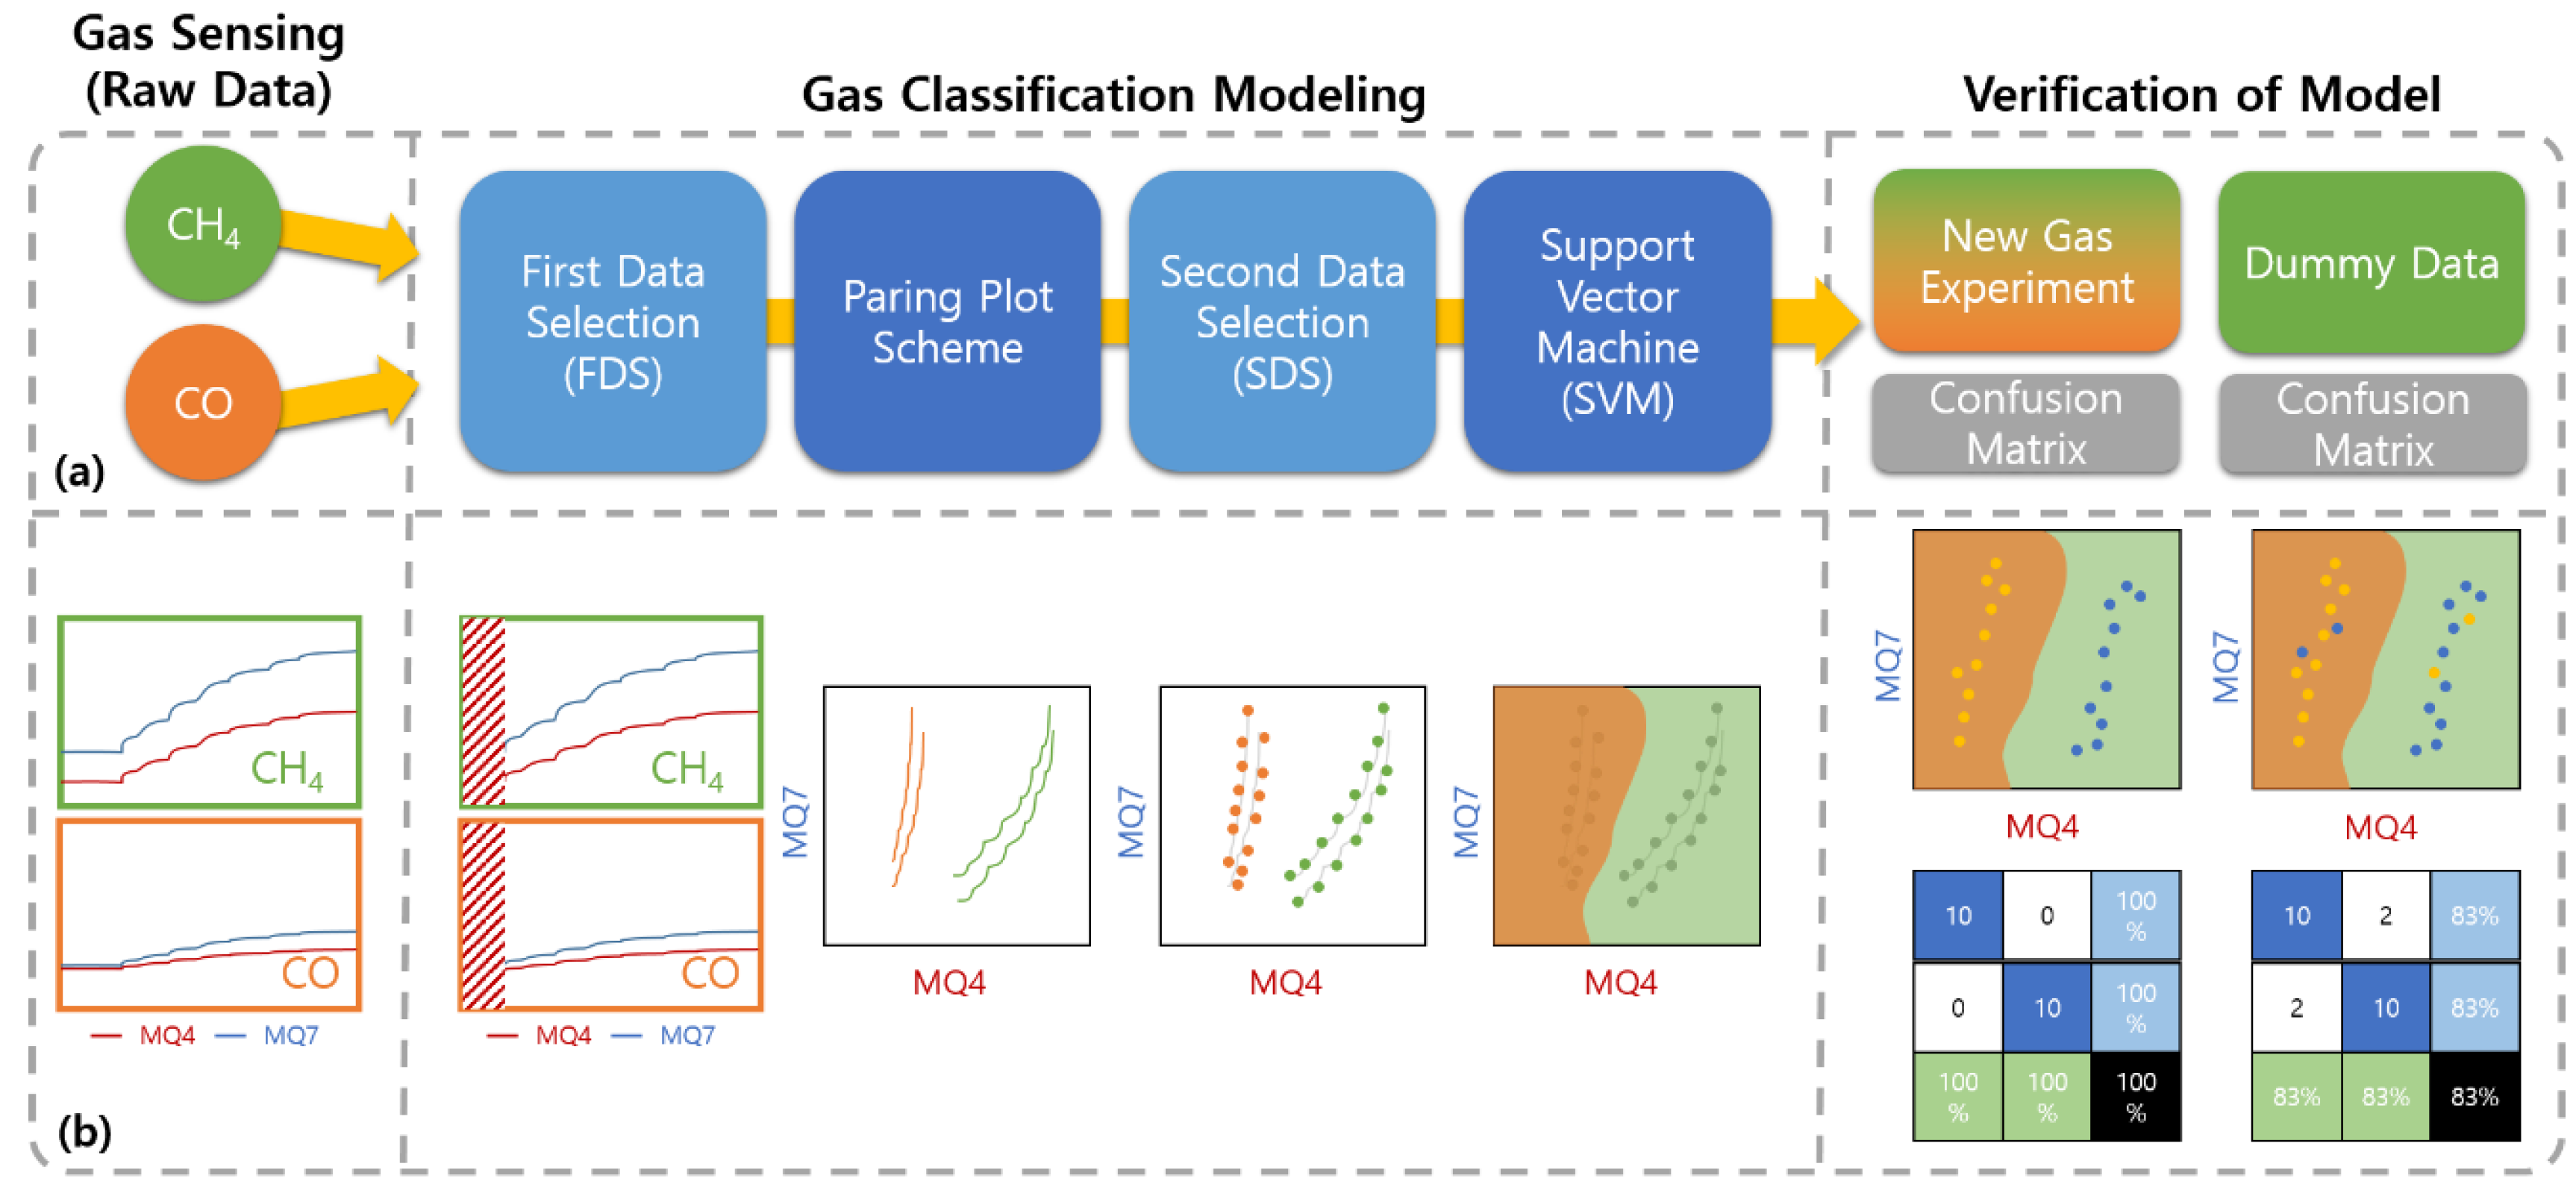
As shown in Figure 2, the overall procedure of the gas classification consisted of gas sensing experiments, gas classification modeling, and two-step verifications. Moreover, gas classification modeling involves four steps: first data selection (FDS), pairing plot scheme, second data selection (SDS), and SVM.
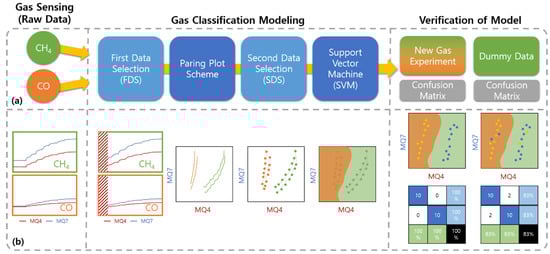
Figure 2.
Overall conceptual diagram for gas classification: (a) the classification flow for the entire processes and (b) the output schematics for each process.
3.1. Raw Data for Gas Sensing
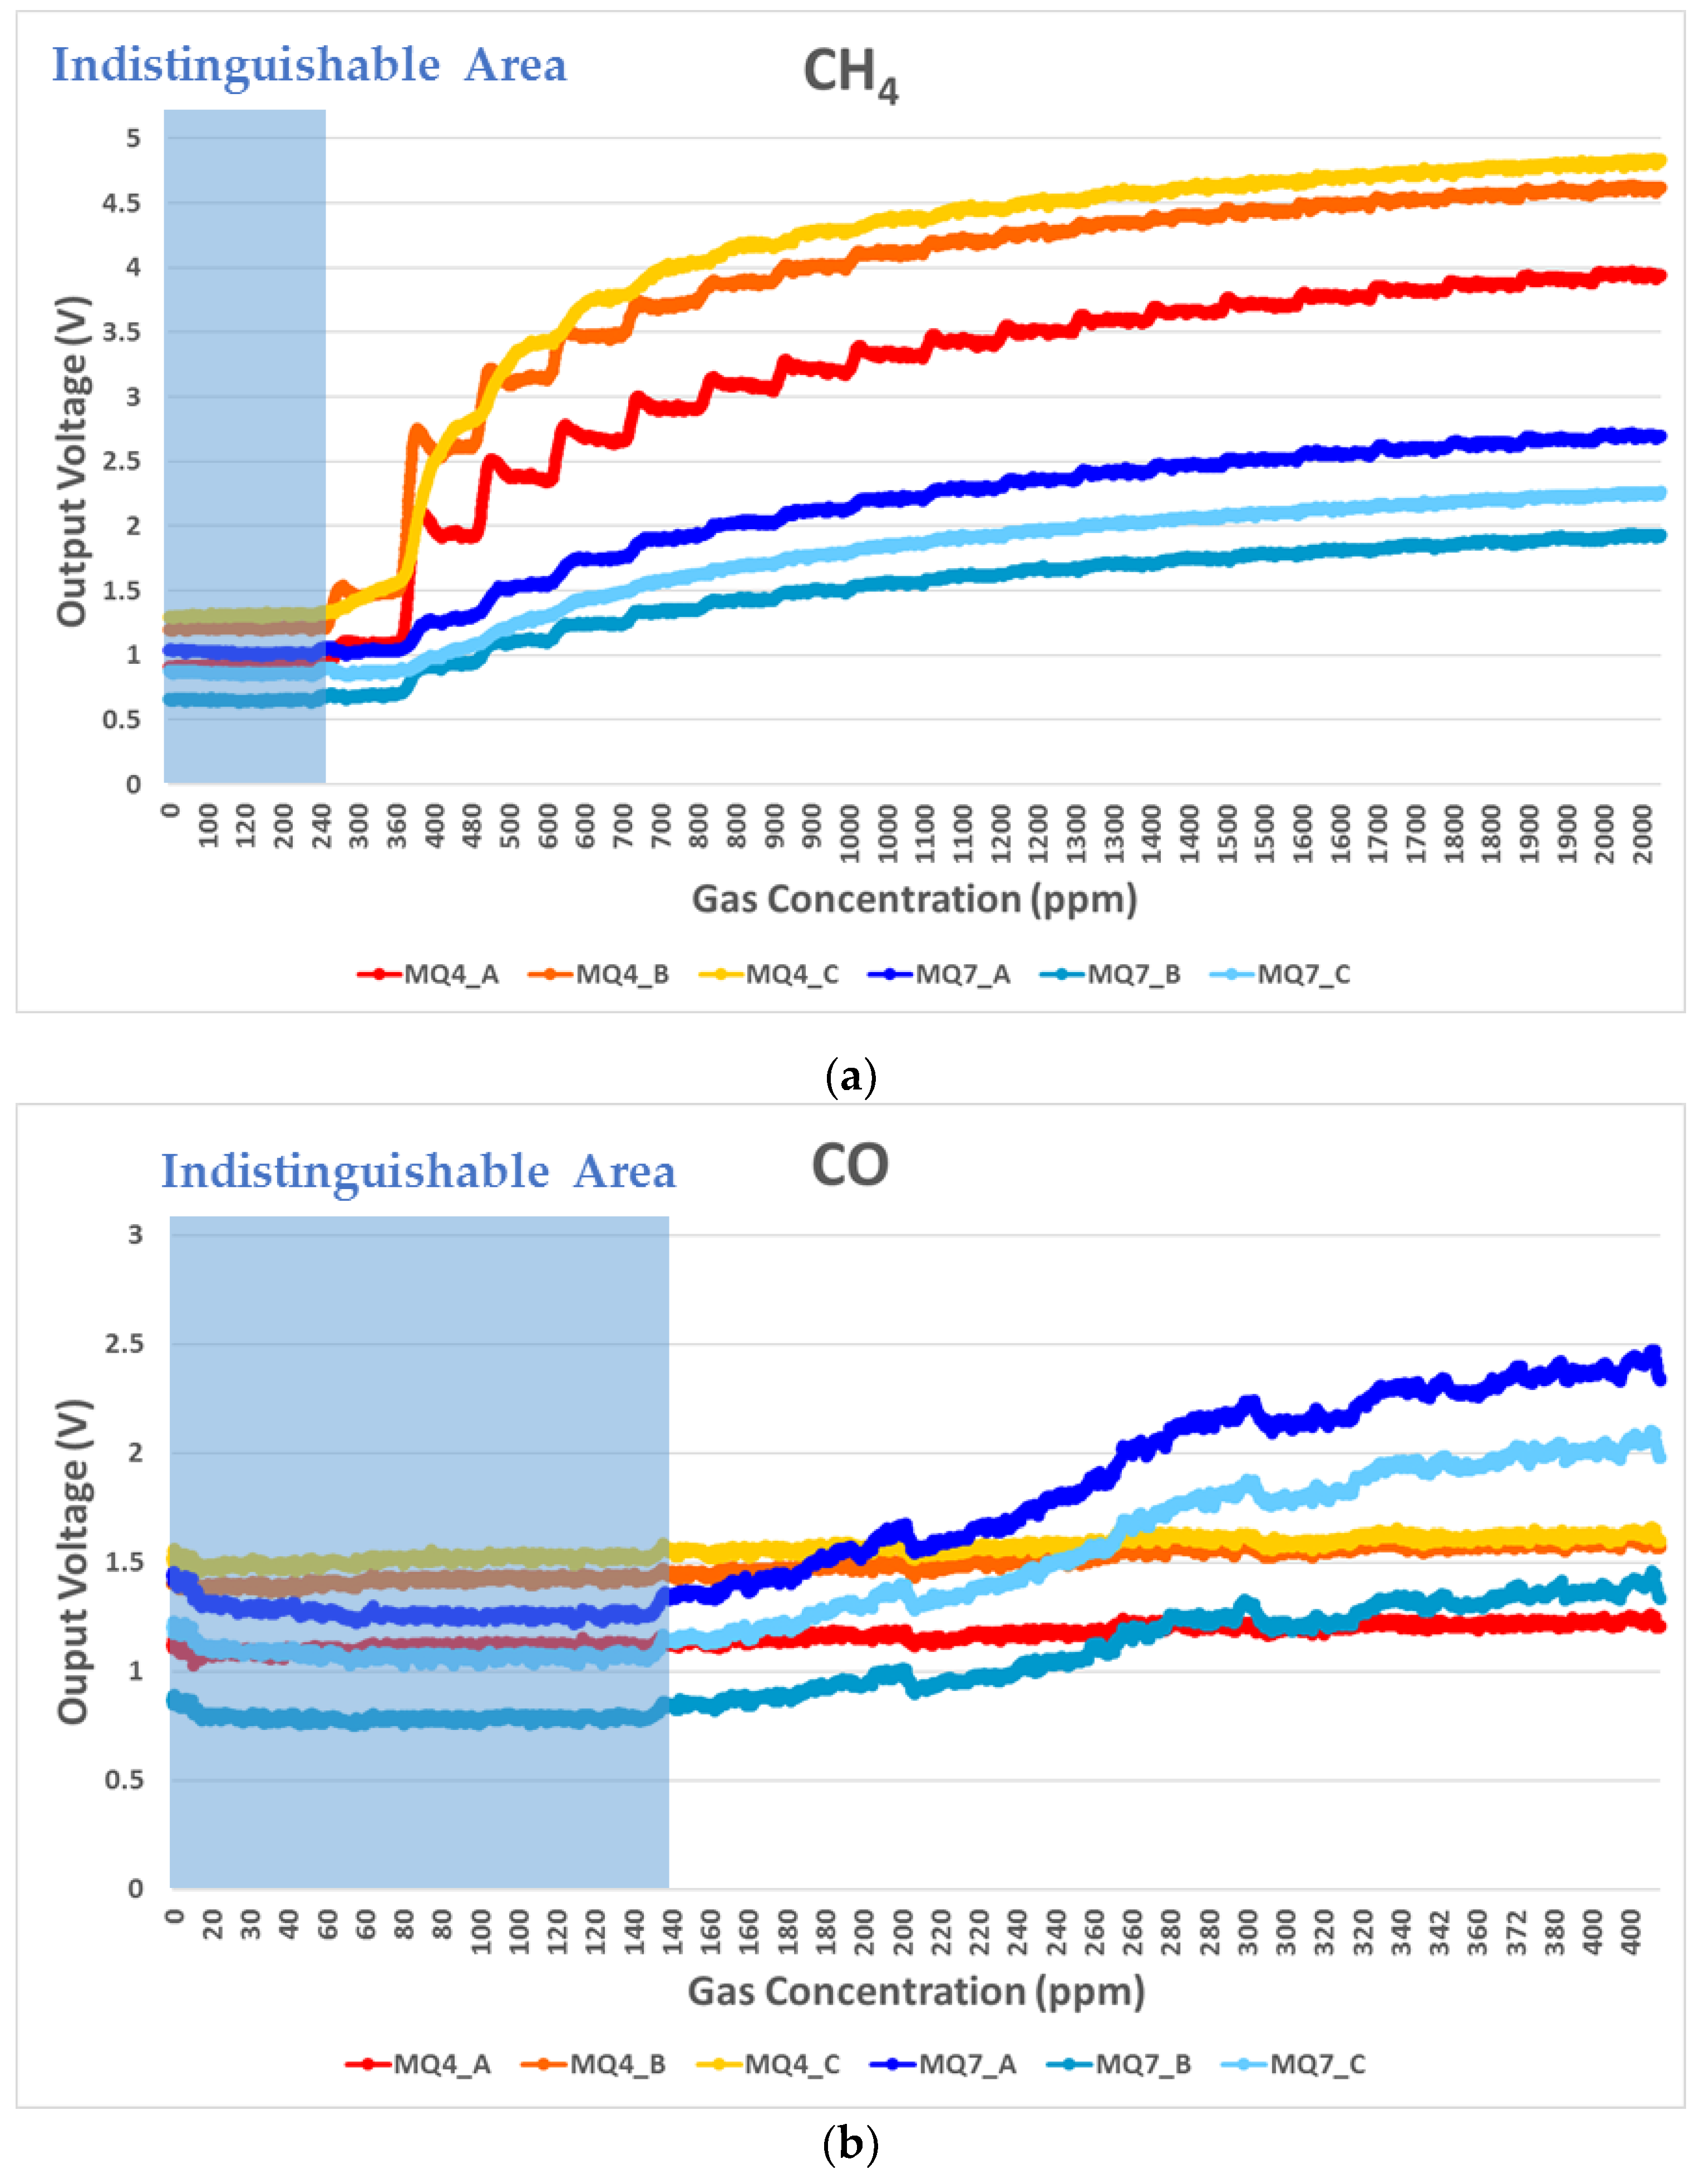
Figure 3 shows output voltages for the load resistor resulting from MQ4 and MQ7 sensor reactions with respect to gas concentration. These output voltages were logged every 2 s by DAQ. Therefore, we could confirm the responses of each gas sensor by observing the voltage changes from the load resistor.

Figure 3.
Measured representative sensor output voltages for gas detection experiments: (a) CH4 and (b) CO gas.
Although the MQ4 sensor was specific for detecting CH4 gas, it also reacted to CO gas with a similar issue arising for the MQ7 sensor. Thus, both sensors exhibit low selectivity and, hence, coupling problems for gas signals. Therefore, it was not possible to clearly identify CH4 or CO gas levels from either sensor alone. Even using both gas sensors, it was difficult to classify gas type from output voltages alone. Therefore, we proposed SVM with a pairing plot method.
3.2. Pairing Plot Scheme for Support Vector Machine
There were concentration ranges where the sensing signals were indistinguishable (Figure 3, blue marked area) due to the gas sensors’ physical limitations. Thus, we needed to select meaningful data before pairing the data, i.e., FDS. It was necessary to avoid confusion about the initial response of the sensors due to the noise voltages under ambient atmosphere. To extract meaningful data used for machine learning, the SnO2 gas sensor signals should be distinguishable from the initial detection value (Vinitial) at which sensors start detecting gases. The noise voltage difference (Vnoise.diff) is the difference between maximum and minimum noise voltage values before gas injection. Vinitial should be at least two times larger than Vnoise.diff. Based on these criteria, we specified indistinguishable sensing value ranges as shown in Figure 3 (blue marked area). We set the FDS criteria based on the Vinitial for each gas sensor, defined by ambient atmosphere voltage (Vambient) and Vnoise.diff. In short, the Vinitial was determined by the minimum detectable voltage (Vdet) in the following equations:
where Vambient is average output voltage in ambient atmosphere, and Vnoise.diff is the difference between maximum and minimum noise voltage in ambient atmosphere.
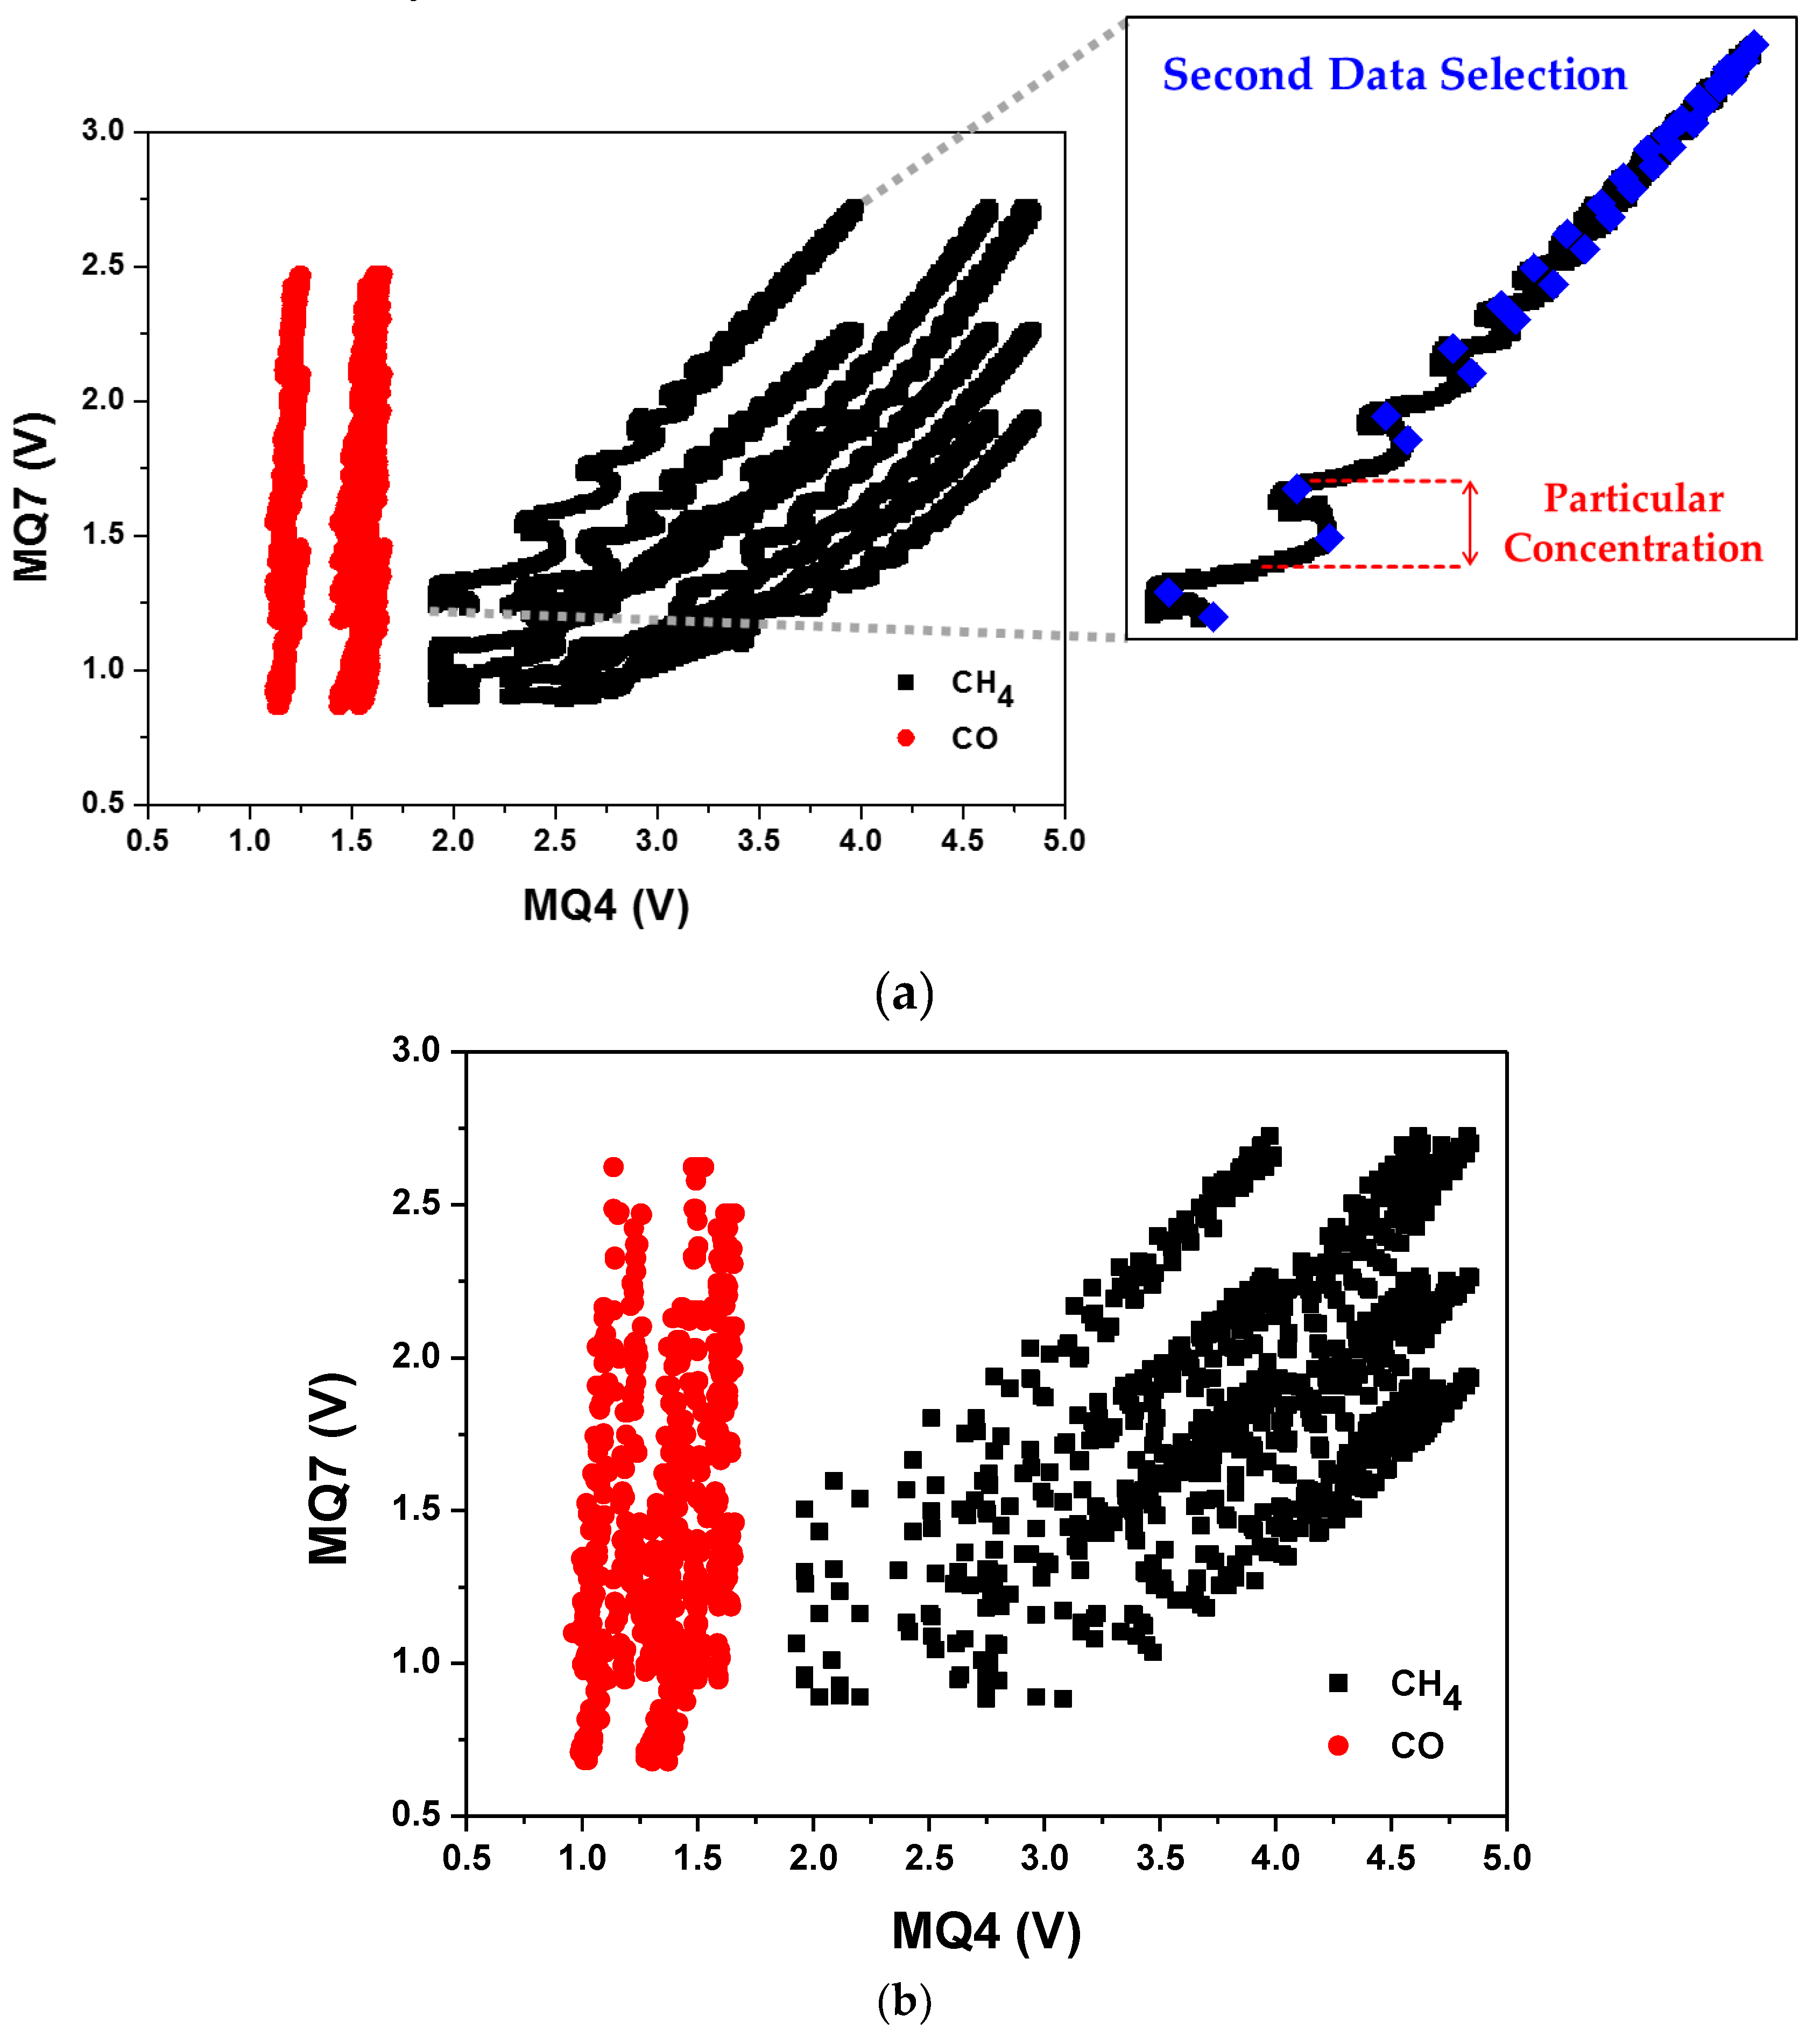
Only output voltages above Vinitial were selected for the pairing plot. The selected data were plotted in the form of (MQ4, MQ7) considering all possible pairing cases in each gas detection experiment. For example, since there were three MQ4 and three MQ7 sensors, nine pairing (MQ4, MQ7) cases were extracted from each experiment. Figure 4a shows the pairing plots for the FDS applied gas detection experiment. The CH4 and CO gas had distinguishable behavior patterns that enabled them to be clearly classified.

Figure 4.
Pairing plots for the CH4 and CO gas detection data sets: (a) all possible pairing cases with first data selection for one experiment data (inset: second data selection detail) and (b) second data selection for all experiment data sets.
In SVM training, determining hyperplane was performed using only boundary data for each class. Thus, for the data sets selected from FDS, additional data selection was performed using the concentration in each injection cycle. This provided significant memory and computational efficiency for the learning process. Figure 4a inset shows that the number of data in the particular gas concentration can be reduced to two data points through SDS by pairing the maximum MQ4 value with the corresponding MQ7 value and the maximum MQ7 value with the corresponding MQ4 value, i.e., (MQ4_max, MQ7) and (MQ4, MQ7_max), respectively, providing the pairing plot with the minimum number of essential data (Figure 4b). We subsequently applied non-linear SVM with these paired data sets.
3.3. Gas Classification Model Using Non-Linear Support Vector Machine
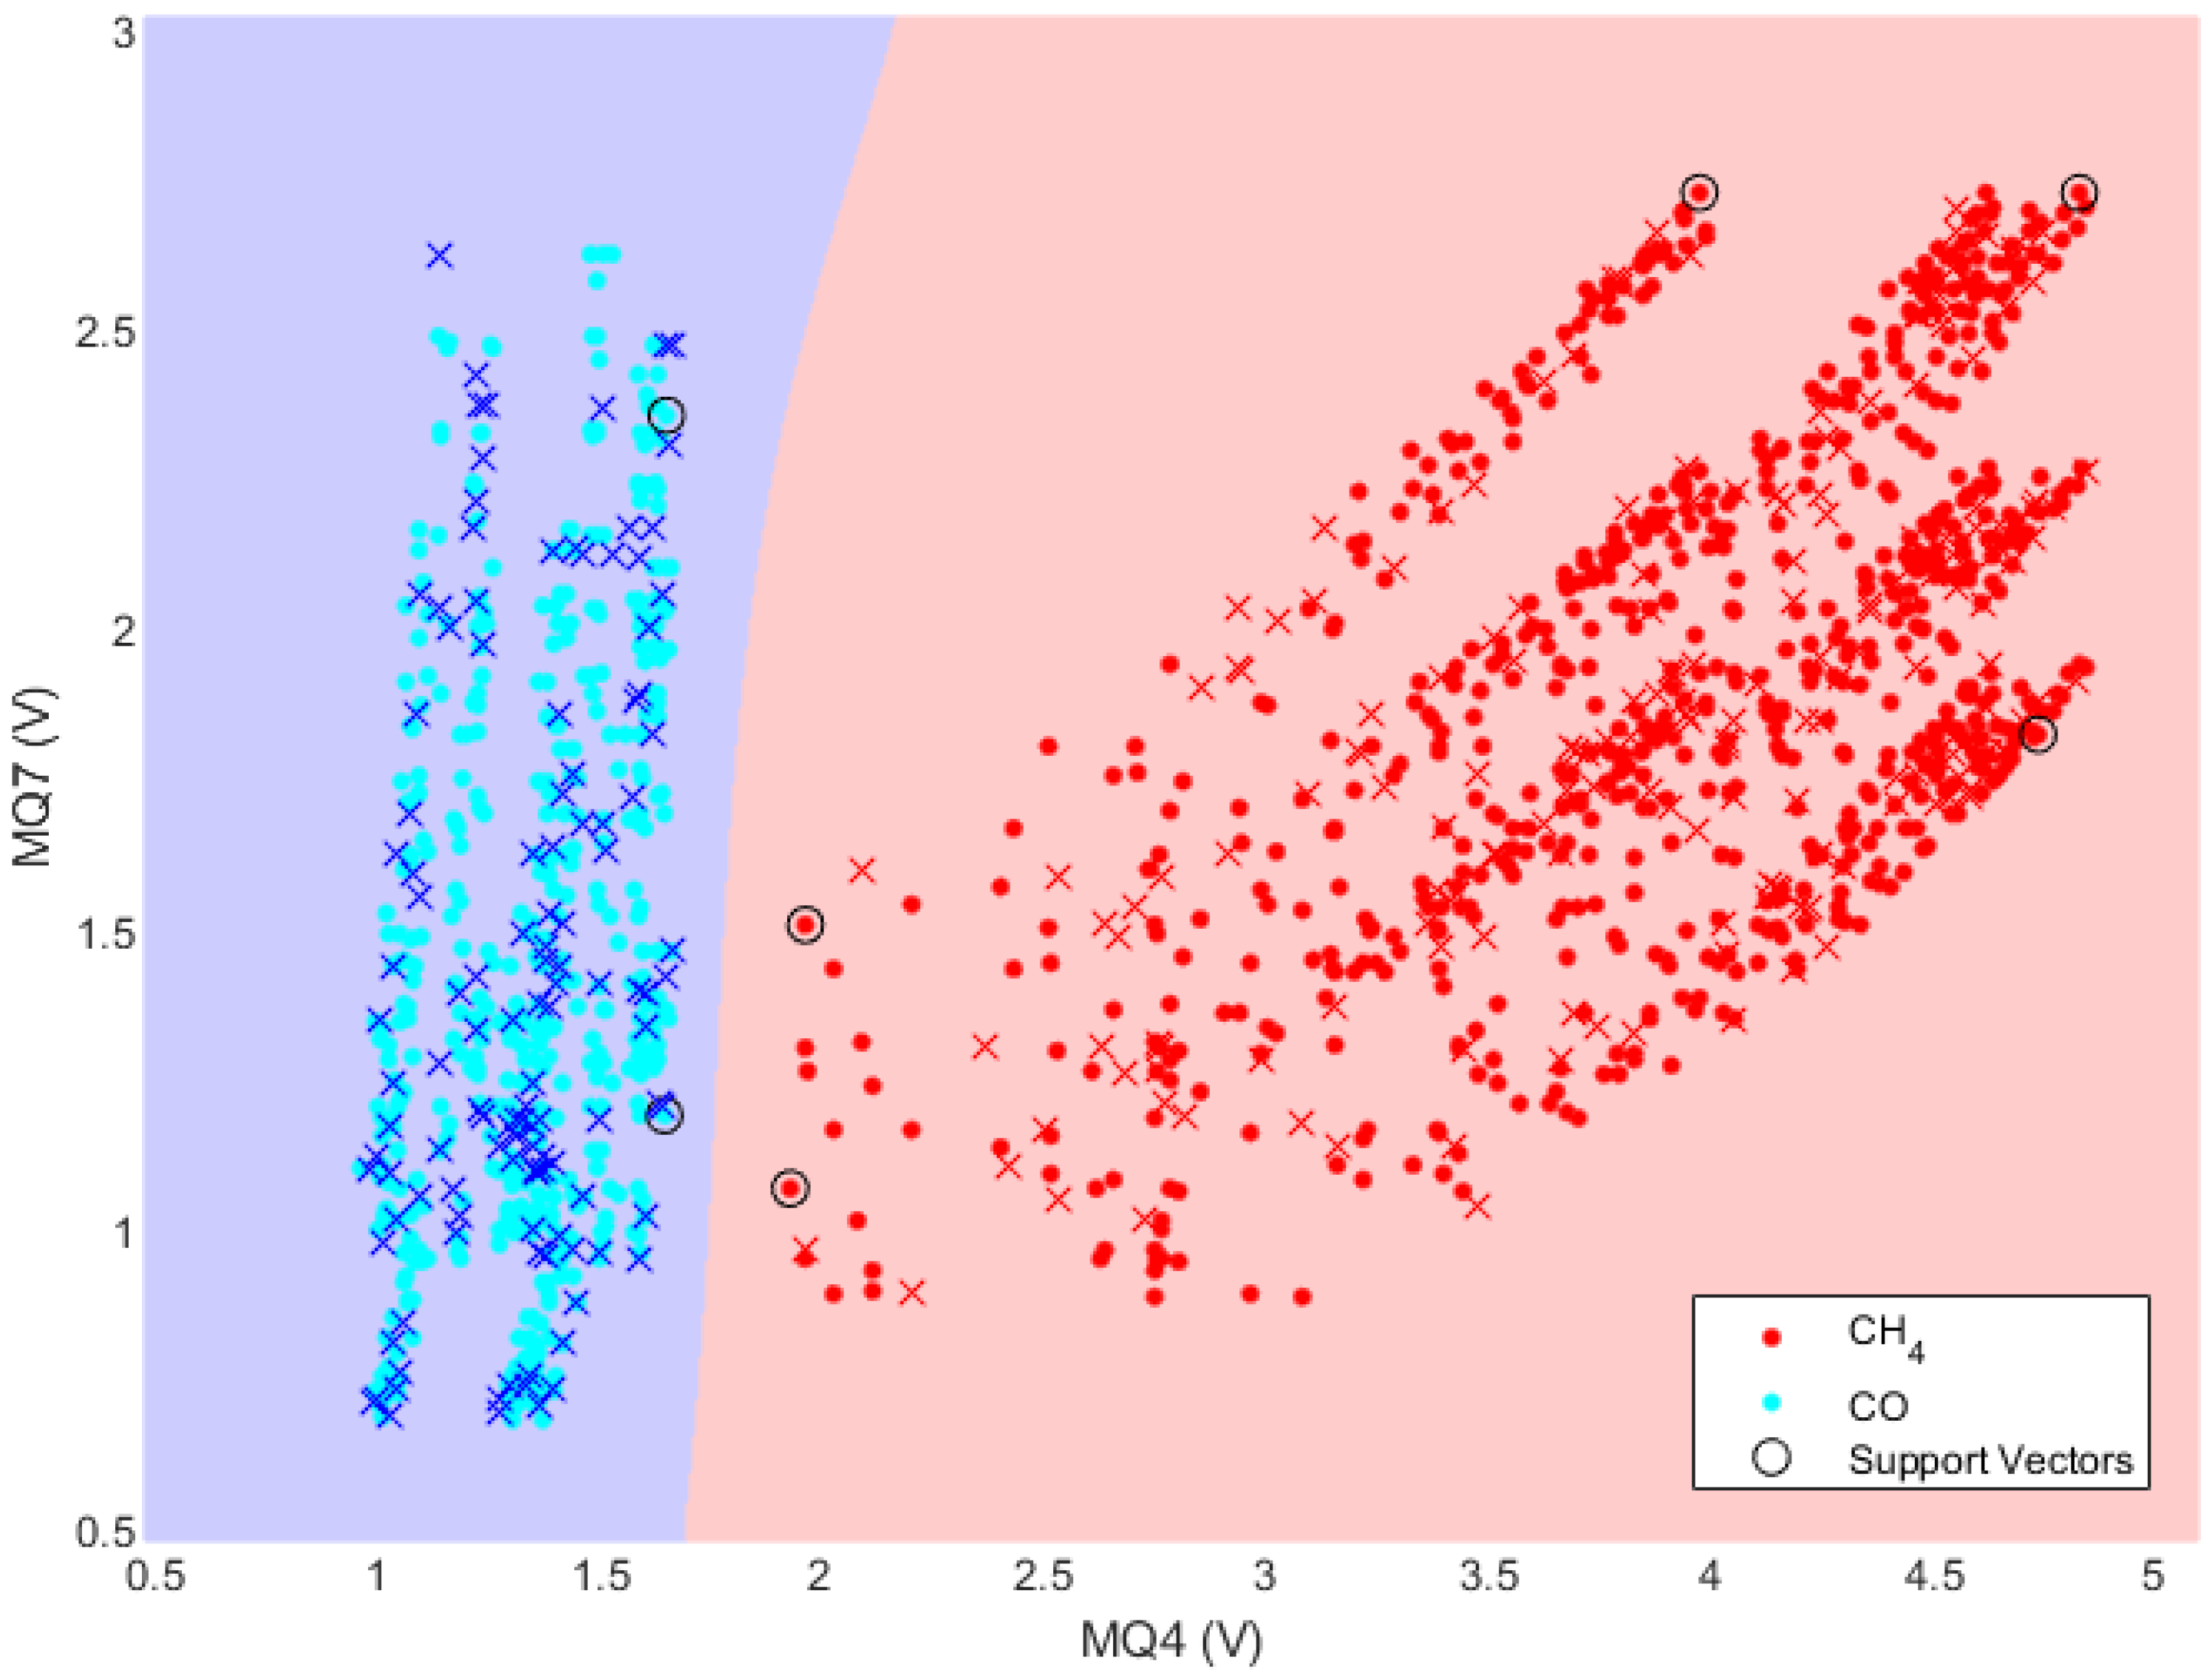
Selected data sets were randomly divided into training and testing data sets at a 4:1 ratio. Feature selection for the data sets was decided by the output voltage, since all data sets only included the output voltage in this study. The K-Fold cross validation was used to avoid the overfitting problem for the training data sets [33,34,35]. The most important SVM step is to find the hyperparameters defining the optimal hyperplane. We used the Gaussian RBF kernel method for the non-linear SVM to define the hyperplane and, hence, establish the classification model. Subsequent verification with the testing data sets confirmed 100% classification accuracy. Figure 5 shows the visualization of elements for the defined hyperplane, support vectors, and all data sets.
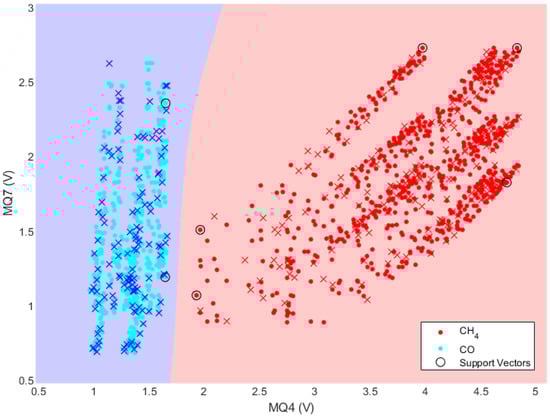
Figure 5.
CH4 and CO gas classification using non-linear SVM with pairing plots; • = training and × = testing data sets.
To verify classification model reliability, we extracted paired data sets for a new CH4 and CO gas detection experiment. The number of data sets for CH4 and CO were 102 and 126, respectively. Figure 6a shows the gas classification confusion matrix for the new paired data sets, confirming 100% classification accuracy for each gas. Moreover, we intentionally created 10 paired data sets with incorrect values for each gas to double check the model’s reliability. As shown in Figure 6b, the confusion matrix results for classification by adding these dummy data sets were visualized. Consequently, the reliability of the non-linear SVM gas classification model was verified again by fully classifying all 20 incorrect paired data sets.
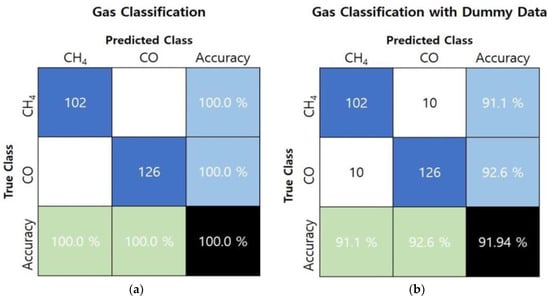
Figure 6.
Confusion matrix for classification model with (a) data sets from new gas detection experiments and (b) an additional 20 incorrect data sets.
4. Conclusions
Although combustible gas detection in industrial and public areas is essential, it is difficult to accurately identify gases due to the inferior semiconductor gas sensor performance. In particular, selectivity issues cause significant coupling problems among sensing signals, making accurate gas identification difficult. Thus, it is necessary to introduce an algorithmic approach to compensate for this issue. In this work, we proposed a classification algorithm based on support vector machine by introducing a pairing plot technique. Furthermore, we achieved the memory efficient gas classification model using the data selection method. Model reliability was verified by classifying CH4 and CO gases 100% accuracy through additional tests with confusion matrix. Thus, the proposed method classified CH4 and CO gases simultaneously with 100% accuracy even in the presence of gas sensor selectivity issues. The proposed approach is not specific to semiconductor gas sensors and could also be applied to most or all other sensor types which have sensing signal coupling problems. Therefore, modeling with non-linear support vector machine and pairing plot technique could be an effective way to identify gases.
Author Contributions
Conceptualization, K.-W.J. and J.-H.J.; formal analysis, J.-H.C.; supervision, H.-S.K.
Funding
This research was funded by the Ministry of Trade, Industry and Energy (MOTIE, Korea) under the Technology Innovation Program (No. 10073122) and the Basic Science Research Program through the National Research Foundation of Korea (NRF) funded by the Ministry of Education (No. 2017R1D1A1A09000823).
Conflicts of Interest
The authors declare no conflict of interest.
References
- Bjerketvedt, D.; Bakke, J.R.; Van Wingerden, K. Gas explosion handbook. J. Hazard. Mater. 1997, 52, 1–150. [Google Scholar] [CrossRef]
- Dobashi, R. Experimental study on gas explosion behavior in enclosure. J. Loss Prevent. Proc. 1997, 10, 83–89. [Google Scholar] [CrossRef]
- Schröder, V.; Molnarne, M. Flammability of gas mixtures: Part 1: Fire potential. J. Hazard. Mater. 2005, 121, 37–44. [Google Scholar] [CrossRef] [PubMed]
- Molnarne, M.; Mizsey, P.; Schröder, V. Flammability of gas mixtures: Part 2: Influence of inert gases. J. Hazard. Mater. 2005, 121, 45–49. [Google Scholar] [CrossRef] [PubMed]
- MicroChem: Innovative Chemical Solutions for MEMS and Microelectronics. Available online: http://www.microchem.com (accessed on 16 August 2019).
- City Technology Ltd. Global Leaders in Gas Sensor Technology. Available online: http://www.citytech.com (accessed on 16 August 2019).
- Shahid, A.; Choi, J.H.; Rana, A.; Kim, H.S. Least Squares Neural Network-Based Wireless E-Nose System Using an SnO2 Sensor Array. Sensors 2018, 18, 1446. [Google Scholar] [CrossRef]
- Pardo, M.; Sberveglieri, G. Classification of electronic nose data with support vector machines. Sens. Actuators B Chem. 2005, 107, 730–737. [Google Scholar] [CrossRef]
- Han, L.; Yu, C.; Xiao, K.; Zhao, X. A New Method of Mixed Gas Identification Based on a Convolutional Neural Network for Time Series Classification. Sensors 2019, 19, 1960. [Google Scholar] [CrossRef]
- Ghaffarian, N.; Eslamloueyan, R.; Vaferi, B. Model identification for gas condensate reservoirs by using ANN method based on well test data. J. Petrol. Sci. Eng. 2014, 123, 20–29. [Google Scholar] [CrossRef]
- Jian, Y.; Huang, D.; Yan, J.; Lu, K.; Huang, Y.; Wen, T.; Zeng, T.; Zhong, S.; Xie, Q. A novel extreme learning machine classification model for e-Nose application based on the multiple kernel approach. Sensors 2017, 17, 1434. [Google Scholar] [CrossRef]
- Peng, P.; Zhao, X.; Pan, X.; Ye, W. Gas classification using deep convolutional neural networks. Sensors 2018, 18, 157. [Google Scholar] [CrossRef]
- Xu, Y.; Zhao, X.; Chen, Y.; Yang, Z. Research on a Mixed Gas Classification Algorithm Based on Extreme Random Tree. Appl. Sci. 2019, 9, 1728. [Google Scholar] [CrossRef]
- SparkFun Electronics. (Model: MQ4). Available online: https://cdn.sparkfun.com/datasheets/Sensors/Biometric/MQ-4%20Ver1.3%20-%20Manual.pdf (accessed on 16 August 2019).
- SparkFun Electronics. (Model: MQ7). Available online: https://cdn.sparkfun.com/datasheets/Sensors/Biometric/MQ-7%20Ver1.3%20-%20Manual.pdf (accessed on 16 August 2019).
- Harrison, P.G.; Willett, M.J. The mechanism of operation of tin (IV) oxide carbon monoxide sensors. Nature 1988, 332, 337–339. [Google Scholar] [CrossRef]
- Burresi, A.; Fort, A.; Rocchi, S.; Serrano, B.; Ulivieri, N.; Vignoli, V. Dynamic CO recognition in presence of interfering gases by using one MOX sensor and a selected temperature profile. Sens. Actuator B Chem. 2005, 106, 40–43. [Google Scholar] [CrossRef]
- Suematsu, K.; Ma, N.; Watanabe, K.; Yuasa, M.; Kida, T.; Shimanoe, K. Effect of humid aging on the oxygen adsorption in SnO2 gas sensors. Sensors 2018, 18, 254. [Google Scholar] [CrossRef] [PubMed]
- Schweizer-Berberich, M.; Zdralek, M.; Weimar, U.; Göpel, W.; Viard, T.; Martinez, D.; Seube, A.; Peyre-Lavigne, A. Pulsed mode of operation and artificial neural network evaluation for improving the CO selectivity of SnO2 gas sensors. Sens. Actuator B Chem. 2000, 65, 91–93. [Google Scholar] [CrossRef]
- Yu, J.H.; Choi, G.M. Selective CO gas detection of CuO-and ZnO-doped SnO2 gas sensor. Sens. Actuators B Chem. 2001, 75, 56–61. [Google Scholar] [CrossRef]
- Lentka, Ł.; Smulko, J.M.; Ionescu, R.; Granqvist, C.G.; Kish, L.B. Determination of gas mixture components using fluctuation enhanced sensing and the LS-SVM regression algorithm. Metrol. Meas. Syst. 2015, 22, 341–350. [Google Scholar] [CrossRef]
- Sedghi, S.M.; Mortazavi, Y.; Khodadadi, A. Low temperature CO and CH4 dual selective gas sensor using SnO2 quantum dots prepared by sonochemical method. Sens. Actuators B Chem. 2010, 145, 7–12. [Google Scholar] [CrossRef]
- Khemchandani, R.; Chandra, S. Twin support vector machines for pattern classification. IEEE Trans. Pattern Anal. Mach. Intell. 2007, 29, 905–910. [Google Scholar]
- Lin, Y.; Lee, Y.; Wahba, G. Support vector machines for classification in nonstandard situations. Mach. Learn. 2002, 46, 191–202. [Google Scholar] [CrossRef]
- Gold, C.; Sollich, P. Model selection for support vector machine classification. Neurocomputing 2003, 55, 221–249. [Google Scholar] [CrossRef]
- Furey, T.S.; Cristianini, N.; Duffy, N.; Bednarski, D.W.; Schummer, M.; Haussler, D. Support vector machine classification and validation of cancer tissue samples using microarray expression data. Bioinformatics 2000, 16, 906–914. [Google Scholar] [CrossRef] [PubMed]
- Fung, G.M.; Mangasarian, O.L. A feature selection Newton method for support vector machine classification. Comput. Optim. Appl. 2004, 28, 185–202. [Google Scholar] [CrossRef]
- Chung, K.M.; Kao, W.C.; Sun, C.L.; Wang, L.L.; Lin, C.J. Radius margin bounds for support vector machines with the RBF kernel. Neural Comput. 2003, 15, 2643–2681. [Google Scholar] [CrossRef]
- Amari, S.I.; Wu, S. Improving support vector machine classifiers by modifying kernel functions. Neural Netw. 1999, 12, 783–789. [Google Scholar] [CrossRef]
- Landgrebe, T.C.; Duin, R.P. Efficient multiclass ROC approximation by decomposition via confusion matrix perturbation analysis. IEEE Trans. Pattern Anal. Mach. Intell. 2008, 30, 810–822. [Google Scholar] [CrossRef]
- Visa, S.; Ramsay, B.; Ralescu, A.L.; Van Der Knaap, E. Confusion Matrix-based Feature Selection. Mod. Artif. Intell. Cogn. Sci. 2011, 710, 120–127. [Google Scholar]
- Deng, X.; Liu, Q.; Deng, Y.; Mahadevan, S. An improved method to construct basic probability assignment based on the confusion matrix for classification problem. Inf. Sci. 2016, 340, 250–261. [Google Scholar] [CrossRef]
- Rodriguez, J.D.; Perez, A.; Lozano, J.A. Sensitivity analysis of k-fold cross validation in prediction error estimation. IEEE Trans. Pattern Anal. 2009, 32, 569–575. [Google Scholar] [CrossRef]
- Fushiki, T. Estimation of prediction error by using K-fold cross-validation. Stat. Comput. 2011, 21, 137–146. [Google Scholar] [CrossRef]
- Wong, T.T. Performance evaluation of classification algorithms by k-fold and leave-one-out cross validation. Pattern Recognit. 2015, 48, 2839–2846. [Google Scholar] [CrossRef]

© 2019 by the authors. Licensee MDPI, Basel, Switzerland. This article is an open access article distributed under the terms and conditions of the Creative Commons Attribution (CC BY) license (http://creativecommons.org/licenses/by/4.0/).