An Insulated Flexible Sensor for Stable Electromyography Detection: Application to Prosthesis Control


Abstract
:1. Introduction
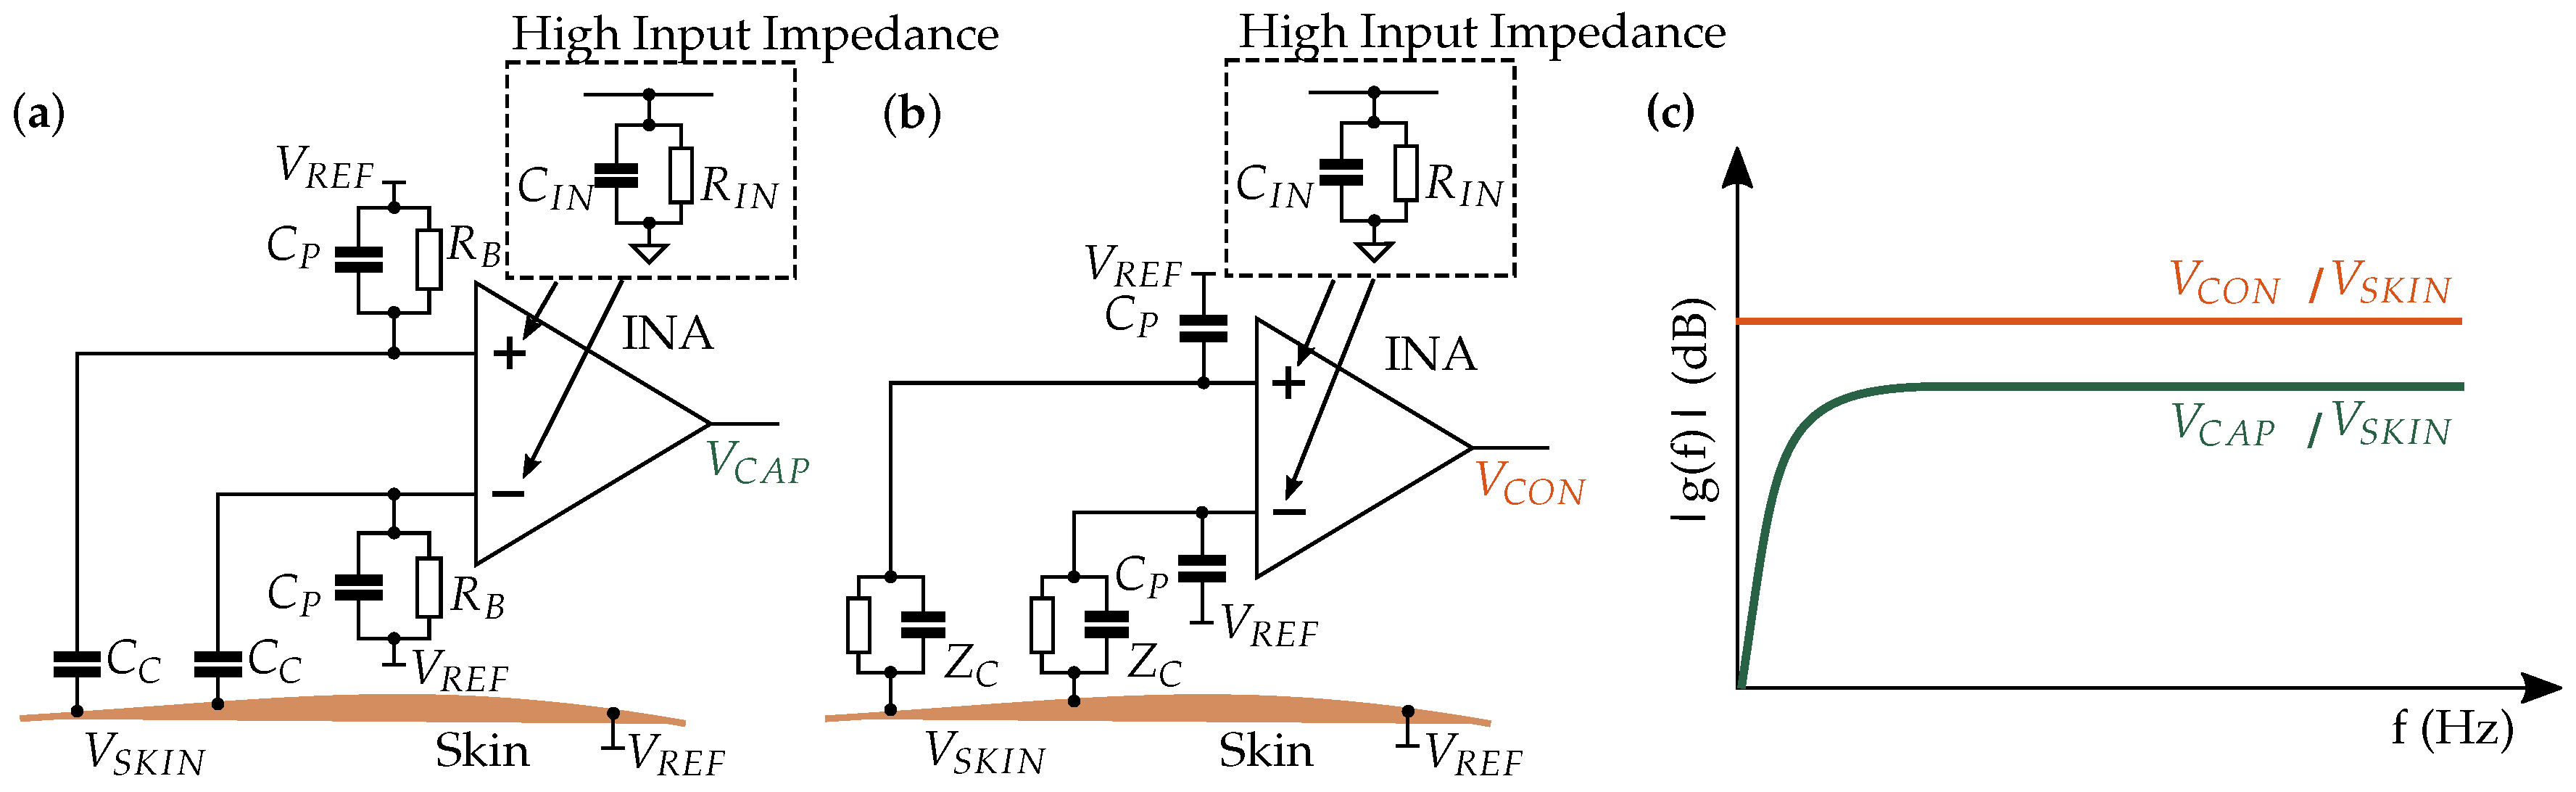
2. Comparison of the Capacitive and Conductive Measurement Principles
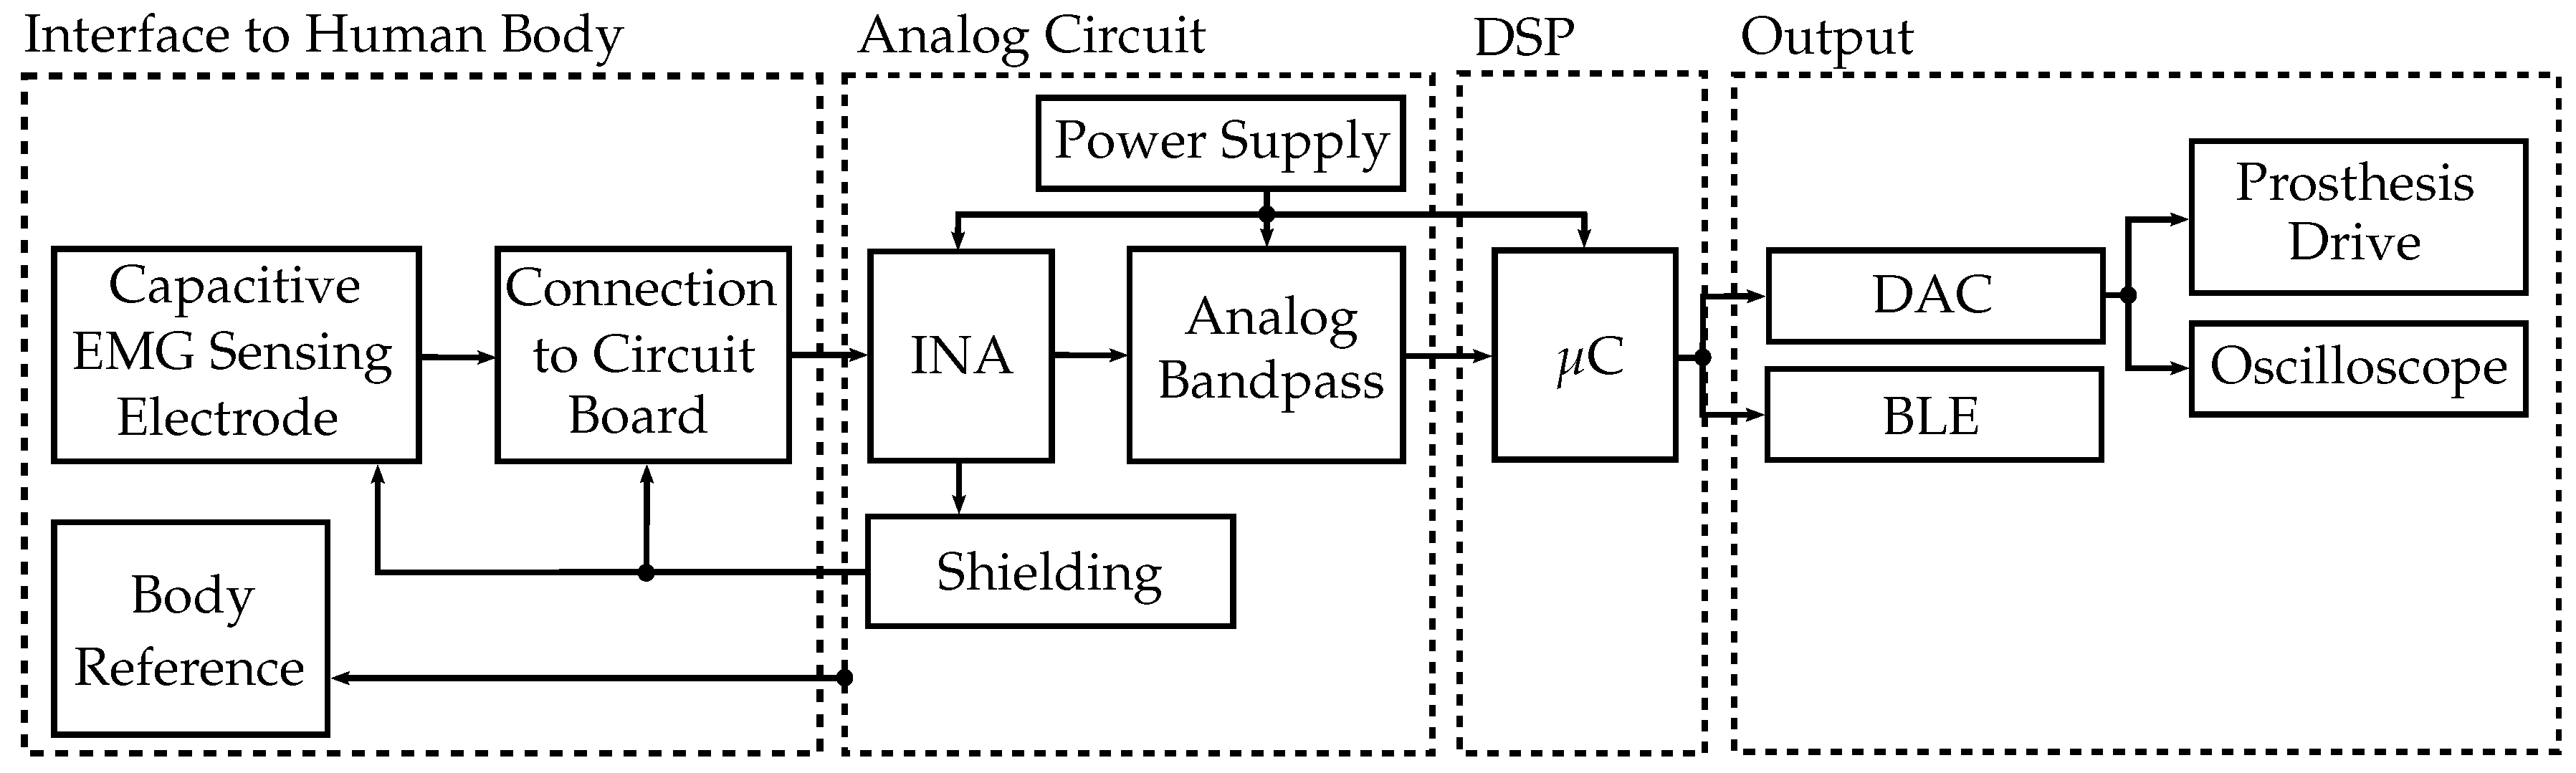
3. Sensor System Description
- stability in real-world environment;
- low power consumption;
- low cost;
- compact size;
- ease of use;
- high wearing comfort;
- real-time capability; and
- high signal-to-noise ratio (SNR).
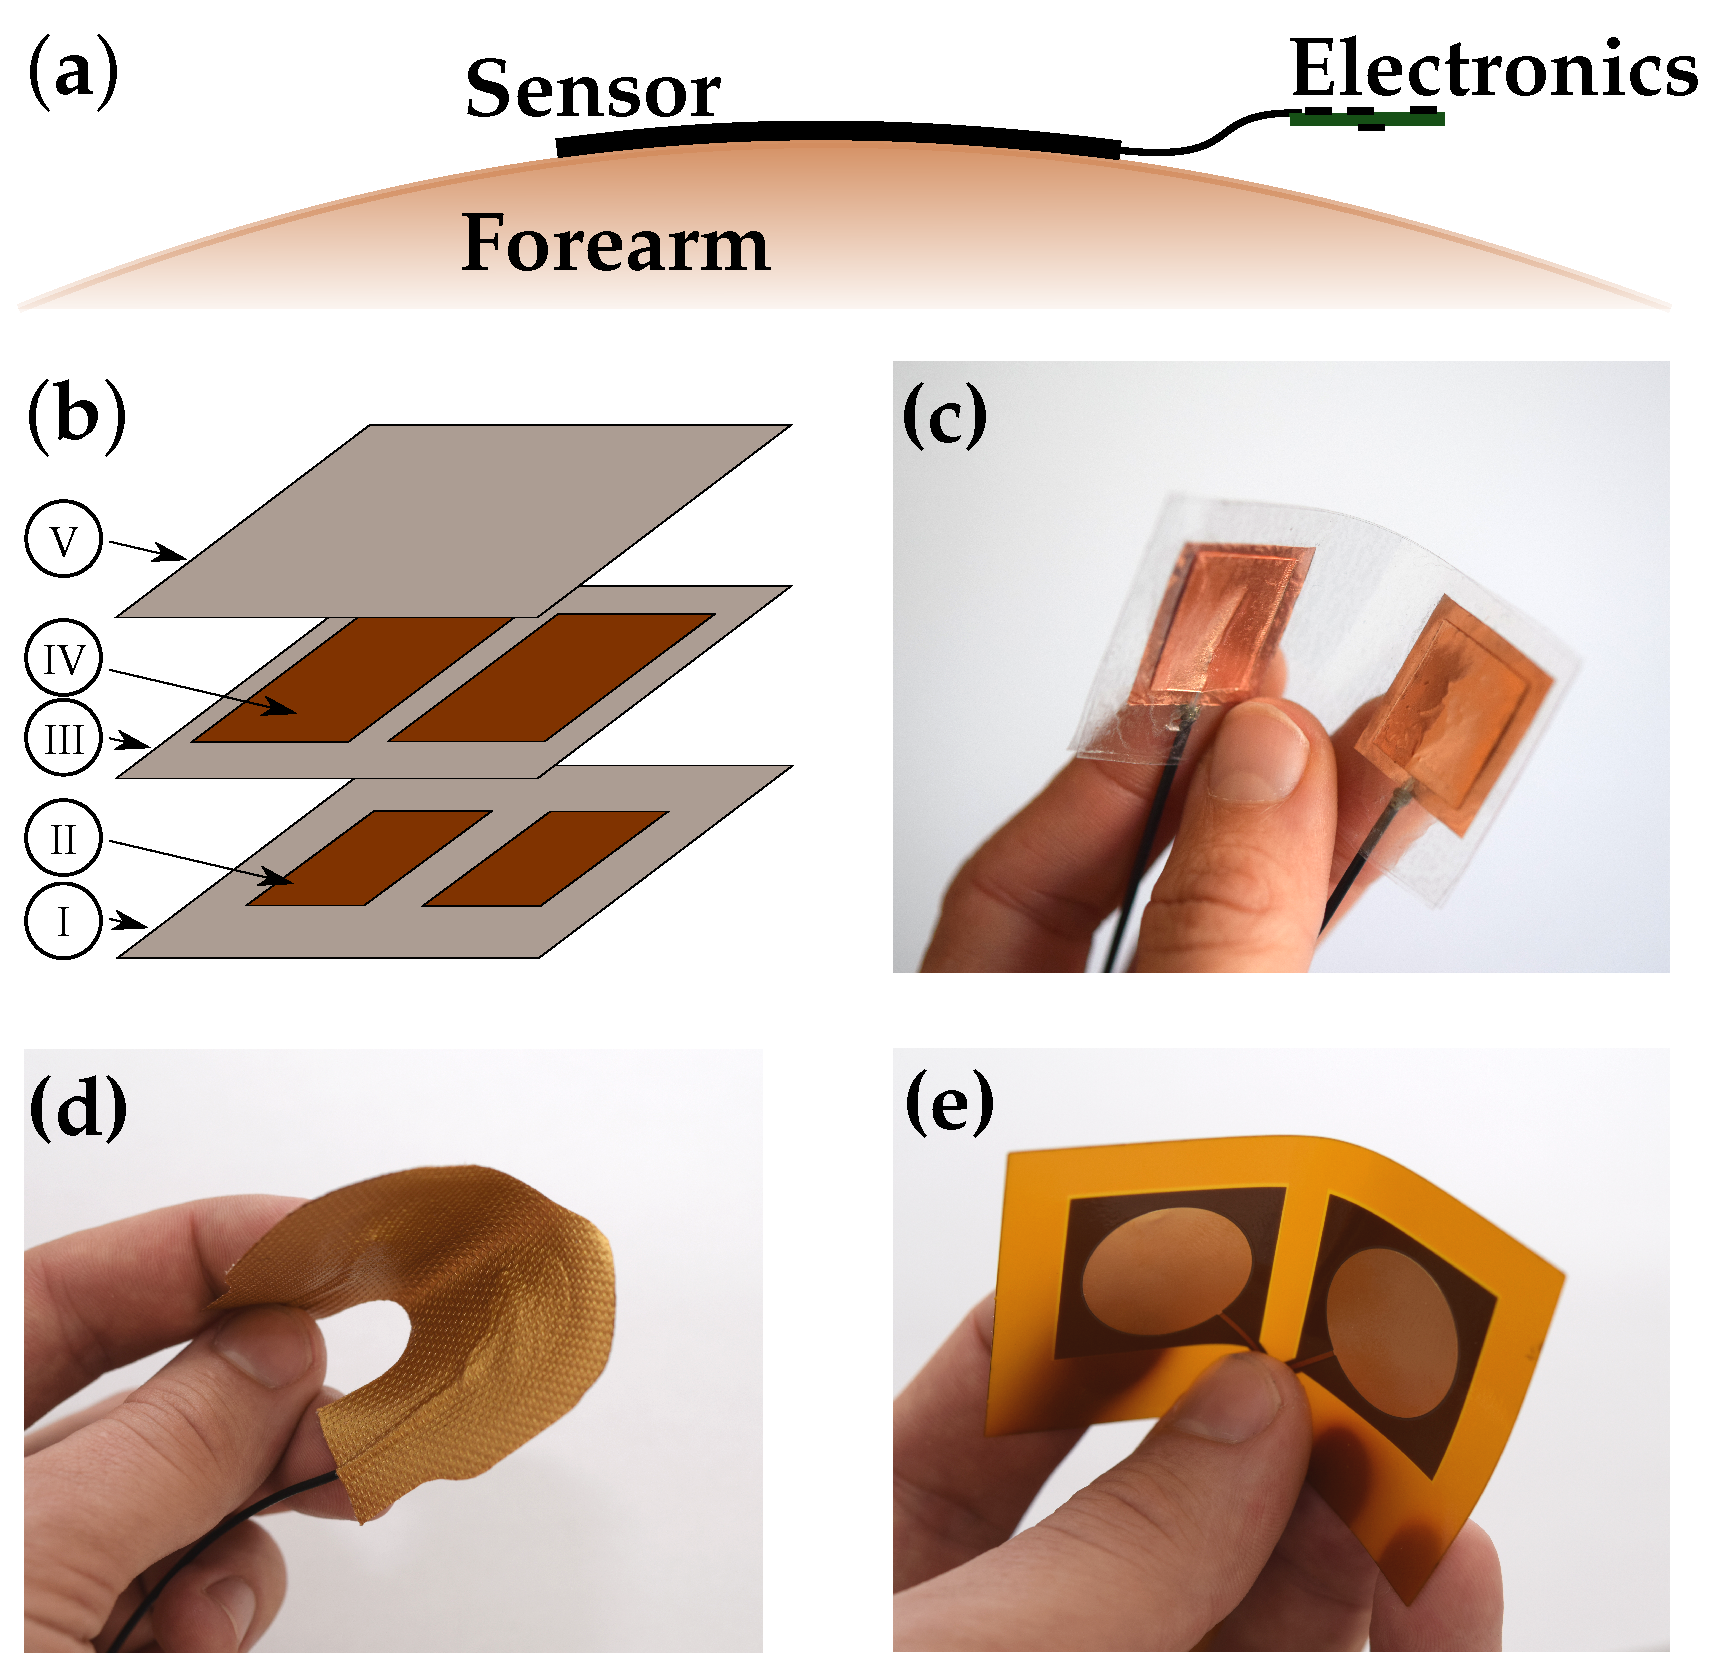
3.1. Interface to Human Body
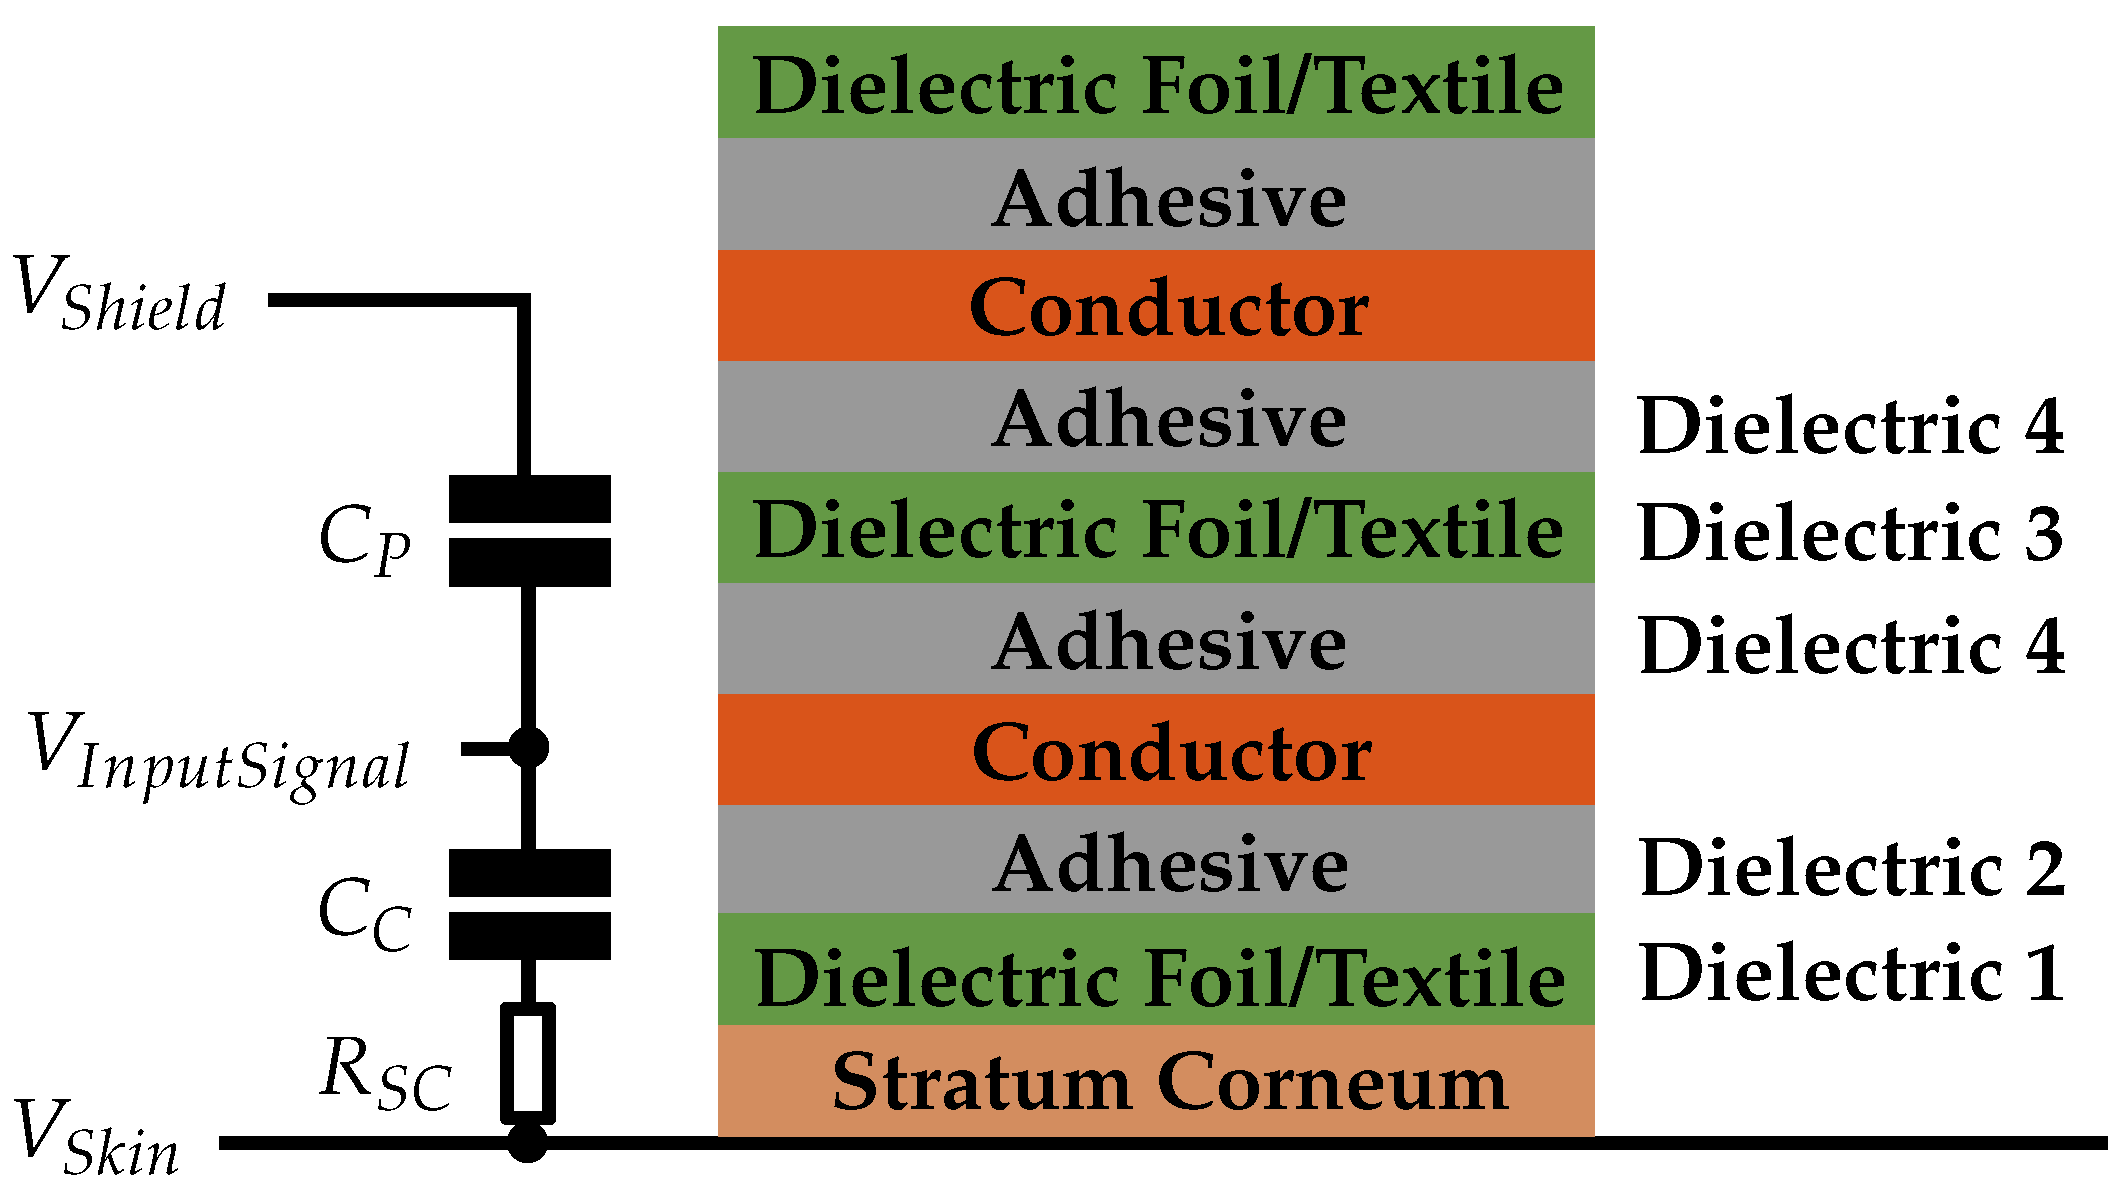
3.1.1. Capacitive EMG Sensing Electrode
3.1.2. Body Reference
3.1.3. Connection to Circuit Board
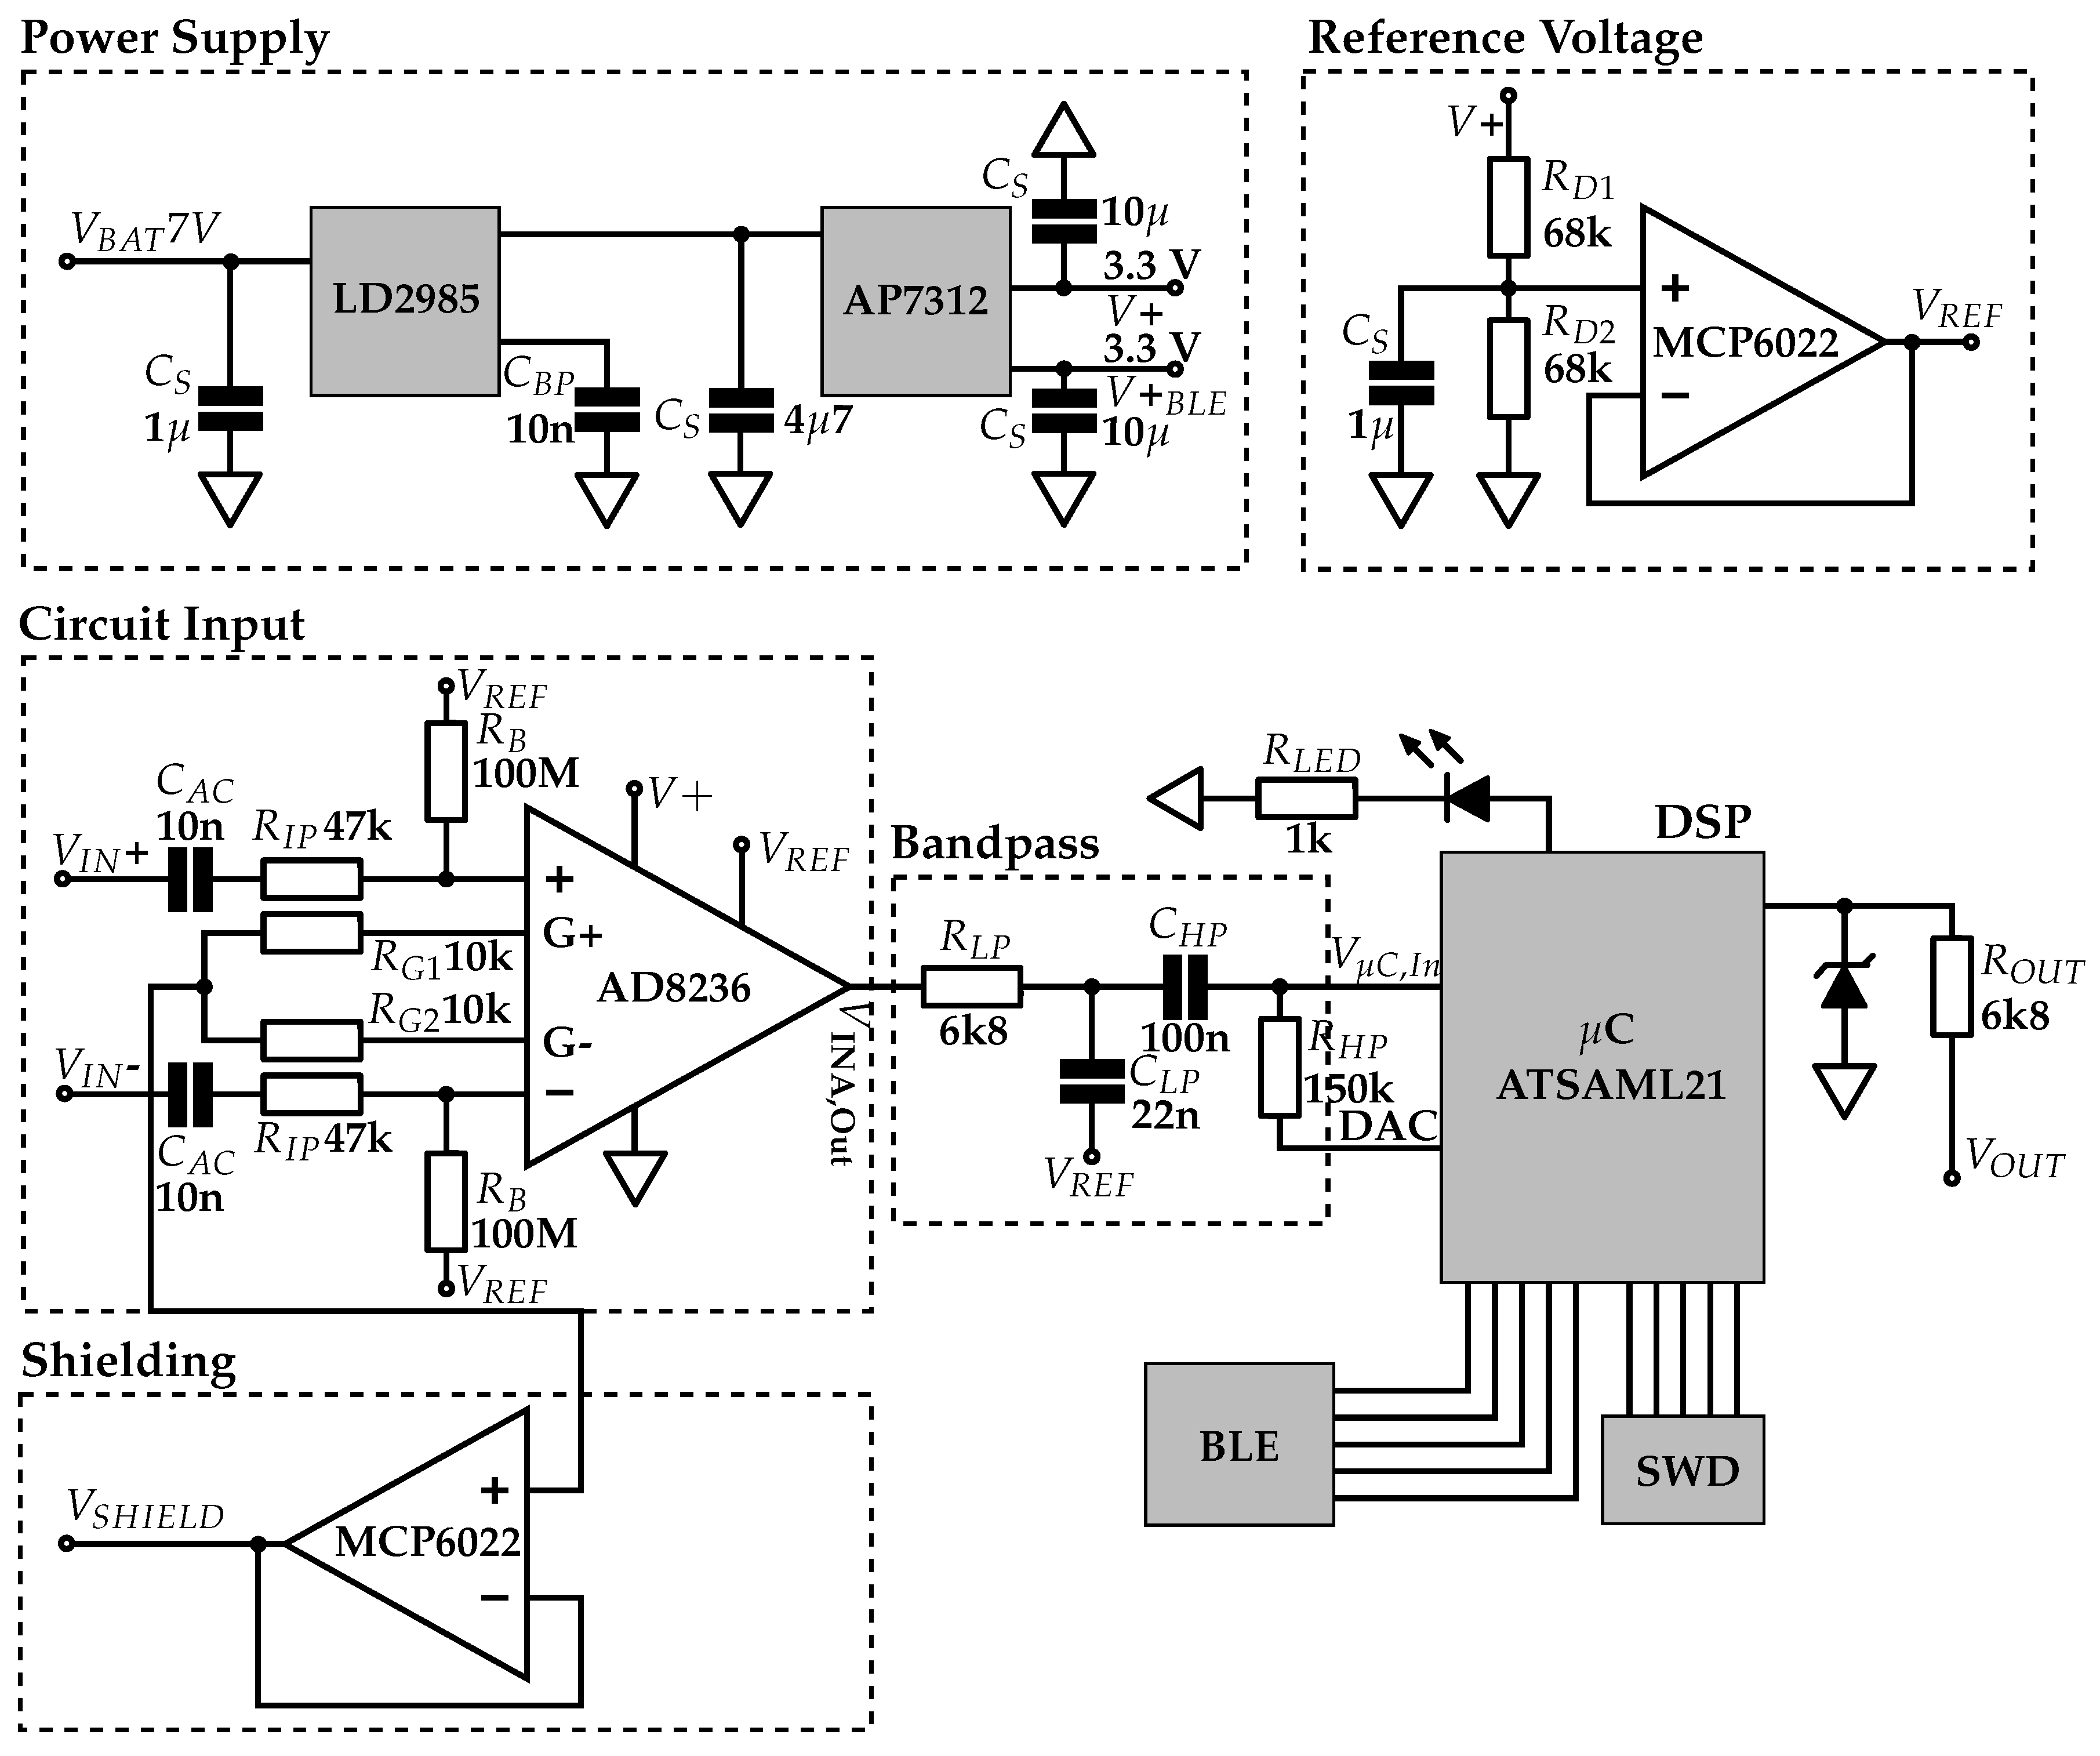
3.2. Analog Circuit
3.2.1. Power Supply
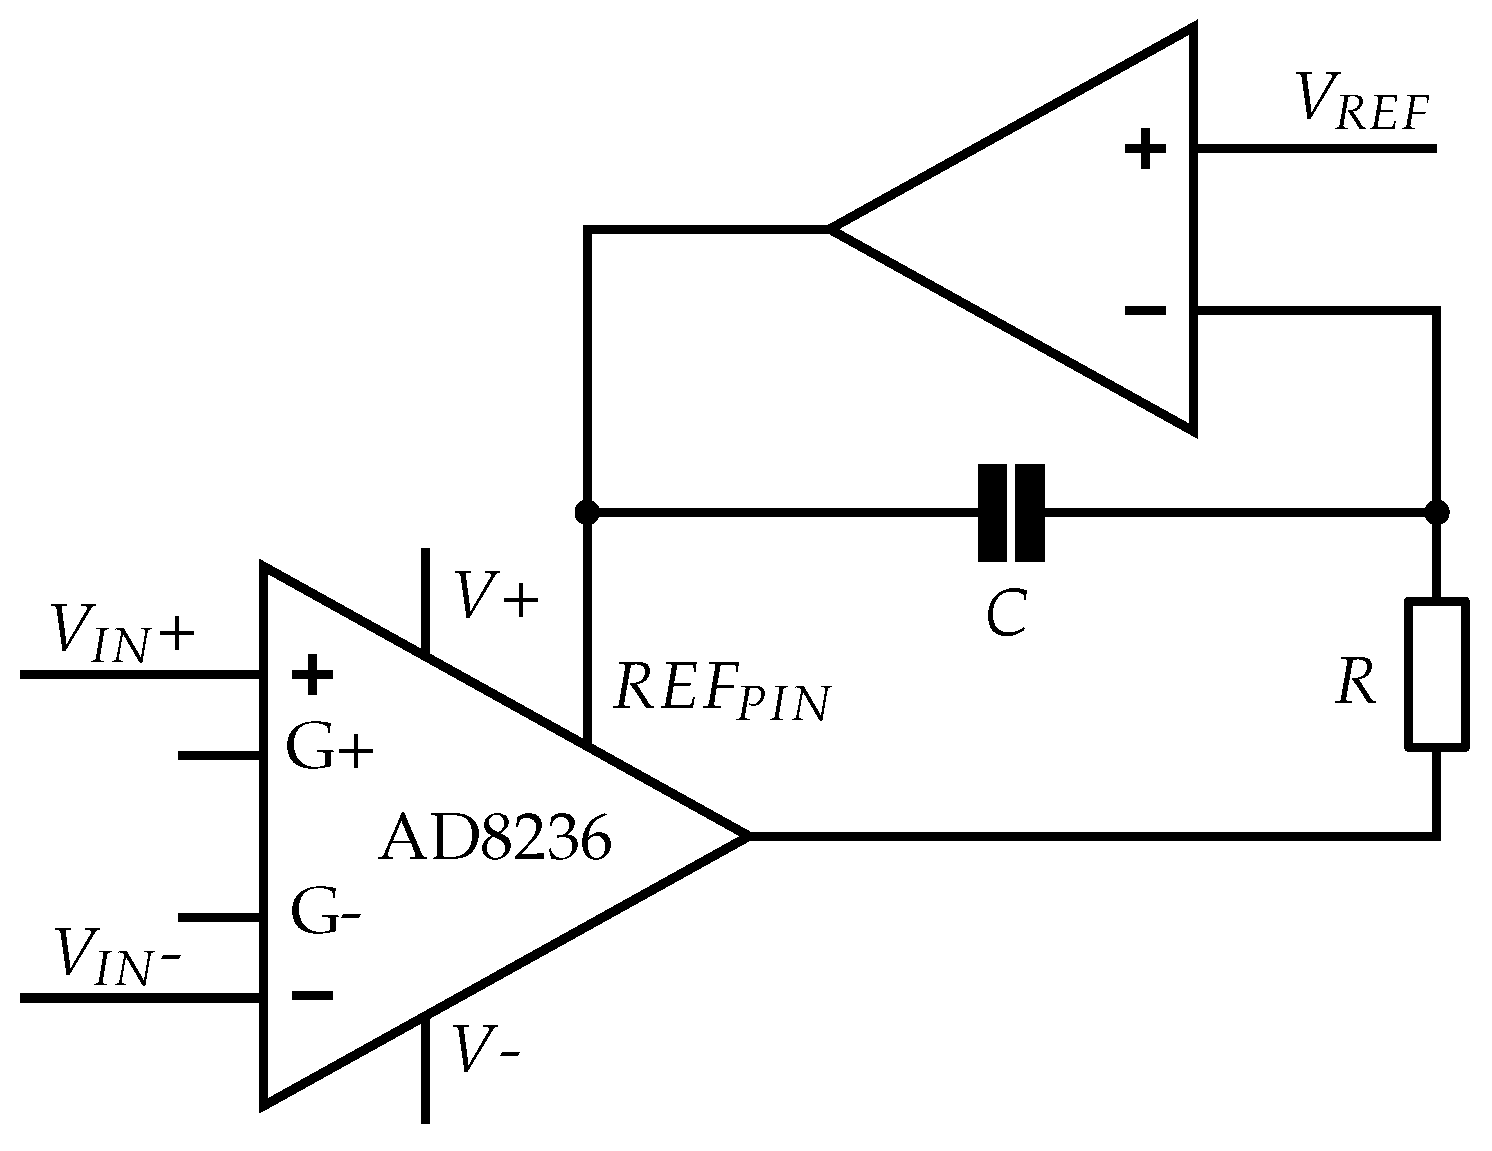
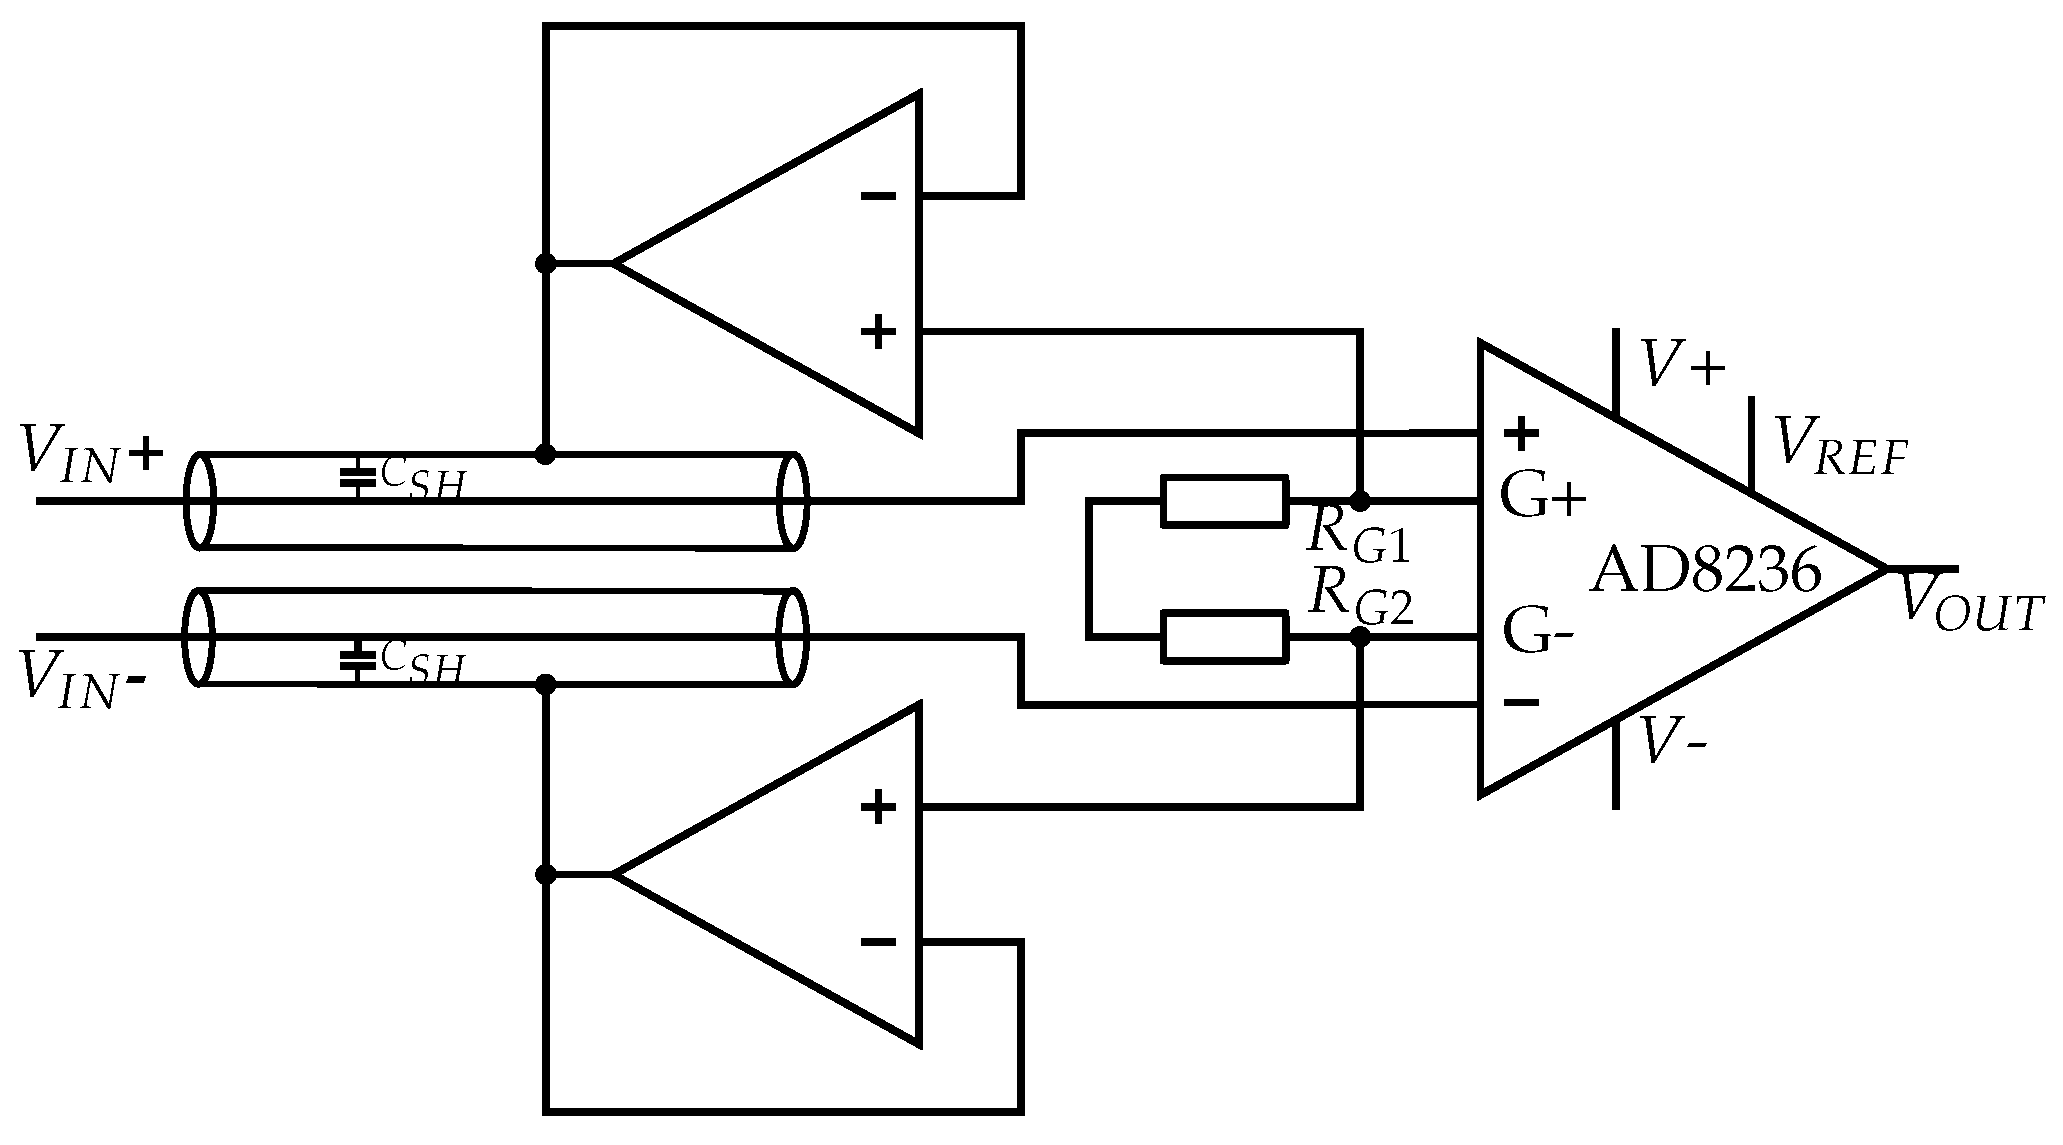
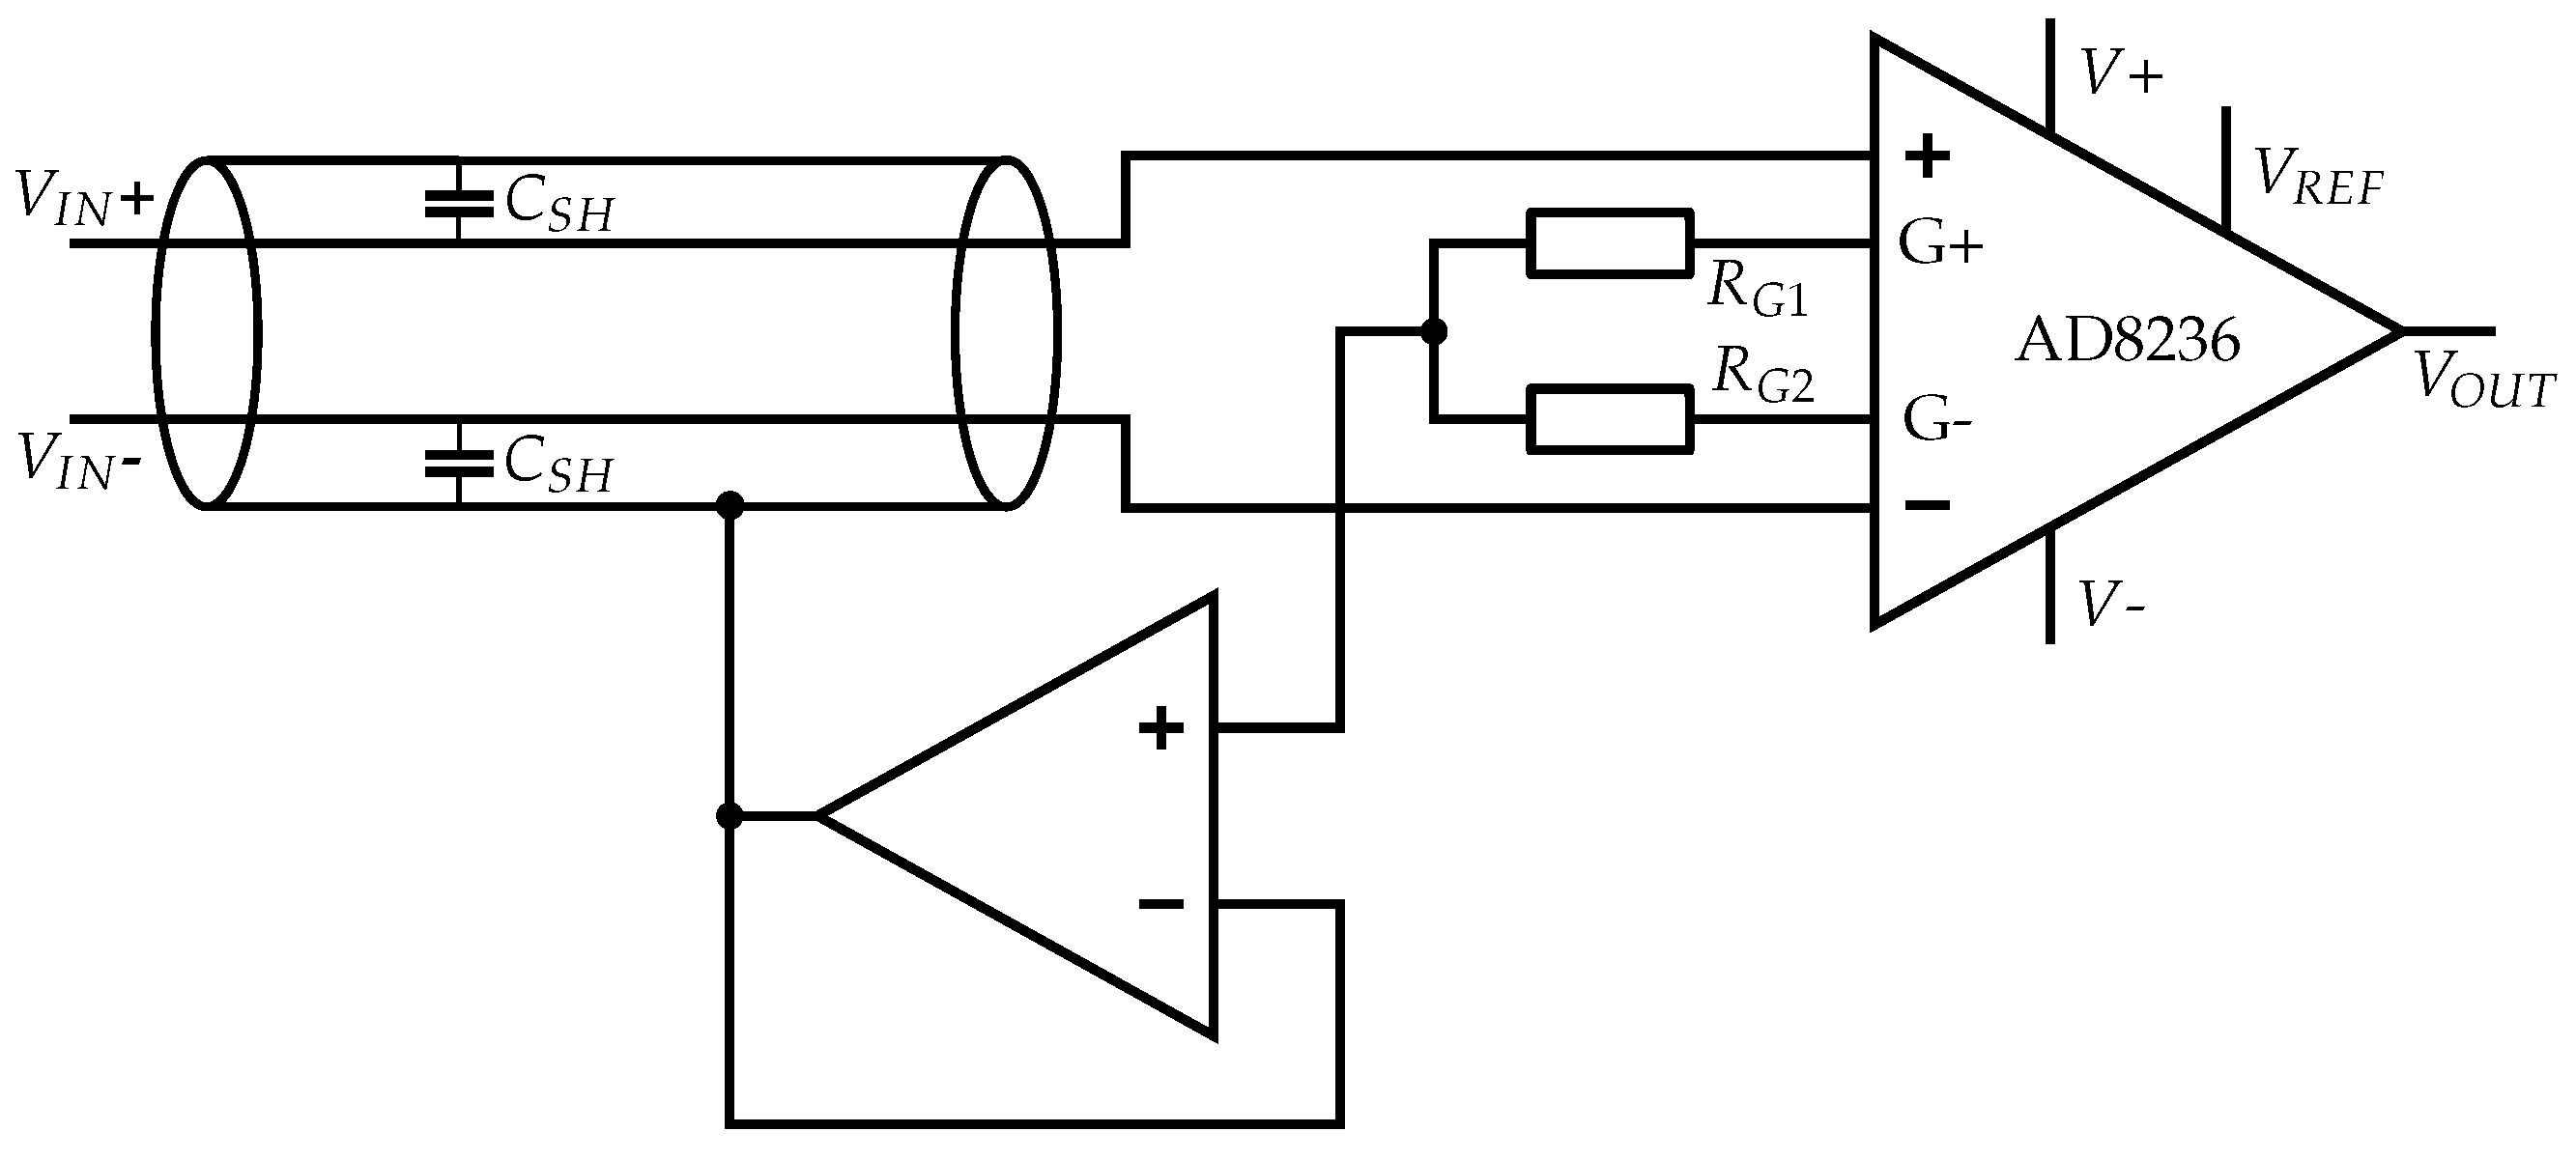
3.2.2. Instrumentation Amplifier (INA)
- low bias current (limits RB);
- pin assignment that enables shielding;
- supply voltage of 3.3 V;
- rail-to-rail input and output;
- high CMRR;
- high PSRR;
- low noise level;
- low power consumption; and
- low cost.
3.2.2.1. Bias Resistor
3.2.2.2. Reference Potential
3.2.2.3. Alternative Reference Design: INA with DC Rejection Reference Design
3.2.3. Shielding/Guarding
Active Shielding
Common-Mode Shielding
3.2.4. Analog Bandpass
3.2.5. Digital Signal Processing (DSP)
Microcontroller Input
Digital Filtering
3.2.6. Alternative Approaches
Bootstrapping and Neutralization
Driven-Right-Leg
4. Theoretical Analysis of the Measurement System
4.1. Input Signal
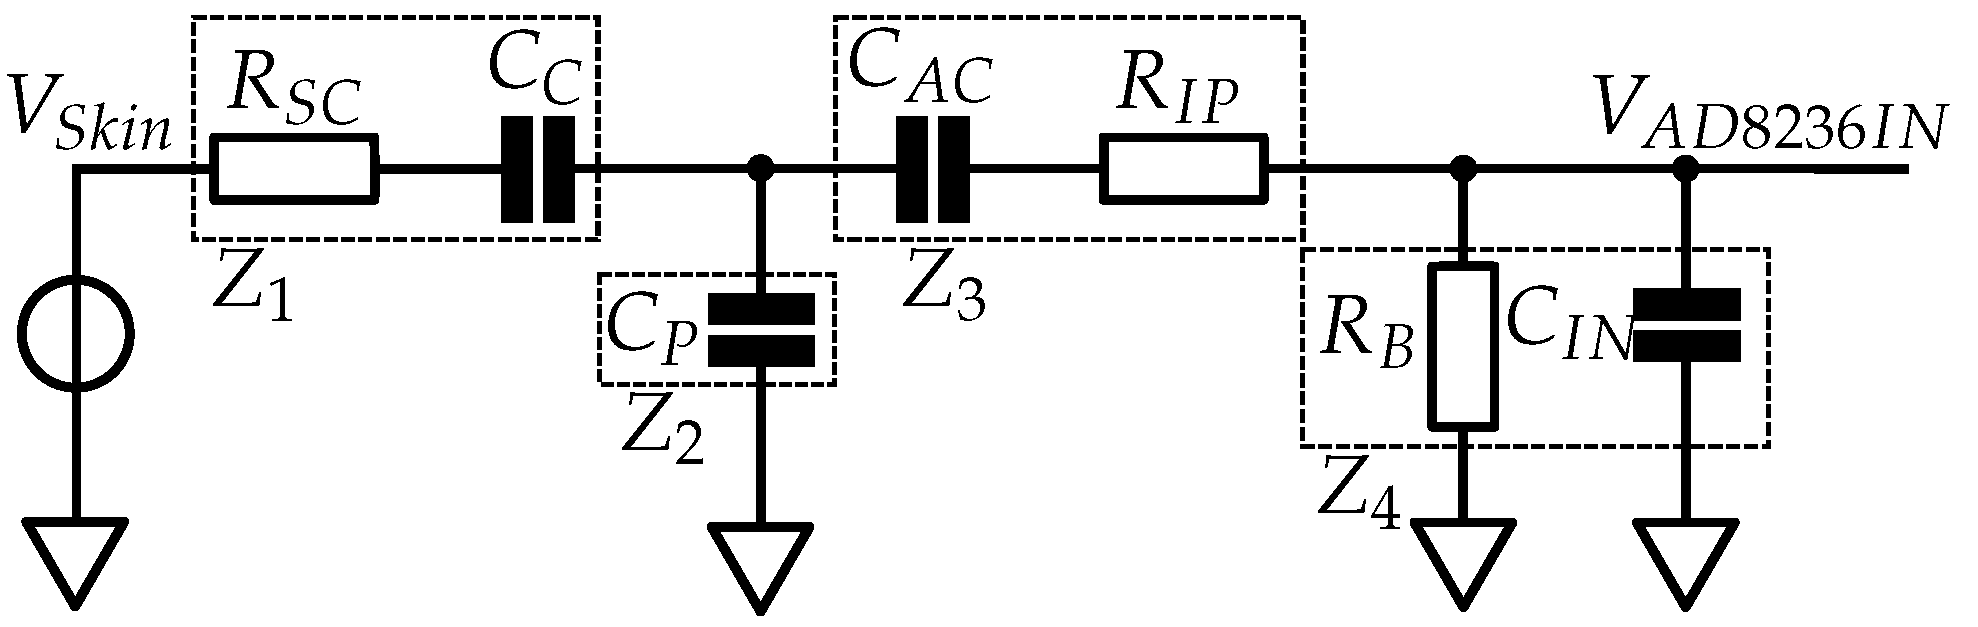
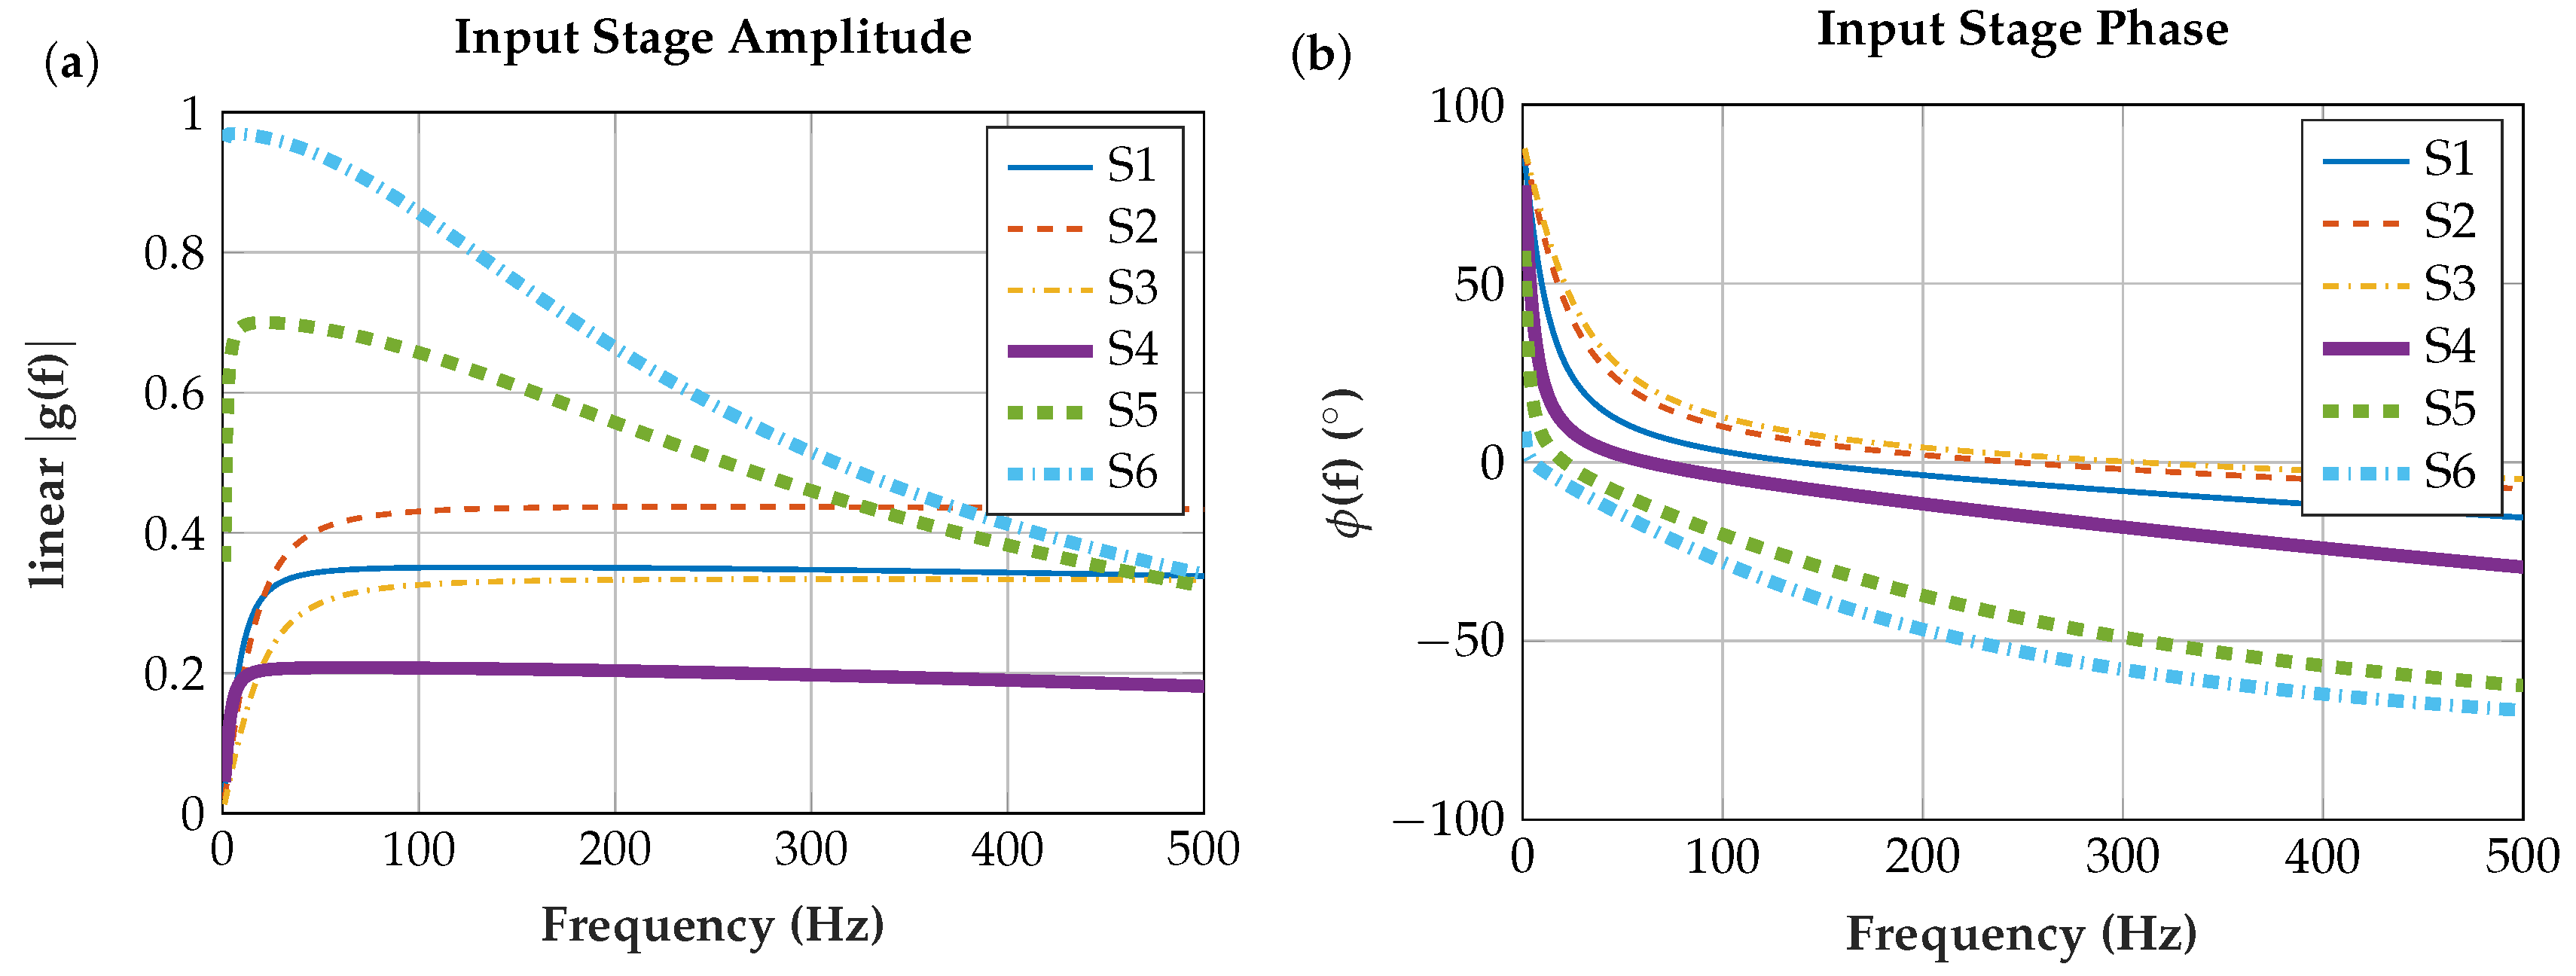
4.2. Input Stage
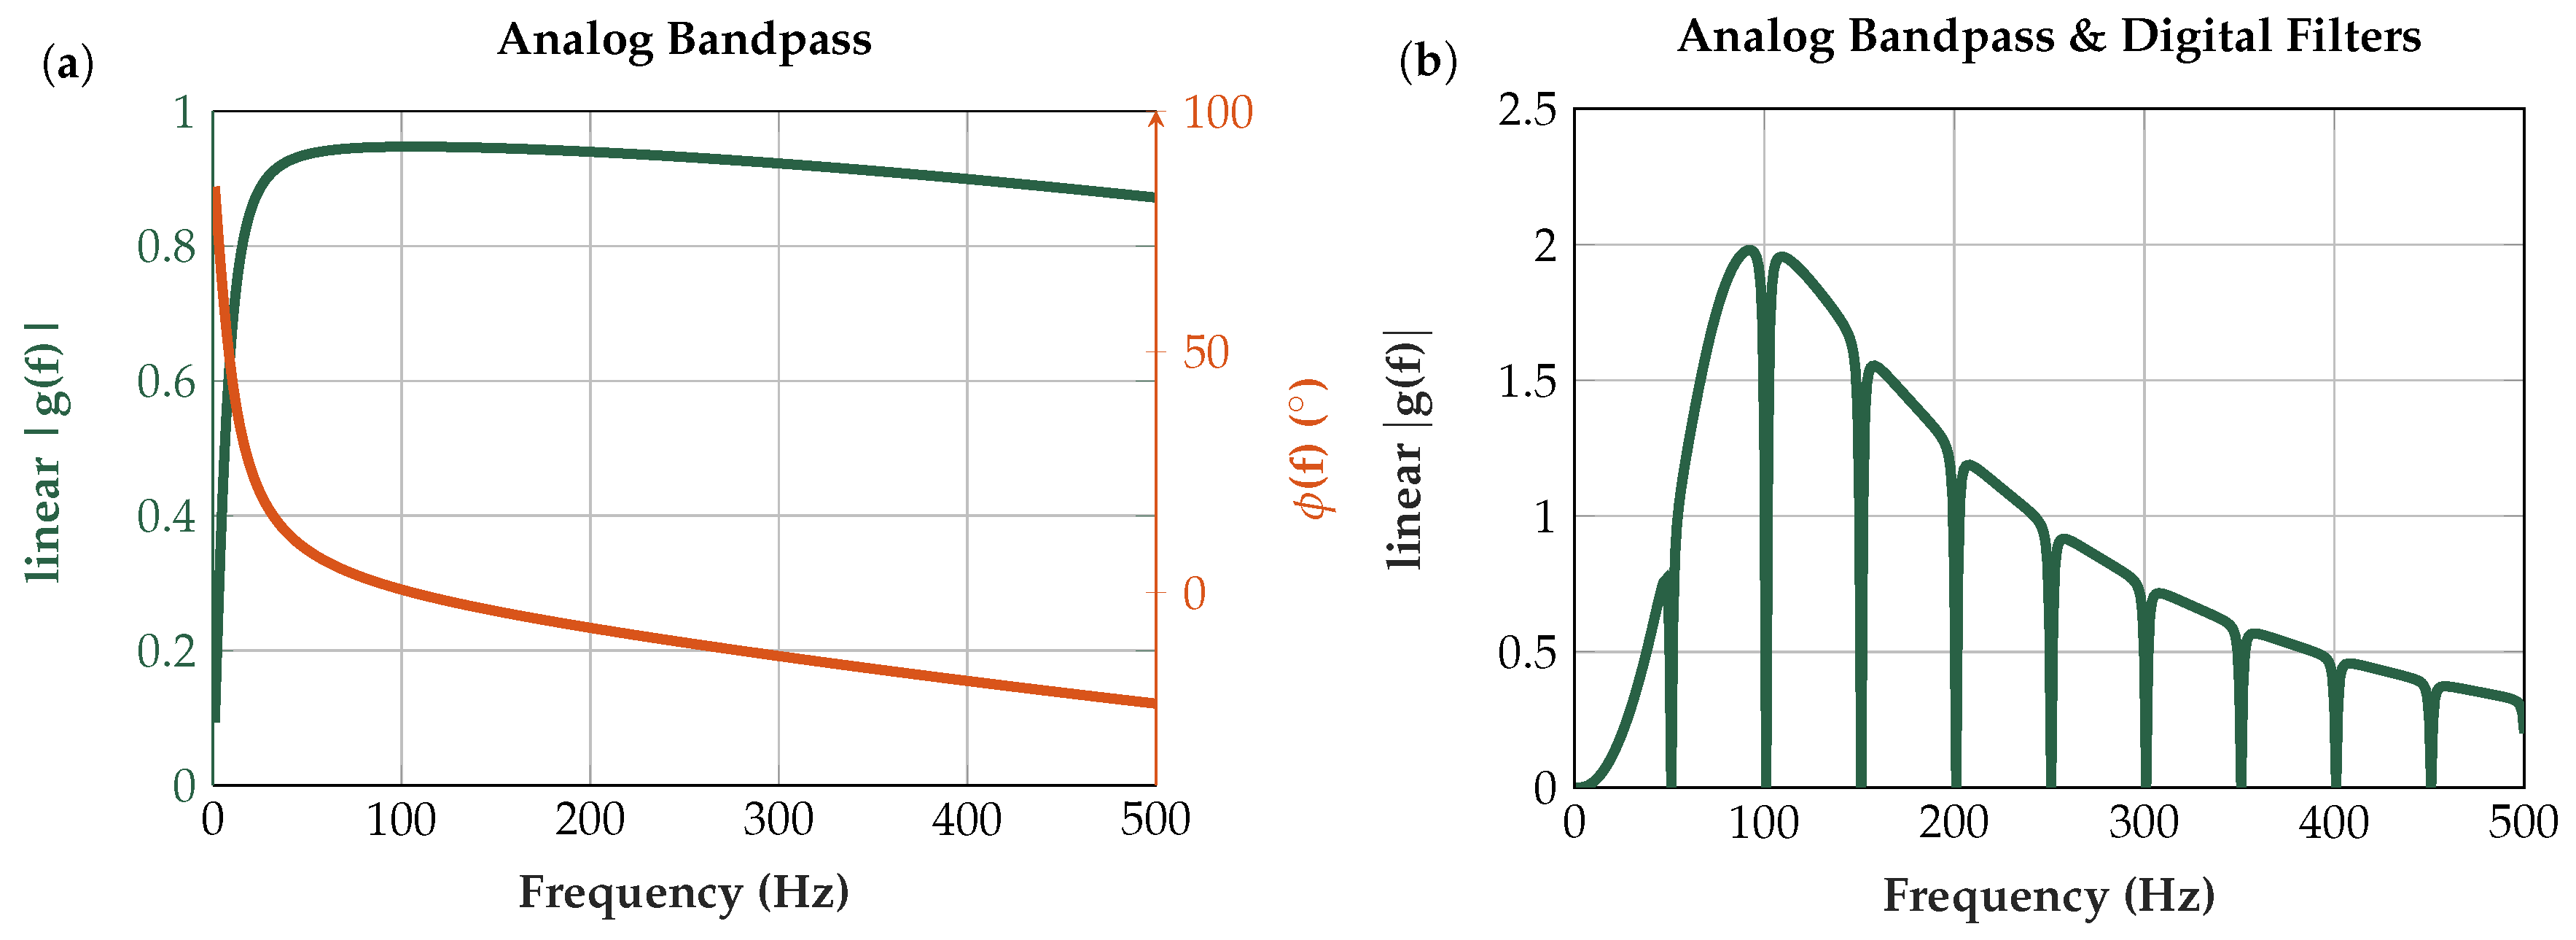
4.3. Analog Bandpass and Digital Signal Processing
4.3.1. Signal Delay
5. Experimental
- 26 at the INA;
- 8 at the C internal OpAmps;
- 16 at the ADC (accumulation of 64 samples and division by 4);
- 0.75 at the digital comb filter; and
- 0.25 at the DAC (right-shift by two to be within the 12-bit value range of the DAC).
5.1. Normalization
5.2. Comparison of Sensor Assemblies
5.2.1. Measurement Procedure
5.2.2. Data Evaluation
5.2.3. Fatigue Evaluation
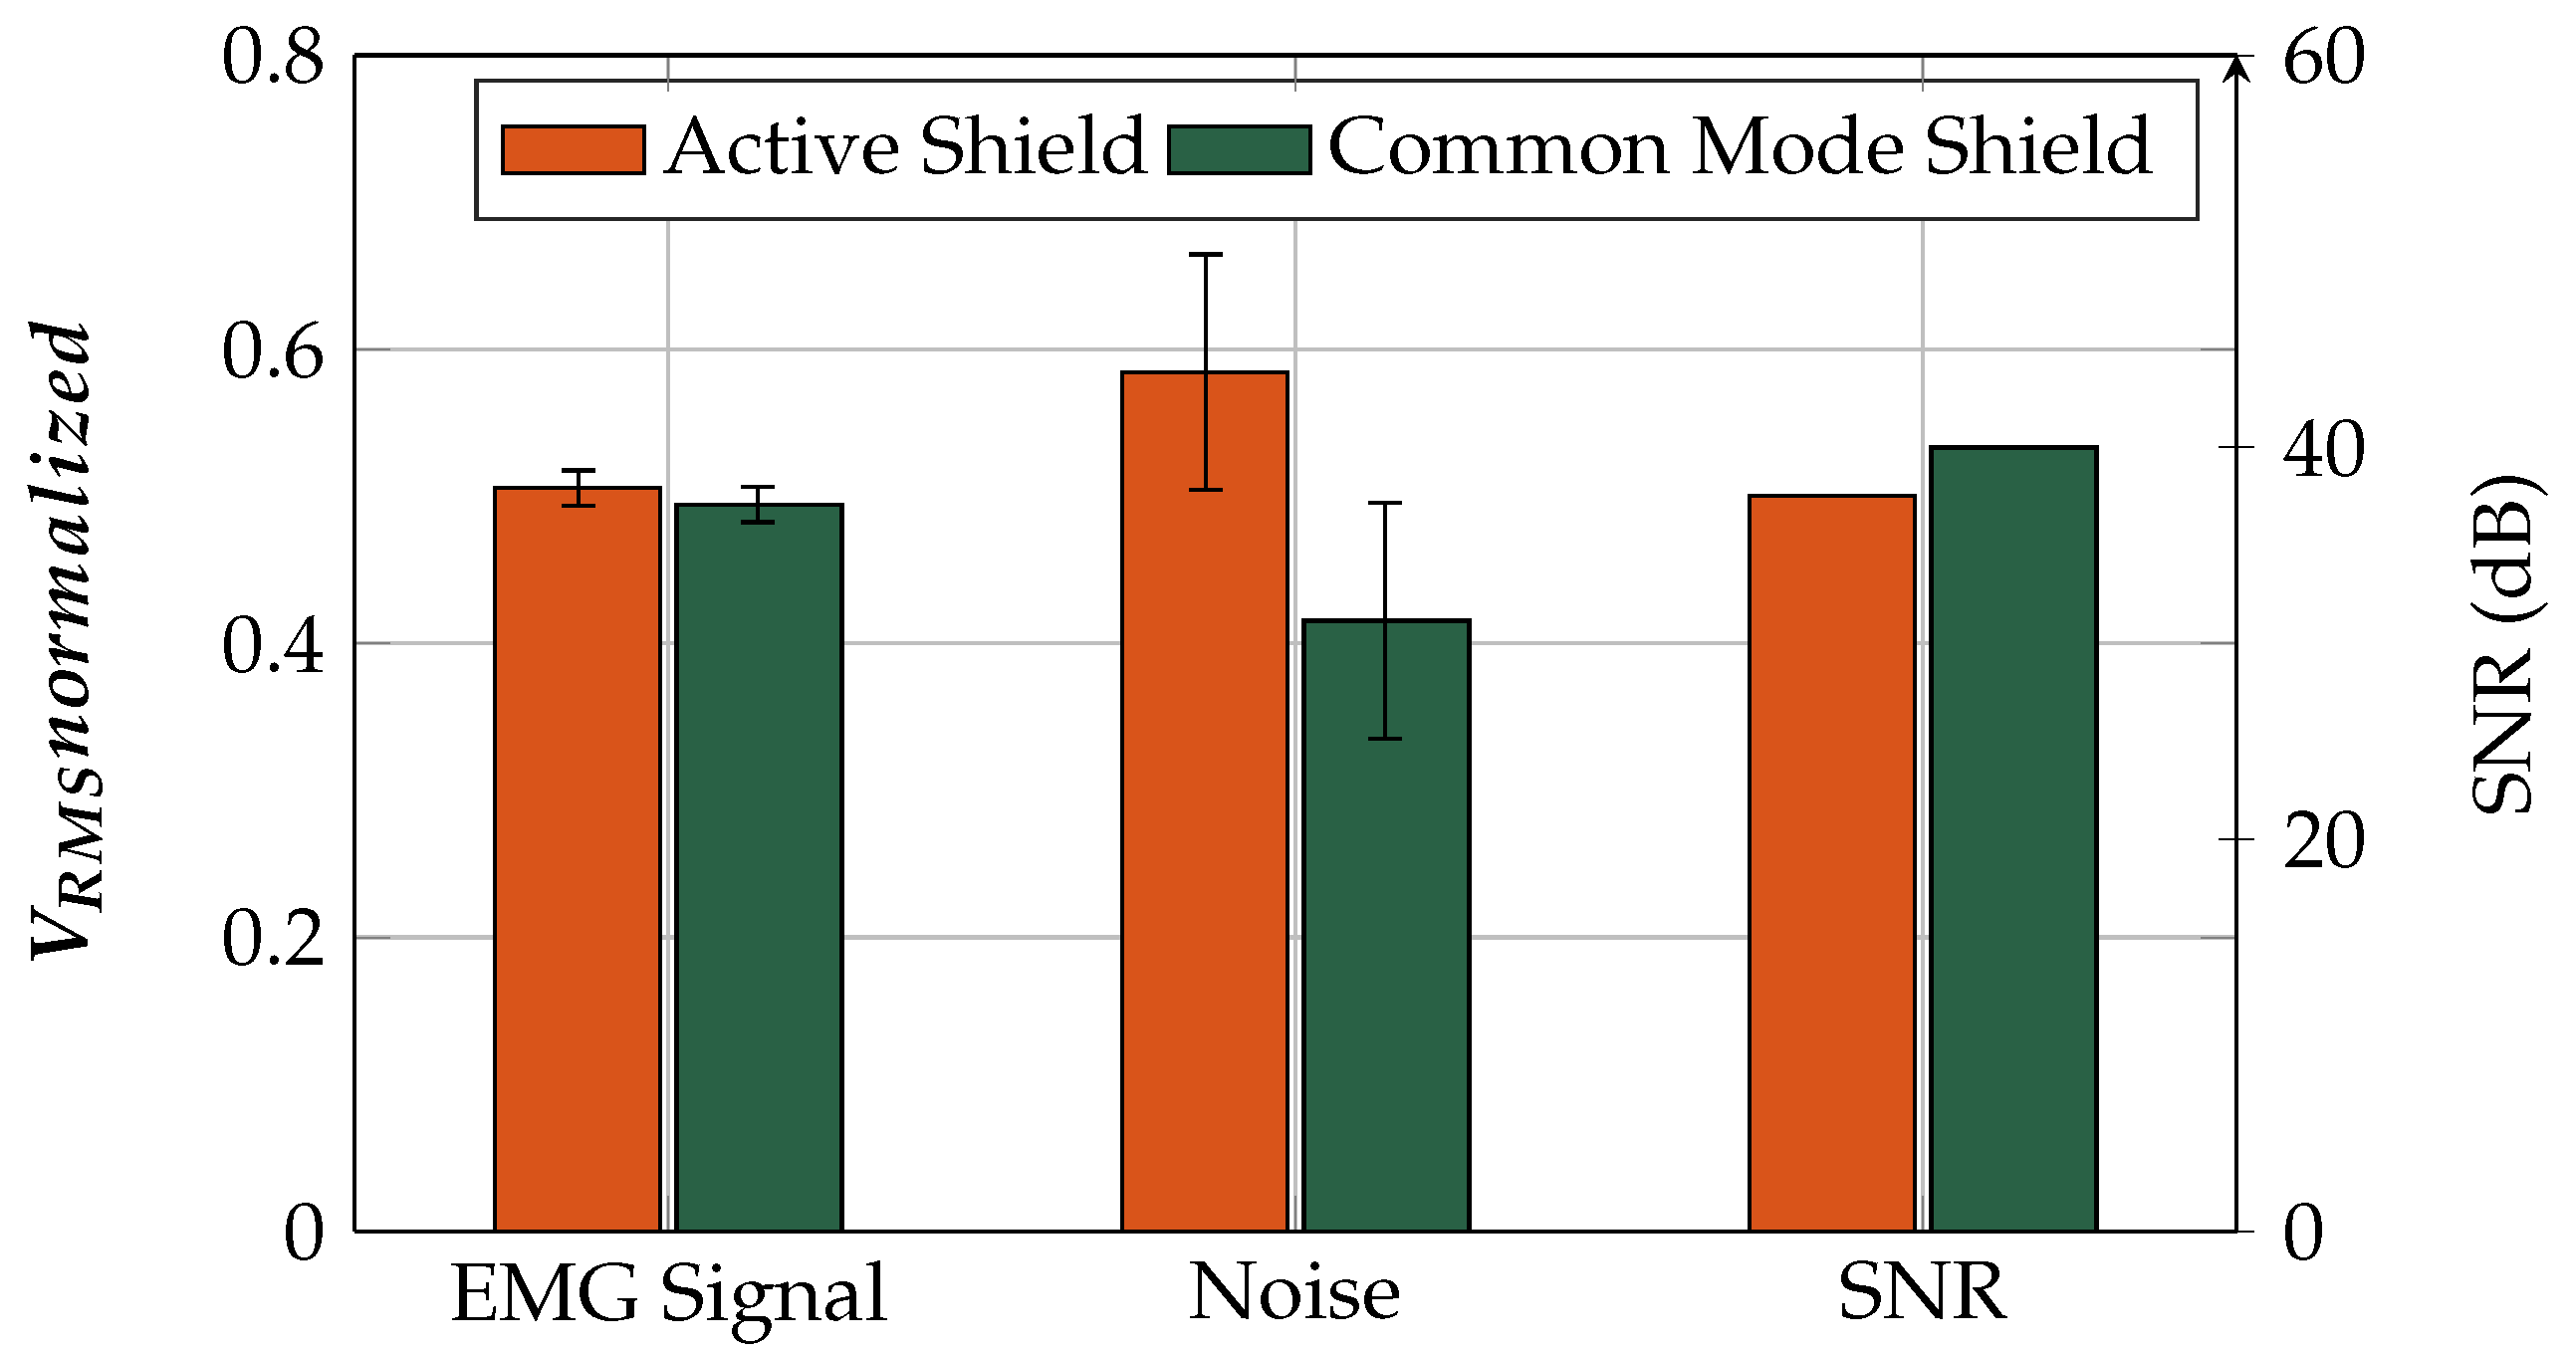
5.3. Shielding (Active Shield and Common-Mode Shield)
5.3.1. Shielding Measurement Procedure
5.3.2. Shielding-Data Evaluation
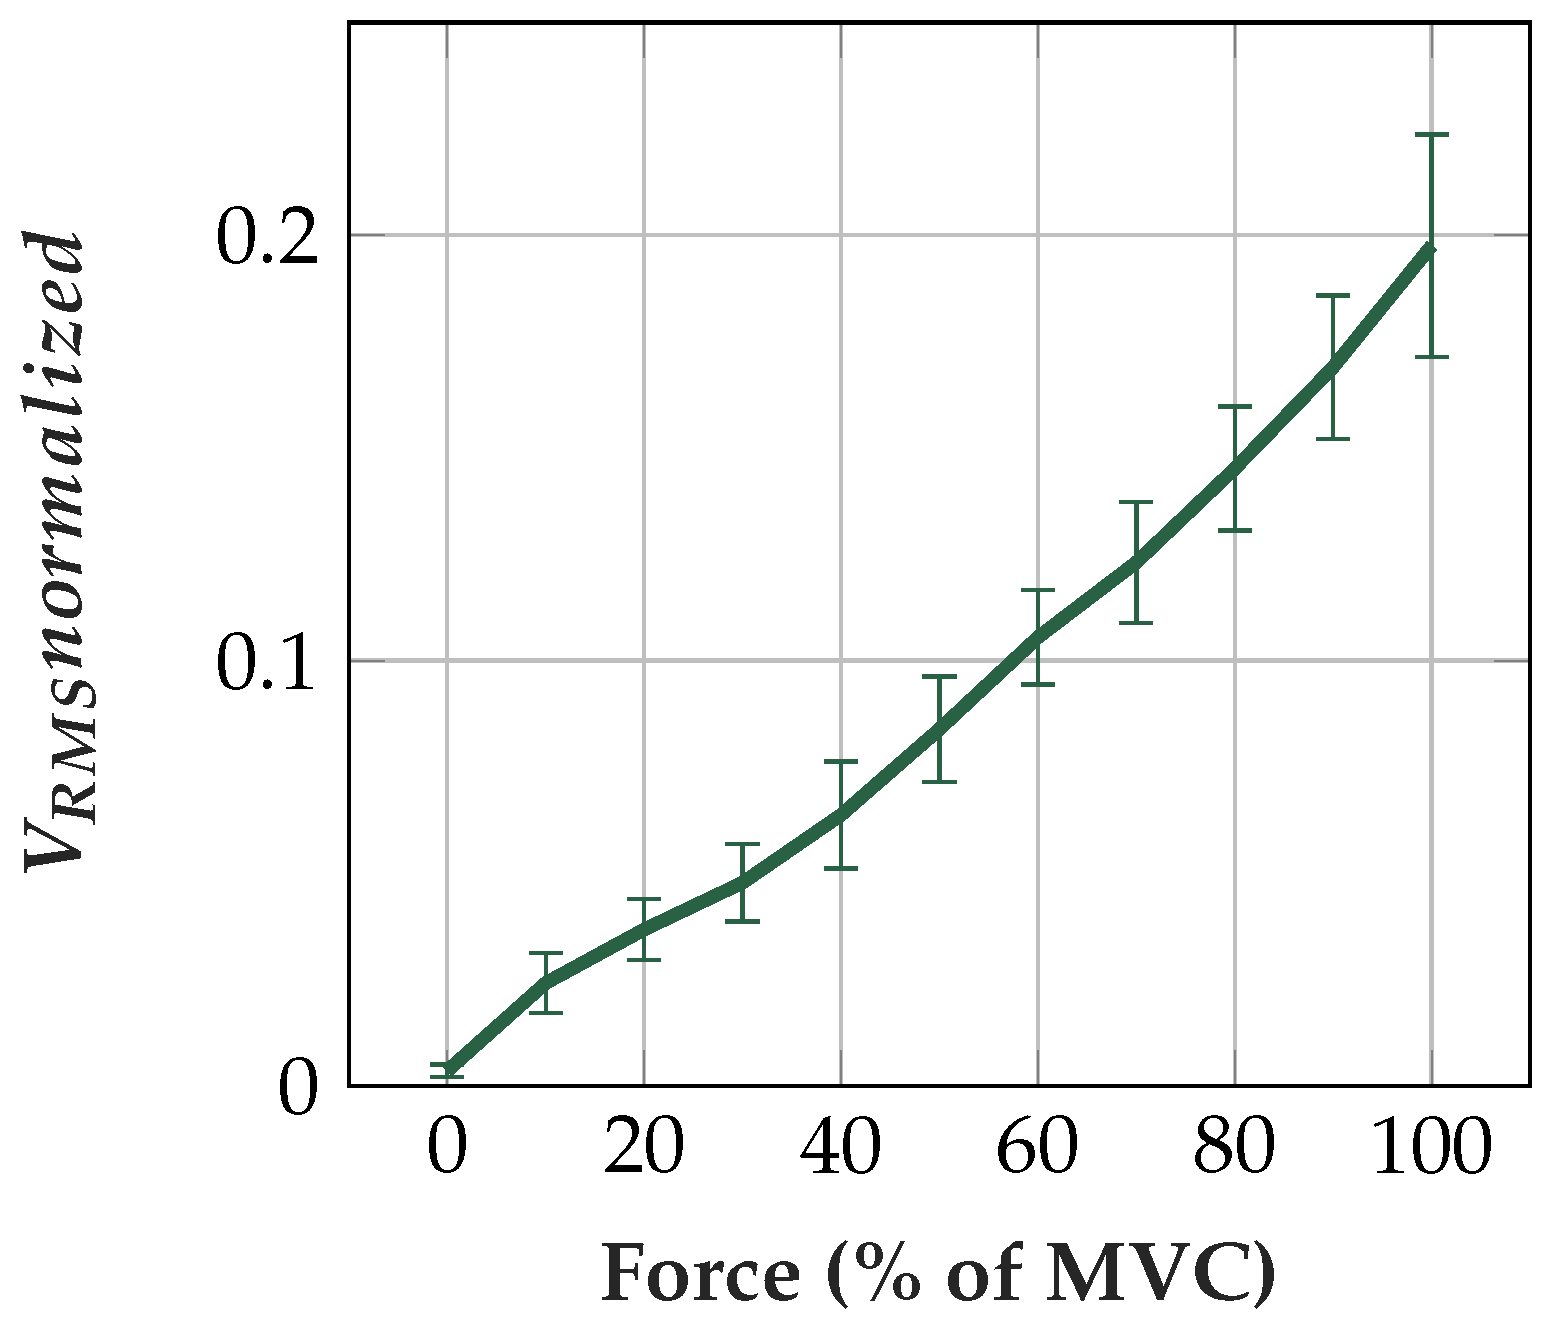
5.4. Proportionality to Force Level
5.5. Wearing Comfort
6. Results
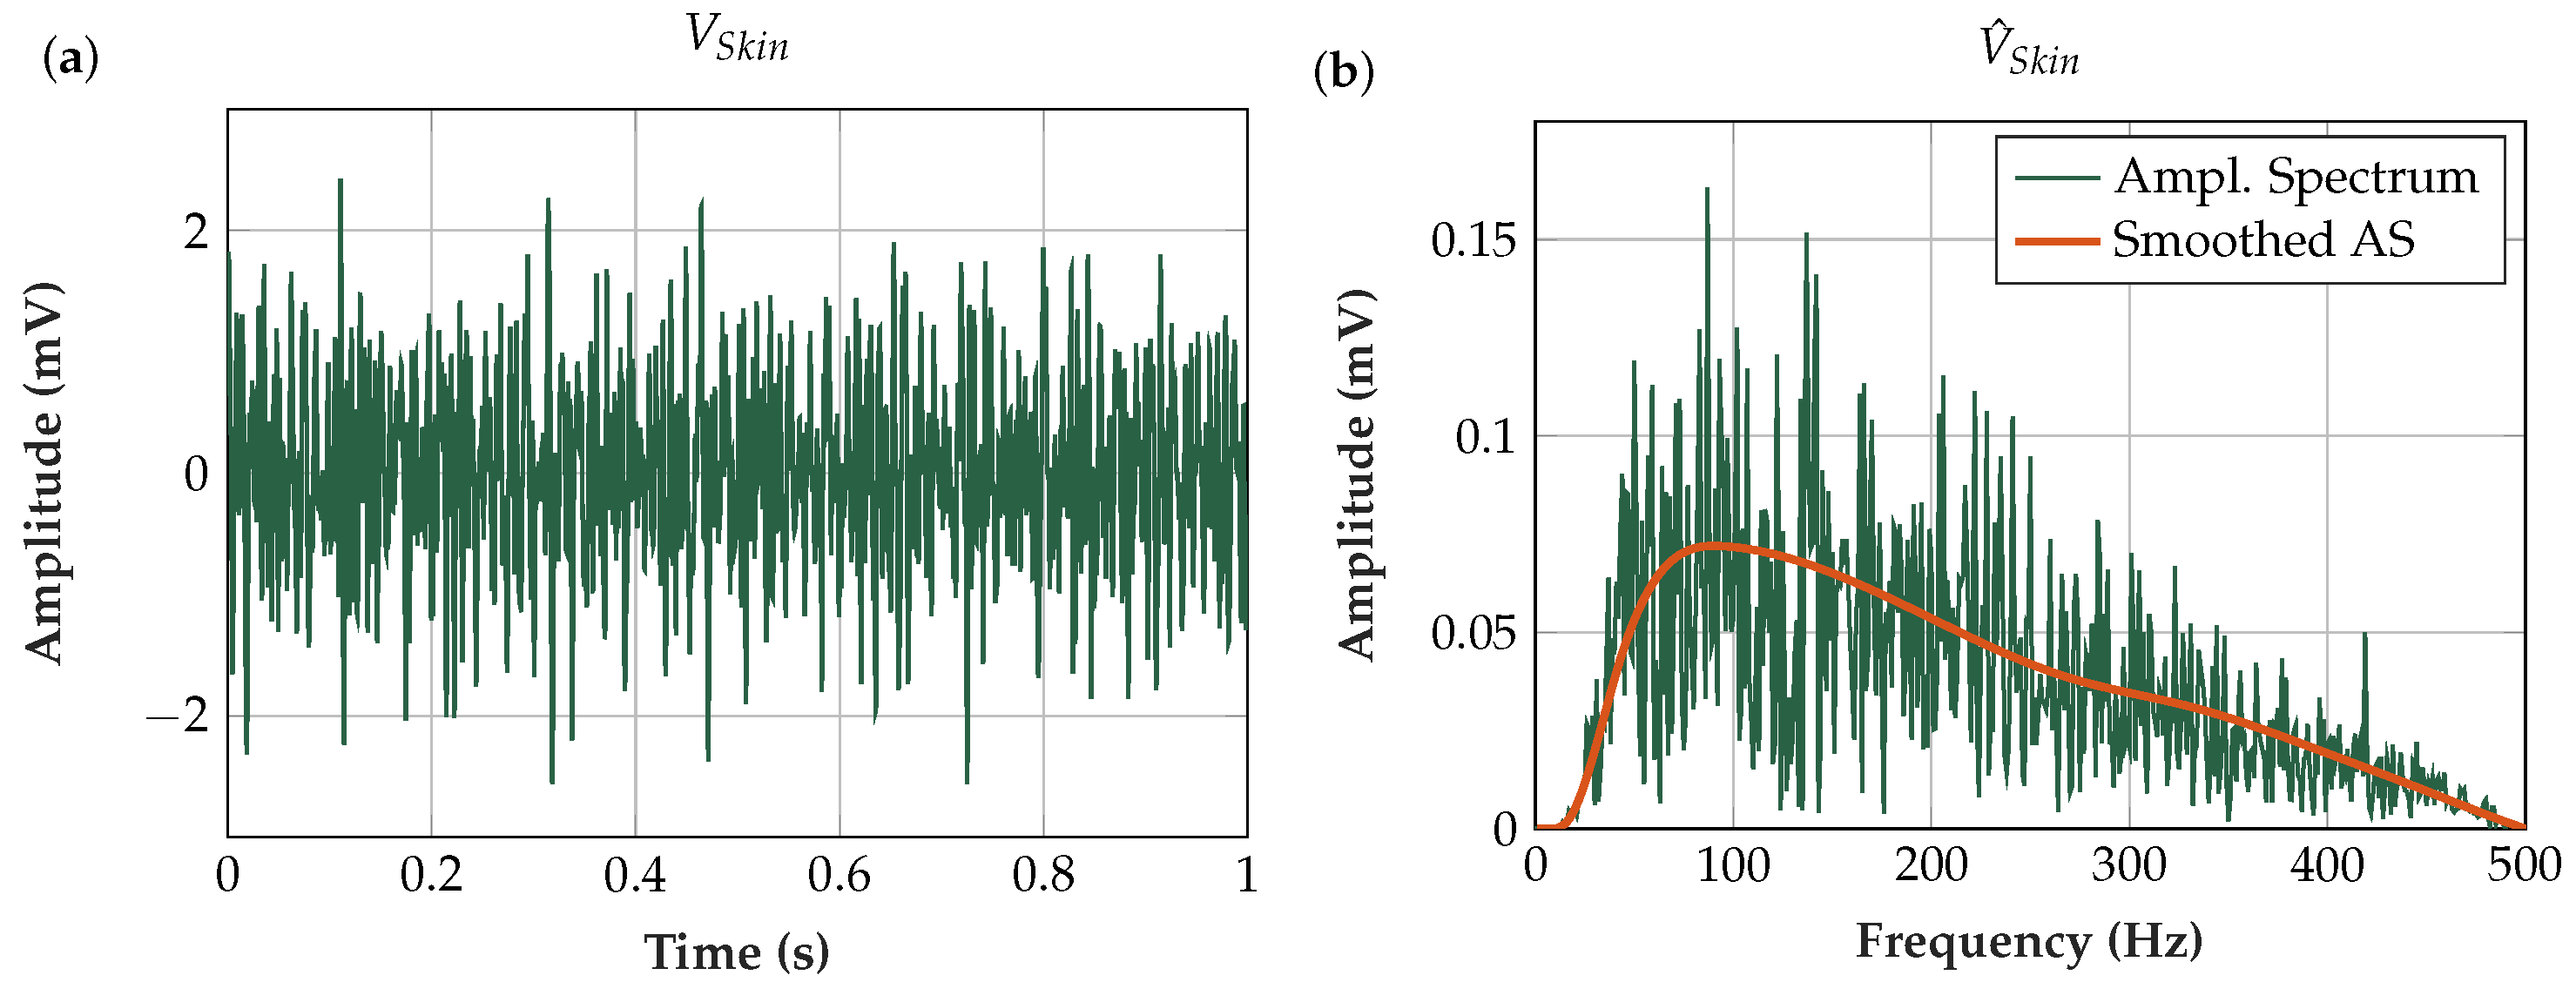
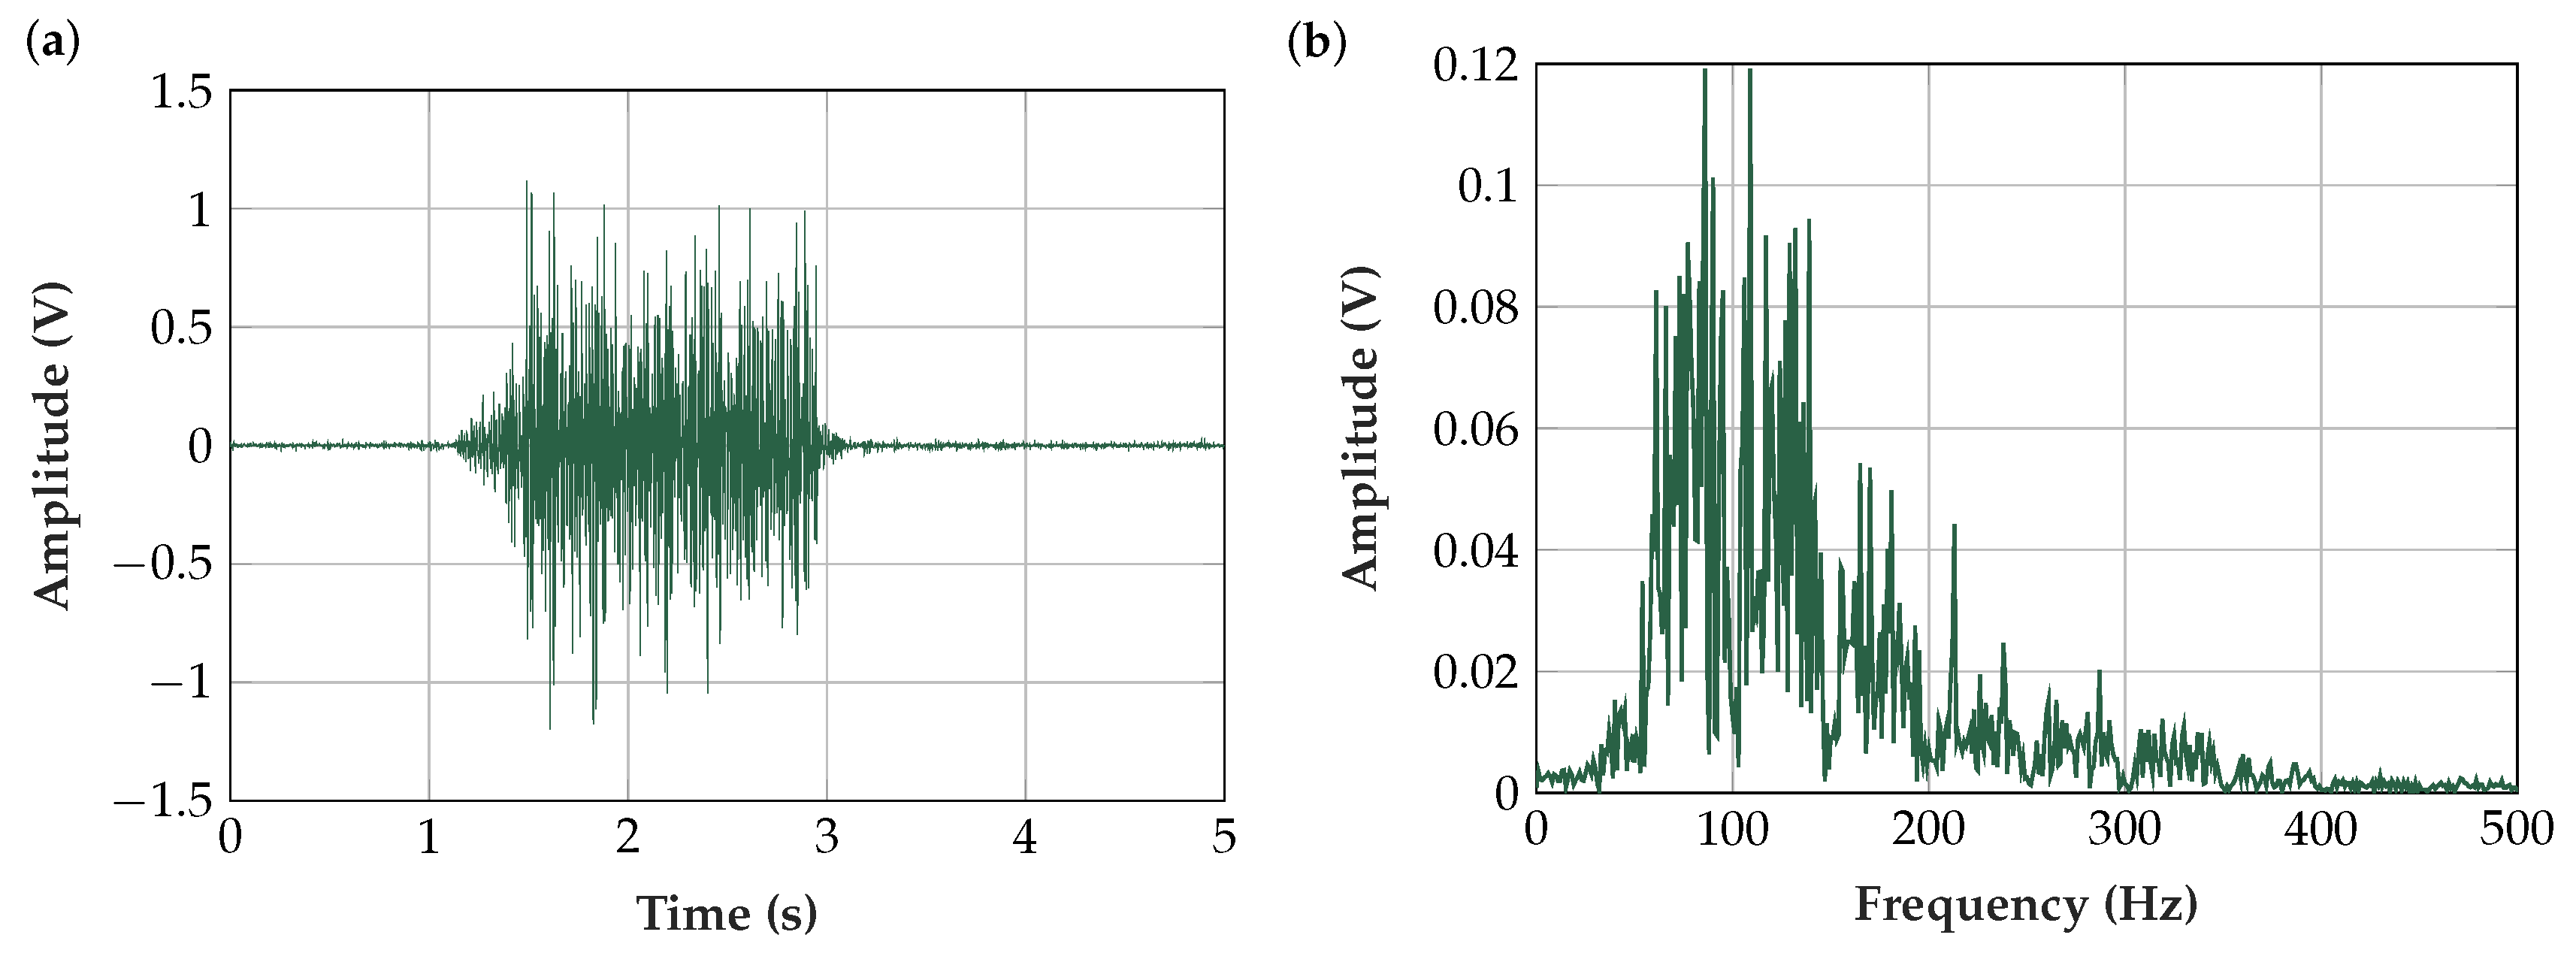
6.1. Measured EMG Signal in the Time- and Frequency-Domains
6.2. Theoretical Analysis of the Measurement System
6.2.1. Input Stage
6.2.2. Analog Bandpass and Digital Signal Processing
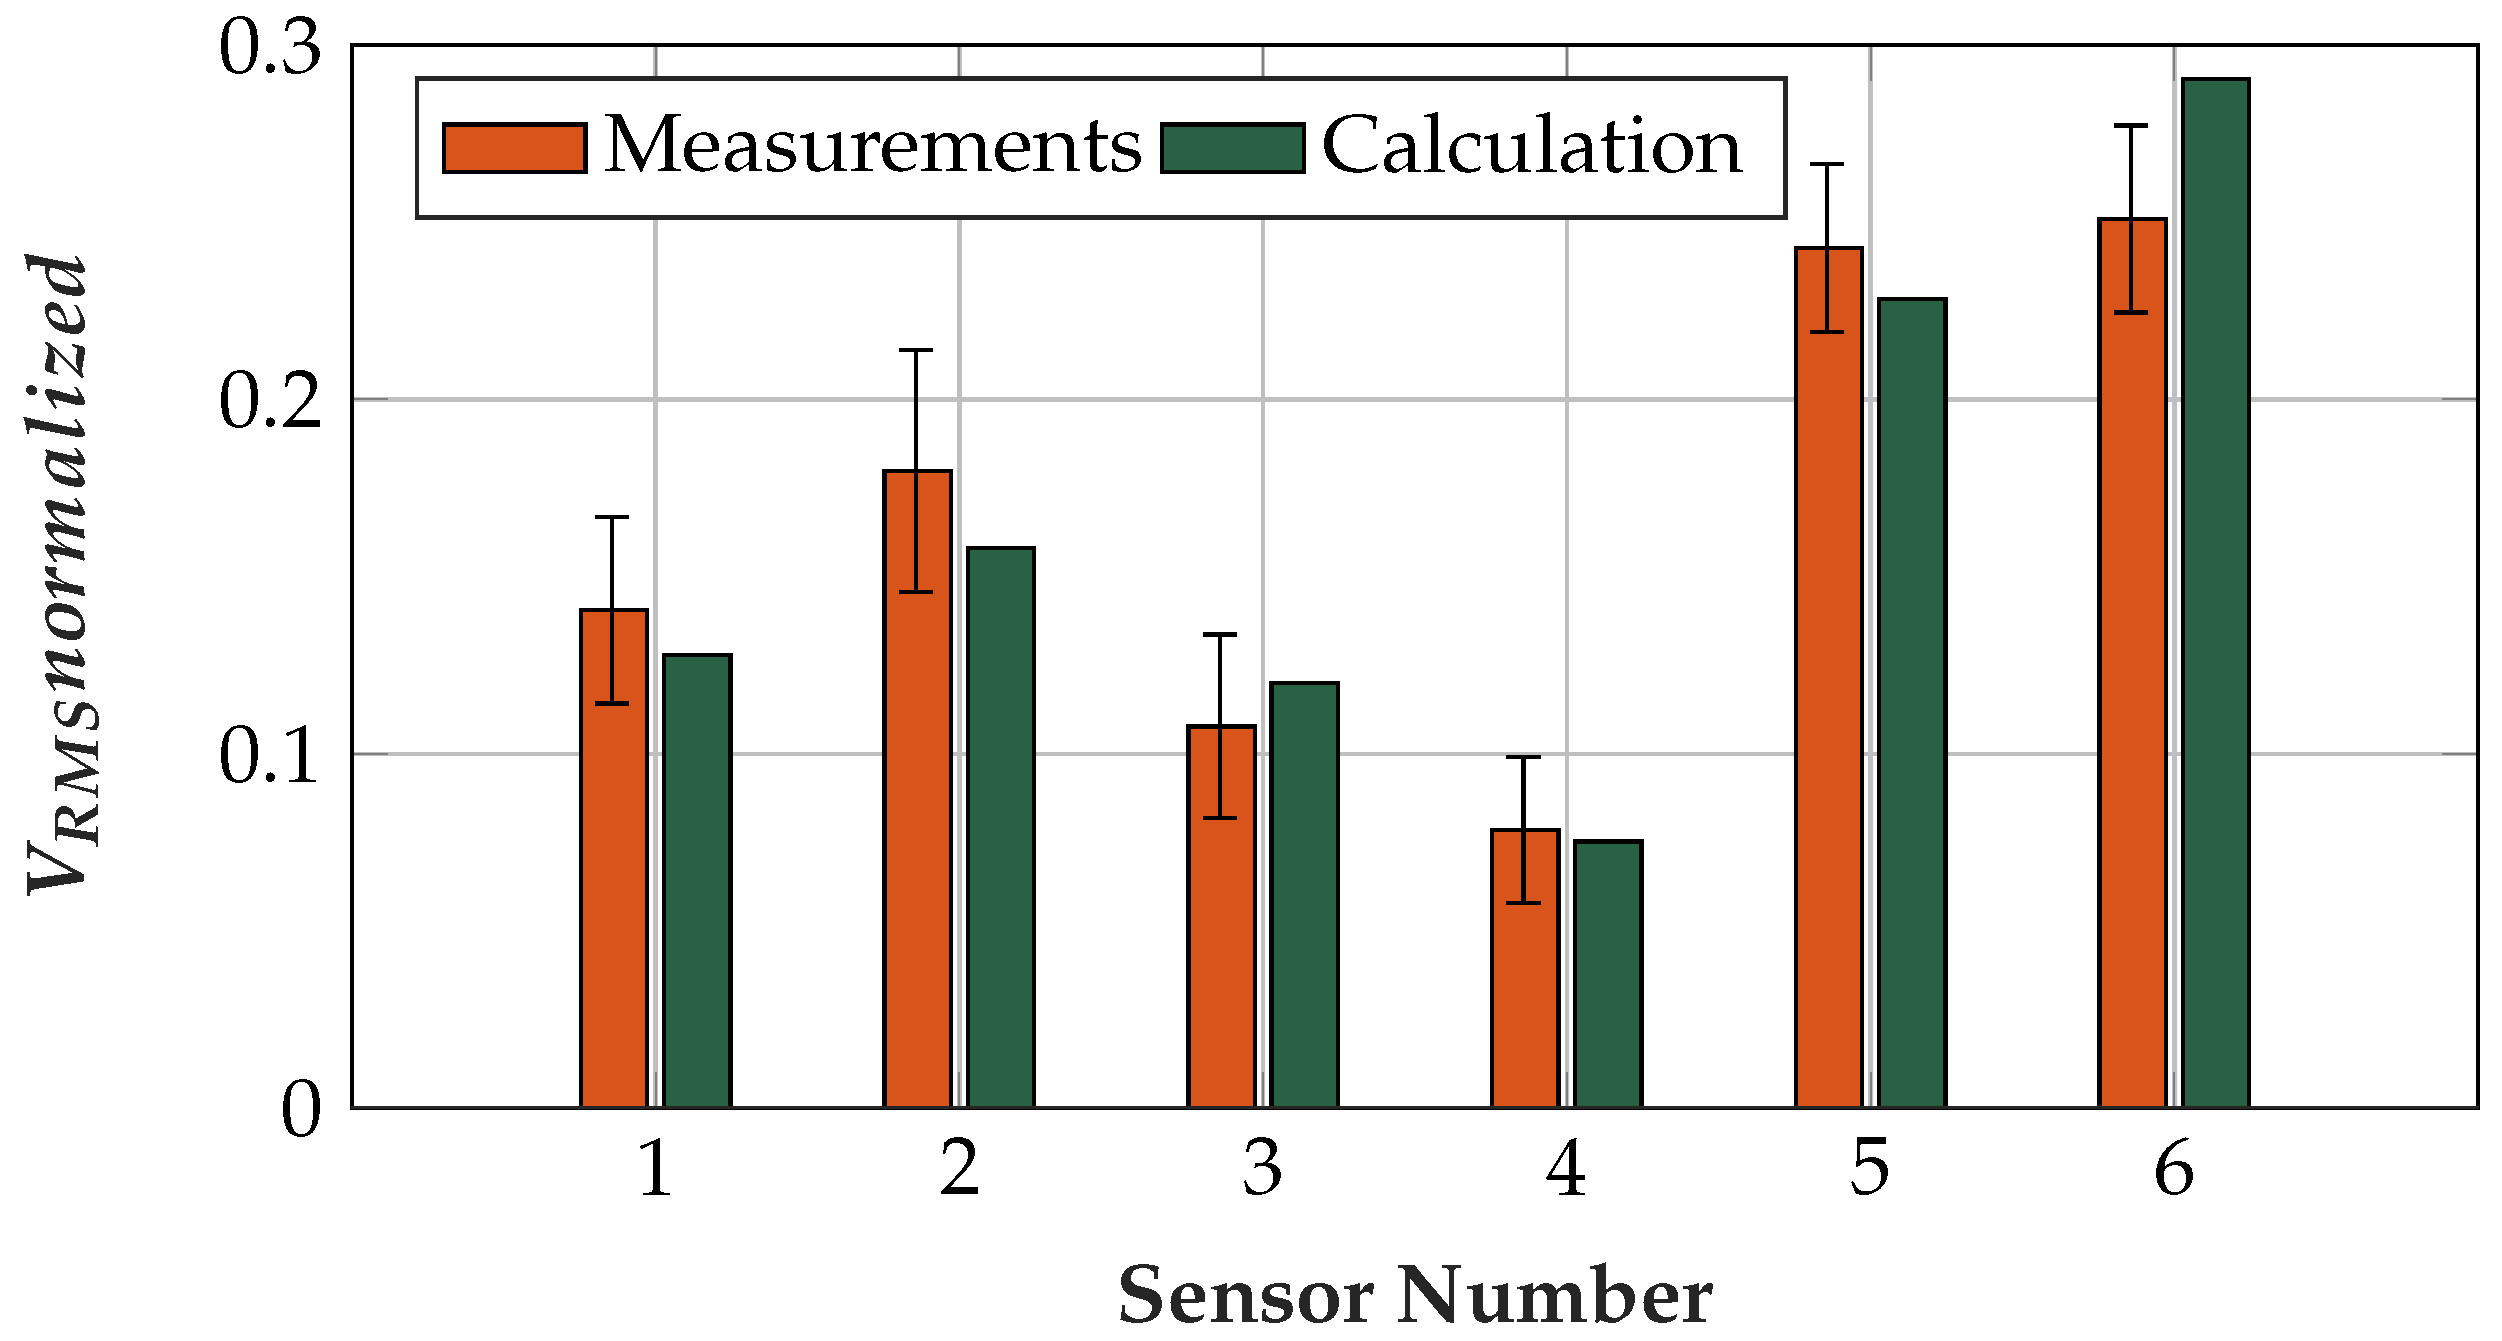
6.2.3. Entire Measurement Set-Up
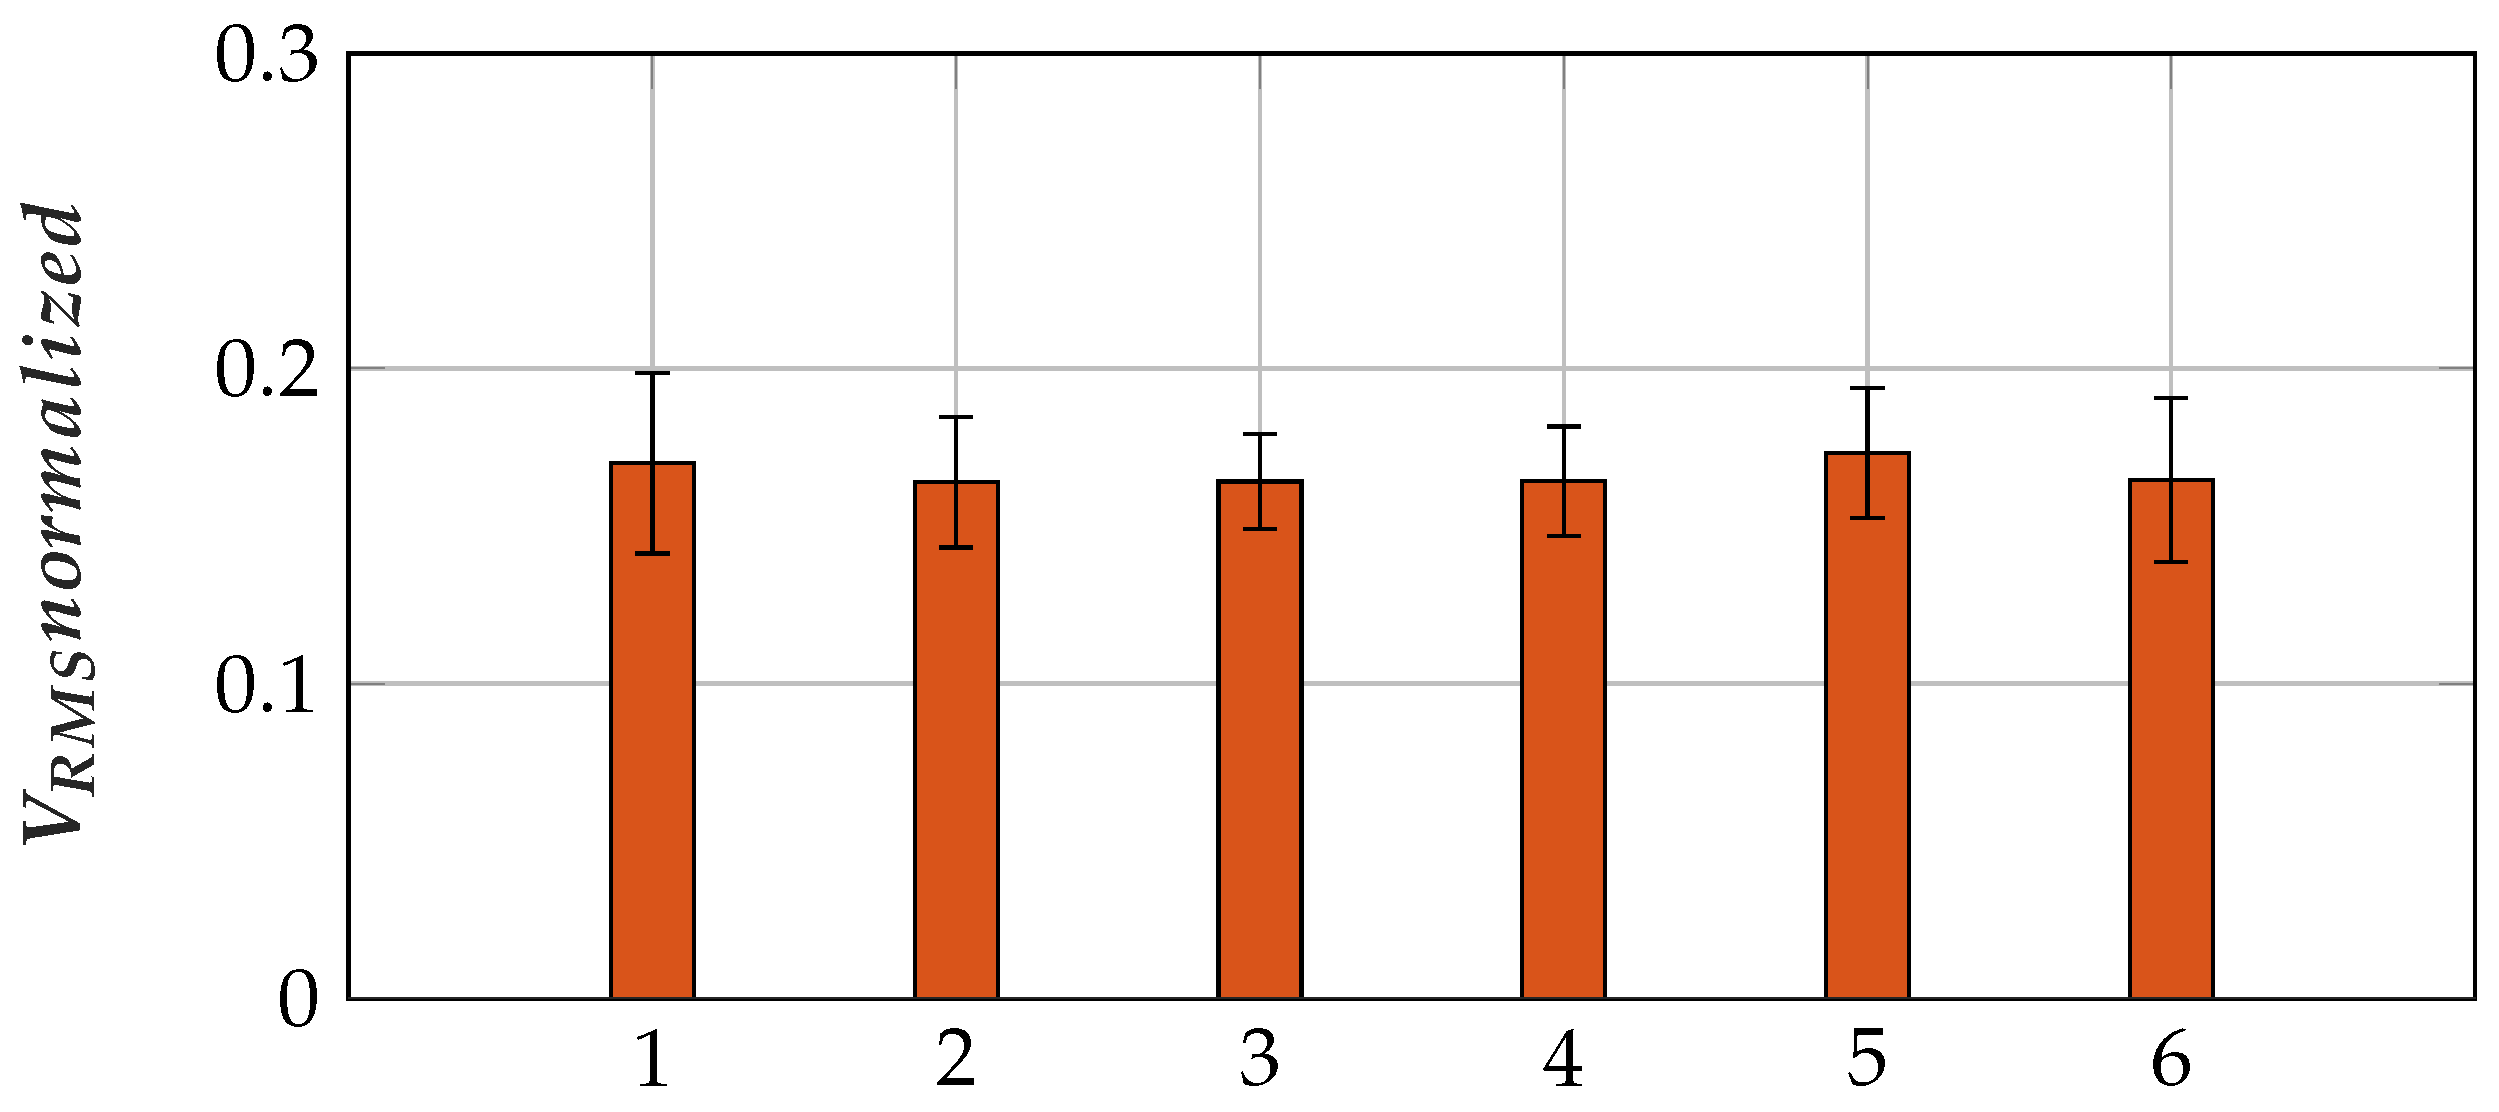
6.3. Comparison of Sensor Assemblies
6.3.1. Fatigue Evaluation
6.4. Shielding (Active Shield and Common-Mode Shield)
6.5. Proportionality to Force Level
6.6. Power Consumption
6.7. Wearing Comfort
6.8. Comparison of Capacitive and Conductive Sensors
6.9. Alternative Reference Design: INA with DC Rejection Reference Design
7. Discussion
7.1. Capacitive EMG Sensing Electrode
7.2. Body Reference
7.3. Analog Circuit
7.4. Comparison of Sensor Assemblies
8. Conclusions
Author Contributions
Funding
Acknowledgments
Conflicts of Interest
Abbreviations
| AC | Alternating current |
| ADC | Analog to digital converter |
| AS | Amplitude spectrum |
| BLE | Bluetooth-low-energy |
| CMRR | Common-mode rejection ratio |
| DAC | Digital to analog converter |
| DC | direct current |
| DSP | Digital signal processing |
| ECG | Electrocardiography |
| EEG | Electroencephalography |
| EMG | Electromyography |
| INA | Instrumentation amplifier |
| IO | Input/Output |
| C | Microcontroller |
| OpAmp | Operational amplifier |
| PSRR | Power supply rejection ratio |
| PU | Polyurethane |
| PVC | Polyvinylchlorid |
| PWM | Pulse width modulation |
| RMS | Root mean square |
| sEMG | Surface Electromyography |
| SNR | Signal to noise ratio |
| TPU | Thermoplastic polyurethane |
| UMCC | Ultra miniature coaxial cable |
References
- Phinyomark, A.; Khushaba, R.N.; Scheme, E. Feature Extraction and Selection for Myoelectric Control Based on Wearable EMG Sensors. Sensors 2018, 18, 1615. [Google Scholar] [CrossRef] [PubMed]
- Phinyomark, A.; Hu, H.; Phukpattaranont, P.; Limsakul, C. Application of Linear Discriminant Analysis in Dimensionality Reduction for Hand Motion Classification. Meas. Sci. Rev. 2012, 12, 82–89. [Google Scholar] [CrossRef]
- Connan, M.; Ramírez, E.R.; Vodermayer, B.; Castellini, C. Assessment of a Wearable Force- and Electromyography Device and Comparison of the Related Signals for Myocontrol. Front. Neurorobot. 2016, 10, 17. [Google Scholar] [CrossRef] [PubMed]
- Gailey, A.; Artemiadis, P.; Santello, M. Proof of Concept of an Online EMG-Based Decoding of Hand Postures and Individual Digit Forces for Prosthetic Hand Control. Front. Neurol. 2017, 8, 7. [Google Scholar] [CrossRef] [PubMed]
- Chadwell, A.; Kenney, L.; Thies, S.; Galpin, A.; Head, J. The Reality of Myoelectric Prostheses: Understanding What Makes These Devices Difficult for Some Users to Control. Front. Neurorobot. 2016, 10, 7. [Google Scholar] [CrossRef] [PubMed]
- Radmand, A.; Scheme, E.; Englehart, K. High-density force myography: A possible alternative for upper-limb prosthetic control. J. Rehabil. Res. Dev. 2016, 53, 443–456. [Google Scholar] [CrossRef] [PubMed]
- Castellini, C.; Bongers, R.M.; Nowak, M.; van der Sluis, C.K. Upper-Limb Prosthetic Myocontrol: Two Recommendations. Front. Neurosci. 2016, 9, 496. [Google Scholar] [CrossRef] [PubMed]
- Zhang, X.; Li, X.; Samuel, O.W.; Huang, Z.; Fang, P.; Li, G. Improving the Robustness of Electromyogram-Pattern Recognition for Prosthetic Control by a Postprocessing Strategy. Front. Neurorobot. 2017, 11, 51. [Google Scholar] [CrossRef] [PubMed]
- Zhai, X.; Jelfs, B.; Chan, R.H.M.; Tin, C. Self-Recalibrating Surface EMG Pattern Recognition for Neuroprosthesis Control Based on Convolutional Neural Network. Front. Neurosci. 2017, 11, 379. [Google Scholar] [CrossRef] [PubMed]
- Supuk, T.; Skelin, A.; Cic, M. Design, Development and Testing of a Low-Cost sEMG System and Its Use in Recording Muscle Activity in Human Gait. Sensors 2014, 14, 8235–8258. [Google Scholar] [CrossRef] [PubMed]
- Cho, E.; Chen, R.; Merhi, L.K.; Xiao, Z.; Pousett, B.; Menon, C. Force Myography to Control Robotic Upper Extremity Prostheses: A Feasibility Study. Front. Bioeng. Biotechnol. 2016, 4, 18. [Google Scholar] [CrossRef] [PubMed]
- Fougner, A.; Scheme, E.; Chan, A.D.C.; Englehart, K.; Stavdahl, O. A multi-modal approach for hand motion classification using surface EMG and accelerometers. In Proceedings of the Annual International Conference of the IEEE Engineering in Medicine and Biology Society, Boston, MA, USA, 30 August–3 September 2011; pp. 4247–4250. [Google Scholar]
- Prance, H. Sensor Developments for Electrophysiological Monitoring in Healthcare. In Applied Biomedical Engineering; Gargiulo, G., McEwan, A., Eds.; InTech: Rijeka, Croatia, 2011; pp. 255–286. [Google Scholar]
- Lee, S.M.; Sim, K.S.; Kim, K.K.; Lim, Y.G.; Park, K.S. Thin and flexible active electrodes with shield for capacitive electrocardiogram measurement. Med. Biol. Eng. Comput. 2010, 48, 447–457. [Google Scholar] [CrossRef] [PubMed]
- Spinelli, E.; Haberman, M. Insulating electrodes: A review on biopotential front ends for dielectric skin–electrode interfaces. Physiol. Meas. 2010, 31, 183–198. [Google Scholar] [CrossRef] [PubMed]
- Lim, Y.G.; Kim, K.K.; Park, S. ECG measurement on a chair without conductive contact. IEEE Trans. Biomed. Eng. 2006, 53, 956–959. [Google Scholar] [PubMed]
- Richardson, P.C.; Lopez, A., Jr. Electrocardiographic and Bioelectric Capacitive Electrode. U.S. Patent 3500823A, 17 March 1967. [Google Scholar]
- Ueno, A.; Akabane, Y.; Mizuta, A.; Kataoka, S.; Hoshino, H.; Ishiyama, Y. A System for Detecting Electrocardiographic Potential through Underwear Worn by an Infant from Its Dorsal Surface. In Proceedings of the World Congress on Medical Physics and Biomedical Engineering, Seoul, Korea, 27 August–1 September 2006; pp. 595–598. [Google Scholar]
- Ohtsu, M.; Fukuoka, Y.; Ueno, A. Underwater Electromyographic Measurement Using a Waterproof Insulated Electrode. ABE 2012, 1, 81–88. [Google Scholar] [CrossRef]
- Oehler, M. Kapazitive Elektroden zur Messung bioelektrischer Signale. Ph.D. Thesis, Technische Universität Braunschweig, Braunschweig, Germany, 2010. [Google Scholar]
- Ng, C.L.; Reaz, M.B.I. Characterization of Textile-Insulated Capacitive Biosensors. Sensors 2017, 17, 574. [Google Scholar] [CrossRef] [PubMed]
- Roland, T.; Amsuess, S.; Russold, M.F.; Wolf, C.; Baumgartner, W. Capacitive Sensing of Surface EMG for Upper Limb Prostheses Control. In Procedia Engineering; Eurosensors: Budapest, Hungary, 2016. [Google Scholar]
- Roland, T.; Baumgartner, W.; Amsuess, S.; Russold, M.F. Signal evaluation of capacitive EMG for upper limb prostheses control using an ultra-low-power microcontroller. In Proceedings of the IEEE EMBS Conference on Biomedical Engineering and Sciences (IECBES), Kuala Lumpur, Malaysia, 4–8 December 2016; pp. 317–320. [Google Scholar]
- Roland, T.; Mairhofer, S.; Roland, W.; Diskus, C.; Amsuess, S.; Russold, M.F.; Wolf, C.; Baumgartner, W. Evaluation of Capacitive EMG Sensor Geometries by Simulation and Measurement. In Scientific Computing in Electrical Engineering; Springer International Publishing: Berlin, Germany, 2016; pp. 13–23. [Google Scholar]
- Tyco Electronics. UMCC—Ultraminiature Coax Connector & Cable Assembly Series. Technical Data Sheet. 2008. Available online: https://www.te.com/commerce/DocumentDelivery/DDEController?Action=showdoc&DocId=Catalog+Section%7F1307191_UMCC_Connectors%7F0307%7Fpdf%7FEnglish%7FENG_CS_1307191_UMCC_Connectors_0307.pdf%7F1775230-1 (accessed on 9 January 2019).
- DuPont. Dupont Pyralux LF Sheet Adhesive Flexible Composites. Technical Data Sheet. 2018. Available online: http://www.dupont.com/content/dam/dupont/products-and-services/electronic-and-electrical-materials/flexible-rigid-flex-circuit-materials/documents/PyraluxLFadhesive_DataSheet.pdf (accessed on 9 January 2019).
- Epectec. Flex Circuit Design Guide. Technical Data Sheet. 2013. Available online: https://www.epectec.com/downloads/Flex-Circuit-Design-Guide.pdf (accessed on 9 January 2019).
- Miyazaki, E.; Mori, K.; Ishizawa, J.; Shimamura, H. Evaluation of Silicone Potting Compound and Silicone Adhesive Exposed to Space on SM/SEED Experiment. In Proceedings of the International Symposium on “SM/MPAC&SEED Experiment”, Tsukuba, Japan, 10–11 March 2008; pp. 155–159. [Google Scholar]
- d-c-fix F3460013 Klebefolie, Vinyl, Transparent, 200 × 45 cm. Product Description. 2014. Available online: https://www.amazon.de/d-c-fix-F3465001-Klebefolie-Vinyl-wei%C3%9F/dp/B005GJCCDS?ref_=bl_dp_s_web_2138306031 (accessed on 9 January 2019).
- BEMIS. EXOFLEX (EXO3900) Aesthetic/Functional Film. Technical Data Sheet. 2018. Available online: https://www.bemisworldwide.com/PDF/BEMIS_Web_Exoflex.pdf (accessed on 9 January 2019).
- Moron. Articulo Maline Ficha Tecnica; Technical Data Sheet Provided by Moron; Moron: Moscow, Russia, 2017. [Google Scholar]
- Bayer. Technische Daten PLATILON® U Hochelastische Polyurethanfolien, Technical Data Sheet. 2014. Available online: https://www.films.covestro.com/de/Products/~/media/013045757CC2401D83DF0B6F1169CAB5.ashx?la=de&force=1&la=de&force=1 (accessed on 9 January 2019).
- Plastics International. Polyvinyl Chloride. Technical Data Sheet. Plastics International, 2013. Available online: http://www.sdplastics.com/pvcsheet.html (accessed on 9 January 2019).
- Lotz, P. Dielektrische Elastomerstapelaktoren für ein Peristaltisches Fluidfördersystem. Ph.D. Thesis, TU Darmstadt, Darmstadt, Germany, 2010. [Google Scholar]
- Huette, A.V.E. Das Ingenieurs Taschenbuch, 25th ed.; Wilhelm Ernst & Sohn: Hoboken, NJ, USA, 1925. [Google Scholar]
- Tesafilm. Tesafilm 4104 PVC Transparent Premium Verpackungsklebefilm (Transparent), Technical Data Sheet. 2018. Available online: https://www.tesa.com/de-at/files/download/371131,21,4104-country-pi-dt.pdf (accessed on 9 January 2019).
- Advance Tapes. AT525 35 Micron Copper Foil Shielding Tape. Technical Data Sheet. 2018. Available online: https://www.advancetapes.com/wp-content/uploads/2017/03/AT525-ATI.pdf (accessed on 9 January 2019).
- Casas, O.; Pallas-Areny, R. Electrostatic Interference in Contactless Biopotential Measurements. In Proceedings of the 29th Annual International Conference of the IEEE Engineering in Medicine and Biology Society, Lyon, France, 22–26 August 2007; pp. 2655–2658. [Google Scholar]
- Haberman, M.A.; Spinelli, E.M.; García, P.A.; Guerrero, F.N. Capacitive driven-right-leg circuit design. IJBET 2015, 17, 115–126. [Google Scholar] [CrossRef]
- ST. LD2985 Very Low Drop and Low Noise Voltage Regulator with Inhibit Function, Technical Data Sheet. 2013. Available online: https://www.st.com/resource/en/datasheet/ld2985.pdf (accessed on 9 January 2019).
- Diodes Inc. AP7312 Dual 150mA Low Quiescent Current Fast Transient Low Dropout Linear Regulator, Technical Data Sheet. 2011. Available online: https://www.diodes.com/assets/Datasheets/AP7312.pdf (accessed on 9 January 2019).
- AnalogDevices. 40 microAmpere Micropower Instrumentation Amplifier with Zero Crossover Distortion, Technical Data Sheet. 2009. Available online: https://www.analog.com/media/en/technical-documentation/data-sheets/ad8236.pdf (accessed on 9 January 2019).
- Sullivan, T.J.; Deiss, S.; Cauwenberghs, G. A Low-Noise, Non-Contact EEG/ECG Sensor. In Proceedings of the IEEE Biomedical Circuits and Systems Conference, Montreal, QC, Canada, 27–30 November 2007. [Google Scholar]
- Basmajian, J.V.; Luca, C.J.D. Muscles Alive: Their Functions Revealed by Electromyography, 2nd ed.; The Williams & Wilkins Company: Baltimore, MD, USA, 1962. [Google Scholar]
- Microchip. MCP6021/1R/2/3/4 Rail-to-Rail Input/Output, 10 MHz Op Amps, Technical Data Sheet. 2017. Available online: http://ww1.microchip.com/downloads/en/devicedoc/20001685e.pdf (accessed on 9 January 2019).
- Texas Instruments. Instrumentation Amplifier with DC Rejection Reference Design, Technical Data Sheet. 2015. Available online: http://www.ti.com/lit/ug/tidu990/tidu990.pdf (accessed on 9 January 2019).
- Jiang, Y.; Samuel, O.; Liu, X.; Wang, X.; Idowu, P.; Li, P.; Chen, F.; Zhu, M.; Geng, Y.; Wu, F.; et al. Effective Biopotential Signal Acquisition: Comparison of Different Shielded Drive Technologies. Appl. Sci. 2018, 8, 276. [Google Scholar] [CrossRef]
- Hann, M. Analog Fundamentals of the ECG Signal Chain, Texas Instruments. 2012. Available online: https://ece480group6.files.wordpress.com/2012/11/design-considerations-for-ecg-systems-hann-apr2010-compatibility-mode.pdf (accessed on 9 January 2019).
- Bronzino, J.D.; Peterson, D.R. The Biomedical Engineering Handbook, 4th ed.; CRC Press: Boca Raton, FL, USA, 2015. [Google Scholar]
- Kose, S.; Salman, E.; Friedman, E.G. Shielding Methodologies in the Presence of Power/Ground Noise. T-VLSI 2011, 19, 1458–1468. [Google Scholar] [CrossRef]
- Burr Brown. INA111 High Speed FET-Input Instrumentation Amplifier, Technical Data Sheet. 1998. Available online: http://www.ti.com.cn/cn/lit/ds/symlink/ina111.pdf (accessed on 9 January 2019).
- Microchip. SMART ARM-Based Microcontrollers SAM L21 Family Data Sheet, Technical Data Sheet. 2017. Available online: http://ww1.microchip.com/downloads/en/DeviceDoc/60001477A.pdf (accessed on 9 January 2019).
- Roland, T.; Amsuess, S.; Russold, M.F.; Baumgartner, W. Ultra-Low-Power Digital Filtering for Insulated EMG Sensing. Sensors 2019. under review. [Google Scholar]
- Portelli, A.; Nasuto, S. Design and Development of Non-Contact Bio-Potential Electrodes for Pervasive Health Monitoring Applications. Biosensors 2017, 7, 2. [Google Scholar] [CrossRef] [PubMed]
- Prutchi, D.; Norris, M. Design and Development of Medical Electronic Instrumentation: A Practical Perspective of the Design, Construction, and Test of Medical Devices; John Wiley & Sons, Inc.: Hoboken, NJ, USA, 2005. [Google Scholar]
- Heuer, S. Ambiente kapazitive EKG-Messung—Elektroden, Systeme und Konzepte. Ph.D. Thesis, Karlsruher Institute of Technology (KIT), Karlsruher, Germany, 2011. [Google Scholar]
- Fein, H. Solid-State Electrometers with Input-Capacitance Neutralization. IEEE Trans. Biomed. Eng. 1964, 11, 13–18. [Google Scholar] [CrossRef] [PubMed]
- Gomez-Clapers, J.; Serrano-Finetti, E.; Casanella, R.; Pallas-Areny, R. Can driven-right-leg circuits increase interference in ECG amplifiers? In Proceedings of the Annual International Conference of the IEEE Engineering in Medicine and Biology Society, Boston, MA, USA, 30 August–3 September 2011; pp. 4780–4783. [Google Scholar]
- Nazmi, N.; Rahman, M.A.; Yamamoto, S.I.; Ahmad, S.; Zamzuri, H.; Mazlan, S. A Review of Classification Techniques of EMG Signals during Isotonic and Isometric Contractions. Sensors 2016, 16, 1304. [Google Scholar] [CrossRef] [PubMed]
- Nazarpour, K.; Al-Timemy, A.H.; Bugmann, G.; Jackson, A. A note on the probability distribution function of the surface electromyogram signal. Brain Res. Bull. 2013, 90, 88–91. [Google Scholar] [CrossRef] [PubMed]
- Ahamed, N.U.; Sundaraj, K.; Ahmad, R.B.; Rahman, M.; Islam, M.A. Analysis of Right Arm Biceps Brachii Muscle Activity with Varying the Electrode Placement on Three Male Age Groups During Isometric Contractions Using a Wireless EMG Sensor. In Proceedings of the International Symposium on Robotics and Intelligent Sensors, Kuching, Sarawak, Malaysia, 4–6 September 2012; pp. 61–67. [Google Scholar]
- Kattla, S.; Lowery, M.M. Fatigue related changes in electromyographic coherence between synergistic hand muscles. Exp. Brain Res. 2009, 202, 89–99. [Google Scholar] [CrossRef] [PubMed]
- Catrysse, M.; Puers, R.; Hertleer, C.; Langenhove, L.V.; van Egmond, H.; Matthys, D. Towards the integration of textile sensors in a wireless monitoring suit. Sens. Actuators A Phys. 2004, 114, 302–311. [Google Scholar] [CrossRef]
- Forvi, E.; Bedoni, M.; Carabalona, R.; Soncini, M.; Mazzoleni, P.; Rizzo, F.; O’Mahony, C.; Morasso, C.; Cassarà, D.G.; Gramatica, F. Preliminary technological assessment of microneedles-based dry electrodes for biopotential monitoring in clinical examinations. Sens. Actuators A Phys. 2012, 180, 177–186. [Google Scholar] [CrossRef]
- Chemours. Teflon FEP Fluoropolymer Film, Technical Data Sheet. 2017. Available online: https://www.chemours.com/Teflon_Industrial/en_US/assets/downloads/teflon-fep-film-technical-information.pdf (accessed on 9 January 2019).
- TiePie Engineering. HANDYSCOPE MODEL HS3 A Portable 100 MS/s Instrument Connected to USB 2.0 and USB 1.1, Handyscope HS3 Specifications. 2018. Available online: https://www.tiepie.com/en/usb-oscilloscope/handyscope-hs3/specifications (accessed on 9 January 2019).
- TiePie Engineering. Multi Channel Oscilloscope Software. TiePie. Available online: https://www.tiepie.com/en/oscilloscope-software (accessed on 7 February 2018).
- Jesunathadas, M.; Aidoor, S.S.; Keenan, K.G.; Farina, D.; Enoka, R.M. Influence of Amplitude Cancellation on the Accuracy of Determining the Onset of Muscle Activity from the Surface Electromyogram. J. Electromyogr. Kinesiol. 2012, 22, 494–500. [Google Scholar] [CrossRef] [PubMed]
- Keenan, K.G.; Farina, D.; Maluf, K.S.; Merletti, R.; Enoka, R. Influence of amplitude cancellation on the simulated surface electromyogram. J. Appl. Physiol. 2005, 98, 120–131. [Google Scholar] [CrossRef] [PubMed]
- Day, S.J.; Hullinger, M. Experimental simulation of cat electromyogram: evidence for algebraic summation of motor-unit action-potential trains. J. Neurophysiol. 2001, 86, 2144–2158. [Google Scholar] [CrossRef] [PubMed]
- Jiralerspong, T.; Nakanishi, E.; Liu, C.; Ishikawa, J. Experimental Study of Real-Time Classification of 17 Voluntary Movements for Multi-Degree Myoelectric Prosthetic Hand. Appl. Sci. 2017, 7, 1163. [Google Scholar] [CrossRef]
- MathWorks®. MATLAB® and Statistics Toolbox Release 2016b; The MathWorks®, Inc.: Natick, MA, USA, 2016. [Google Scholar]
- D’Augustino, R.B.; Stephens, M.A. Goodness-of-Fit-Techniques; CRC Press: Boca Raton, FL, USA, 1986. [Google Scholar]
- Bartlett, M.S. Properties of Sufficiency and Statistical Tests. Proc. R. Soc. Lond. Ser. A Math. Phys. Sci. 1937, 160, 268–282. [Google Scholar]
- Bornemann-Cimenti, H.; Szilagyi, I.S.; Sandner-Kiesling, A. Wissenschaftliches Arbeiten in der Klinik: Ein Leitfaden für die ersten Wissenschaftlichen Erfahrungen und das Verfassen von Abschlussarbeiten (MV-Wissenschaft); Monsenstein und Vannerdat: Münster, Deutschland, 2015. [Google Scholar]
- Hou, W.; Jiang, Y.; Zheng, J.; Zheng, X.; Peng, C.; Xu, R. Handgrip Force Estimation Based on a Method Using Surface Electromyography (sEMG) of Extensor Carpi Radialis Longus. In Proceedings of the International Conference on Complex Medical Engineering, Beijing, China, 23–27 May 2007; pp. 1229–1235. [Google Scholar]
- Lawrence, J.H.; De Luca, C.J. Myoelectric signal versus force relationship in different human muscles. J. Appl. Physiol. Respir. Environ. Exerc. Physiol. 1983, 54, 1653–1659. [Google Scholar] [CrossRef] [PubMed]
- Microchip. Bluetooth® 4.2 Low Energy Module RN4870/71, Technical Data Sheet. 2017. Available online: http://ww1.microchip.com/downloads/en/DeviceDoc/50002489C.pdf (accessed on 9 January 2019).
- 13E401, Otto Bock Healthcare GmbH, Otto Bock. Available online: https://www.ottobock.at/ (accessed on 9 January 2019).
- Campell, S.D.; Kraning, K.K.; Schibli, E.G.; Momii, S.T. Hydration Characteristics and Electrical Resistivity of Stratum Corneum Using a Noninvasive Four-Point Microelectrode Method. J. Investig. Dermatol. 1977, 69, 290–295. [Google Scholar] [CrossRef]
- Kirst, M. Verbesserung der Automatischen EKG-Analyse durch Hinzunahme von Kontextinformationen. Ph.D. Thesis, Karlsruher Institute of Technology (KIT), Karlsruher, Germany, 2012. [Google Scholar]
- Surface EMG Sensor (SX230), Biometrics. Available online: http://www.biometricsltd.com/surface-emg-sensor.htm (accessed on 9 January 2019).
- Bagnoli TM Surface EMG Sensor, Delsys. Available online: https://www.delsys.com/products/desktop-emg/surface-emg-sensors/ (accessed on 9 January 2019).
- MyoWareTM Muscle Sensor (AT-04-001), Technical Data Sheet. Available online: https://cdn.sparkfun.com/assets/a/3/a/f/a/AT-04-001.pdf (accessed on 9 January 2019).


| Sensor # | Sensor 1 | Sensor 2 | Sensor 3 | Sensor 4 | Sensor 5 | Sensor 6 |
|---|---|---|---|---|---|---|
| Material | Copper & Insulation foils | Textiles | Textiles | Flex print | Flex print | Flex print |
| Sensor area shape | rectangular | circular | circular | circular | circular | circular |
| Width/radius (mm) | 15 | 7.5 | 7.5 | 10 | 10 | 10 |
| Height (mm) | 16.5 | - | - | - | - | - |
| Area (mm2) | 247.5 | 176.7 | 176.7 | 314.2 | 314.2 | 314.2 |
| Inter-electrode distance (mm) (center to center) | 35 | 32.5 | 32.5 | 30 | 30 | 30 |
| Adhesive (Dielectric 2) | Acrylic adhesive [26] | Silicone | Silicone | Acrylic adhesive [26] | Acrylic adhesive [26] | Acrylic adhesive [26] |
| Ad. Thickness (m) | 2*30 | 100 | 100 | 30 | neglected [27] | neglected [27] |
| Ad. | 3.8 [26] | 2.8 [28] | 2.8 [28] | 3.8 [26] | - | - |
| Dielectric 1 (between skin and sensor area) | self-adhesive PVC foil [29] | Exoflex [30] (TPU) | PU [31] | self-adhesive PVC foil [29] | Platilon® foil [32] | - |
| Diel. 1 thickness (m) | 90 | 75 | 250 | 90 | 25 | - |
| Diel. 1 | 3.19 [33] | 6.6 [34,35] | 6.6 [34,35] | 3.19 [33] | 6.6 [34,35] | - |
| Adhesive (Dielectric 4) | Acrylic adhesive [26] | Silicone | Silicone | Acrylic adhesive [26] | Acrylic adhesive [26] | Acrylic adhesive [26] |
| Ad. Thickness (m) | 30 | 100 | 100 | neglected [27] | neglected [27] | neglected [27] |
| Ad. | 3.8 [26] | 2.8 [28] | 2.8 [28] | - | - | - |
| Dielectric 3 (btw. sensor area and shield) | Tesafilm TM [36] | Exoflex [30] (TPU) | Exoflex [30] (TPU) | Polymide [27] | Polymide [27] | Polymide [27] |
| Diel. 3 thickness (m) | 65 | 75 | 75 | 50 | 50 | 50 |
| Diel. 3 | 3.19 [33] | 6.6 [34,35] | 6.6 [34,35] | 3.4 [27] | 3.4 [27] | 3.4 [27] |
| # | Diel. 1 Thickness (m) | R,1 | Diel. 2 Thickness (m) | R,2 | Area (mm2) | CC (pF) |
|---|---|---|---|---|---|---|
| 1 | 90 | 3.2 | 60 | 3.8 | 247 | 49.7 |
| 2 | 75 | 6.6 | 100 | 2.8 | 177 | 33.3 |
| 3 | 250 | 6.6 | 100 | 2.8 | 177 | 21.3 |
| 4 | 90 | 3.2 | 30 | 3.8 | 314 | 77.0 |
| 5 | 25 | 6.6 | - | - | 314 | 733.6 |
| 6 | - | - | - | - | - | - |
| Connection | Length l (mm) | Width w (mm) | Thickness d (m) | (m) | (m) | R | (pF) |
|---|---|---|---|---|---|---|---|
| UMCC | 40 | - | - | 100 | 83 | 2 | 2 |
| Flex print | 70 | 50 | 1 | - | - | 3.4 | 42 |
| # | Diel. 3 Thickness (m) | R,3 | Diel. 4 Thickness (m) | R,4 | Area A (mm2) | CP (pF) |
|---|---|---|---|---|---|---|
| 1 | 65 | 3.2 | 30 | 3.8 | 271.7 | 87.2 |
| 2 | 75 | 6.6 | 100 | 2.8 | 194.7 | 38.7 |
| 3 | 75 | 6.6 | 100 | 2.8 | 194.7 | 38.7 |
| 4 | 50 | 3.4 | - | - | 408.2 | 287.8 |
| 5 | 50 | 3.4 | - | - | 408.2 | 287.8 |
| 6 | 50 | 3.4 | - | - | 408.2 | 287.8 |
| Sensor | Mean Comfort | Mean Rank |
|---|---|---|
| (1 …very good, 5 …very bad) | (1 …best, 3 …worst) | |
| Copper Sensor | 2.80 | 3.00 |
| Textile Sensor | 1.24 | 1.20 |
| Flex Sensor | 1.64 | 1.80 |
© 2019 by the authors. Licensee MDPI, Basel, Switzerland. This article is an open access article distributed under the terms and conditions of the Creative Commons Attribution (CC BY) license (http://creativecommons.org/licenses/by/4.0/).
Share and Cite
Roland, T.; Wimberger, K.; Amsuess, S.; Russold, M.F.; Baumgartner, W. An Insulated Flexible Sensor for Stable Electromyography Detection: Application to Prosthesis Control. Sensors 2019, 19, 961. https://doi.org/10.3390/s19040961
Roland T, Wimberger K, Amsuess S, Russold MF, Baumgartner W. An Insulated Flexible Sensor for Stable Electromyography Detection: Application to Prosthesis Control. Sensors. 2019; 19(4):961. https://doi.org/10.3390/s19040961
Chicago/Turabian StyleRoland, Theresa, Kerstin Wimberger, Sebastian Amsuess, Michael Friedrich Russold, and Werner Baumgartner. 2019. "An Insulated Flexible Sensor for Stable Electromyography Detection: Application to Prosthesis Control" Sensors 19, no. 4: 961. https://doi.org/10.3390/s19040961
APA StyleRoland, T., Wimberger, K., Amsuess, S., Russold, M. F., & Baumgartner, W. (2019). An Insulated Flexible Sensor for Stable Electromyography Detection: Application to Prosthesis Control. Sensors, 19(4), 961. https://doi.org/10.3390/s19040961