Monitoring of Cell Concentration during Saccharomyces cerevisiae Culture by a Color Sensor: Optimization of Feature Sensor Using ACO


Abstract
:1. Introduction
2. Materials and Methods
2.1. Sample Preparation
2.2. Constructing the Color Sensitive Sensor Array
- (1)
- 5,10,15,20-Tetraphenyl-21H,23H-porphine (TPP);
- (2)
- 5,10,15,20-Tetraphenyl-21H,23H-porphine manganese (III) chloride (TPPMnCl);
- (3)
- 5,10,15,20-Tetrakis(4-methoxyphenyl)-21H,23H-porphine iron (III) chloride (FTPPFeCl)
- (4)
- 5,10,15,20-Tetraphenyl-21H,23H-porphine iron (III) chloride (TPPFeCl)
- (5)
- 5,10,15,20-Tetraphenyl-21H,23H-porphine copper (II) (TPPCu)
- (6)
- 5,10,15,20-Tetrakis(4-methoxyhenyl)-21H,23H-porphine cobalt (II) (FTPPCo)
- (7)
- 5,10,15,20-Tetraphenyl-21H,23H-porphine zinc (TPPZn)
- (8)
- meso-Tetra(4-carboxyphenyl)-porphine tetramethyl ester (MTPPTE)
- (9)
- meso-Tetraphenyl porphyrin-Ni(II) chlorin (MTPPNiCl)
- (10)
- 2,3,7,8,12,13,17,18-Octaethyl-21H,23H-porphine nickel (II) (OEPPNi)
- (11)
- meso-Tetraphenyl porphyrin (chlorin fee) (MTPP)
- (12)
- Bromothymol blue (BTB)
2.3. Measurement of OD Values
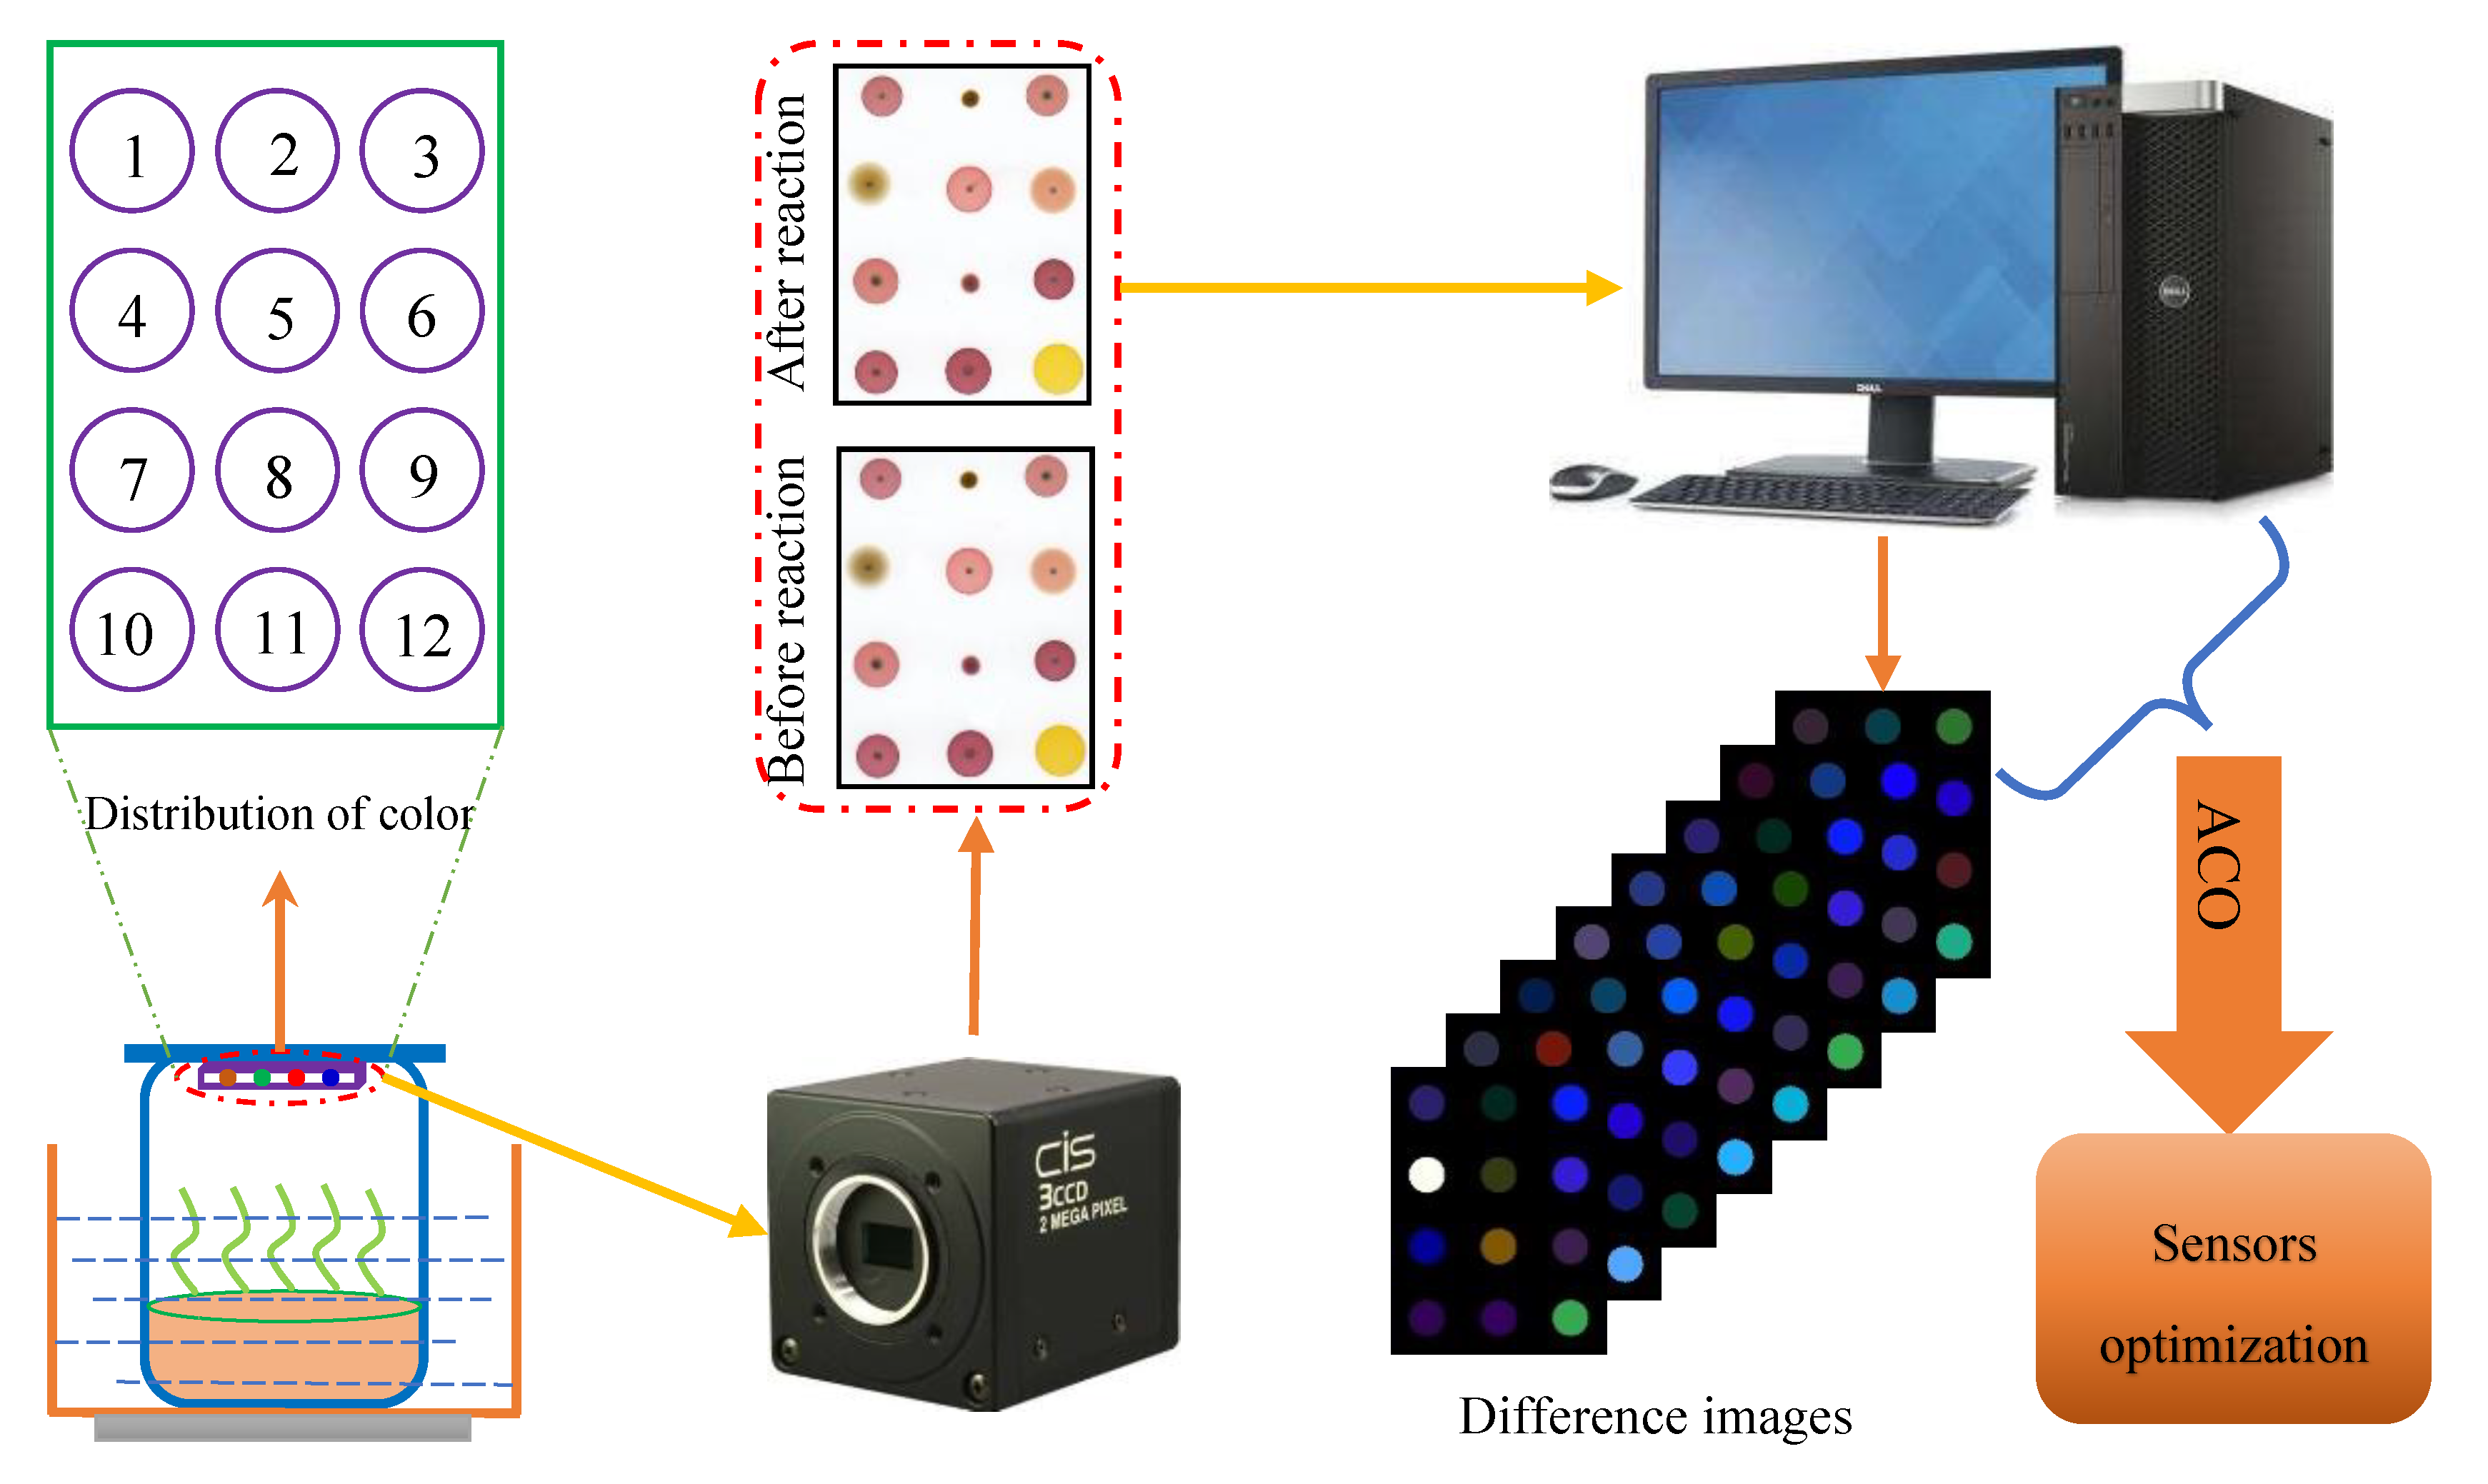
2.4. Data Acquisition and Preprocessing
2.5. Data Analyses Methods
2.5.1. Back Propagation Neural Network
2.5.2. Ant Colony Optimization Algorithm
2.6. Software
3. Results
3.1. Reference Measurement of OD Values
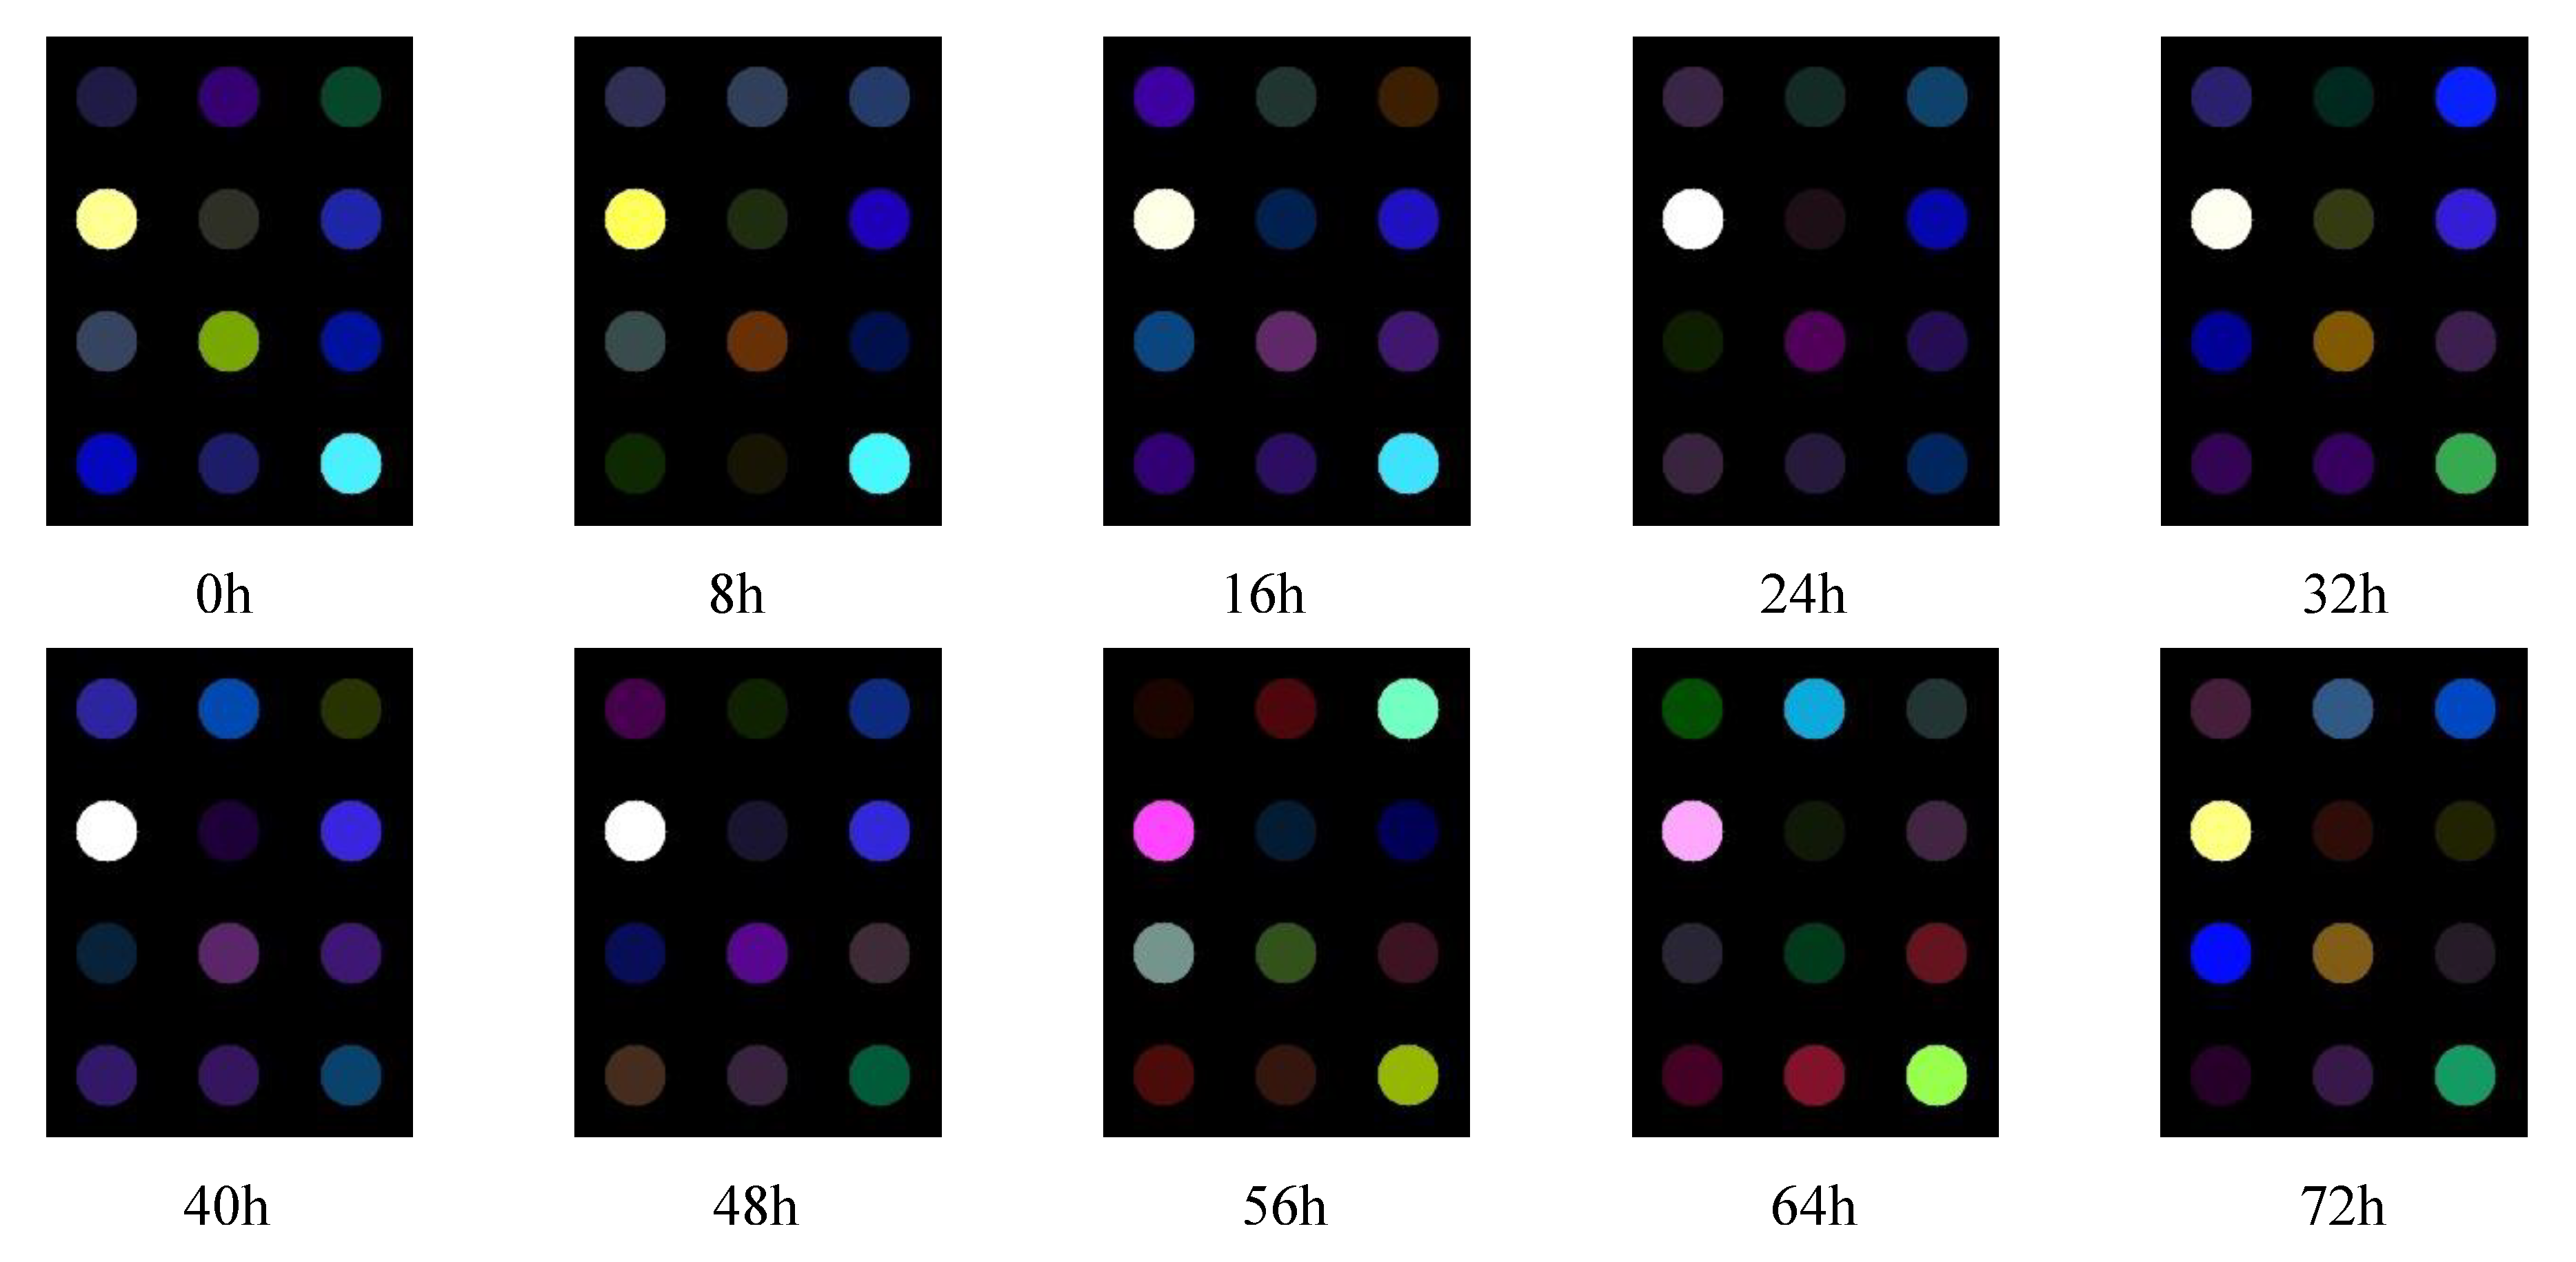
3.2. Results of Sensor Responses
3.3. Results of Sensor Optimization Using ACO
4. Conclusions
Author Contributions
Funding
Conflicts of Interest
References
- Ghorbani, F.; Younesi, H.; Ghasempouri, S.M.; Zinatizadeh, A.A.; Amini, M.; Daneshi, A. Application of response surface methodology for optimization of cadmium biosorption in an aqueous solution by Saccharomyces cerevisiae. Chem. Eng. J. 2008, 145, 267–275. [Google Scholar] [CrossRef]
- Hama, S.; Kihara, M.; Noda, H.; Kondo, A. Development of cell recycle technology incorporating nutrient supplementation for lignocellulosic ethanol fermentation using industrial yeast Saccharomyces cerevisiae. Biochem. Eng. J. 2018, 137, 23–29. [Google Scholar] [CrossRef]
- Xu, X.; Liu, C.; Niu, C.; Wang, J.; Zheng, F.; Li, Y.; Li, Q. Rationally designed perturbation factor drives evolution in Saccharomyces cerevisiae for industrial application. J. Ind. Microbiol. Biotechnol. 2018, 45, 869–880. [Google Scholar] [CrossRef]
- Zha, M.; Sun, B.; Wu, Y.; Yin, S.; Wang, C. Improving flavor metabolism of Saccharomyces cerevisiae by mixed culture with Wickerhamomyces anomalus for Chinese Baijiu making. J. Biosci. Bioeng. 2018, 126, 189–195. [Google Scholar] [CrossRef]
- Imura, M.; Iwakiri, R.; Bamba, T.; Fukusaki, E. Metabolomics approach to reduce the Crabtree effect in continuous culture of Saccharomyces cerevisiae. J. Biosci. Bioeng. 2018, 126, 183–188. [Google Scholar] [CrossRef]
- Onodera, K.; Hama, S.; Yoshida, A.; Noda, H.; Kondo, A. Development of fed-batch process for high-yielding beta-glucosidase displayed on cell surface of industrial yeast Saccharomyces cerevisiae. Biochem. Eng. J. 2017, 128, 195–200. [Google Scholar] [CrossRef]
- Takpho, N.; Watanabe, D.; Takagi, H. High-level production of valine by expression of the feedback inhibition-insensitive acetohydroxyacid synthase in Saccharomyces cerevisiae. Metab. Eng. 2018, 46, 60–67. [Google Scholar] [CrossRef] [Green Version]
- Wei, L.-J.; Kwak, S.; Liu, J.-J.; Lane, S.; Hua, Q.; Kweon, D.-H.; Jin, Y.-S. Improved squalene production through increasing lipid contents in Saccharomyces cerevisiae. Biotechnol. Bioeng. 2018, 115, 1793–1800. [Google Scholar] [CrossRef]
- Chen, H.; Heng, C.K.; Puiu, P.D.; Zhou, X.D.; Lee, A.C.; Lim, T.M.; Tan, S.N. Detection of Saccharomyces cerevisiae immobilized on self-assembled monolayer (SAM) of alkanethiolate using electrochemical impedance spectroscopy. Anal. Chim. Acta 2005, 554, 52–59. [Google Scholar] [CrossRef]
- Chen, S.F.; Huang, C.Z.; Tan, K.J. Rapid and sensitive detection and characterization of Saccharomyces cerevisiae by light scattering method. Chem. J. Chin. Univ. Chin. 2006, 27, 1023–1027. [Google Scholar]
- Chlup, P.H.; Conery, J.; Stewart, G.G. Detection of mannan from Saccharomyces cerevisiae by flow cytometry. J. Am. Soc. Brew. Chem. 2007, 65, 151–156. [Google Scholar] [CrossRef]
- Beuermann, T.; Egly, D.; Geoerg, D.; Klug, K.I.; Storhas, W.; Methner, F.-J. On-line carbon balance of yeast fermentations using miniaturized optical sensors. J. Biosci. Bioeng. 2012, 113, 399–405. [Google Scholar] [CrossRef]
- Wang, W.; Jiang, H.; Liu, G.; Chen, Q.; Mei, C.; Li, K.; Huang, Y. Quantitative analysis of yeast growth process based on FT-NIR spectroscopy integrated with Gaussian mixture regression. RSC Adv. 2017, 7, 24988–24994. [Google Scholar] [CrossRef] [Green Version]
- Wang, W.; Jiang, H.; Liu, G.-H.; Mei, C.-L.; Ji, Y. Qualitative prediction of yeast growth process based on near infrared spectroscopy. Chin. J. Anal. Chem. 2017, 45, 1137–1141. [Google Scholar] [CrossRef]
- Messina, V.; Sancho, A.; Walsoee de Reca, N. Monitoring odour of heated extra-virgin olive oils from Arbequina and Manzanilla cultivars using an electronic nose. Eur. J. Lipid Sci. Technol. 2015, 117, 1295–1300. [Google Scholar] [CrossRef]
- Wei, X.; Shao, X.; Wei, Y.; Cheong, L.; Pan, L.; Tu, K. Rapid detection of adulterated peony seed oil by electronic nose. J. Food Sci. Technol. Mysore 2018, 55, 2152–2159. [Google Scholar] [CrossRef]
- Wu, H.; Yue, T.; Xu, Z.; Zhang, C. Sensor array optimization and discrimination of apple juices according to variety by an electronic nose. Anal. Methods 2017, 9, 921–928. [Google Scholar] [CrossRef]
- Xu, K.; Wang, J.; Wei, Z.; Deng, F.; Wang, Y.; Cheng, S. An optimization of the MOS electronic nose sensor array for the detection of Chinese pecan quality. J. Food Eng. 2017, 203, 25–31. [Google Scholar] [CrossRef]
- Gebicki, J.; Szulczynski, B. Discrimination of selected fungi species based on their odour profile using prototypes of electronic nose instruments. Measurement 2018, 116, 307–313. [Google Scholar] [CrossRef]
- Campagnoli, A.; Cheli, F.; Polidori, C.; Zaninelli, M.; Zecca, O.; Savoini, G.; Pinotti, L.; Dell’Orto, V. Use of the electronic nose as a screening tool for the recognition of durum wheat naturally contaminated by deoxynivalenol: A preliminary approach. Sensors 2011, 11, 4899–4916. [Google Scholar] [CrossRef]
- Sahgal, N.; Magan, N. Fungal volatile fingerprints: Discrimination between dermatophyte species and strains by means of an electronic nose. Sens. Actuator B Chem. 2008, 131, 117–120. [Google Scholar] [CrossRef] [Green Version]
- Hudon, G.; Guy, C.; Hermia, J. Measurement of odor intensity by an electronic nose. J. Air Waste Manag. Assoc. 2000, 50, 1750–1758. [Google Scholar] [CrossRef]
- Szulczynski, B.; Namiesnik, J.; Gebicki, J. Determination of odour interactions of three-component gas mixtures using an electronic nose. Sensors 2017, 17, 2380. [Google Scholar] [CrossRef]
- Szulczynski, B.; Arminski, K.; Namiesnik, J.; Gebicki, J. Determination of odour interactions in gaseous mixtures using electronic nose methods with artificial neural networks. Sensors 2018, 18, 519. [Google Scholar] [CrossRef]
- Yan, L.; Liu, J.; Jiang, S.; Wu, C.; Gao, K. The regular interaction pattern among odorants of the same type and its application in odor intensity assessment. Sensors 2017, 17, 1624. [Google Scholar] [CrossRef]
- Li, Z.; Askim, J.R.; Suslick, K.S. The optoelectronic nose: Colorimetric and fluorometric sensor arrays. Chem. Rev. 2019, 119, 231–292. [Google Scholar] [CrossRef]
- Lin, H.; Man, Z.-X.; Kang, W.-C.; Guan, B.-B.; Chen, Q.-S.; Xue, Z.-L. A novel colorimetric sensor array based on boron-dipyrromethene dyes for monitoring the storage time of rice. Food Chem. 2018, 268, 300–306. [Google Scholar] [CrossRef]
- Hidayat, M.A.; Puspitaningtyas, N.; Gani, A.A.; Kuswandi, B. Rapid test for the determination of total phenolic content in brewed-filtered coffee using colorimetric paper. J. Food Sci. Technol. Mysore 2017, 54, 3384–3390. [Google Scholar] [CrossRef]
- Kim, S.-Y.; Ko, J.-A.; Kang, B.-S.; Park, H.-J. Prediction of key aroma development in coffees roasted to different degrees by colorimetric sensor array. Food Chem. 2018, 240, 808–816. [Google Scholar] [CrossRef]
- Suslick, B.A.; Feng, L.; Suslick, K.S. Discrimination of complex mixtures by a colorimetric sensor array: Coffee aromas. Anal. Chem. 2010, 82, 2067–2073. [Google Scholar] [CrossRef]
- Chung, S.; Park, T.S.; Park, S.H.; Kim, J.Y.; Park, S.; Son, D.; Bae, Y.M.; Cho, S.I. Colorimetric sensor array for white wine tasting. Sensors 2015, 15, 18197–18208. [Google Scholar] [CrossRef] [PubMed]
- Ouyang, Q.; Zhao, J.; Chen, Q.; Lin, H. Classification of rice wine according to different marked ages using a novel artificial olfactory technique based on colorimetric sensor array. Food Chem. 2013, 138, 1320–1324. [Google Scholar] [CrossRef] [PubMed]
- Chen, Q.; Liu, A.; Zhao, J.; Ouyang, Q.; Sun, Z.; Huang, L. Monitoring vinegar acetic fermentation using a colorimetric sensor array. Sens. Actuator B Chem. 2013, 183, 608–616. [Google Scholar] [CrossRef]
- Chen, Q.; Sun, C.; Ouyang, Q.; Liu, A.; Li, H.; Zhao, J. Classification of vinegar with different marked ages using olfactory sensors and gustatory sensors. Anal. Methods 2014, 6, 9783–9790. [Google Scholar] [CrossRef]
- Guan, B.; Zhao, J.; Cai, M.; Lin, H.; Yao, L.; Sun, L. Analysis of volatile organic compounds from Chinese vinegar substrate during solid-state fermentation using a colorimetric sensor array. Anal. Methods 2014, 6, 9383–9391. [Google Scholar] [CrossRef]
- Guan, B.; Zhao, J.; Lin, H.; Zou, X. Characterization of volatile organic compounds of vinegars with novel electronic nose system combined with multivariate analysis. Food Anal. Methods 2014, 7, 1073–1082. [Google Scholar] [CrossRef]
- Wang, L.; Zeng, Y.; Chen, T. Back propagation neural network with adaptive differential evolution algorithm for time series forecasting. Expert Syst. Appl. 2015, 42, 855–863. [Google Scholar] [CrossRef]
- Socha, K.; Dorigo, M. A colony optimization for continuous domains. Eur. J. Oper. Res. 2008, 185, 1155–1173. [Google Scholar] [CrossRef]


| Subsets | S. N. a | Range (%) | Mean | S. D. b |
|---|---|---|---|---|
| Calibration set | 114 | 0.001–9.120 | 5.7080 | 3.1233 |
| Validation set | 38 | 0.001–8.900 | 5.6734 | 3.2858 |
| Model | Number of Color Components | Calibration Set | Validation Set | ||
|---|---|---|---|---|---|
| RMSECV | RMSEP | ||||
| Case 1 | 2 | 0.9362 ± 0.0272 | 0.8187 ± 0.1580 | 0.8837 ± 0.0725 | 1.0033 ± 0.1452 |
| Case 2 | 4 | 0.9638 ± 0.0221 | 0.6018 ± 0.1531 | 0.8864 ± 0.0848 | 1.0015 ± 0.1513 |
| Case 3 | 5 | 0.9690 ± 0.0254 | 0.5656 ± 0.1625 | 0.8965 ± 0.0786 | 0.9541 ± 0.1526 |
© 2019 by the authors. Licensee MDPI, Basel, Switzerland. This article is an open access article distributed under the terms and conditions of the Creative Commons Attribution (CC BY) license (http://creativecommons.org/licenses/by/4.0/).
Share and Cite
Jiang, H.; Xu, W.; Chen, Q. Monitoring of Cell Concentration during Saccharomyces cerevisiae Culture by a Color Sensor: Optimization of Feature Sensor Using ACO. Sensors 2019, 19, 2021. https://doi.org/10.3390/s19092021
Jiang H, Xu W, Chen Q. Monitoring of Cell Concentration during Saccharomyces cerevisiae Culture by a Color Sensor: Optimization of Feature Sensor Using ACO. Sensors. 2019; 19(9):2021. https://doi.org/10.3390/s19092021
Chicago/Turabian StyleJiang, Hui, Weidong Xu, and Quansheng Chen. 2019. "Monitoring of Cell Concentration during Saccharomyces cerevisiae Culture by a Color Sensor: Optimization of Feature Sensor Using ACO" Sensors 19, no. 9: 2021. https://doi.org/10.3390/s19092021
APA StyleJiang, H., Xu, W., & Chen, Q. (2019). Monitoring of Cell Concentration during Saccharomyces cerevisiae Culture by a Color Sensor: Optimization of Feature Sensor Using ACO. Sensors, 19(9), 2021. https://doi.org/10.3390/s19092021