Abstract
Various challenges should be considered when measuring photovoltaic array power and energy in pulse width modulation (PWM) charge controllers. These controllers are frequently used not only in stand-alone photovoltaic (SAPV) systems, but may also be found in photovoltaic (PV) self-consumption systems with battery storage connected to the electricity grid. An acceptable solution may be reached using expensive data acquisition systems (DASs), although this could be generally disproportionate to the relatively low cost of SAPV systems. Therefore, the aim of this paper is to develop new and effective monitoring techniques which will provide the PV array direct current (DC), output power (PA,dc), and PV array DC output energy (EA), thus avoiding the use of sophisticated DASs and providing high accuracy for the calculated parameters. Only transducers and electronic circuits that provide the average and true rms values of the PWM signals are needed. The estimation of these parameters through the aforementioned techniques showed high accuracy for both series and shunt PWM battery charge controllers. Normalized root mean square error (NRMSE) was lower than 2.4%, normalized mean bias error (NMBE) was between −1.5% and 1.1%, and mean absolute percentage error (MAPE) was within 1.6%.
1. Introduction
Off-grid and mini grid systems with renewable energy have gained a competitive advantage over the last five years, and this change is expected to accelerate in the future [1]. More than half of the populations of developing countries live in rural regions [2], where photovoltaic solar energy can play a key role in rural electrification. Therefore, a stand-alone photovoltaic (SAPV) system could be a good solution for remote places [3,4,5]. It is estimated that around 133 million people accessed lighting and other electricity services using off-grid renewable energy solutions in 2016; 24 million of them were using a solar home system (SHS) [6]. In 2013, it was estimated that there were more than six million SHS systems [7]. SHS systems are low cost SAPV systems with very low array power. In addition, in recent years, the reduction in price of PV modules (by 81%) and batteries since the end of 2009 [8] has led to a growing interest in “living off-grid” or “leaving the grid” [9].
Photovoltaic (PV) systems that are not connected to the public grid can be defined as SAPV or off-grid PV systems, and they are designed to cover electricity needs. Overall, the basic elements of SAPV systems are a PV generator, a battery charge controller (BCC), an energy storage system, loads or appliances, and an inverter is also used when there are alternating current (AC) loads. Battery charge controllers regulate the PV array, the load, and the battery current in order to prevent battery over-discharging and overcharging. BCCs are often categorized by the strategies used to regulate the charge from the PV generator to the energy storage system [10,11,12,13]. Pulse width modulation (PWM) and maximum power point tracking (MPPT) are the most widely used controllers in the SAPV industry [14].
A SAPV system is solely responsible for supplying the electric power to meet the load needs, and it operates independently of the electric utility grid. For these reasons, adequate performance must be ensured. The real operation of PV systems depends on local uncertain weather conditions, such as relative dust, ambient temperature, relative humidity, global solar radiation, etc. [15]. An inspection of functioning systems under real climate conditions showed the technical issues, and also a way to improve the systems [16]. Photovoltaic energy harvesting is also influenced by the degradation and maintenance of the system. After the installation of PV systems, a maintenance service is needed in order to supervise their operation and to detect possible malfunctions. Maintenance operations play an important role in analyzing life expectancy and in evaluating the viability of PV systems [17], while preventive maintenance can be improved by monitoring systems [18]. It has been observed that in developing countries there is a lack of maintenance services, which necessitates a proactive program of monitoring and assistance [19]. The purposes of monitoring should be to provide useful performance information through the proper measurement of determined parameters.
Data acquisition systems are widely used for monitoring PV systems, where performance of the system has been evaluated under real conditions [20,21,22,23]. Operational monitoring of PV systems and analysis of the collected data have made continuous progress in recent years [24,25,26]. Moreover, user-friendly graphical interfaces (GUI) have improved the monitoring systems [27]. In this sense, data-acquisition systems can be managed and controlled by the GUI, which can be developed by software tools such as LabVIEW®, which allows real-time interface [28] and online real-time interface [29], or SCADA systems [30]. In addition, web-based applications are used to control and monitor photovoltaic systems, which allow the distribution of data to remote users [31]. Open hardware–software platforms are also used extensively as parts of photovoltaic monitoring systems [32], and they have also promoted the expansion of the monitoring systems [33]. A procedure for data acquisition systems has been designed with a microcontroller where Excel has been integrated by using Visual Basic program in order to plot and analyze the data in real time for Stand-Alone Systems [34]. Wireless photovoltaic monitoring systems have been designed and tested [35], where the monitoring system can be managed by a central computer which is connected to sensors by RF modules [36].
However, due to the cost of monitoring systems, these improvements can rarely be applied to small and medium SAPV systems. As can be found in practice, small PV systems are not regularly checked [37], such as professional SAPV systems or small grid-connected PV systems. Unfortunately, problems associated with technical failures in small and medium-sized PV systems are widely documented [38]. In West Africa, many projects have been implemented, ranging from solar powered borehole pumps to energy supply systems in hospital emergency departments. However, most of them have been left to deteriorate without maintenance, cleaning, and repairs [39]. A study of approximately 135 remote households in rural Thailand has found that 50% of the main components of their photovoltaic systems were damaged [40]. In Fiji, most of the 250 solar home systems (about 80%) that were installed under the Vunivaou solar home system project were found not to be functioning [41].
SAPV system monitoring can be expensive, depending on the parameters to be monitored, and can subsequently be tedious due to a lack of infrastructure, but helps to improve preventative maintenance, which, in turn, reduces the response time in the case of a system failure [18]. Moreover, proper monitoring can find potential faults and evaluate whether the PV system is still operating as expected [42]. For these reasons, the International Standard IEC Standard 61724-1 was developed by the International Electrotechnical Commission (IEC) technical committee [42]; it is a new edition of IEC 61724 that was published in 1998. However, the updated Standard 61724-1 and the previous edition are specially intended for grid-connected systems, and may not provide affordable solutions that take into account the particularities of SAPV systems [11,12].
2. Background and Objectives
As mentioned above, there are two main types of battery charge controller, the PWM and MPPT. The latter is usually an electronic DC/DC converter that operates the PV array at its maximum power point along the P–V curve. As the output power of MPPT BCC is given by DC currents and voltages, there may not be any difficulties when measuring them.
On the other hand, PWM battery charge controllers provide asymmetric waveforms. A PWM battery charge controller adjusts the duty factor (df), defined as the ratio of the pulse duration to waveform period [43], of the current signal that comes from the photovoltaic system and goes to the battery. The duty factor depends on the battery state-of-charge (SOC). These types of techniques, which are applied in lead–acid batteries, can accelerate the battery recharge and increase the life cycle performance of low-maintenance batteries [44,45]. However, between the monitoring system cost and the accuracy of the monitored data, proper monitoring of PV systems that use PWM techniques is a challenge.
Depending on the PV system size and user objectives, the required accuracy of the monitoring system is selected [42], where medium or basic accuracy may be the best option for SAPV systems. Monitoring systems with medium and basic accuracy should take one minute between acquired samples; thus, the sampling interval should be one minute maximum. However, PV systems that use PWM battery charge controllers may require a special measurement or monitoring equipment to accurately measure the provided signals [46]. Moreover, the sampling frequency of the signals should conform to the Annex A of the IEC 61724-1, which recommends that a sampling interval should be lower than the waveform period divided by two hundred in order to reconstruct the signal with an accuracy of 1% [42]. It should be highlighted that the main frequency in series and shunt charge controllers has a value from ten to hundreds of Hertz [11].
A further issue to consider in SAPV systems that use PWM battery charge controllers is the error that can be created when sampled data are used to calculate other parameters, such as the current, voltage [11], power, or energy [12]. Nevertheless, this error could be avoided if the data acquisition system (DAS) obtained synchronized and simultaneous current and voltage samples at the required sampling frequency. A DAS consists of all the components required for the monitoring process: sensors, transducers, electronic circuits, data acquisition devices or data acquisition boards, computer, etc. Therefore, synchronized and simultaneous samples are possible to obtain with advanced equipment, although this technique is rather costly, taking into account that SAPV systems, in most cases, are relatively low cost [47]. Therefore, a change in approach is needed to address the aforementioned challenges without using sophisticated and expensive monitoring systems. In this way, an alternative method, which addresses the performance analysis of SAPV systems with PWM charge controllers and batteries, was developed [12]. This method is focused on the monitoring of currents instead of power, which are used to calculate charge parameters. Charge parameters are considered as an adaptation of the energy parameters provided by the IEC Standard 61724. This method estimates the charge parameters in SAPV systems with a PWM battery charge controller each minute, without using complex and simultaneous sampling. Moreover, the method recommends using DC Hall effect transducers to measure battery, loads, and array currents, instead of shunt resistors [11].
Nevertheless, this method does not provide a solution which meets all the requirements of IEC Standard 61724-1, as it does not allow estimation of the power parameters as required, making it difficult to compare the performances of SAPV systems with different types of battery charge controller, the PWM and MPPT. In the latter, the performance analysis was carried out using energy parameters. Moreover, this method cannot obtain pulse parameters, such as low and high states or the duty factor of PWM waveforms. The duty factor can be used to estimate battery losses caused by a high SOC. Battery losses can be considered as structural losses of the SAPV system, which may be confounded by other energy losses. Moreover, once these types of losses are quantified, it will be easier to estimate other energy losses. Therefore, the aim of this paper, and herein lies its novelty, was to develop new, simple, and affordable techniques to monitor the array power in SAPV systems with PWM charge controllers, which will overcome the aforementioned drawbacks related to the different monitoring methods found in the literature. The new monitoring techniques will provide PV array DC output power (PA,dc), the duty factor (df), and PV array DC output energy (EA) without using sophisticated DASs, where data acquisition devices (DAQ) with synchronization and high sampling frequency are not needed. Furthermore, a great deal of collected data are generated, and more sophisticated DAQ devices are needed when a high sampling frequency of the measurement is required. In this sense, the proposed technique allows a sampling interval and a recording interval of one minute; therefore, there may be extra storage in the DAQ device memory, as the data generated may be extremely low compared with the first solution.
The proposed monitoring techniques, along with an unsophisticated DAQ device, require the use of sensors, transducers, or simple electronic circuits that provide the average and true rms values of the PWM signals. Moreover, from these values, different parameters may be estimated such as the df, low and high states of the PWM signals, that will not only allow estimation of PA,dc and EA, but will also permit the reconstruction of the PWM signals.
The paper is focused on developing different equations that allow estimation of the aforementioned parameters, PA,dc and EA, from only two of these three parameters: average and true rms values, and the duty factor of the PWM array waveforms (i.e., array current and voltage waveforms). The equations, which is developed in the next section, have been obtained considering “clean” PWM waveforms. However, as shown later, the “real” waveforms provided by charge controllers may have overshoot, undershoot, ringing, and positive and negative transition durations, so it is necessary to check the validity of the proposed techniques in real operation, considering different values of the duty factor. This is the main objective of this paper: to develop new and simple monitoring techniques for SAPV systems with PWM charge regulators, and to validate them considering real data obtained from two SAPV systems with different types of PWM charge controllers (shunt and series). Once the aforementioned techniques are validated, the techniques shown here can be implemented in different ways using less sophisticated and complex DAQ devices, together with average and true rms transducers. Moreover, DAQ devices can be substituted by hardware–software platforms, e.g., a Mini USB Arduino Nano board and micro SD cards as a storage elements [48], an Arduino Mega board and two SD cards [49], or an Arduino UNO board which is connected to the computer [50]. The transducers can be substituted by electronic circuits designed ad hoc to obtain two of these three parameters: average, true rms, or duty factor values. The duty factor can also be obtained using a specific microcontroller with a software routine and peripherals. In the literature, different strategies of software routines for microcontrollers to measure the waveform df can be found [51,52]. Any of these different choices can provide PA,dc and EA. However, the different ways to implement the method shown here are beyond the scope of this paper.
PA,dc and EA constitute very useful information with which to provide proper array performance, and therefore, to give adequate system performance. As is shown in IEC-61724-1, once EA is estimated from PA,dc , different yields can be obtained which indicate actual array operation relative to its rated capacity: PV array energy yield (YA) and yield losses such as array capture losses (LC) and balance of systems losses (LBOS). In this sense, the estimation of many parameters, yields, and efficiencies depends on EA. Therefore, a proper estimation of this parameter will provide a correct estimation of the aforementioned parameters, and, therefore, proper system performance will be obtained. Moreover, it must be highlighted that only two parts are considered in a PV system: the array and the BOS (balance of system, i.e., the rest of the elements of the system apart from the array: charge controller, inverter, battery, loads, wires, protections). Therefore, the PV array constitutes a fundamental part of the SAPV system. If a proper system performance is to be achieved, it is necessary to develop proper array performance through PA,dc and EA.
The manuscript proceeds with the mathematical background. Next, the new monitoring techniques to be used in SAPV are described. It is shown how to obtain PA,dc and EA parameters using a shunt and series PWM charge controllers. In Section 4, the experimental setup used to validate the aforementioned techniques is shown. Section 5 analyses the error obtained when estimating: the df, high state of PV array current (iA,H), low state of PV array current (iA,L), high state of PV array voltage (vA,H), low state of PV array voltage (vA,L), and PA,dc. Furthermore, in this section, the statistical metric indicators related to EA were calculated considering a daily reporting period. In order to quantify the error properly, the calculation of EA was only applied when there is a PWM. Finally, conclusions are summarized in Section 6.
3. Methods
Battery charge controllers use different methods to regulate the current between batteries and PV array systems. The most common are the MPPT and PWM techniques. PWM techniques may be divided in turn into two categories: shunt and series.
Series PWM battery charge controllers (Figure 1a) regulate the flow of electricity switching the series element at a fixed frequency. They open the path between the battery and the PV array, which results in the current flow being interrupted. Shunt PWM battery charge controllers (Figure 1b) can be very similar to series charge controllers, but instead of opening the circuit, they short-circuit the PV array modules output through the shunt element.
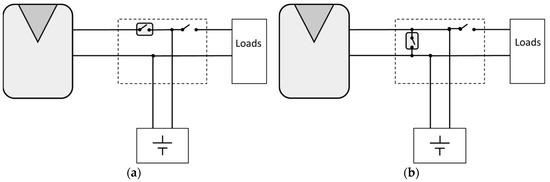
Figure 1.
Simplified stand-alone photovoltaic (SAPV) schemes: (a) SAPV with a series pulse width modification (PWM) battery charge controller (b) SAPV with a shunt PWM battery charge controller.
As can be observed in Figure 2 and Figure 3, the two state levels that characterize each PWM signal must be defined (Table 1). For series PWM battery charge controllers (Figure 2) state level #1 (ON time) is defined when PV array current has a high state (iA,H). However, PV array voltage has a low state (vA,L); this state corresponds with the PV array and the battery being connected. On the other hand, the state level #2 (OFF time) is when there is no current in the PV array and the PV array has open circuit voltage. Therefore, a low state of PV array current (iA,L) and high state of PV array voltage (vA,H) are reached.
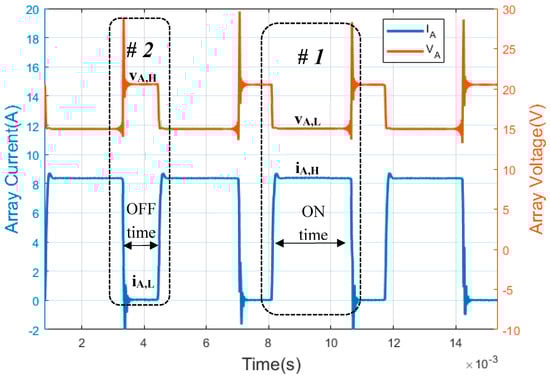
Figure 2.
Waveforms of a series PWM battery charge controller. (Y-axis left) photovoltaic (PV) array current. (Y-axis right) PV array voltage. The PWM waveforms were obtained through the experiments in this paper.
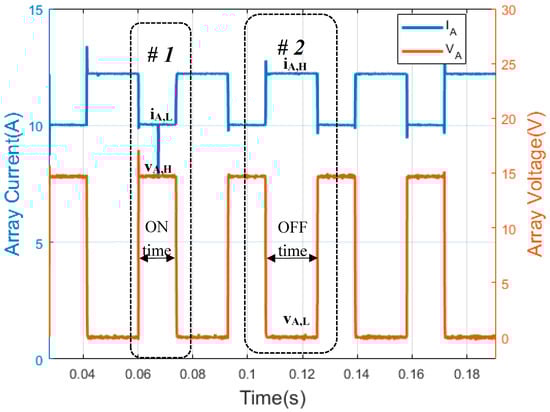
Figure 3.
Waveforms of shunt PWM battery charge controller. (Y-axis left) PV array current. (Y-axis right) PV array voltage. The PWM waveforms have been obtained through the experiments in this paper.

Table 1.
State levels of pulse width modification (PWM) battery charge controllers.
In these waveforms (Figure 2) the duty factor of the PV array current (df,i) waveforms and the duty factor of the PV array voltage (df,v) waveforms of SAPV with a series PWM battery controller can be expressed as follows:
Figure 3 shows PV array waveforms of SAPV with a shunt PWM battery controller; Figure 3 (Y-axis left) shows the PWM array current waveform and Figure 3 (Y-axis right) illustrates the PWM array voltage waveform. As can be seen in these figures, the low state of PV array current (iA,L) is used to define the state level #1, where the PV array voltage has a high state (vA,H). On the other hand, OFF time is considered when the PV array is short-circuited. Thus, there is a short-circuit current in the PV array, and the voltage across the PV array is zero, i.e., the high state of PV array current (iA,H) and the low state of PV array voltage (vA,L), respectively. As with series PWM battery charge controllers, the duty factor of the PV array voltage waveforms (df,v) and the duty factor of the PV array current waveform (df,i) can be expressed as follows:
The frequency of the PWM signal is constant in both types of PWM battery charge controllers. Moreover, the PWM waveform that is generated by the battery charge controllers may be considered constant over the recoding interval. The recording interval is defined as the time between records [42], and it is one minute. As shown later, the proposed technique must be used in PWM signals where at least one waveform parameter is known. In the case of series PWM battery charge controllers, the ‘low’ state of the current (iA,H) of the PV array is zero amps. Meanwhile, in the case of shunt PWM battery charge controllers, the ‘low’ state of the PV array voltage (vA,L) is zero volts.
3.1. Shunt Charge Controller—Estimated PA,dc and EA
Different techniques to determine the duty factor and power were proposed by Williams et al. for shunt battery charge controllers [53]. It was observed that their techniques provided errors, which depended on the state of battery, irradiance, and loads. A high value of energy measurement error was observed when there was a dip in irradiance. Based on the techniques proposed by Williams et al., the sampling interval was selected according to the frequency signal and does not allow reconstruction of the PWM waveform. In this sense, in this paper, another approach was developed to estimate the array power and energy when the battery is in the PWM mode for shunt PWM battery charge controllers, in order to avoid dependency on irradiance, loads, and the SOC of the battery.
The ‘low’ state PV array voltage parameter is known in shunt BCC; this parameter corresponds to the short-circuit voltage of the PV array. Because of this, the first step in this case was to estimate the PV array voltage waveform’s parameters:
where vA,Average and vA,rsm are, respectively, the average voltage values of the PV array and the true root mean square voltage of the PV array. vA,L represents the ‘low’ state of the voltage array waveform and vA,H is the ‘high’ state of the voltage array waveform.
The duty factor can be obtained as:
The ‘high’ state of the voltage can be estimated as:
The PWM voltage waveform of a PV array can be defined as follows:
Likewise, the PWM array current waveform can be estimated:
where iA,Average is the average current of the photovoltaic array, iA,rsm represents the true root mean square current of the PV array, iA,H and iA,L are the ‘high’ state and ‘low’ state of the PV current respectively and df,i depicts the duty factor of PV array current.
In such a way, the PV array current can be defined as follows:
Once iA,H, vA,H, and df are obtained, PV array DC output power (PA,dc), when the BCC is in PWM mode, is given by:
Moreover, the PV array DC output energy (EA) can be estimated as:
where τk denotes the duration of the kth recording interval within a reporting period [42].
3.2. Series Charge Controllers—Estimated PA,dc and EA
PV array DC output power and energy can be estimated if the four states of voltage and current waveforms (Table 1, series BCC), together with the df, have been previously calculated. As indicated above, the ‘low’ state of current in a PV array is known in series PWM battery charge controllers; it has a value of zero. The other states of the waveform could be estimated following the technique developed in Reference [54] for series PWM battery charge controllers, where the first parameters to be estimated are the duty factor and the ‘high’ state current of a PV array. The duty factor parameter can be expressed as a function of the average and true rms array current:
The ‘high’ state of the current can then be estimated as:
when the df,i and iA,H parameters are obtained, the PWM current waveform of the PV array can be defined as follows:
Thereafter, vA,H and vA,L can be obtained:
In this way, the PV array voltage can be defined as follows:
Similarly to shunt PWM battery charge controllers, PV array DC output power and energy in the regulation setpoint can be estimated as:
In short, electronic terms, such as the average and the root mean square voltage and current of a signal, are used in the proposed techniques for shunt and series PWM battery charge controllers. These can easily be obtained with inexpensive electronic circuits. Moreover, the former may be monitored using a sampling and recording interval of one minute. Using these values obtained previously, the first step to be accomplished is to determine the df of the PWM voltage (shunt) and the PWM array current (series) waveform. The second step is to estimate the ‘high’ state of PWM voltage (shunt) and current (series) waveform of the array and afterwards the ‘low’ and ‘high’ state of PWM current (shunt) or voltage (series) waveform of the array can be estimated. Finally, PV array DC output power and energy provided by the array in the PWM mode can be estimated. Different techniques to measure SAPV systems with a Pulse Width Modulation battery charge controllers are summarized in Table 2.
Table 2.
Monitoring SAPV systems with pulse width modulation battery charge control.
4. Experimental Set-Up
Two SAPV systems, their sensors, and a data logger system were installed in the Higher Polytechnic School of Jaén (latitude: 37 deg 46′00″ N and longitude 3 deg 47′0″ W), Figure 4. The monitoring system provided the data that were used to verify the monitoring techniques described above. In both systems, the modules are aligned to the south, and the tilt angle of the PV modules is 50° to the horizontal ground.
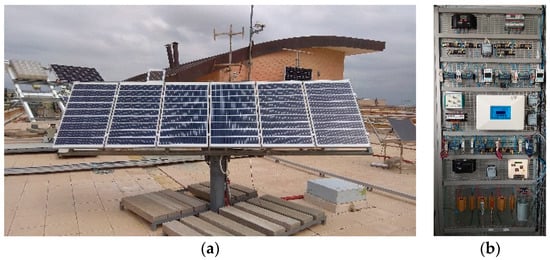
Figure 4.
SAPV systems installed in the Higher Polytechnic School of Jaén. (a) PV generators and (b) BCCs, sensors, and traducers.
Each SAPV system has a PV array which is composed of two modules connected in parallel, a PWM battery charge controller, a 12 V 200 Ah lead–acid battery, and a load set with which different load profiles can be provided. In system #1, there is a series PWM battery charge controller, while system #2 uses a shunt PWM battery charge controller.
The PV array current (IA) was measured through calibrated shunt resistance (Table 3). On the other hand, the voltage parameter was measured directly by the DAS. These parameters were measured by high accuracy DAS, where the sampling interval was set at 200 times the maximum frequency of the signal to be measured, which follows the recommendation of Annex A of the IEC 61724-1 standard. The device used to measure the parameters was a cDAQ-9172 chassis with two modules to collect the parameters: 2×NI 9229. It needs to be highlighted that this hardware was used to verify the proposed monitoring technique. Table 3 also shows the measured and recorded parameters, as well as those of the National Instruments (NI) modules used in the DAS.
Table 3.
Measured and recorded parameters, transducers, and DAS NI modules.
A graphical user interface (GUI) (Figure 5) developed in LabVIEW@ was used to measure array currents and voltage, following the recommendations of Annex A of the IEC 61724-1 standard. The application allowed communication with the DAS and recorded the monitored data. In this sense, the real PWM waveforms from two types of charge controllers were obtained. The high state, the low state, and the duty factor of current and voltage waveforms were obtained and constituted the reference values. Mean current, mean voltage, true root mean square current, and voltage of the real PWM waveforms ertr calculated with a virtual tool developed by Matlab®, and they were be used as inputs for the proposed techniques. All these parameters were estimated according to the 181TM IEEE standard on transitions, pulses, and related waveforms [43]. Later, mean current, mean voltage, true root mean square current, and voltage were processed according to the proposed techniques to estimate the high state, the low state, and the duty factor of current and voltage waveforms. These values constituted the estimated values. Furthermore, array DC power and energy were calculated by using reference and estimated values (Figure 6). Finally, the collected data were used to calculate the error between the different parameters, reference and estimated, in order to analyze and validate the aforementioned techniques.
where k denotes the number of samples in a reporting period, and ik and vk are the current and voltage values in the kth sample.
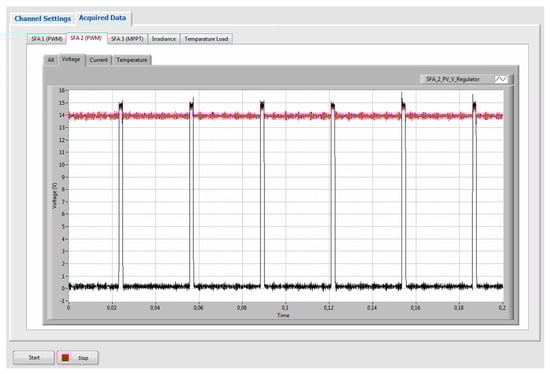
Figure 5.
The graphical user interface for SAPV systems monitoring used in the experiment.
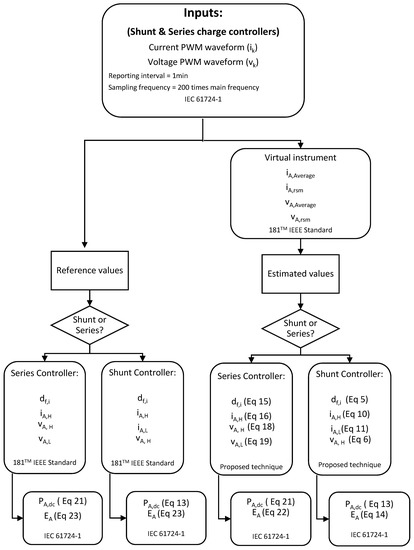
Figure 6.
A flowchart of the experimental setup to validate the proposed monitoring techniques using real PWM signals from two SAPV systems (series and shunt PWM charge controllers).
5. Results and Discussion
The measurement campaign was carried out from October to November 2017. Although the recorded data correspond to complete days, the array data collected when the battery charge controller operated at PWM mode have only been considered in order to restrict the analysis to PWM signals.
The aforementioned analysis was focused on the estimation of the duty factor, low and high states of the current, low and high states of voltage, array power dc, and daily array energy dc in both types of battery charge controller: shunt and series. There was no set of validation techniques which could be used for all modeling; in fact, plots can be a good diagnostic alternative where there are measured and estimated parameters [55]. Therefore, three different statistical metric indicators were used in order to provide robust validation. These parameters have been used in other similar studies [11,56,57]. In order to validate the proposed technique, statistical metric indicators were used: normalized root mean square error (NRMSE), Equation (24), normalized mean bias error (NMBE) Equation (25), mean absolute percentage error (MAPE), Equation (26), and percentage error (PE) Equation (27).
where X represents the parameter considered and N is the number of samples.
The sampling frequency was selected according to the 61724-1 standard [42]. In this sense, reference values are the collected samples at this frequency, while estimated values were obtained through the proposed technique. From PWM waveforms, the corresponding average and true RMS values were obtained considering a sampling and recording interval of one minute. The collected data were used to estimate the duty factor and the different state levels, through the techniques described in Section 3. Afterwards, reference and estimated values were compared. Current and voltage parameters were measured with shunt resistors and directly by DAS, respectively.
The results obtained for all samples after applying Equations (24)–(26) are presented in Table 4 and Table 5.
Table 4.
A shunt PWM battery charge controller. Normalized root square mean error (NRMSE), normalized mean bias error (NMBE), and mean absolute percentage error (MAPE) between reference versus estimated parameters (Equations (24)–(26)).
Table 5.
A series PWM battery charge controller. Normalized root mean square error (NRMSE), normalized mean bias error (NMBED), and mean absolute percentage error (MAPE) between reference versus estimated parameters (Equations (24)–(26)).
5.1. Shunt Charge Controller
Figure 7, Figure 8 and Figure 9 plot estimated state levels versus reference levels. df, vA,H, iA,H, and iA,L were estimated based on Equations (5), (6), (10), and (11), respectively. Equations (13) and (14) were used to estimate power PV array DC output power and energy, respectively. In this type of BCC, the low state of the array voltage should be zero volts. There is also an appropriate range in Figure 7b, to enhance visual perception.

Figure 7.
A shunt PWM battery charge controller reference versus estimated parameters. (a) df, (b) vA,H, (c) iA,H, (d) iA,L.
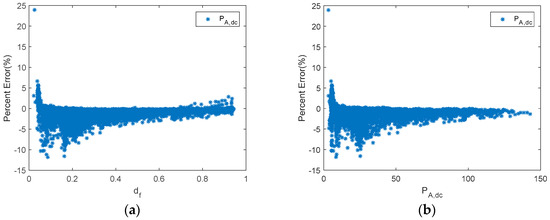
Figure 8.
A shunt PWM battery charge controller. (a) Percent error of PA,dc versus df. (b) Percent error of PA,dc versus PA,dc.
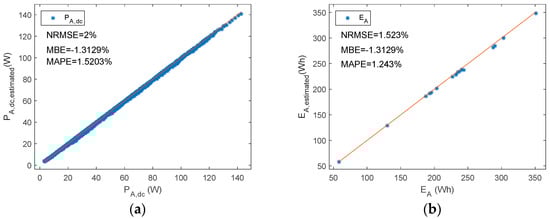
Figure 9.
A shunt PWM battery charge controller reference versus estimated parameters (a) PA,dc (b) EA.
Figure 10 summarizes the NMRSE, NMBE, and MAPE of shunt BCC, where the results have been divided into ten intervals of the duty factor. In the study of shunt charge controllers, and for all the parameters considered, NRMEs were below 2.4%. Likewise, NMBEs ranged between −1.5% and 0.5%, and the MAPE was lower than 1.6%. On the other hand, as is shown in Figure 10a, the NRME had the highest value for iA,H when the df is was the range of 0.9–1.0, and it was 6%. Nevertheless, the NRME for iA,H decreased when the df decreased to negligible values (<1% when df < 0.6). On the other hand, the other parameters, df, vA,H, iA,L, and PA,dc decreased when the df increased. The MBEs and MAPEs had the same tendency as NRMEs, but the NMBE was lower than 4.2% and the MAPE was below 5.4%. Therefore, PA,dc had the biggest NRME, NMBE, and the MAPE when the df approached zero. Nevertheless, very low duty factors were reached when there was a high battery SOC; therefore, the estimated energy from the PV array that goes to the battery may be negligible.
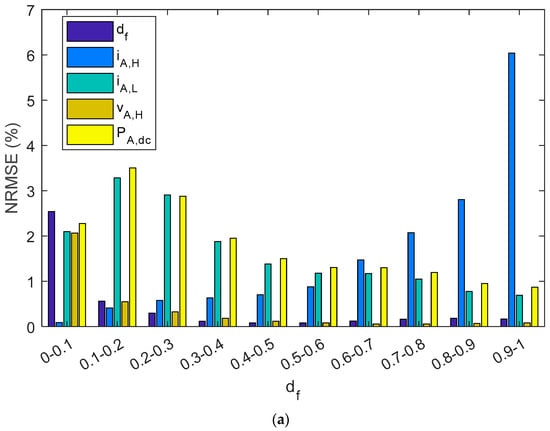
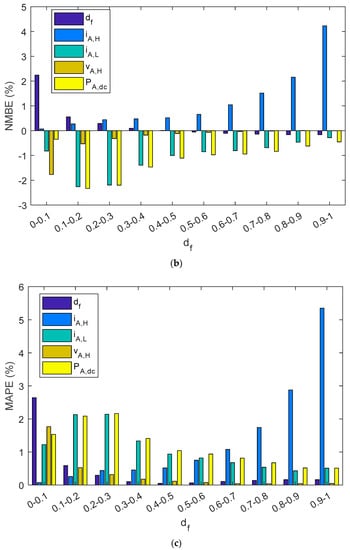
Figure 10.
A shunt PWM battery charge controller bar diagram shows: (a) NRMSE, (b) NMBE, (c) MAPE. The results have been grouped in ten intervals of the duty factor.
As has been shown, the error in the estimation of the different parameters depends on the duty factor. Williams et al. proposed different techniques in order to estimate PA,dc in shunt BCC [53]. The results of their proposals also showed the PE dependency on the duty factor. In this sense, when the duty factor was lower than 0.6, the PE was higher than 5%. Moreover, when the duty factor was lower than 0.3 and higher than 0.2, the percent error rate was between 7.5% and 17.5%. However, there is no information about PE when duty factor is lower than 0.2.
On the other hand, the PE obtained using the proposed monitoring techniques is shown in Figure 8, which, throughout most of the measurement range, provided slight differences between estimated and reference values. Moreover, results are shown considering duty factors higher than 0.02. As is shown in Figure 8, when the duty factor was higher than 0.35, the PE was lower than 5%. On the other hand, when the duty factor was higher than 0.2 and lower than 0.35, the PE had a value lower than 8%. Meanwhile, the PE with a value of duty factor lower than 0.2 had the higher value, and the values were lower than 12%. In addition, they were generally lower than 10% when the duty factor was lower than 0.2. As can be seen, the results are considerably better than those obtained by Williams et al. Moreover, it should be taken into account that the mean absolute percentage error (MAPE) was 3.6% in the duty factor range 0–0.1, and 2.1% in the duty factor range 0.1–0.2. It must be outlined that very low duty factors were reached when there was a high battery SOC. Therefore, the estimated array power to battery in this case, may be negligible. Thus, the estimated energy from the PV array will be almost unaffected.
5.2. Series Charge Controller
Similarly, Figure 11 plots estimated state levels versus reference ones. Meanwhile, for the series BCC df, iA,H, vA,H, and vA,L were estimated using Equations (15), (16), (19), and (20), respectively. The low state of the array current should be zero amps for this series BCC. In order to enhance visual perception, an appropriate range has been selected in Figure 11c,d.
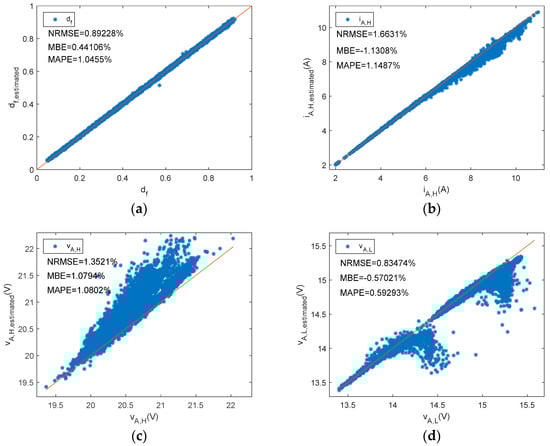
Figure 11.
A series PWM battery charge controller. Reference versus estimated parameters. (a) df, (b)iA,H, (c) vA,H, (d) vA,L.
Figure 12 shows the PE of PA,dc versus df and PA,dc, while Figure 13 plots estimated PA,dc and EA versus reference ones.
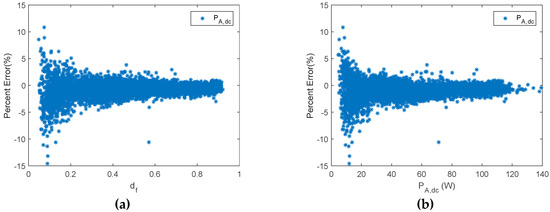
Figure 12.
A series PWM battery charge controller. (a) Percent error of PA,dc versus df. (b) Percent error of PA,dc versus PA,dc.
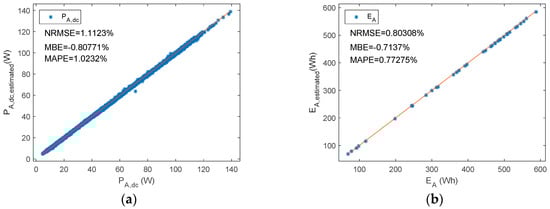
Figure 13.
A series PWM battery charge controller. Reference versus estimated parameters. (a) PA,dc (b) EA.
As can be observed in Table 5 and Figure 14, estimated parameters in the series charge controllers slightly differed from reference values as NRMEs was lower than 1.7%, NMBE ranged between −1.15% and 1.1%, and MAPE was below 1.15%. In addition, when parameters were grouped into different intervals as a function of the duty factor, the NRME and MAPE became a little bit higher as the df diminishes for df, iA,H, vA,L, and PA,dc, but always remained below 7.5%. As with shunt BCCs, when there is a low df (i.e., battery has a high SOC), the estimated array power and energy may be negligible. NMBEs had the same tendency for these parameters, but had a positive value for the df and vA,H, and negative values for iA,H, vA,L and PA,dc. This implies an overestimation for the df and vA,H and a sub-estimation of the iA,H, vA,L, and PA,dc. On the other hand, when vAH had a higher duty factor value, the NMBE, NRME, and MAPE were higher. As can be observed in Equation (1), the duty factor corresponding to the voltage waveform was proportional to the subtraction of one minus the duty factor of the current waveform. Thus, vA,H is the voltage when the battery and the PV array are not connected (State level #1).
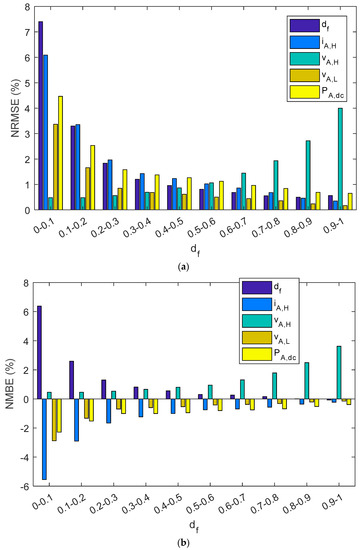
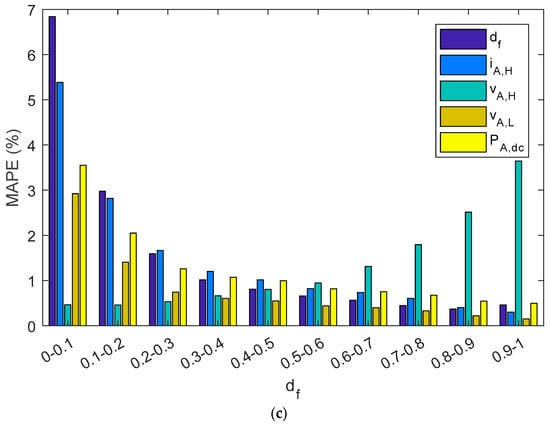
Figure 14.
A series PWM battery charge controller bar diagram shows: (a) NRMSE, (b) NMBE, (c) MAPE. The results have been grouped in ten intervals of the duty factor.
6. Conclusions
Various issues should be considered when monitoring array current and voltage signals of SAPV systems with PWM battery charge controllers in order to estimate PA,dc and EA. The sampling frequency, the use of simultaneous channels, and the large amount of data collected, which have all been highlighted throughout this paper, can be obtained with advanced devices, although this choice could be inappropriate due to the relatively low cost of most SAPV systems.
In this paper, new and simple monitoring techniques for SAPV with shunt and series PWM battery charge controllers have been developed. These techniques can estimate PA,dc and EA without using complex and sophisticated DASs. For this purpose, it is necessary to estimate the df,i of the PWM array current waveform for series PWM battery charge controllers, or the df,v of the PWM array voltage waveform for shunt PWM battery charge controllers. Moreover, iA,H, iA,L, vA,H, and vA,L parameters can be estimated by measuring the average and the true mean square values of the signals. From the true rsm and average values, the techniques shown here allow estimation of PA,dc and EA, considering df and one of the previous values (average or true mean square). Only unsophisticated DAQ devices, together with transducers, sensors, or electronic circuits designed ad hoc, are needed. Moreover, the different estimated parameters will permit the reconstruction of the PWM signals.
The equations developed were obtained considering “clean” PWM waveforms. However, the “real” waveforms provided by charge controllers may have overshoot, undershoot, ringing, or positive and negative transition durations, so the validity of the proposed techniques was checked in real operation with different values of the duty factor. In order to validate the proposed techniques, the array PWM signals corresponding to two SAPV systems with a series and a shunt PWM battery charge controllers were monitored, respectively, through a sophisticated DAS with a sampling and recording interval in compliance with the Annex A of the IEC 61724, and through their average and true RMS values, considering only a sampling and recording interval of one minute.
Estimated parameters in series charge controllers slightly differed from reference values, as NRMEs were lower than 1.7%, the NMBE ranged between −1.15% and 1.1%, and the MAPE was below 1.15%. Similarly, in shunt battery charge controllers NRMEs were below 2.4%. Likewise, NMBEs ranged between −1.5% and 0.5% and the MAPE was lower than 1.6%. In accordance with the results obtained, the proposed techniques allow calculation of PV array DC output power (PA,dc) and PV array DC output energy (EA), avoiding the use of complex and expensive DASs.
Once the monitoring techniques have been validated, the method shown here can be implemented in different ways using basic and simple DAQ devices, together with average and true rms transducers. Moreover, the DAQ device can even be substituted by open hardware–software platforms, and the transducers can be substituted by electronic circuits designed ad hoc to obtain average and true rms values. Any of these different choices can help to provide PA,dc and EA in a simple way. Further investigation should be addressed in order to design prototypes with open source hardware/software which allow application of the techniques shown here.
Furthermore, the techniques here shown to monitor the array power in SAPV systems with PWM charge regulators may be also used to monitor PWM signals in other applications, such as the speed control of DC motors and the brightness adjustment of light emitting diodes (LED), which may be controlled by PWM dimming as it allows adjustment of the average LED current [58].
Author Contributions
All authors contributed equally to this work.
Funding
This research was supported in part by Project entitled: “Nuevos servicios de red para microredes renovables inteligentes. Contribución a la generación distribuida residencial” Grant No. ENE 2017-83860-R. This projed is funded by the Agencia Estatal de Investigación (AEI) and the Fondo Europeo de Desarrollo Regional (FEDER).
Acknowledgments
The authors wish to thank to the Universidad de Jaén for the programme: “Plan de Apoyo a la I+D+I 2014-2015. Prorrogado hasta 2016”. We also would like to acknowledge anonymous reviewers for their kind and interesting comments that have helped us to improve the manuscript.
Conflicts of Interest
The authors declare no conflict of interest.
Abbreviations
| BCC | Battery charge controller |
| BOS | Balance of systems |
| DAS | Data acquisition systems: sensors, transducers, electronic circuit, data acquisition devices or data acquisition boards, computer, etc. |
| DAQ | Data acquisition device |
| DC | Direct current |
| df | Duty factor |
| df,i | Duty factor of PV array current waveform |
| df,v | Duty factor of PV array voltage waveform |
| EA | PV array DC output energy |
| IA (A) | Array current |
| iA,average | Average current of the PV array |
| iA,H | ‘High’ state of current of PV array |
| iA,L | ‘Low’ state of current of PV array |
| iA,rsm | True root mean square current of the PV array |
| IL (A) | Load current |
| IS (A) | Battery current |
| ISC (A) | Short circuit current |
| IEC | International Electrotechnical Commission |
| MAPE | Mean absolute percentage error |
| MPPT | Maximum power point tracker |
| NMBE | Normalized mean bias error |
| NRMSE | Normalized root mean square error |
| PV | Photovoltaic |
| PA,dc | PV array DC output power |
| PWM | Pulse width modulation |
| SAPV | Stand-alone photovoltaic |
| SHSs | Solar home systems |
| SOC | State-of-charge |
| VA (V) | Array output voltage |
| vA,average | Average voltage of the PV array |
| vA,H | ‘High’ state of voltage of PV array |
| vA,L | ‘Low’ state of voltage of PV array |
| vA,rsm | True root mean square voltage of the PV array |
| VL (V) | Load voltage |
| VOC | Open circuit voltage |
| VS (V) | Battery voltage |
References
- International Energy Agency. Energy Access Outlook 2017: From Poverty to Prosperity; International Energy Agency: Paris, France, 2017; Volume 94. [Google Scholar]
- Kaundinya, D.P.; Balachandra, P.; Ravindranath, N.H. Grid-connected versus stand-alone energy systems for decentralized power-A review of literature. Renew. Sustain. Energy Rev. 2009, 13, 2041–2050. [Google Scholar] [CrossRef]
- Ghaib, K.; Ben-Fares, F.-Z. A design methodology of stand-alone photovoltaic power systems for rural electrification. Energy Convers. Manag. 2017, 148, 1127–1141. [Google Scholar] [CrossRef]
- Alnejaili, T.; Drid, S.; Mehdi, D.; Chrifi-Alaoui, L.; Belarbi, R.; Hamdouni, A. Dynamic control and advanced load management of a stand-alone hybrid renewable power system for remote housing. Energy Convers. Manag. 2015, 105, 377–392. [Google Scholar] [CrossRef]
- Salas, V.; Olías, E.; Barrado, A.; Lázaro, A. Review of the maximum power point tracking algorithms for stand-alone photovoltaic systems. Sol. Energy Mater. Sol. Cells 2006, 90, 1555–1578. [Google Scholar] [CrossRef]
- IRENA (2018). Off-grid renewable energy solutions: Global and regional status and trends. IRENA, Abu Dhabi, UAE. 2018, pp. 1–20. Available online: https://www.irena.org/-/media/Files/IRENA/Agency/Publication/2018/Jul/IRENA_Off-grid_RE_Solutions_2018.pdf (accessed on 3 February 2019).
- International Renewable Energy Agency. Off-Grid Renewable Energy Systems: Status and Methodological Issues; International Renewable Energy Agency: Abu Dhabi, UAE, 2015. [Google Scholar]
- International Renewable Energy Agency. Renewable Power Generation Costs in 2017; International Renewable Energy Agency: Abu Dhabi, UAE, 2018. [Google Scholar]
- Khalilpour, R.; Vassallo, A. Leaving the grid: An ambition or a real choice? Energy Policy 2015, 82, 207–221. [Google Scholar] [CrossRef]
- Muñoz, F.J.; Echbarthi, I.; Nofuentes, G.; Fuentes, M.; Aguilera, J. Estimation of the potential array output charge in the performance analysis of stand-alone photovoltaic systems without MPPT (Case study: Mediterranean climate). Sol. Energy 2009, 83, 1985–1997. [Google Scholar] [CrossRef]
- Muñoz, F.J.; Torres, M.; Muñoz, V.; Fuentes, M. Monitoring Array Output Current and Voltage in Stand Alone Photovoltaics Systems With Pulse Width Modulated Charge Regulators. J. Sol. Energy Eng. 2013, 135. [Google Scholar] [CrossRef]
- Muñoz, F.J.; Almonacid, G.; Nofuentes, G.; Almonacid, F. A new method based on charge parameters to analyse the performance of stand-alone photovoltaic systems. Sol. Energy Mater. Sol. Cells 2006, 90, 1750–1763. [Google Scholar] [CrossRef]
- Munoz, F.J.; Jiménez, G.; Fuentes, M.; Aguilar, J.D. Power Gain and Daily Improvement Factor in Stand-Alone Photovoltaic Systems With Maximum Power Point Tracking Charge Regulators. Case of Study: South of Spain. J. Sol. Energy Eng. 2013, 135, 41011. [Google Scholar] [CrossRef]
- Phocos. Comparing PWM & MPPT Charge Controllers; Phocos: Ulm, Germany, 2015. [Google Scholar]
- Bücher, K. Site dependence of the energy collection of PV modules. Sol. Energy Mater. Sol. Cells 1997, 47, 85–94. [Google Scholar] [CrossRef]
- Ma, T.; Yang, H.; Lu, L. Long term performance analysis of a standalone photovoltaic system under real conditions. Appl. Energy 2017, 201, 320–331. [Google Scholar] [CrossRef]
- Deli, K.; Tchoffo Houdji, E.; Djongyang, N.; Njomo, D. Operation and maintenance of back-up photovoltaic systems: An analysis based on a field study in Cameroon. Afr. J. Sci. Technol. Innov. Dev. 2017, 9, 1–12. [Google Scholar] [CrossRef]
- Valer, L.R.; Manito, A.R.A.; Ribeiro, T.B.S.; Zilles, R.; Pinho, J.T. Issues in PV systems applied to rural electrification in Brazil. Renew. Sustain. Energy Rev. 2017, 78, 1033–1043. [Google Scholar] [CrossRef]
- NRECA International Ltd. Guides for Electric Cooperative Development and Rural Electrification; NRECA International Ltd.: Dhaka, Bangladesh, 2009; Volume 1, ISBN 978-0-615-29292-2. [Google Scholar]
- Daliento, S.; Chouder, A.; Guerriero, P.; Pavan, A.M.; Mellit, A.; Moeini, R.; Tricoli, P. Monitoring, diagnosis, and power forecasting for photovoltaic fields: A review. Int. J. Photoenergy 2017, 2017, 1356851. [Google Scholar] [CrossRef]
- Kalaitzakis, K.; Koutroulis, E.; Vlachos, V. Development of a data acquisition system for remote monitoring of renewable energy systems. Meas. J. Int. Meas. Confed. 2003, 34, 75–83. [Google Scholar] [CrossRef]
- Rezk, H.; Tyukhov, I.; Al-Dhaifallah, M.; Tikhonov, A. Performance of data acquisition system for monitoring PV system parameters. Meas. J. Int. Meas. Confed. 2017, 104, 204–211. [Google Scholar] [CrossRef]
- Madeti, S.R.; Singh, S.N. Monitoring system for photovoltaic plants: A review. Renew. Sustain. Energy Rev. 2017, 67, 1180–1207. [Google Scholar] [CrossRef]
- Woyte, A.; Richter, M.; Moser, D.; Mau, S.; Reich, N.; Jahn, U. Monitoring of Photovoltaic Systems: Good Practices and Systematic Analysis. J. Chem. Inf. Model. 2013, 53, 1689–1699. [Google Scholar]
- Son, J.; Park, Y.; Lee, J.; Kim, H. Sensorless PV power forecasting in grid-connected buildings through deep learning. Sensors 2018, 18, 2529. [Google Scholar] [CrossRef] [PubMed]
- Moreno-Garcia, I.M.; Palacios-Garcia, E.J.; Pallares-Lopez, V.; Santiago, I.; Gonzalez-Redondo, M.J.; Varo-Martinez, M.; Real-Calvo, R.J. Real-time monitoring system for a utility-scale photovoltaic power plant. Sensors 2016, 16, 770. [Google Scholar] [CrossRef]
- Ejgar, M.; Momin, B. Solar plant monitoring system: A review. In Proceedings of the 2017 International Conference on Computing Methodologies and Communication (ICCMC), Erode, India, 18–19 July 2017; pp. 1142–1144. [Google Scholar]
- Chouder, A.; Silvestre, S.; Taghezouit, B.; Karatepe, E. Monitoring, modelling and simulation of PV systems using LabVIEW. Sol. Energy 2013, 91, 337–349. [Google Scholar] [CrossRef]
- Torres, M.; Muñoz, F.J.; Muñoz, J.V.; Rus, C. Online Monitoring System for Stand-Alone Photovoltaic Applications—Analysis of System Performance From Monitored Data. J. Sol. Energy Eng. 2012, 134, 034502. [Google Scholar] [CrossRef]
- Figueiredo, J.M.; da Costa, J.M.G.S. An efficient system to monitor and control the energy production and consumption. In Proceedings of the 5th International Conference on European Electricity Market, Lisbon, Portugal, 28–30 May 2008; pp. 1–6. [Google Scholar]
- Tina, G.M.; Grasso, A.D. Remote monitoring system for stand-alone photovoltaic power plants: The case study of a PV-powered outdoor refrigerator. Energy Convers. Manag. 2014, 78, 862–871. [Google Scholar] [CrossRef]
- Demirtas, M.; Sefa, I.; Irmak, E.; Colak, I. Low-cost and high sensitive microcontroller based data acquisition system for renewable energy sources. In Proceedings of the International Symposium on Power Electronics, Electrical Drives, Automation and Motion, Ischia, Italy, 11–13 June 2008; pp. 196–199. [Google Scholar]
- Andò, B.; Baglio, S.; Pistorio, A.; Tina, G.M.; Ventura, C. Sentinella: Smart monitoring of photovoltaic systems at panel level. IEEE Trans. Instrum. Meas. 2015, 64, 2188–2199. [Google Scholar] [CrossRef]
- Nurhayati, T. Monitoring system of stand alone solar photovoltaic data. In Proceedings of the 2017 International Conference on Electrical Engineering and Computer Science (ICECOS), Sumatera, Indonesia, 22–23 August 2017; pp. 254–258. [Google Scholar]
- Sabry, A.H.; Hasana, W.Z.W.; Kadir, M.Z.A.A.; Radzi, M.A.M.; Shafie, S. Low cost wireless sensor monitoring system for photovoltaic (PV) array parameters. In Proceedings of the 2017 IEEE 4th International Conference on Smart Instrumentation, Measurement and Application (ICSIMA), Putrajaya, Malaysia, 28–30 November 2017; pp. 1–6. [Google Scholar]
- Sabry, A.H.; Hasan, W.Z.W.; Kadir, M.Z.A.A.; Radzi, M.A.M.; Shafie, S. DC-based smart PV-powered home energy management system based on voltage matching and RF module. PLoS ONE 2017, 12, e0185012. [Google Scholar] [CrossRef] [PubMed]
- Ducange, P.; Fazzolari, M.; Lazzerini, B.; Marcelloni, F. An intelligent system for detecting faults in photovoltaic fields. In Proceedings of the 11th International Conference on Intelligent Systems Design and Applications, Córdoba, Spain, 22–24 November 2011; pp. 1341–1346. [Google Scholar]
- Urmee, T.; Md, A. Social, cultural and political dimensions of off-grid renewable energy programs in developing countries. Renew. Energy 2016, 93, 159–167. [Google Scholar] [CrossRef]
- Ikejemba, E.C.X.; Mpuan, P.B.; Schuur, P.C.; Van Hillegersberg, J. The empirical reality & sustainable management failures of renewable energy projects in Sub-Saharan Africa (part 1 of 2). Renew. Energy 2017, 102, 234–240. [Google Scholar]
- Yaungket, J.; Tezuka, T. A survey of remote household energy use in rural Thailand. Energy Procedia 2013, 34, 64–72. [Google Scholar] [CrossRef][Green Version]
- Urmee, T.; Harries, D.; Schlapfer, A. Issues related to rural electrification using renewable energy in developing countries of Asia and Pacific. Renew. Energy 2009, 34, 354–357. [Google Scholar] [CrossRef]
- IEC. IEC 61724-1 Edition 1.0 2017-03 Photovoltaic System Performance—Part 1: Monitoring IEC, 1st ed.; IEC Publications: Geneva, Switzerland, 2017; ISBN 9782832239889. [Google Scholar]
- IEEE Instrumentation and Measurement Society. IEEE Standard for Transitions, Pulses, and Related Waveforms; IEEE Instrumentation and Measurement Society: New York, NY, USA, 2011; Volume 2011, ISBN 9780738167060. [Google Scholar]
- Chen, L.R. A design of an optimal battery pulse charge system by frequency-varied technique. IEEE Trans. Ind. Electron. 2007, 54, 398–405. [Google Scholar] [CrossRef]
- Lam, L.T.; Ozgun, H.; Lim, O.V.; Hamilton, J.A.; Vu, L.H.; Vella, D.G.; Rand, D.A.J. Pulsed-current charging of lead/acid batteries—A possible means for overcoming premature capacity loss? J. Power Sources 1995, 53, 215–228. [Google Scholar] [CrossRef]
- IEEE Standards Association. IEEE Recommended Practice for Testing the Performance of Stand-Alone Photovoltaic Systems; IEEE Standards Association: Piscataway, NJ, USA, 2001. [Google Scholar]
- Kebour, O.; Hadj Arab, A.; Hamid, A.; Abdeladim, K. Contribution to the analysis of a stand-alone photovoltaic system in a desert environment. Sol. Energy 2017, 151, 68–81. [Google Scholar] [CrossRef]
- Fanourakis, S.; Wang, K.; McCarthy, P.; Jiao, L. Low-cost data acquisition systems for photovoltaic system monitoring and usage statistics. In IOP Conference Series: Earth and Environmental Science; IOP Publishing: Bristol, UK, 2017; Volume 93, p. 12048. [Google Scholar]
- Mahzan, N.N.; Omar, A.M.; Rimon, L.; Noor, S.Z.M.; Rosselan, M.Z. Design and development of an arduino based data logger for photovoltaic monitoring system. Int. J. Simul. Syst. Sci. Technol 2017, 17, 11–15. [Google Scholar]
- El Hammoumi, A.; Motahhir, S.; Chalh, A.; El Ghzizal, A.; Derouich, A. Low-cost virtual instrumentation of PV panel characteristics using Excel and Arduino in comparison with traditional instrumentation. Renew. Wind. Water Sol. 2018, 5, 3. [Google Scholar] [CrossRef]
- Bauer, J. Microchip Various Solutions for Calculating a Pulse and Duty Cycle; Microchip Technology Inc.: Chandler, AZ, USA, 2012; pp. 1–22. [Google Scholar]
- Atmel Corporation. Atmel AVR135: Using Timer Capture to Measure PWM Duty Cycle Table of Contents; Atmel Corporation: San Jose, CA, USA, 2016; pp. 1–20. [Google Scholar]
- Williams, N.J.; van Dyk, E.E.; Vorster, F.J. Monitoring Solar Home Systems With Pulse Width Modulation Charge Control. J. Sol. Energy Eng. 2011, 133, 021006. [Google Scholar] [CrossRef]
- Jiménez-Castillo, G.; Muñoz-Rodríguez, F.; Rus-Casas, C.; Hernández, J.C.; Tina, G. Monitoring PWM signals in stand-alone photovoltaic systems. Measurement 2019, 134, 412–425. [Google Scholar]
- Mayer, D.G.; Butler, D.G. Statistical validation. Ecol. Model. 1993, 68, 21–32. [Google Scholar] [CrossRef]
- Sarsah, E.A.; Uba, F.A. Monthly-Specific Daily Global Solar Radiation Estimates Based On Sunshine Hours in Wa, Ghana. Int. J. Sci. Technol. Res. 2013, 2, 246–254. [Google Scholar]
- Fuentes, M.; Nofuentes, G.; Aguilera, J.; Talavera, D.L.; Castro, M. Application and validation of algebraic methods to predict the behaviour of crystalline silicon PV modules in Mediterranean climates. Sol. Energy 2007, 81, 1396–1408. [Google Scholar] [CrossRef]
- Chang, M.H.; Das, D.; Varde, P.V.; Pecht, M. Light emitting diodes reliability review. Microelectron. Reliab. 2012, 52, 762–782. [Google Scholar] [CrossRef]


© 2019 by the authors. Licensee MDPI, Basel, Switzerland. This article is an open access article distributed under the terms and conditions of the Creative Commons Attribution (CC BY) license (http://creativecommons.org/licenses/by/4.0/).