Power Factor Compensation Using Teaching Learning Based Optimization and Monitoring System by Cloud Data Logger


Abstract
:1. Introduction
2. Theoretical Background
2.1. Introduction to Compensation Power Factor
2.2. Compensation Power Factor Theory
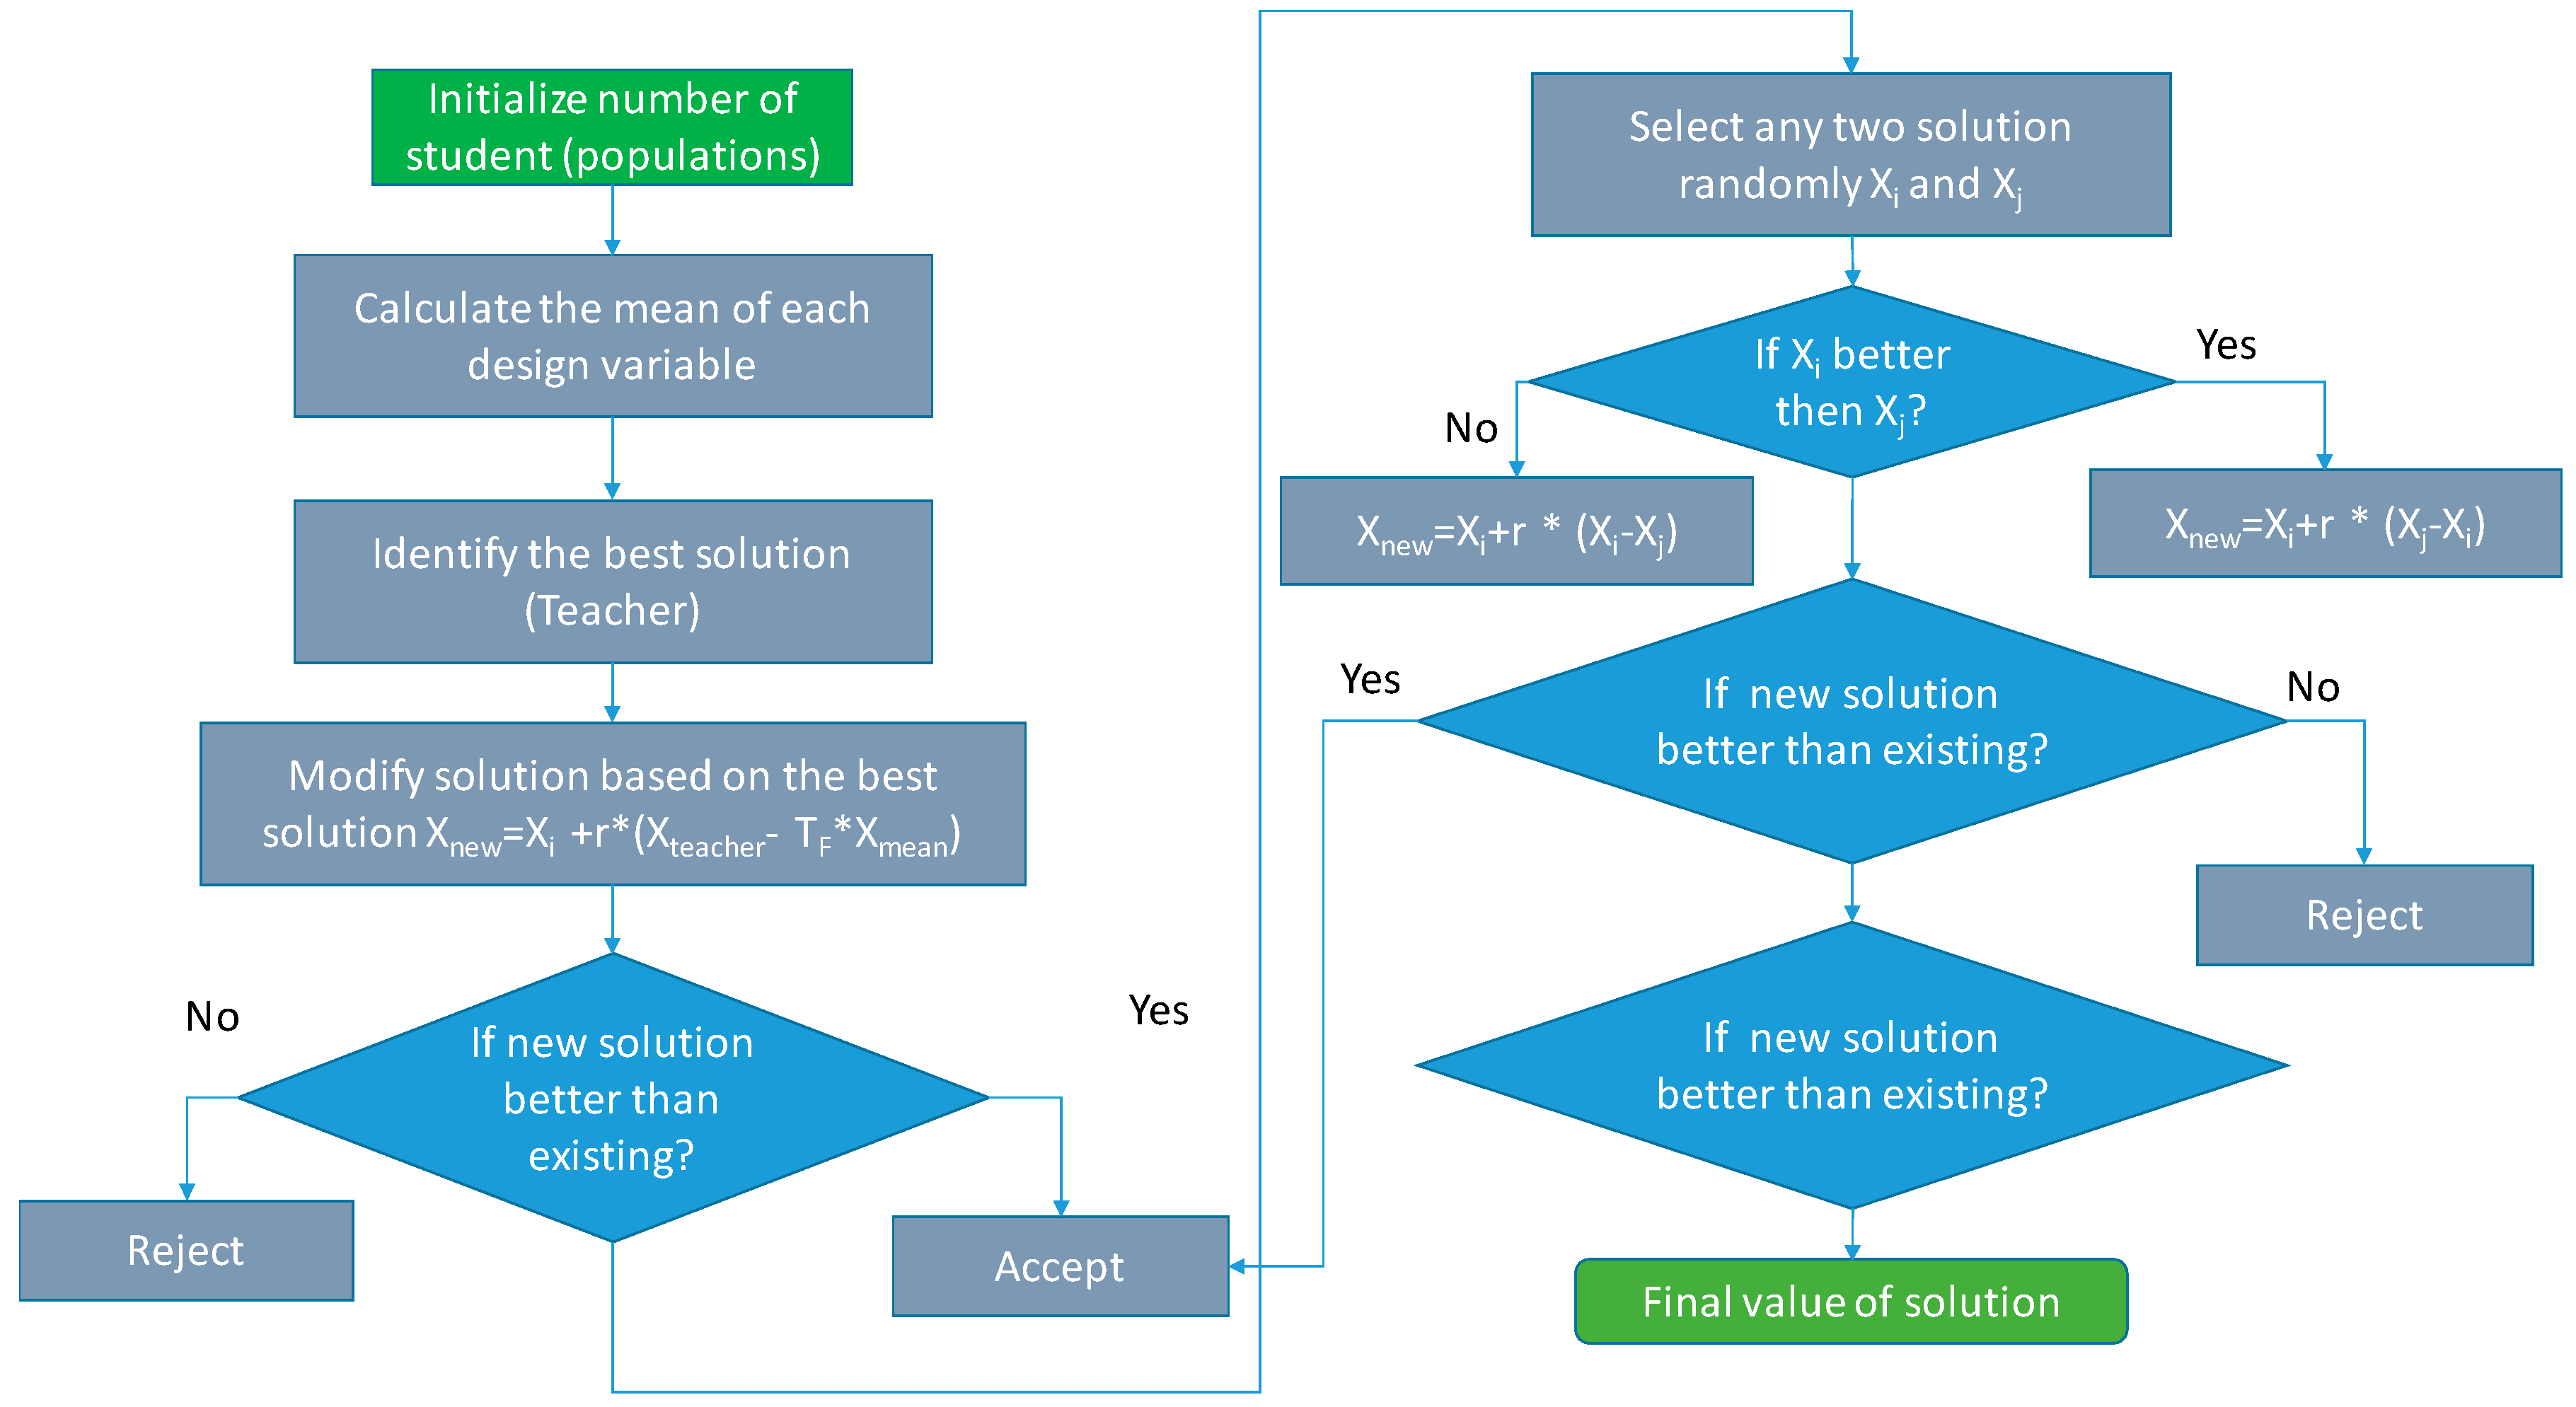
2.3. TLBO Algorithm
Problem Formulation
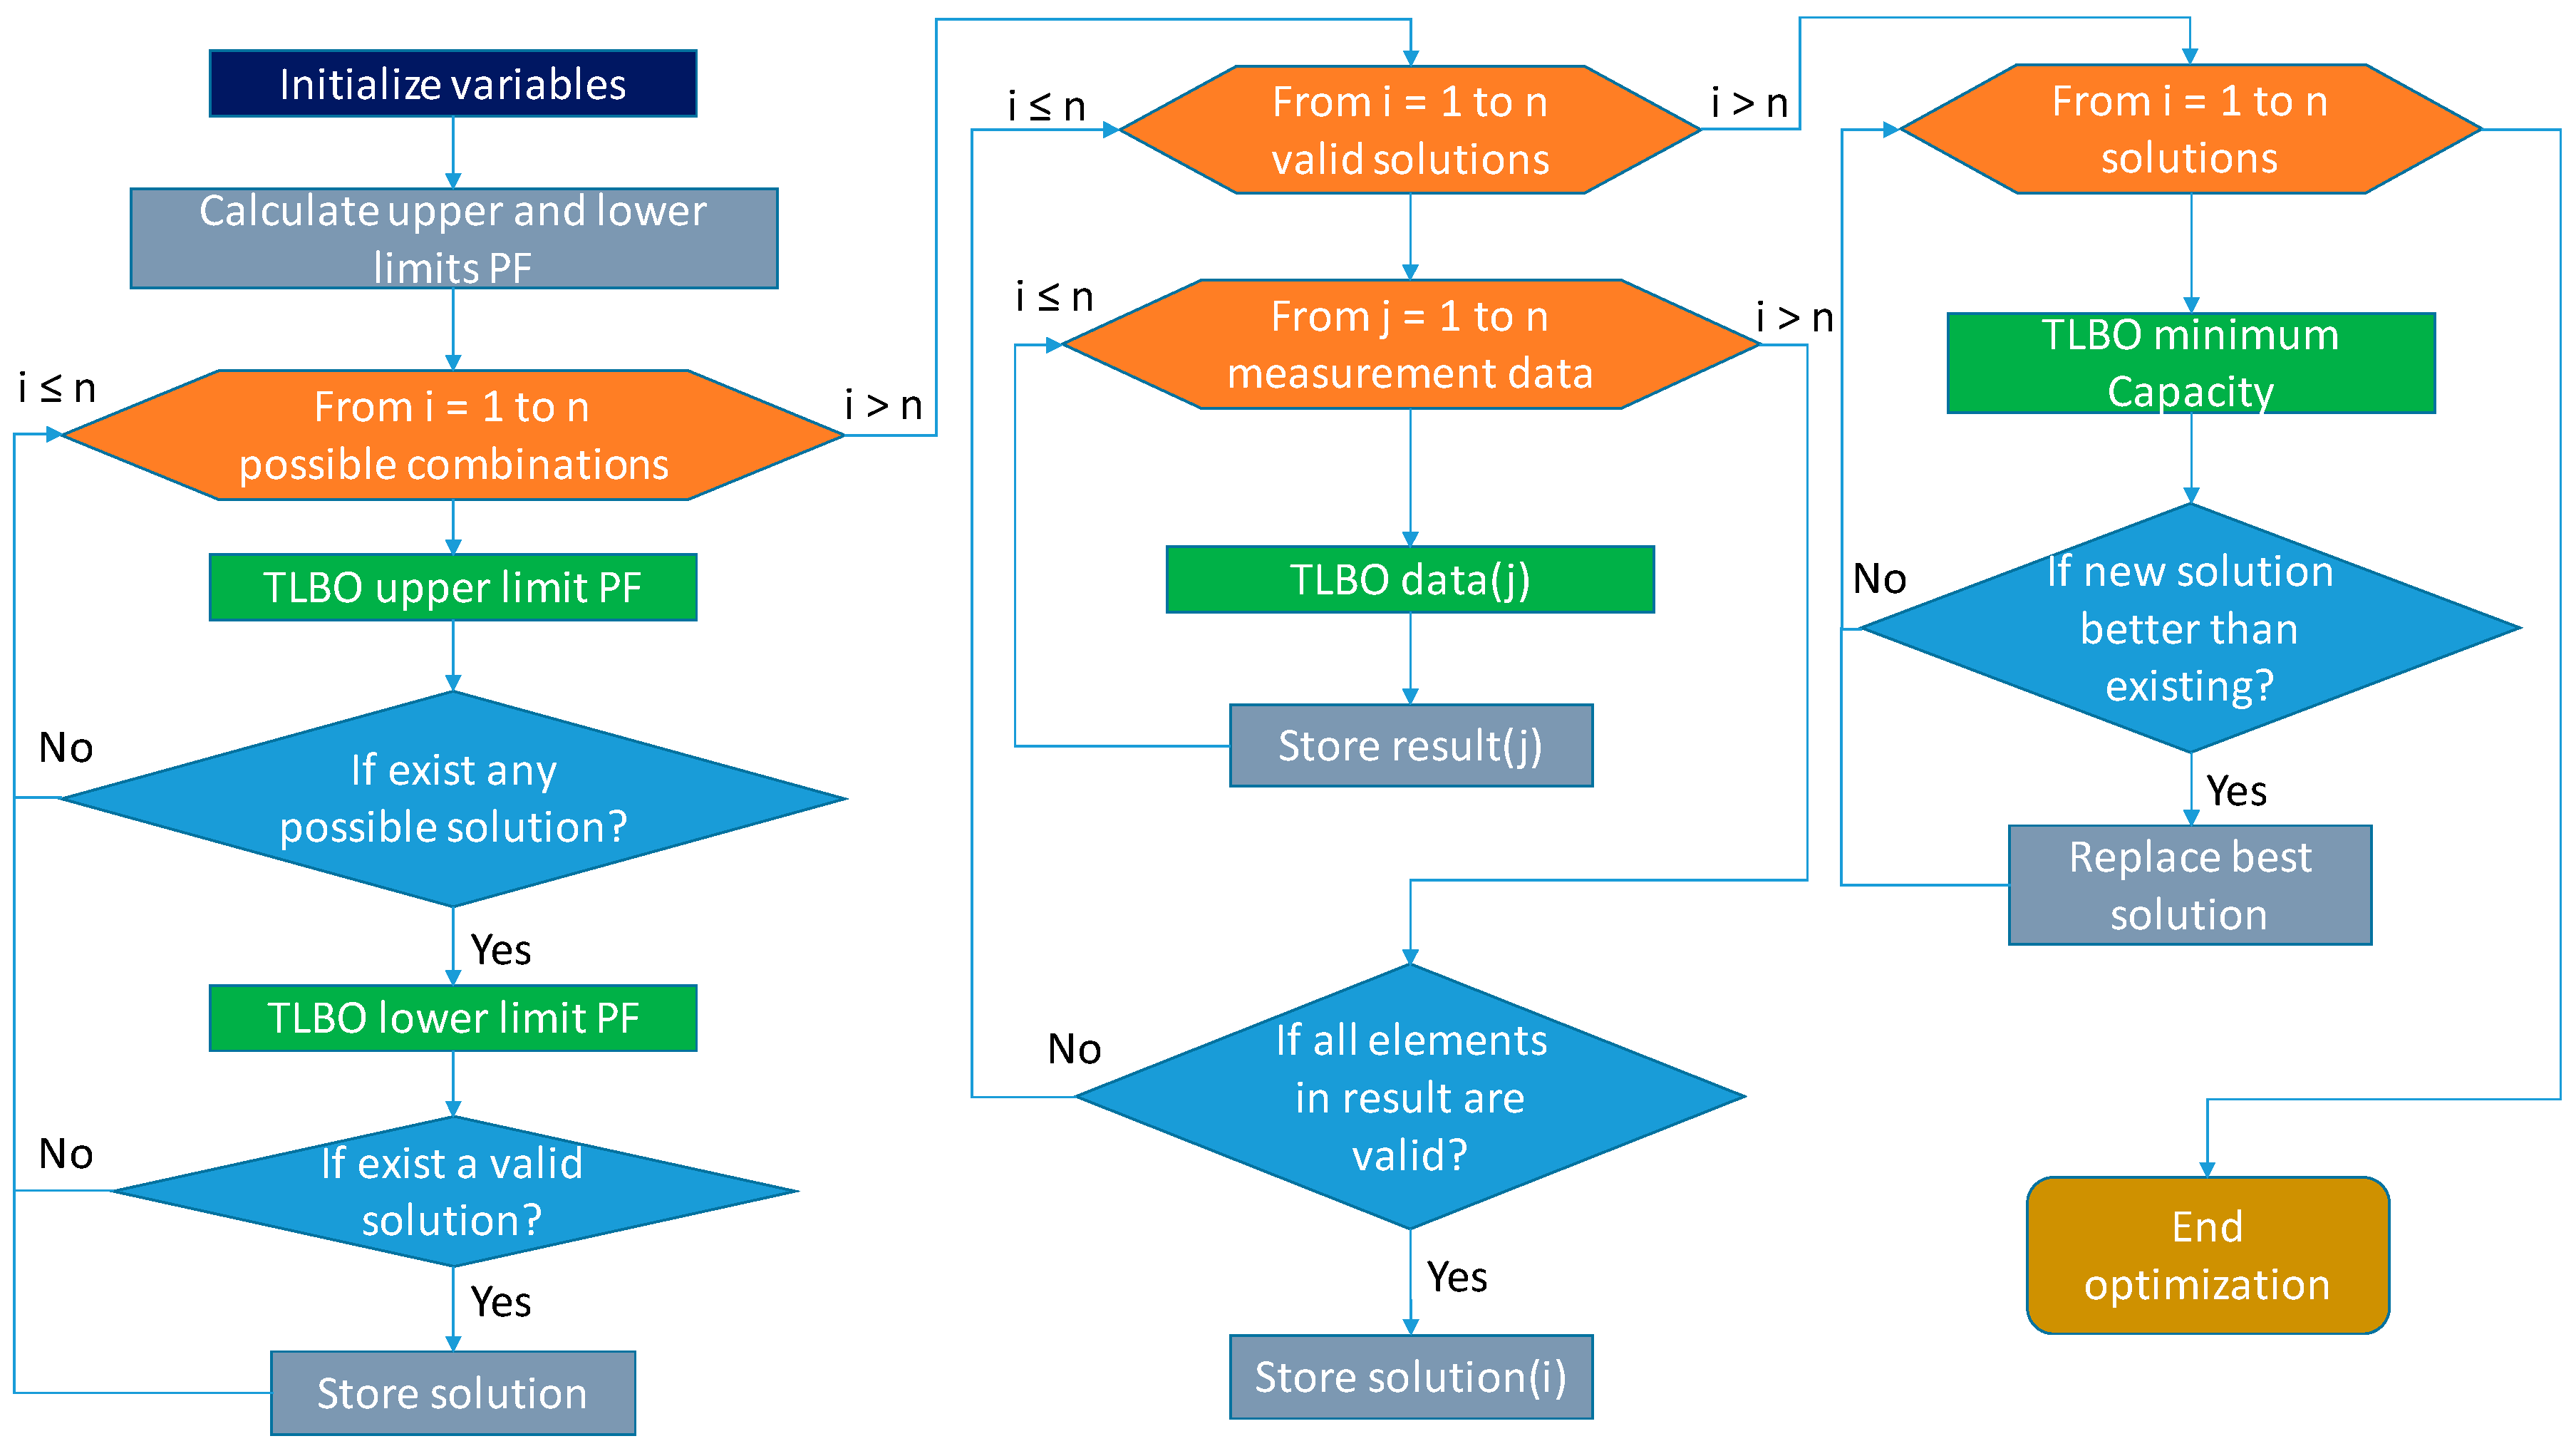
2.4. CBO Algorithm
3. PFCMS Design
3.1. Hardware
3.1.1. Microcontroller
3.1.2. Electric Power Meter
3.2. Software
3.2.1. Microcontroller Program
3.2.2. Android App
3.3. Prototype
4. Results and Discussion
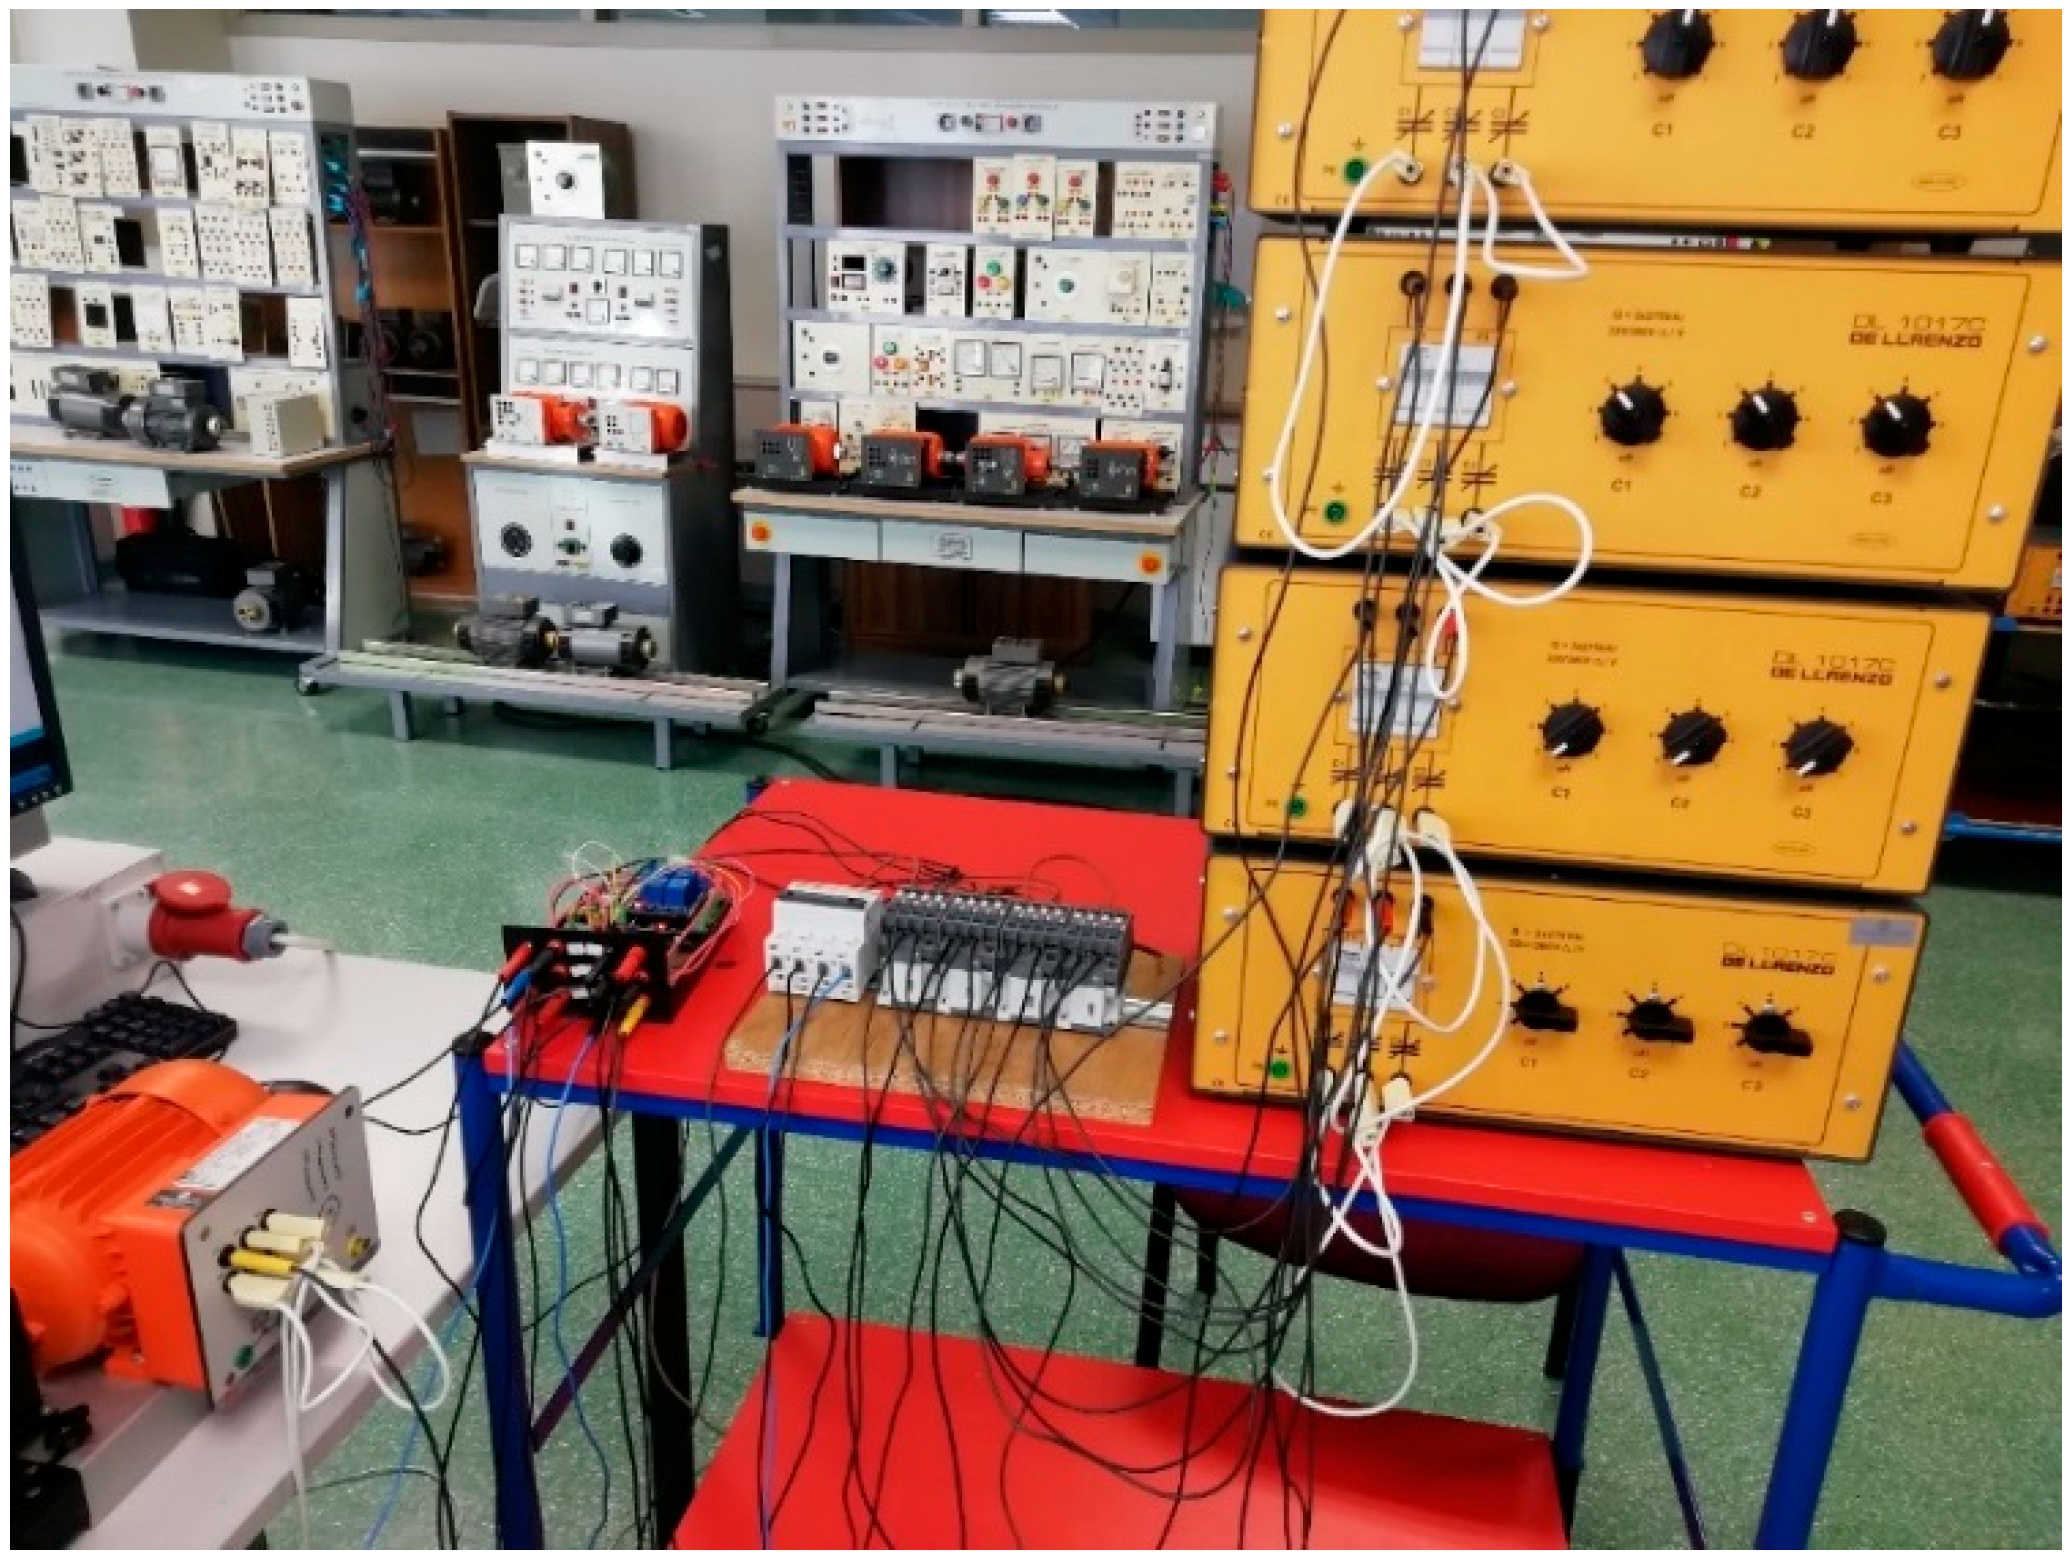
4.1. Test Equipment
4.1.1. Test Machine
4.1.2. Used Machines
4.1.3. Load Lamps (Electric Ballast)
4.1.4. Resistance-Inductance Load
4.2. Capacitor Bank Optimization
4.3. Compensation Power Factor Test in Real Time
4.3.1. Motors Load
- Motor 0.37 kW (3 phase). Delta D connection.
- Motor 0.37 kW (3 phase). Wye W connection.
- Motor 0.37 kW (1 phase).
4.3.2. Lamps Load
- Metal halide lamp.
- Sodium vapour lamp.
4.3.3. Resistance and Inductance Load
- Resistance-Inductance series load
- Resistance-Inductance parallel load
4.3.4. Daily Use of IM
4.4. Cloud Data Logger
4.5. App in Real Time
5. Conclusions
Author Contributions
Funding
Acknowledgments
Conflicts of Interest
Abbreviations
| AD1R1 | Arduino D1R1 |
| CB | Capacitor Bank |
| CBO | Capacitor Bank Optimization |
| CDL | Cloud Data Logger |
| DL | Data Logger |
| GS | Google Sheets |
| IM | Induction Motor |
| MITAI | MIT App Inventor 2 |
| P | Active Power |
| PF | Power Factor |
| PFDES | Power Factor Desired |
| PFINST | Power Factor Installation |
| PFOBT | Power Factor Obtained |
| PFC | Power Factor Correction |
| PFCMS | Power Factor Compensation and Monitoring System |
| PLC | Programmable Logic Controller |
| pop | Population |
| PZEM | PZEM-004t |
| Q | Reactive Power |
| TLBO | Teaching Learning Based optimization |
| SVC | Static Var Compensator |
References
- Rao, R.V.; Savsani, V.J.; Vakharia, D.P. Teaching–learning-based optimization: A novel method for constrained mechanical design optimization problems. Comput. Aided Des. 2011, 43, 303–315. [Google Scholar] [CrossRef]
- Rao, R.V.; Vakharia, D.P. Parameter optimization of modern machining processes using teaching–learning-based optimization algorithm. Eng. Appl. Artif. Intell. 2013, 26, 524–531. [Google Scholar]
- Nayaka, M.R.; Nayakb, C.K.; Routc, P.K. Application of Multi-Objective Teaching Learning Based Optimization Algorithm to Optimal Power Flow Problem. Procedia Technol. 2012, 6, 255–264. [Google Scholar] [CrossRef]
- Mohanty, B.; Tripathy, S. A teaching learning based optimization technique for optimal location and size of DG in distribution network. J. Electr. Syst. Inf. Technol. 2016, 3, 33–44. [Google Scholar] [CrossRef] [Green Version]
- Sultana, S.; Kumar Roy, P. Optimal capacitor placement in radial distribution systems using teaching learning based optimization. Electr. Power Energy Syst. 2014, 54, 387–398. [Google Scholar] [CrossRef]
- Bhattacharyya, B.; Babu, R. Teaching Learning Based Optimization algorithm for reactive power planning. Electr. Power Energy Syst. 2016, 81, 248–253. [Google Scholar] [CrossRef]
- Dixon, J.; Morán, L.; Rodríguez, J.; Domke, R. Reactive power compensation technologies: State-of-the-art review. Proc. IEEE 2005, 93, 2144–2164. [Google Scholar] [CrossRef]
- García-Canseco, E.; Griñó, R.; Ortega, R.; Salichs, M.; Stankovic, A.M. Power-factor compensation of electrical circuits. IEEE Control Syst. Mag. 2007, 27, 46–59. [Google Scholar]
- Gayatri, M.T.L.; Parimi, A.M.; Pavan Kumar, A.V. A review of reactive power compensation techniques in microgrids. Renew. Sustain. Energy Rev. 2018, 81, 1030–1036. [Google Scholar] [CrossRef]
- Zheng, F.; Zhang, W. Long Term Effect of Power Factor Correction on the Industrial Load: A Case Study. In Proceedings of the IEEE Australasian Universities Power Engineering Conference (AUPEC), Melbourne, VIC, Australia, 19–22 November 2017. [Google Scholar]
- Zhang, W.; Feng, G.; Liu, Y.; Wu, B. New Digital Control Method for Power Factor Correction. IEEE Trans. Ind. Electron. 2006, 53, 3. [Google Scholar] [CrossRef]
- Colak, I.; Bayindir, R.; Bay, F. Reactive power compensation using a fuzzy logic controlled synchronous motor. Energy Convers. Manag. 2003, 442, 2189–2204. [Google Scholar]
- Jain, R.; Sharma, S.; Sreejeth, M.; Singh, M. PLC based Power Factor Correction of 3-Phase Induction Motor. In Proceedings of the IEEE International Conference on Power Electronics, Intelligent Control and Energy Systems, Delhi, India, 4–6 July 2016. [Google Scholar]
- Kulkarni, N.; Vijay Murthy, H.; Raju, A. PLC based intelligent power factor correctors for industrial power systems-A case study. In Proceedings of the International Conference on Power and Advanced Control Engineering, Bengaluru, India, 12–14 August 2015. [Google Scholar]
- Guillardi Júniora, H.; Verri Liberadob, E.; Antenor Pomilioa, J.; Pinhabel Marafãob, F. General-compensation-purpose Static Var Compensator Prototype. Hardware X 2018, 5, e00049. [Google Scholar] [CrossRef]
- Kabir, Y.; Mohammad Mohsin, Y.; Monirujjaman Khan, M. Automated Power Factor Correction and Energy Monitoring System. In Proceedings of the IEEE International Conference on Electrical, Computer and Communication Technologies (ICECCT), Coimbatore, India, 22–24 February 2017. [Google Scholar]
- Tubburee, O.; Kumsuwan, Y. Current Sector Control for a Three-Phase Three-Level PFC Rectifier. In Proceedings of the 9th International Conference on Power Electronics and ECCE Asia (ICPE-ECCE Asia), Seoul, Korea, 1–5 June 2015. [Google Scholar]
- Pothirasan, N.; Pallikonda Rajasekaran, M.; Muneeswaran, V. Real time reactive power compensation for battery/photovoltaic hybrid power source for internet of hybrid electric vehicle system. Cogn. Syst. Res. 2018, 52, 473–488. [Google Scholar] [CrossRef]
- Roman-Loera, A.; Flores, L.A.; Rizo-Diaz, F.D.J.; Arambula-Miranda, L.E. Current Sensorless Predictive Algorithm Control for Three-Phase Power Factor Correction. In Proceedings of the 34th Annual Conference of IEEE Industrial Electronics, Orlando, FL, USA, 10–13 November 2008. [Google Scholar]
- IEEE Standards 18-2012. IEEE Standard for Shunt Power Capacitors; Institute of Electrical and Electronics Engineers, Inc.: Piscataway, NJ, USA, 2012. [Google Scholar]
- C37.26-2014-IEEE. Guide for Methods of Power-Factor Measurement for Low-Voltage (1000 V AC or lower) Inductive Test Circuits; Institute of Electrical and Electronics Engineers, Inc.: Piscataway, NJ, USA, 2014. [Google Scholar]
- C37.99-2012-IEEE. Guide for the Protection of Shunt Capacitor Banks; Institute of Electrical and Electronics Engineers, Inc.: Piscataway, NJ, USA, 2012. [Google Scholar]
- Jabbar Mnati, M.; Van den Bossche, A.; Farhood Chisab, R. A Smart Voltage and Current Monitoring System for Three Phase Inverters Using an Android Smartphone Application. Sensors 2017, 17, 872. [Google Scholar] [CrossRef] [PubMed]
- Lin, C.M.; Chen, M.T. Design and Implementation of a Smart Home Energy Saving System with Active Loading Feature Identification and Power Management. In Proceedings of the IEEE 3rd International Future Energy Electronics Conference and ECCE Asia (IFEEC 2017-ECCE Asia), Kaohsiung, Taiwan, 3–7 June 2017. [Google Scholar]
- Martin Tureczek, A.; Sieverts Nielsen, P. Structured literature review of electricity consumption classification using smart meter data. Energies 2017, 10, 584. [Google Scholar] [CrossRef]
- Mit App Inventor 2. Available online: https://ai2.appinventor.mit.edu (accessed on 25 March 2019).
- Ningbo Peacefair Electronic Co., Ltd. Available online: https://peacefair.en.made-in-china.com (accessed on 25 March 2019).
- Abul’Wafa, A.R. Optimal capacitor placement for enhancing voltage stability in distribution systems using analytical algorithm and Fuzzy-Real Coded GA. Electr. Power Energy Syst. 2014, 55, 246–252. [Google Scholar] [CrossRef]
- El-Fergany, A.A.; Abdelaziz, A.Y. Capacitor placement for net saving maximization and system stability enhancement in distribution networks using artificial bee colony-based approach. Electr. Power Energy Syst. 2014, 54, 235–243. [Google Scholar] [CrossRef]
- Kolenc, M.; Papic, I.; Blazic, B. Coordinated reactive power control to achieve minimal operating costs. Electr. Power Energy Syst. 2014, 63, 1000–1007. [Google Scholar] [CrossRef]
- Homaee, O.; Zakariazadeh, A.; Jadid, S. Real-time voltage control algorithm with switched capacitors in smart distribution system in presence of renewable generations. Electr. Power Energy Syst. 2014, 54, 187–197. [Google Scholar] [CrossRef]
- Rao, R.V.; Savsani, V.J.; Vakharia, D.P. Teaching–Learning-Based Optimization: An optimization method for continuous non-linear large scale problems. Inf. Sci. 2012, 183, 1–15. [Google Scholar] [CrossRef]
- Morales-Velazquez, L.; Romero-Troncoso, R.D.; Herrera-Ruiz, G.; Morinigo-Sotelo, D.; Osornio-Rios, R.A. Smart sensor network for power quality monitoring in electrical installations. Measurement 2017, 103, 133–142. [Google Scholar] [CrossRef]
- Wemos Electronics. Available online: https://wiki.wemos.cc/products:d1:d1 (accessed on 25 March 2019).
- Ahmed, A.M.; Osama, A.A. Comparative study of 250 W high pressure sodium lamp operating from both conventional and electronic ballast. J. Electr. Syst. Inf. Technol. 2014, 1, 234–254. [Google Scholar]


| Parameter | Value |
|---|---|
| Microcontroller | ESP-8266EX |
| Operating voltage | 3.3 V |
| Input voltage | 9–24 V |
| Digital I/O pins | 11 (provide a PWM output, except D0) |
| Analog input pins | 1 |
| Flash memory | 4 MB |
| Clock speed | 80/160 MHz |
| Parameter | Value |
|---|---|
| Voltage | 80–260 V |
| Current | 0–100 A |
| Active power | 0–22 kW |
| Energy | 0–9999 kWh |
| Measured signal | Continuous wave |
| Communication port | TTL port |
| Parameter | Squirrel Cage (3 Phase) | Squirrel Cage (3 Phase) | Squirrel Cage (1 Phase) |
|---|---|---|---|
| Rated voltage (Delta-Wye) | 230/400 V | 230/400 V | 230 V |
| Rate current (Delta-Wye) | 5.7/3.3 A | 1/0.6 A | 2.9 A |
| Power | 1.5 kW | 0.37 kW | 0.37 kW |
| Power factor | 0.76 | 0.83 | 0.96 |
| Speed | 1435 rpm | 2800 rpm | 2870 rpm |
| Frequency | 50 Hz | 50 Hz | 50 Hz |
| Parameter | Sodium Vapour | Metal Halide |
|---|---|---|
| Rated voltage | 230 V | 230 V |
| Rate current | 1.8 A | 1.15 A |
| Power | 150 W | 125 W |
| Frequency | 50 Hz | 50 Hz |
| Position | Value (Ω) | Maximum Power Per Phase (VAr) | Value (H) | Maximum Power Per Phase (W) |
|---|---|---|---|---|
| 1 | 1050 | 34 | 4.46 | 46 |
| 2 | 750 | 48 | 3.19 | 65 |
| 3 | 435 | 83 | 1.84 | 110 |
| 4 | 300 | 121 | 1.27 | 160 |
| 5 | 213 | 171 | 0.9 | 230 |
| 6 | 150 | 242 | 0.64 | 330 |
| Type Load | Capacitor Values (μF) | Step | Max. Possibilities | Optimal Solutions | Best Solution C1-C2-C3-C4 (μF) |
|---|---|---|---|---|---|
| Motor One phase | 0.5 … 5 | 0.5 | 10,000 | 9931 | 0.5-0.5-1-2.5 |
| Motor Three phase Delta | 0.5 … 5 | 0.5 | 10,000 | 5770 | 0.5-0.5-0.5-0.5 |
| Motor Three phase Wye | 0.5 … 5 | 0.5 | 10,000 | 4230 | 0.5-0.5-0.5-0.5 |
| Lamp Metal Halide | 0.5 … 10 | 0.5 | 160,000 | 1147 | 5-5.5-7-8 |
| Lamp Vapour Sodium | 0.5 … 10 | 0.5 | 160,000 | 673 | 5-5-7-8 |
| Lighting Parallel | 0.5 … 10 | 0.5 | 160,000 | 4269 | 4-10-9.5-8.5 |
| Load Resistance/Inductance Series | 0.5 … 10 | 0.5 | 160,000 | 3540 | 0.5-1.5-2.5-2 |
| Load Resistance/Inductance Parallel | 0.5 … 10 | 0.5 | 160,000 | 9073 | 0.5-2-4-7.5 |
| Daily | 0.5 … 10 | 0.5 | 160,000 | 23,247 | 1.5-10-9.5-6.5 |
| Parameter | Mean | Standard Deviation | PFOBT − PFDES | |
|---|---|---|---|---|
| Max. | Min. | |||
| Motor One phase | 0.00422 | 0.00479 | 0.0174 | 9.3590 × 10⁵ |
| Motor Three phase Delta | 0.00784 | 0.00852 | 0.0332 | 7.7156 × 10⁵ |
| Motor Three phase Wye | 0.01669 | 0.01378 | 0.0483 | 7.73490 × 10⁵ |
| Metal Halide | 0.01840 | 0.01058 | 0.0458 | 2.90000 × 10⁵ |
| Vapour Sodium | 0.01775 | 0.01107 | 0.0469 | 1.2795 × 10⁵ |
| Lighting Parallel | 0.00974 | 0.01172 | 0.0399 | 1.0196 × 10⁴ |
| Load Resistance/Inductance Series | 0.01313 | 0.01158 | 0.0487 | 6.2545 × 10⁷ |
| Load Resistance/Inductance Parallel | 0.01491 | 0.01625 | 0.050 | 9.6650 × 10⁵ |
| Daily | 0.01828 | 0.00686 | 0.0285 | 1.3973 × 10⁵ |
© 2019 by the authors. Licensee MDPI, Basel, Switzerland. This article is an open access article distributed under the terms and conditions of the Creative Commons Attribution (CC BY) license (http://creativecommons.org/licenses/by/4.0/).
Share and Cite
Cano Ortega, A.; Sánchez Sutil, F.J.; De la Casa Hernández, J. Power Factor Compensation Using Teaching Learning Based Optimization and Monitoring System by Cloud Data Logger. Sensors 2019, 19, 2172. https://doi.org/10.3390/s19092172
Cano Ortega A, Sánchez Sutil FJ, De la Casa Hernández J. Power Factor Compensation Using Teaching Learning Based Optimization and Monitoring System by Cloud Data Logger. Sensors. 2019; 19(9):2172. https://doi.org/10.3390/s19092172
Chicago/Turabian StyleCano Ortega, Antonio, Francisco Jose Sánchez Sutil, and Jesús De la Casa Hernández. 2019. "Power Factor Compensation Using Teaching Learning Based Optimization and Monitoring System by Cloud Data Logger" Sensors 19, no. 9: 2172. https://doi.org/10.3390/s19092172