A Hybrid Method for Predicting Traffic Congestion during Peak Hours in the Subway System of Shenzhen

 , and
, and
Abstract
:1. Introduction
2. Methodology
2.1. A Static Traffic Assignment Model
2.2. An Agent-Based Dynamic Traffic Simulation Framework
2.2.1. Action-Driven System
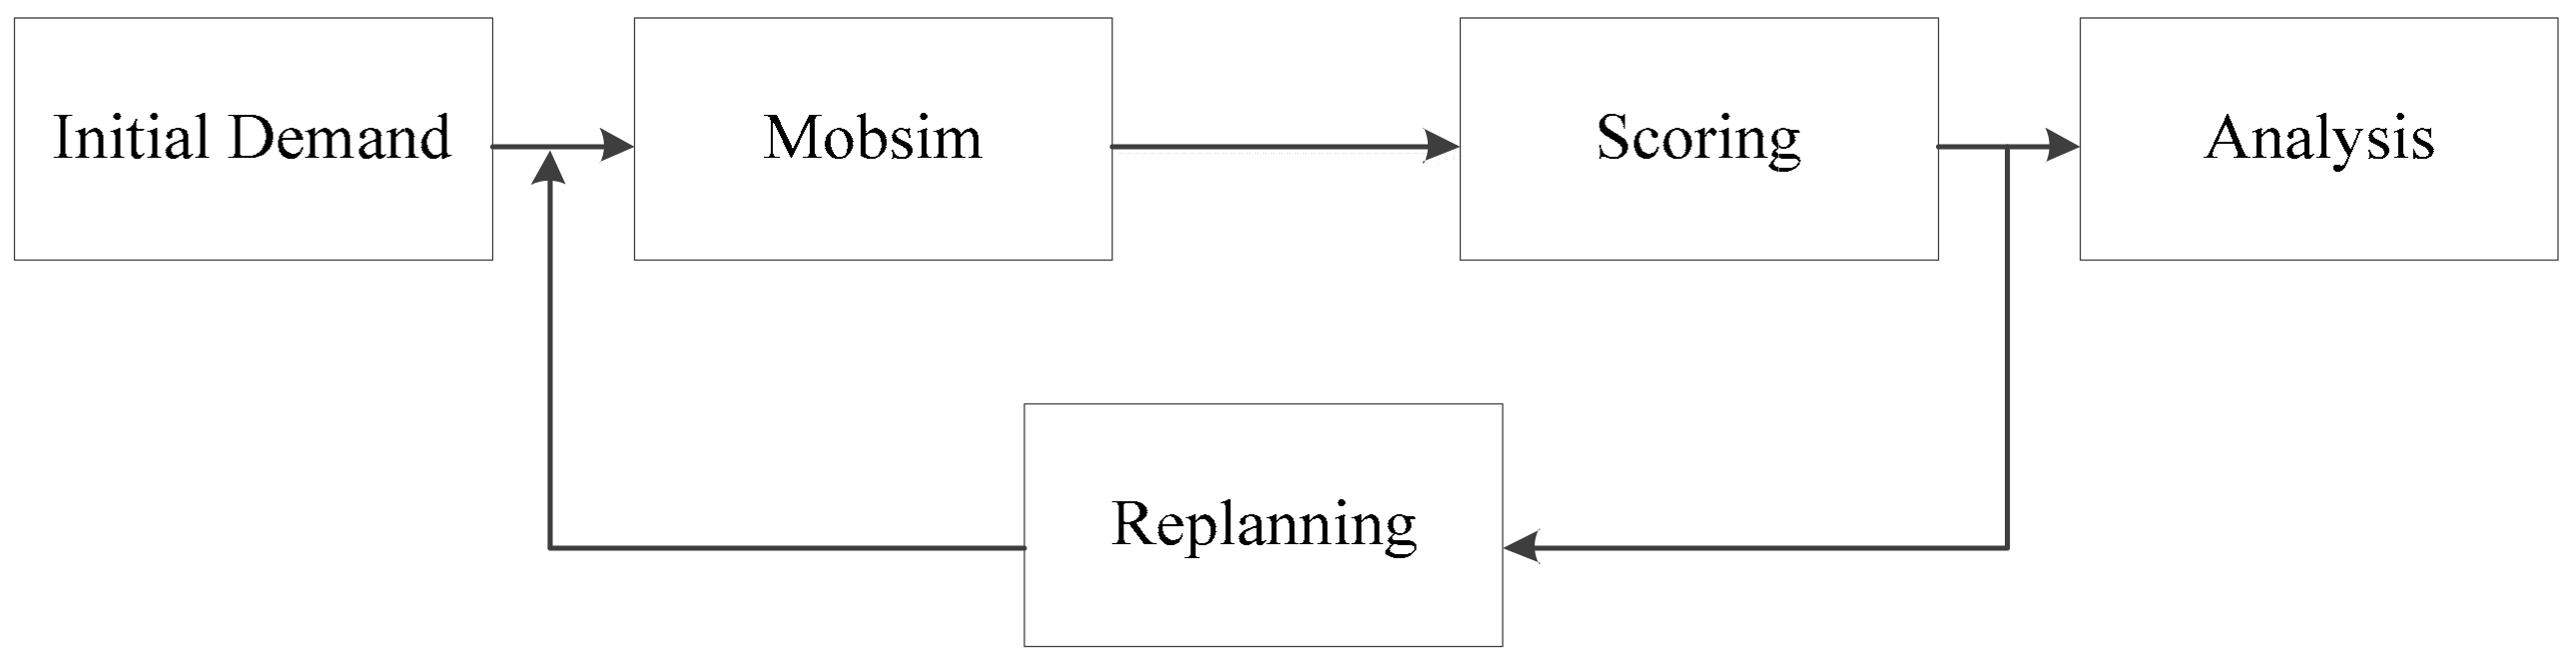
2.2.2. Simulation Workflow
2.3. Passenger Flow Distribution
3. Case Study
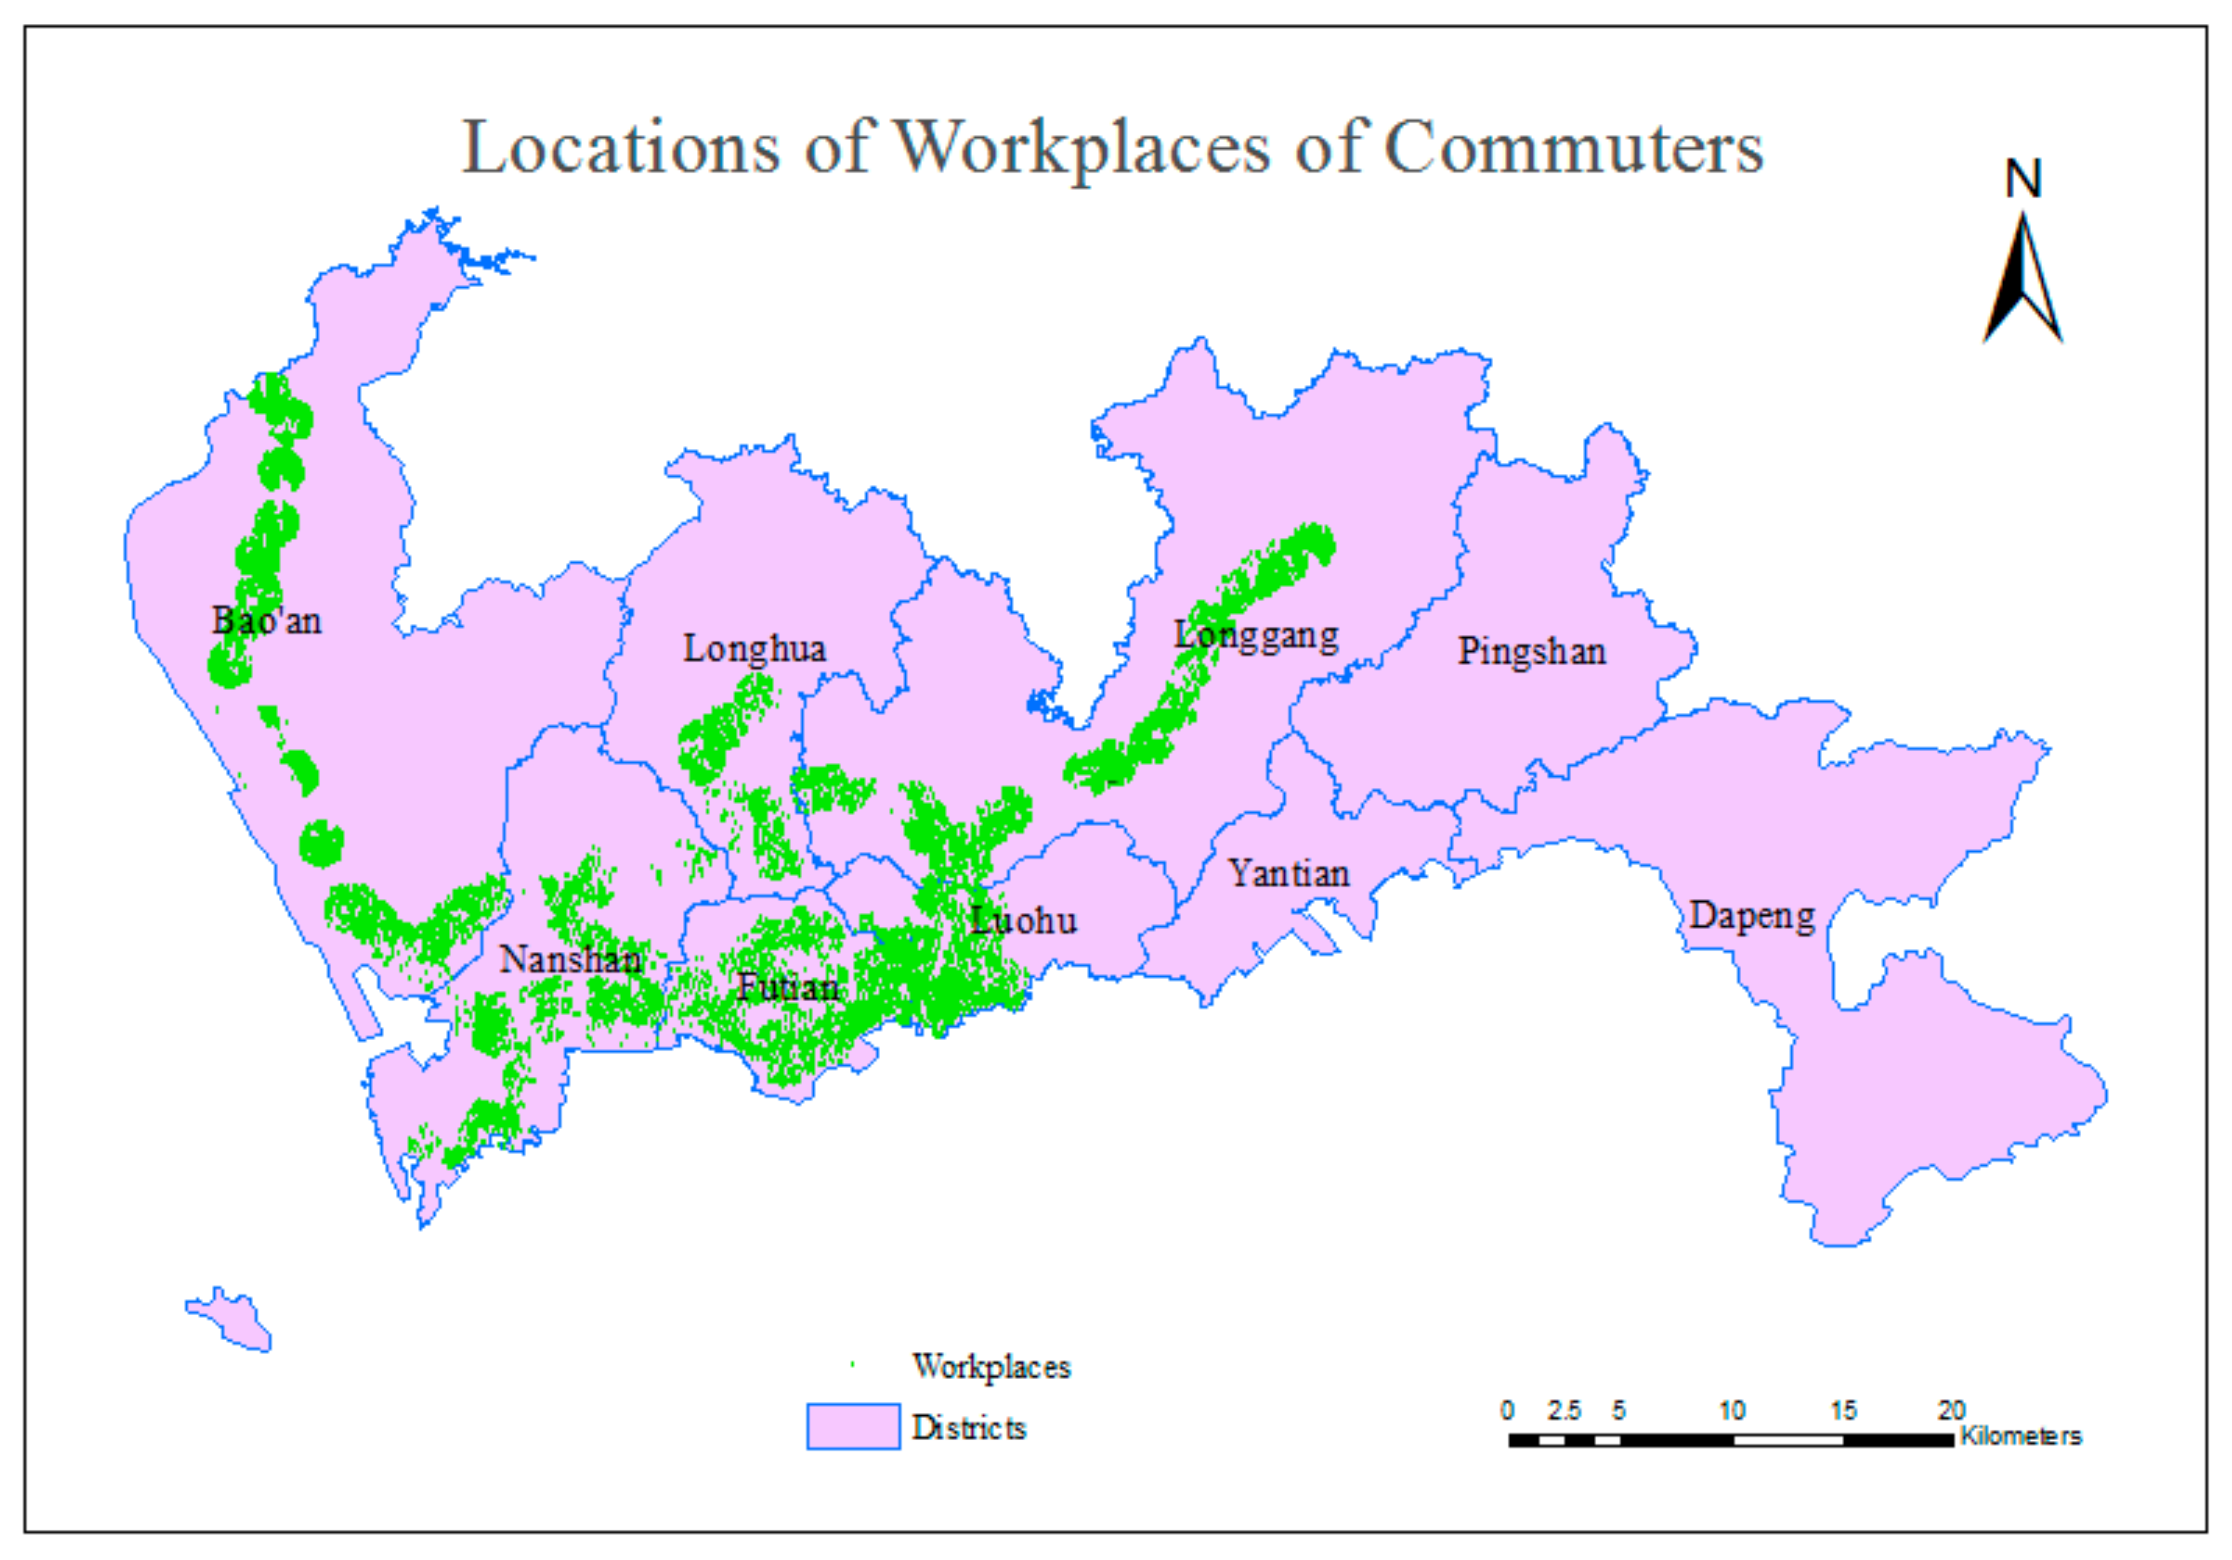
3.1. Study Area
3.1.1. Shenzhen City
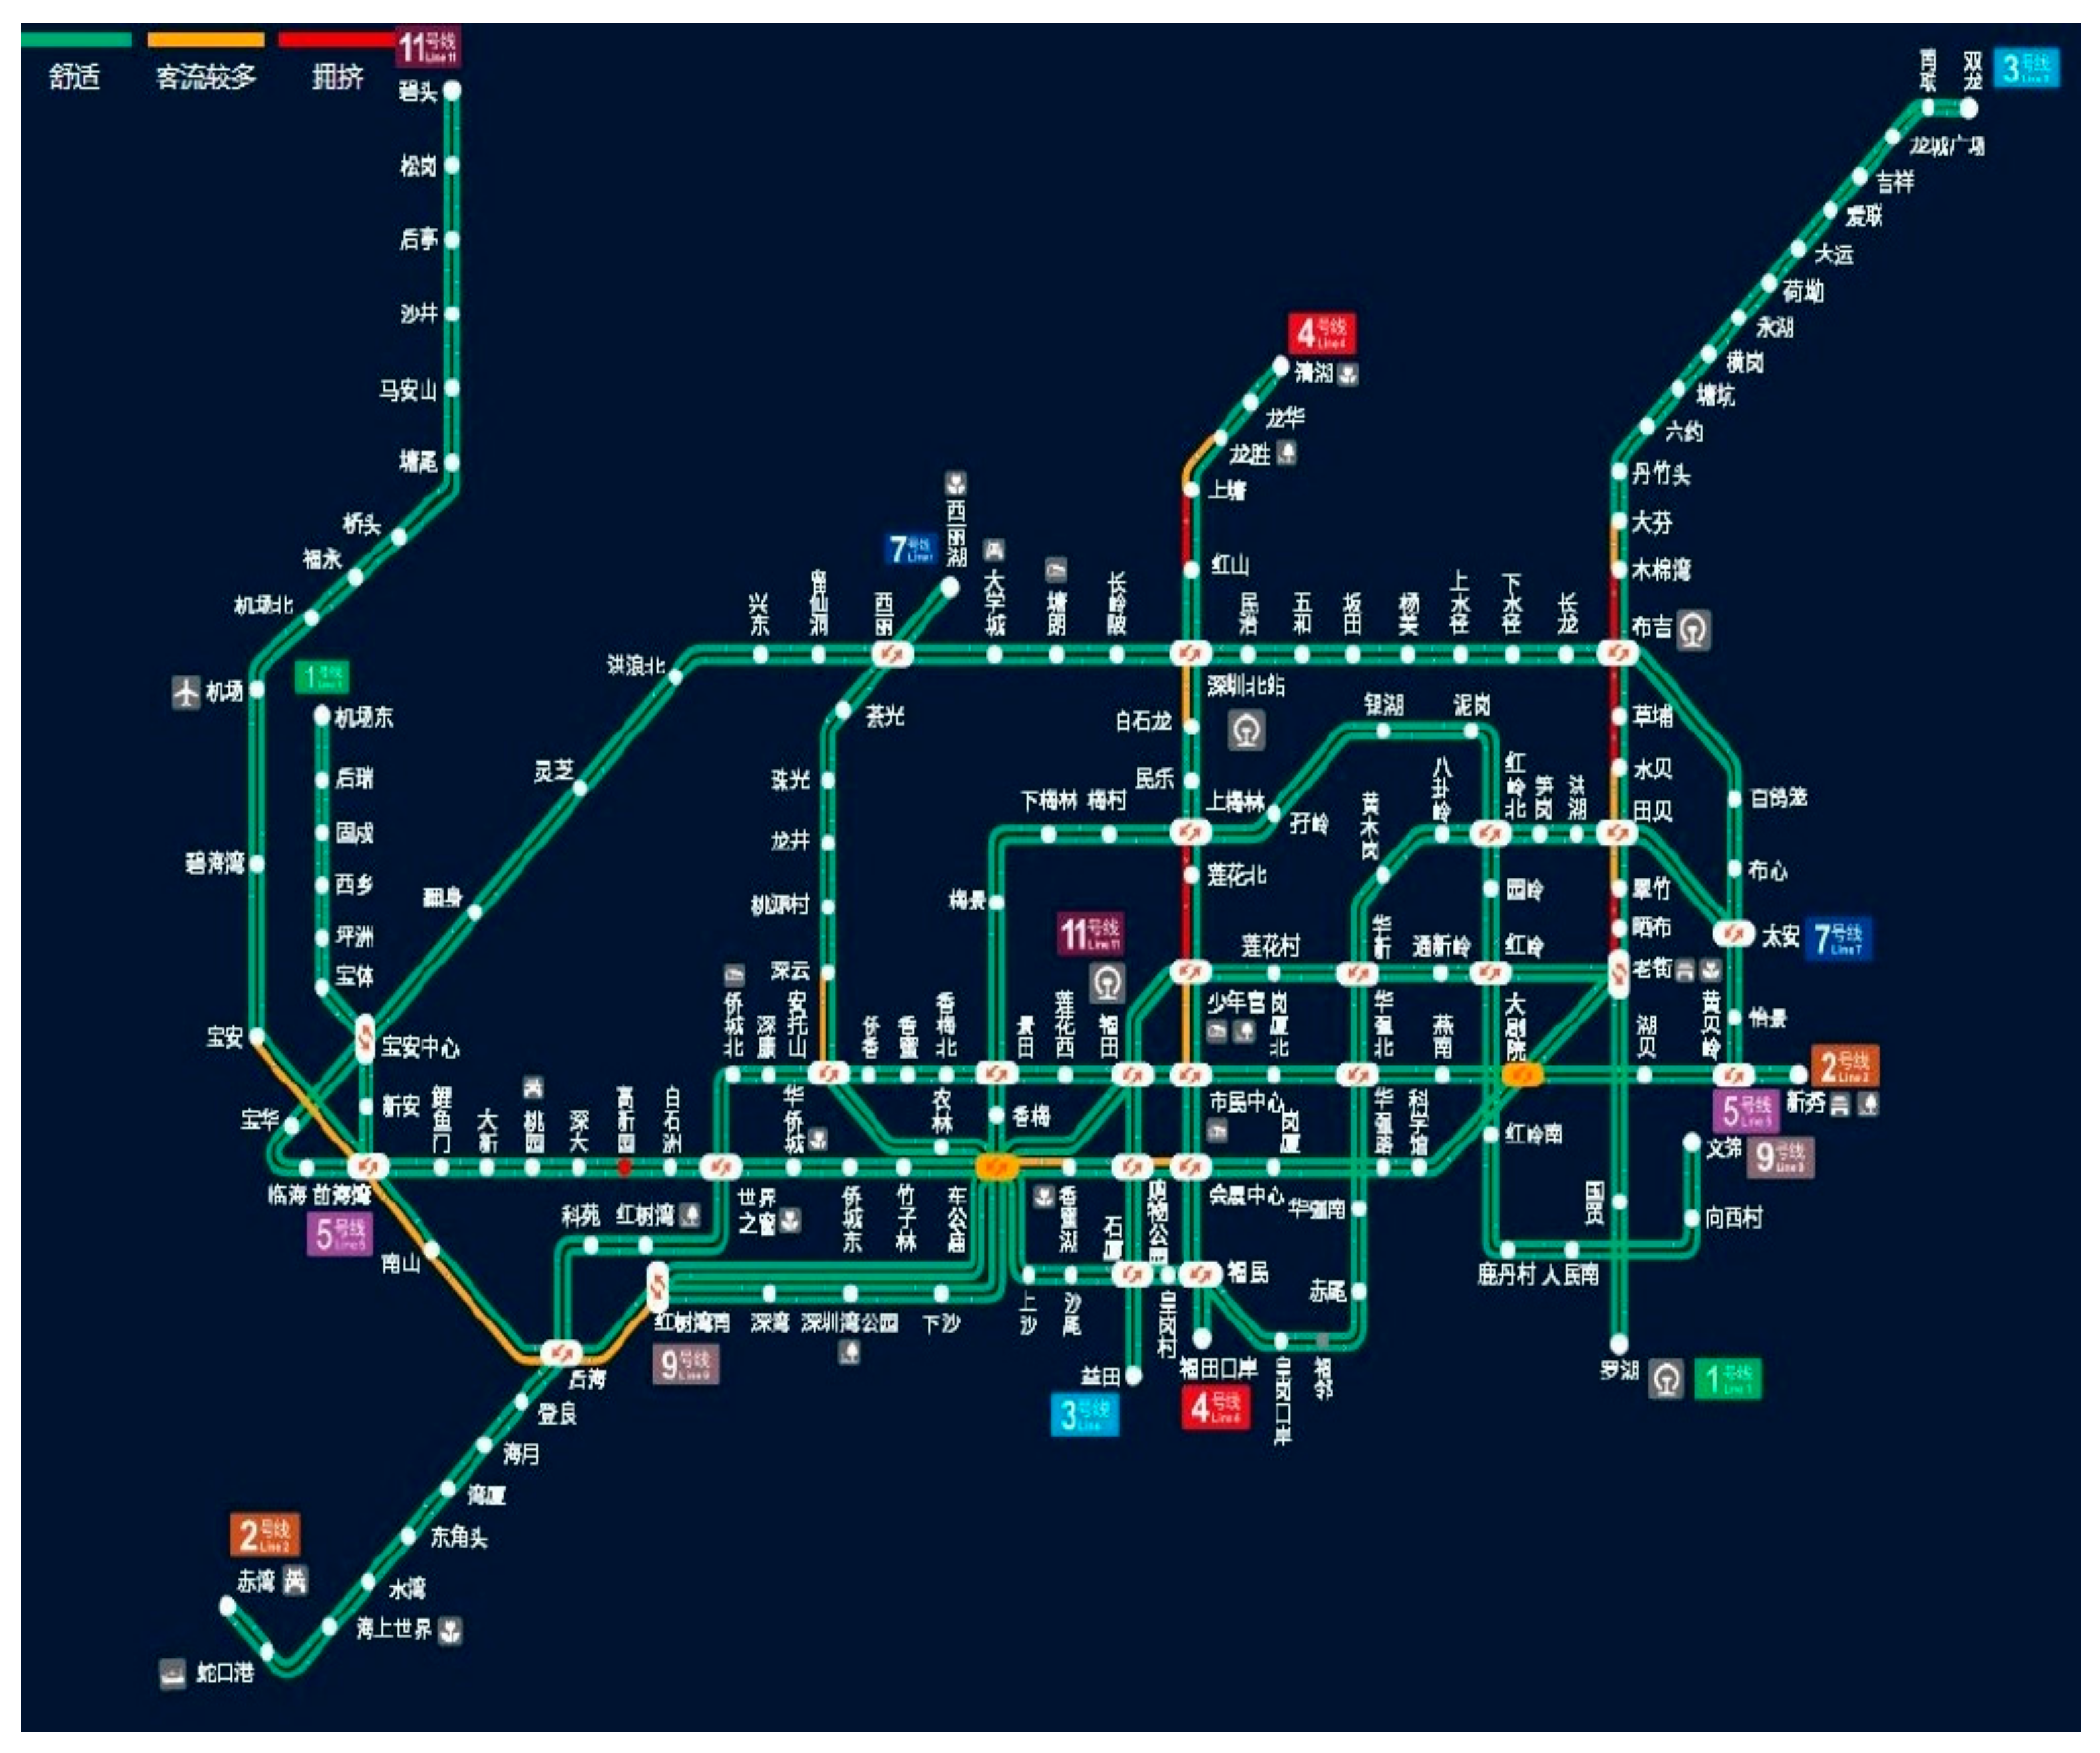
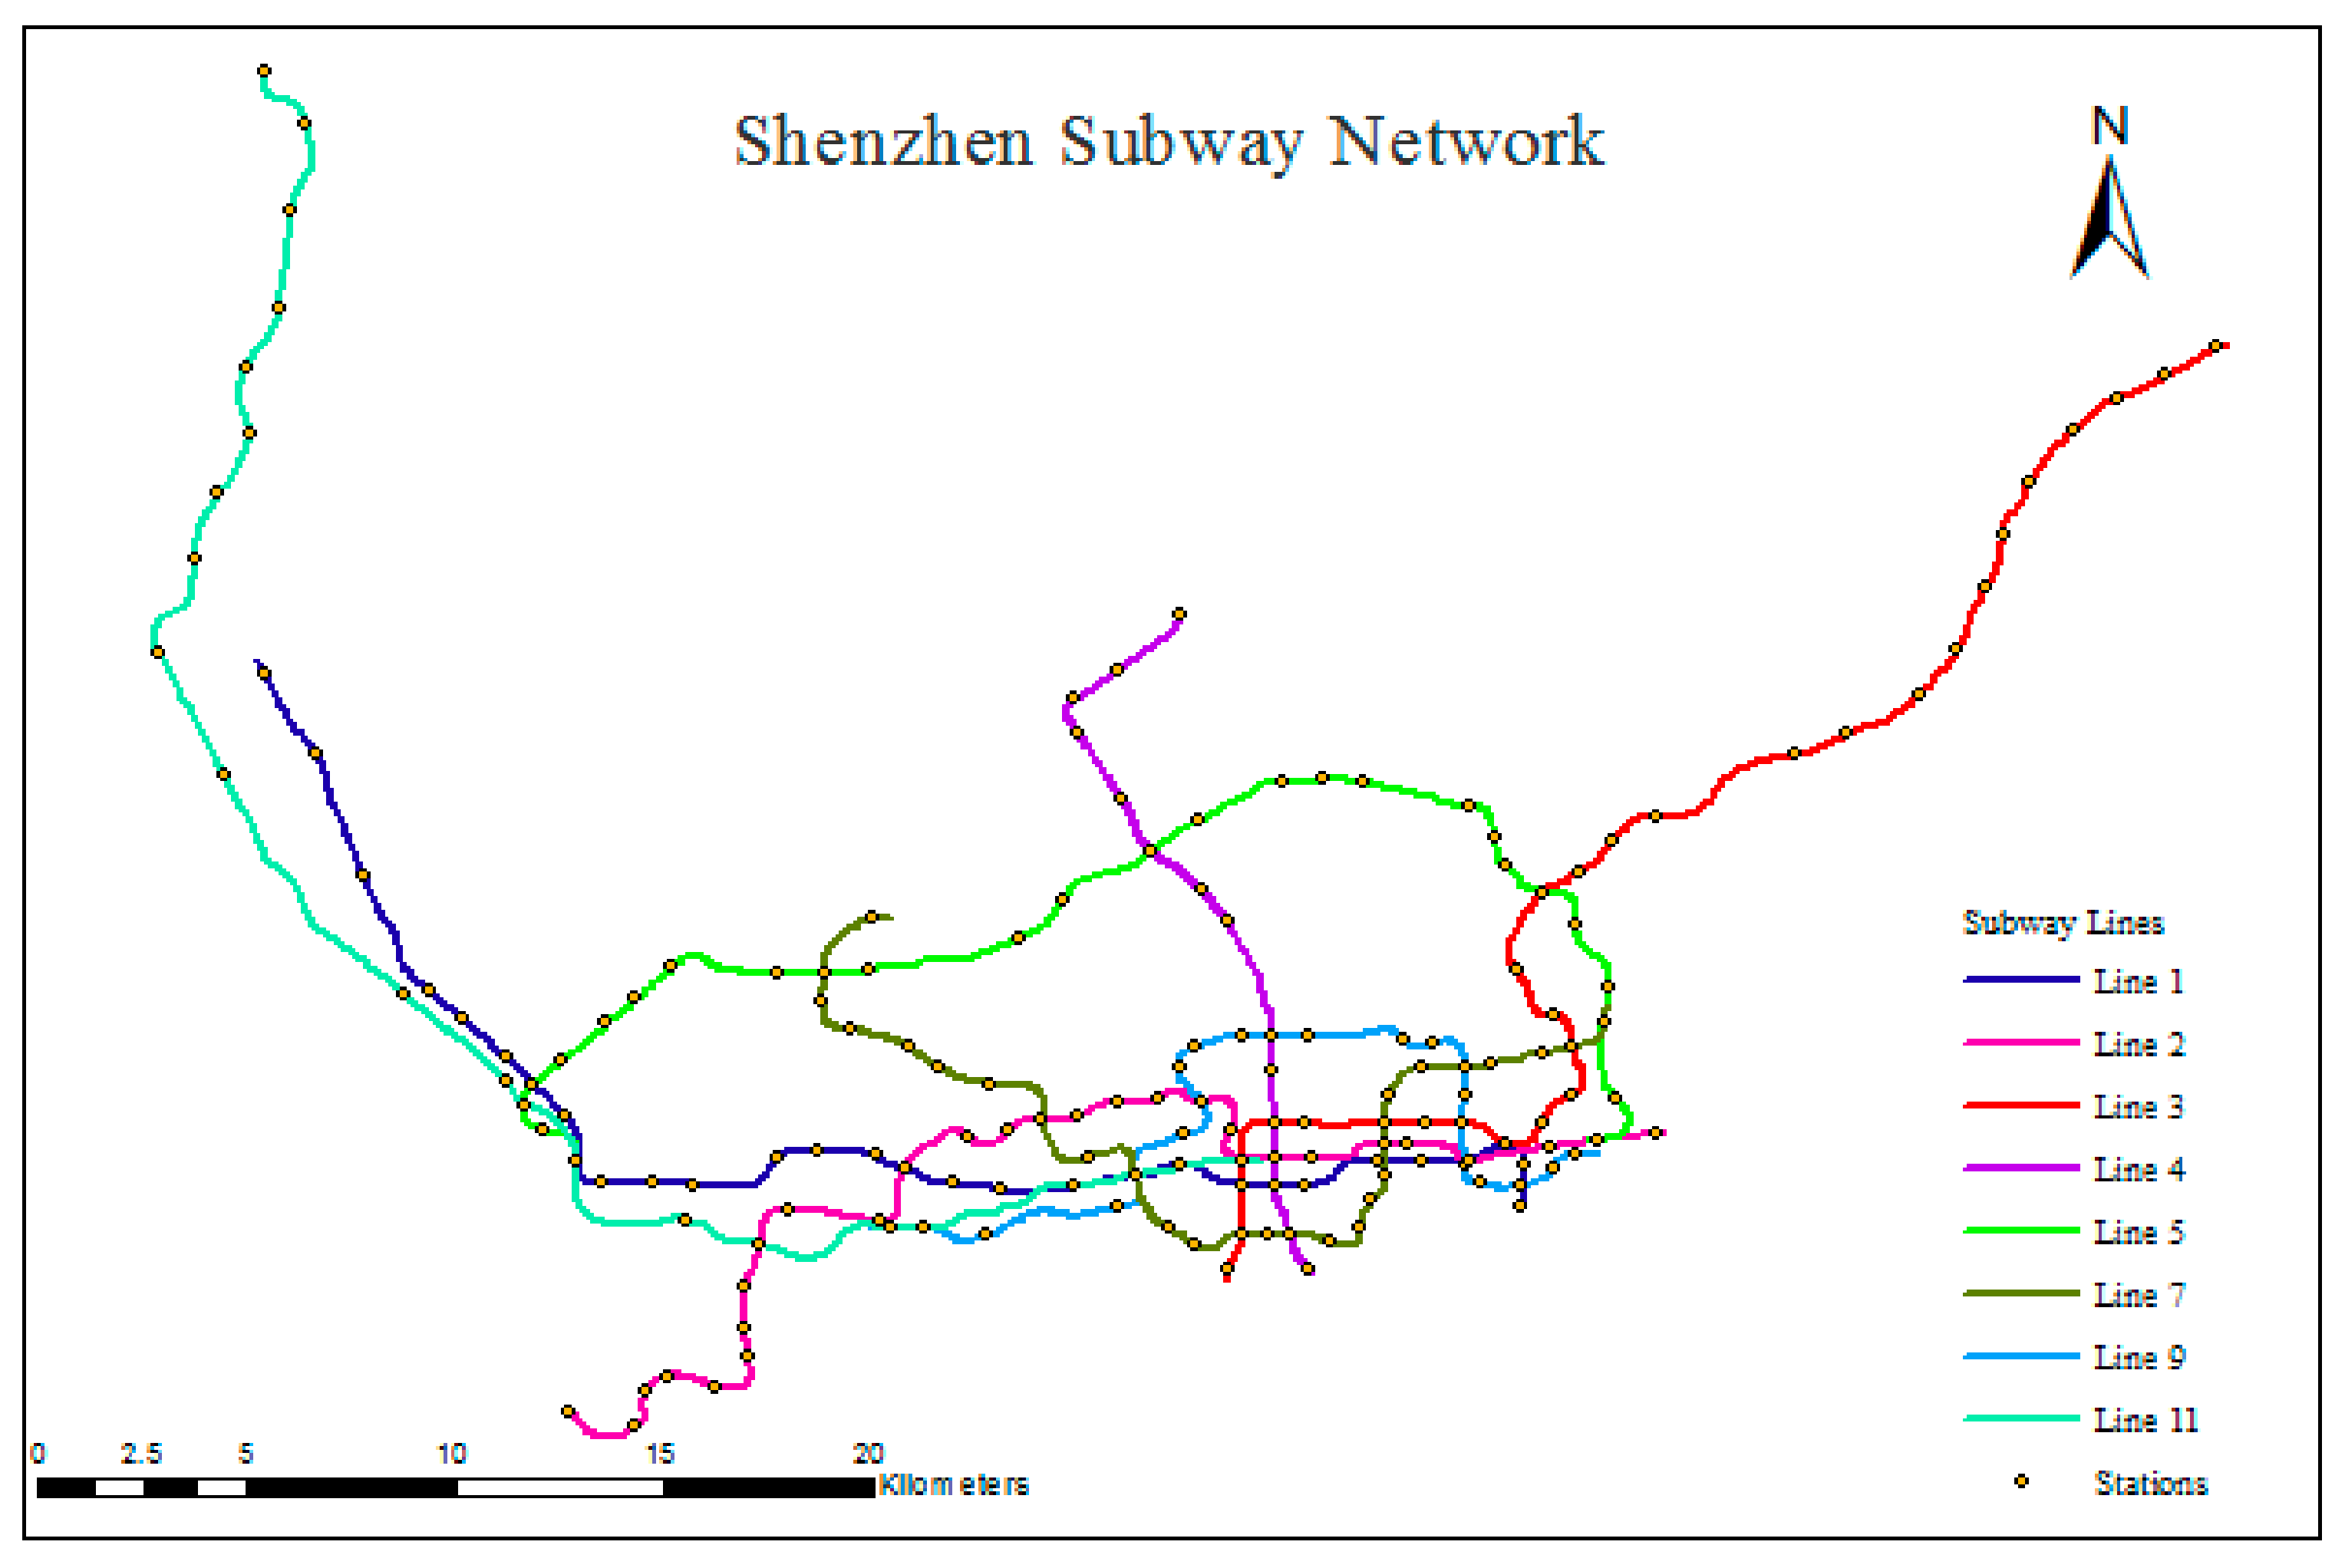
3.1.2. Subway Network
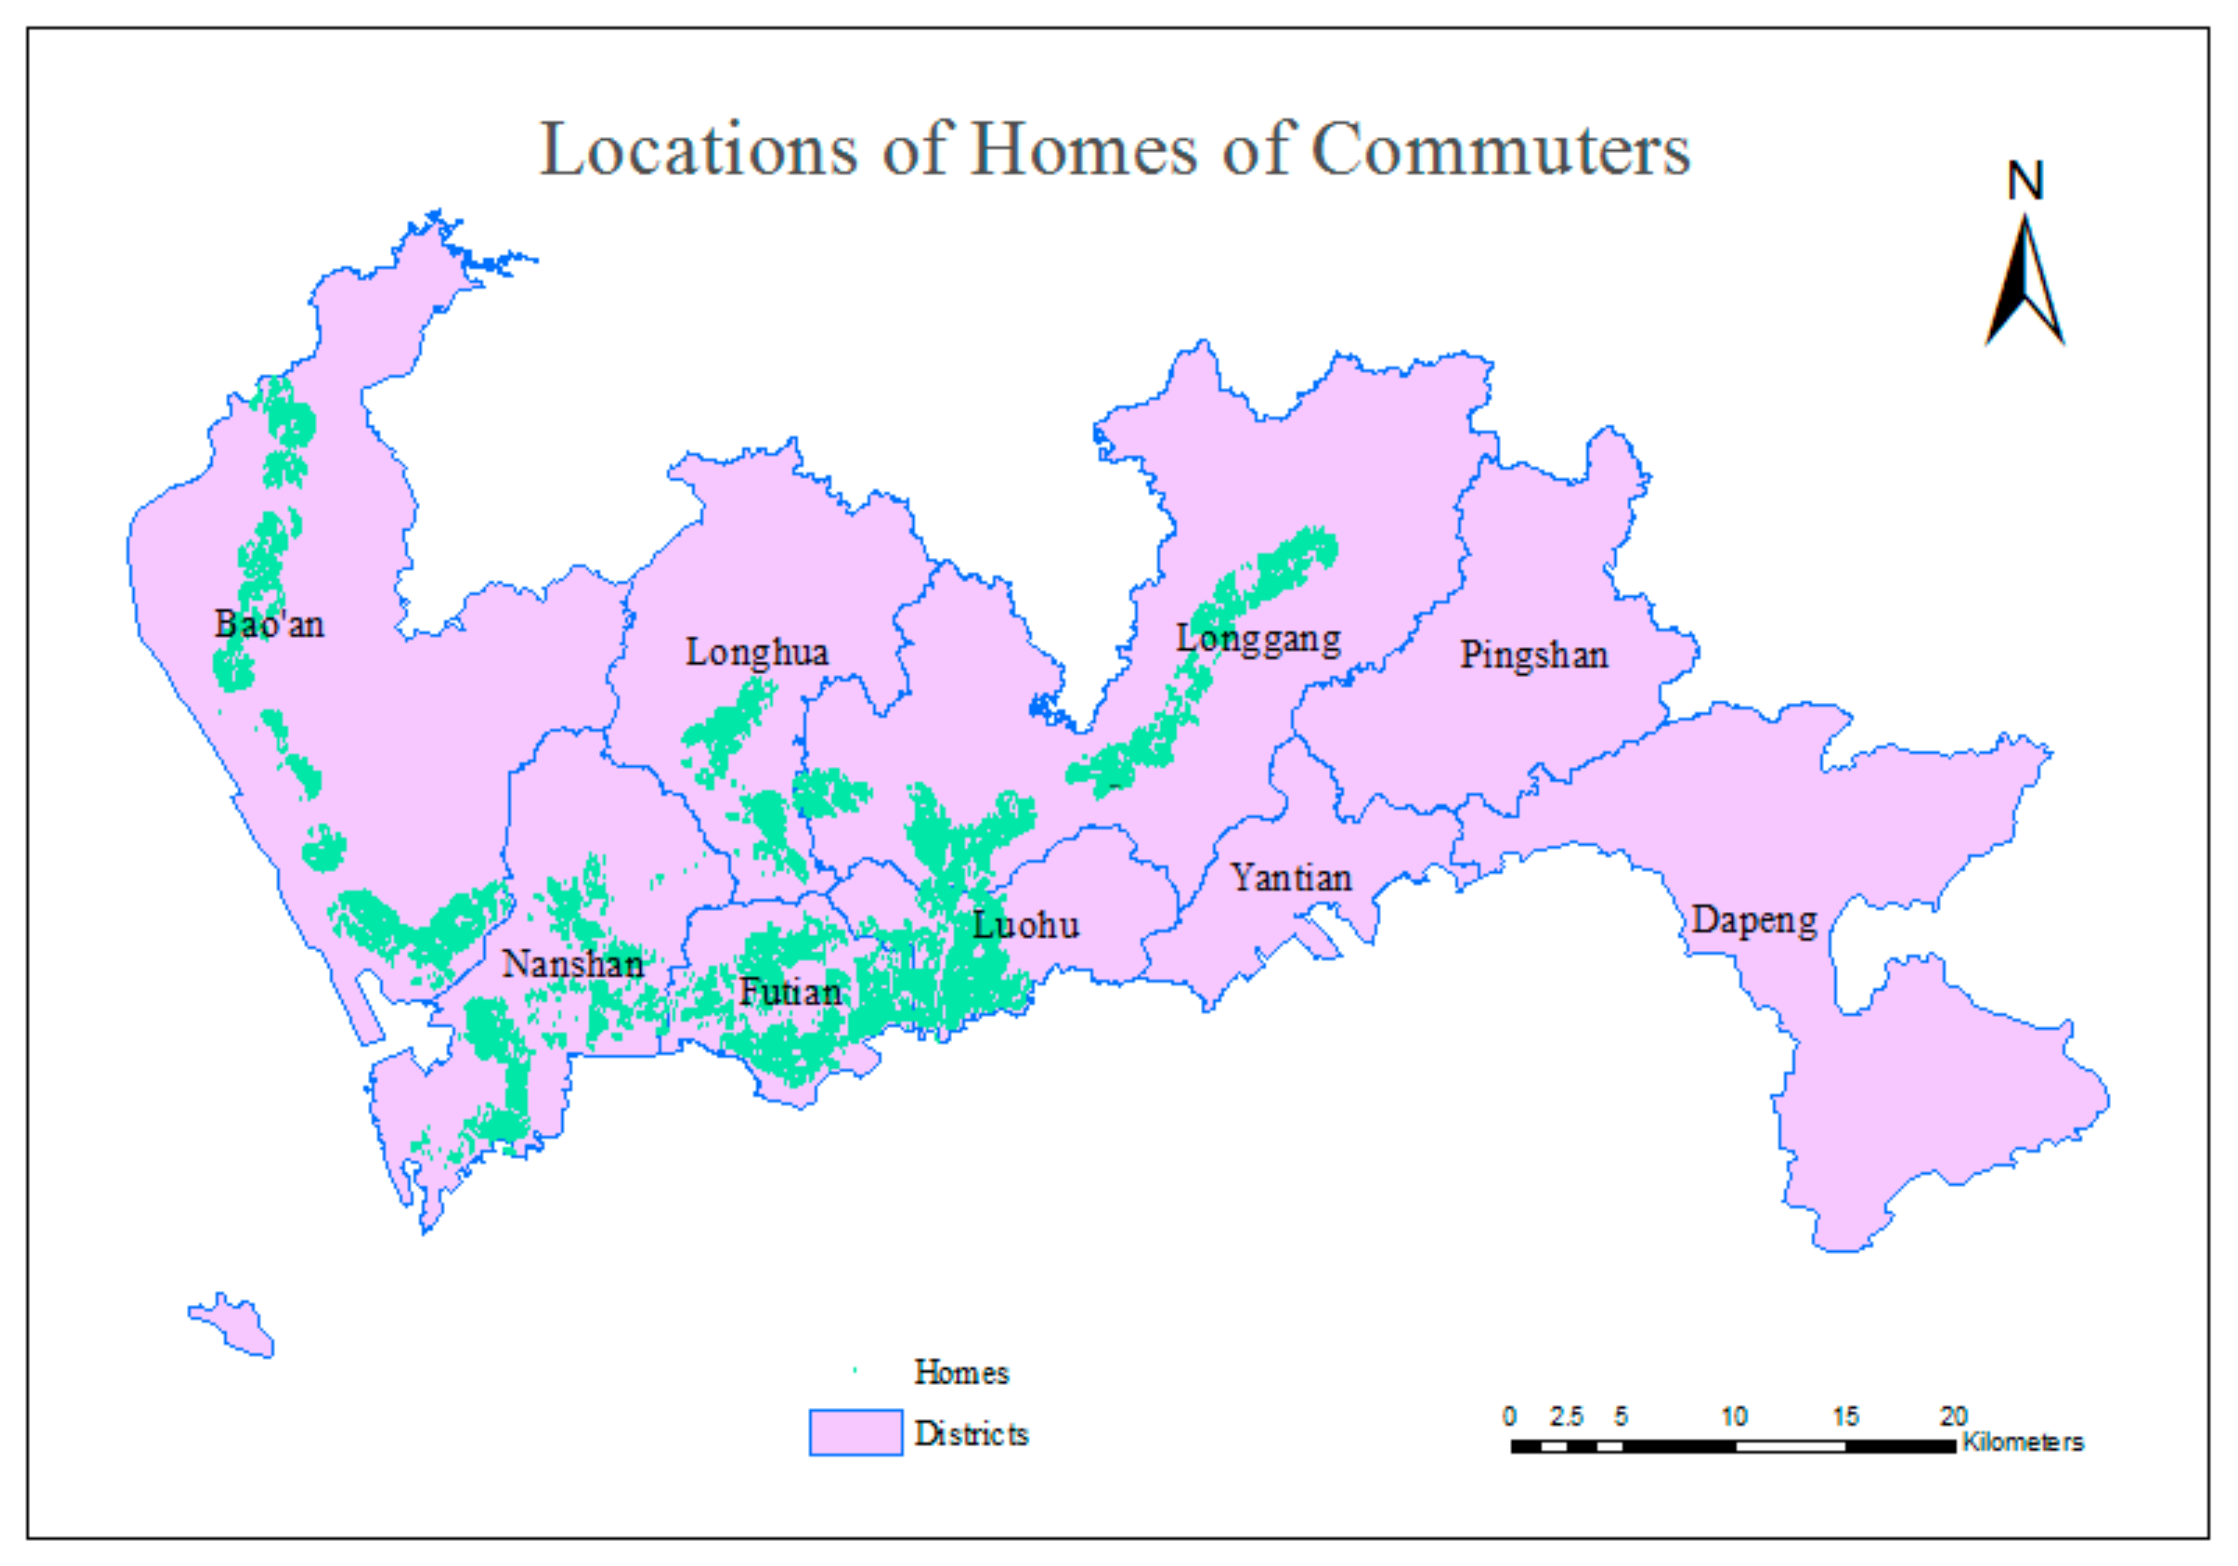
3.1.3. Subway Commuters
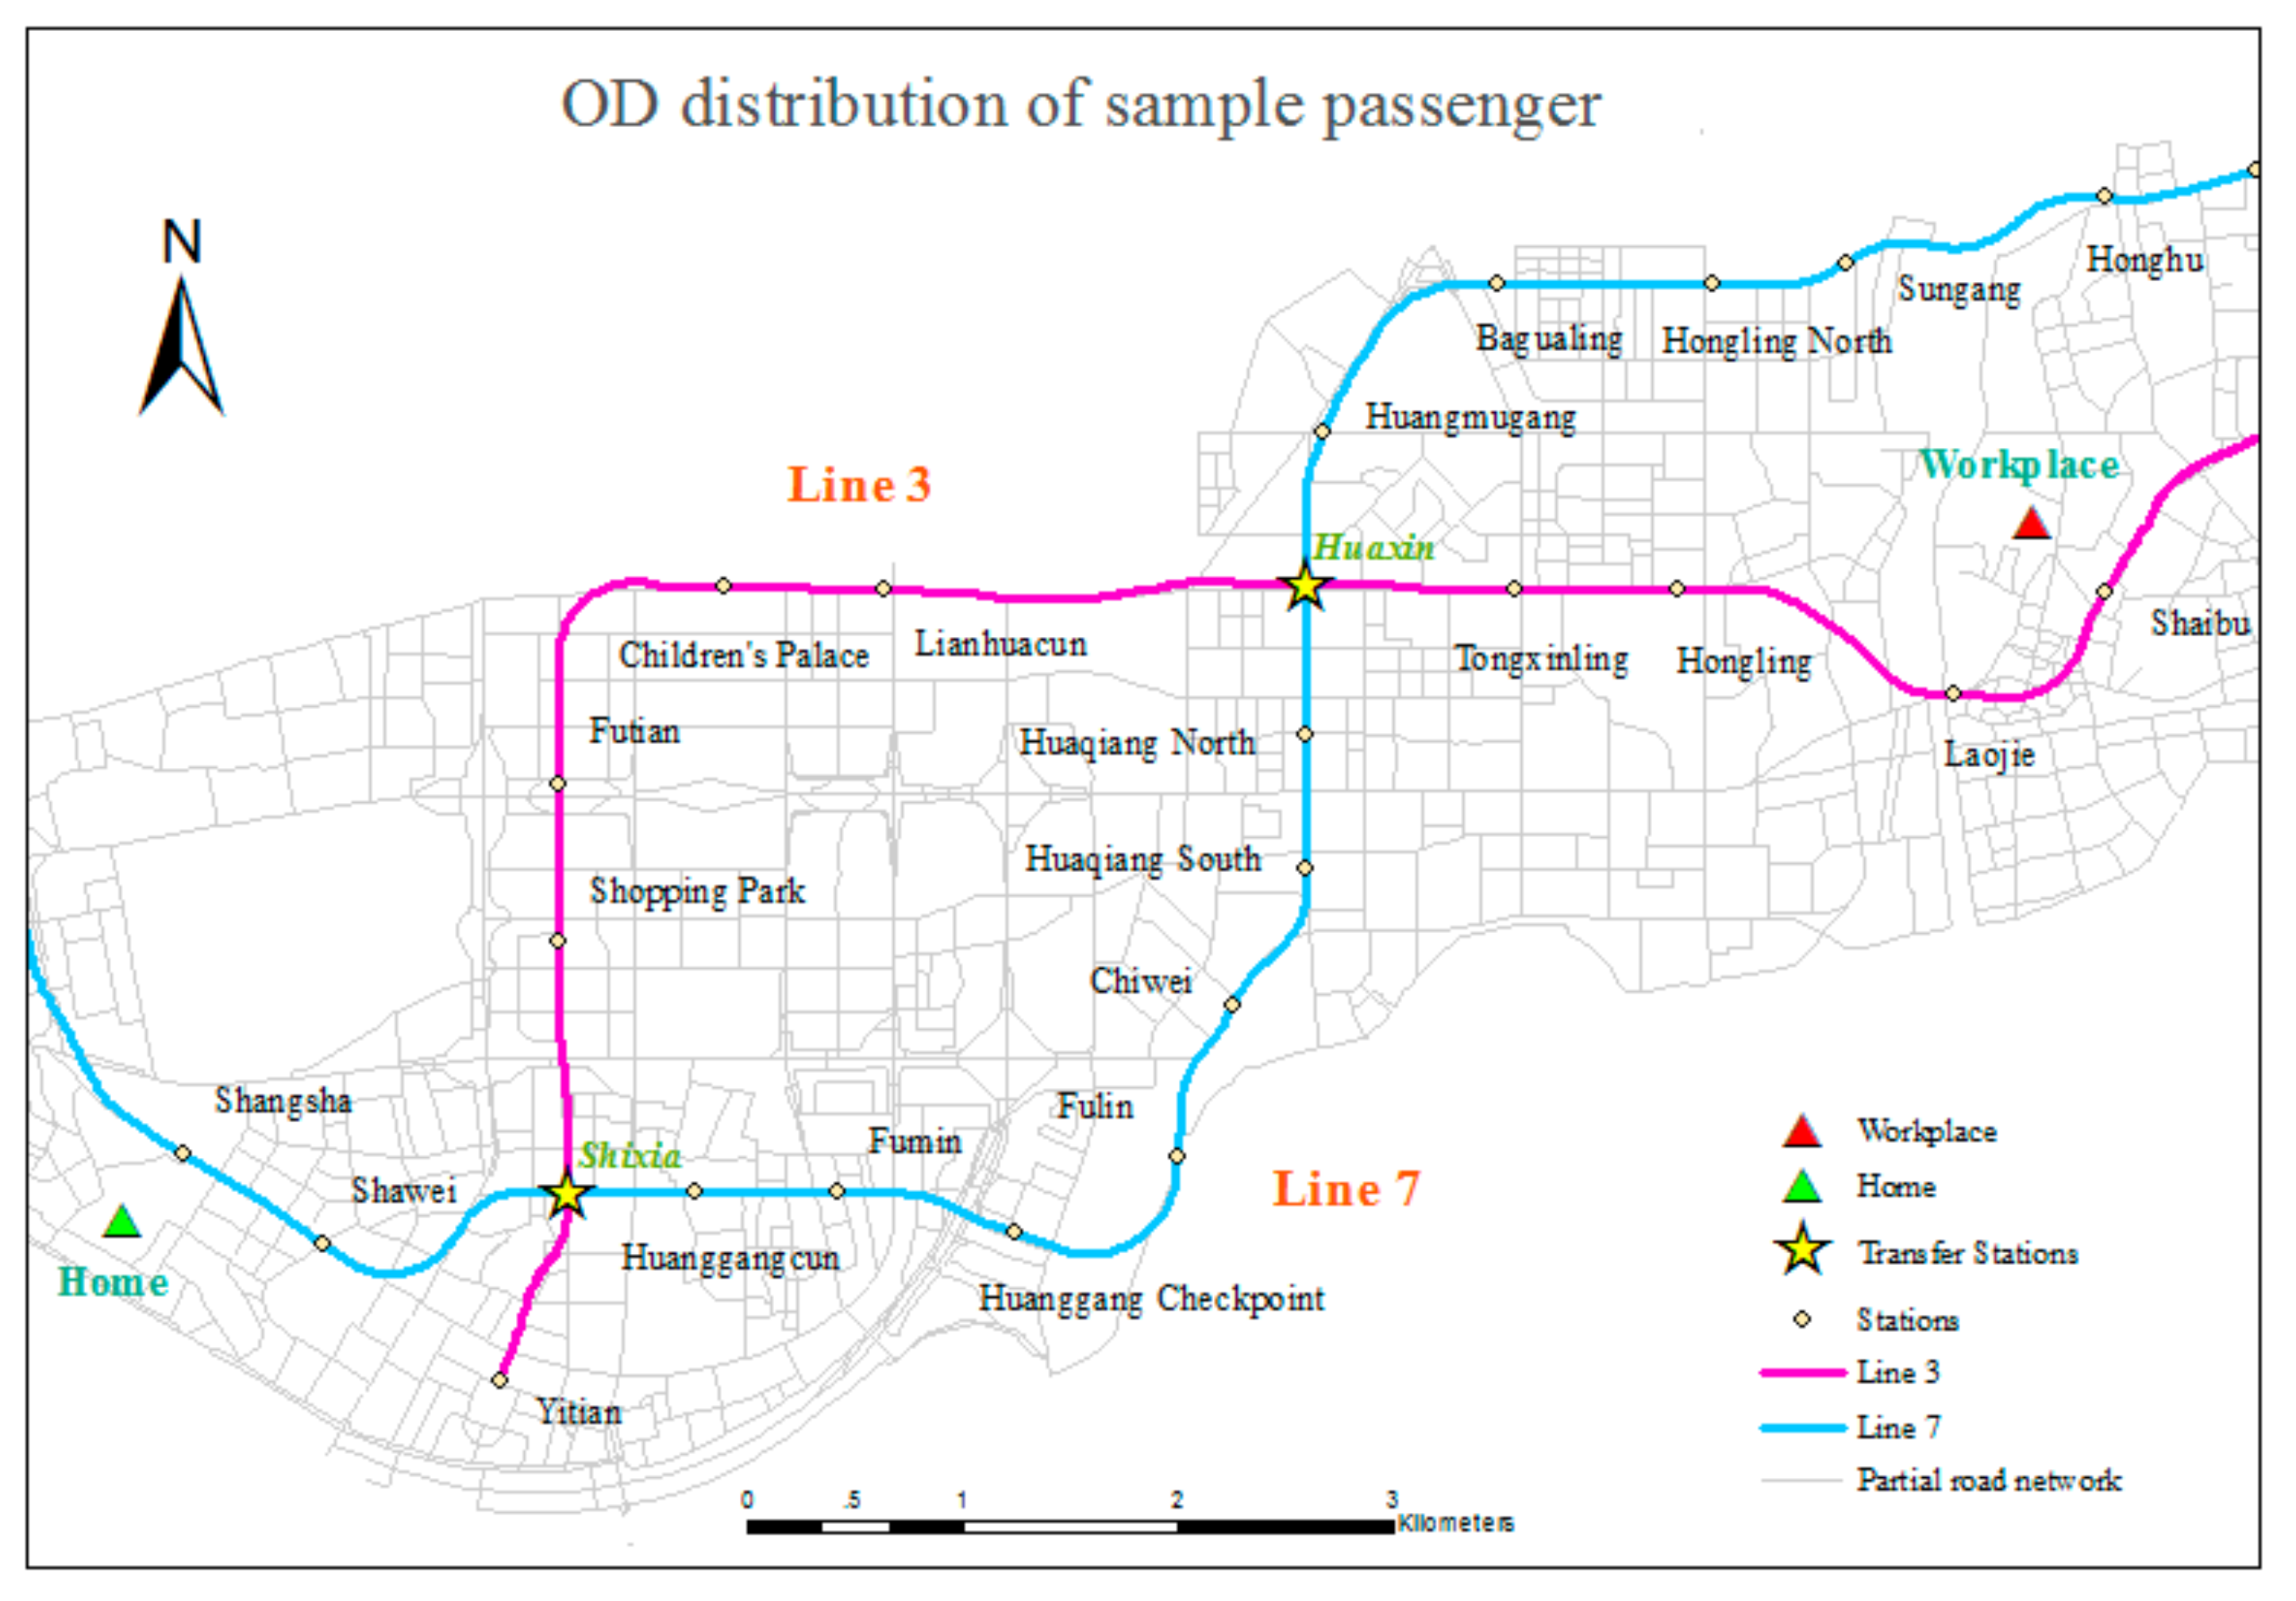
3.2. Detailed Trips
- Step 1. Depart and walk 772 m from home to Shangsha Station.
- Step 2. At Shangsha Station, take Line 7 to Shixia Station.
- Step 3. Transfer, walking 94 m.
- Step 4. At Shixia Station, take Line 3 to Shaibu Station.
- Step 5. Walk 644 m from Shaibu Station to arrive at the workplace.
3.3. Travel Process Simulation
4. Results and Discussion
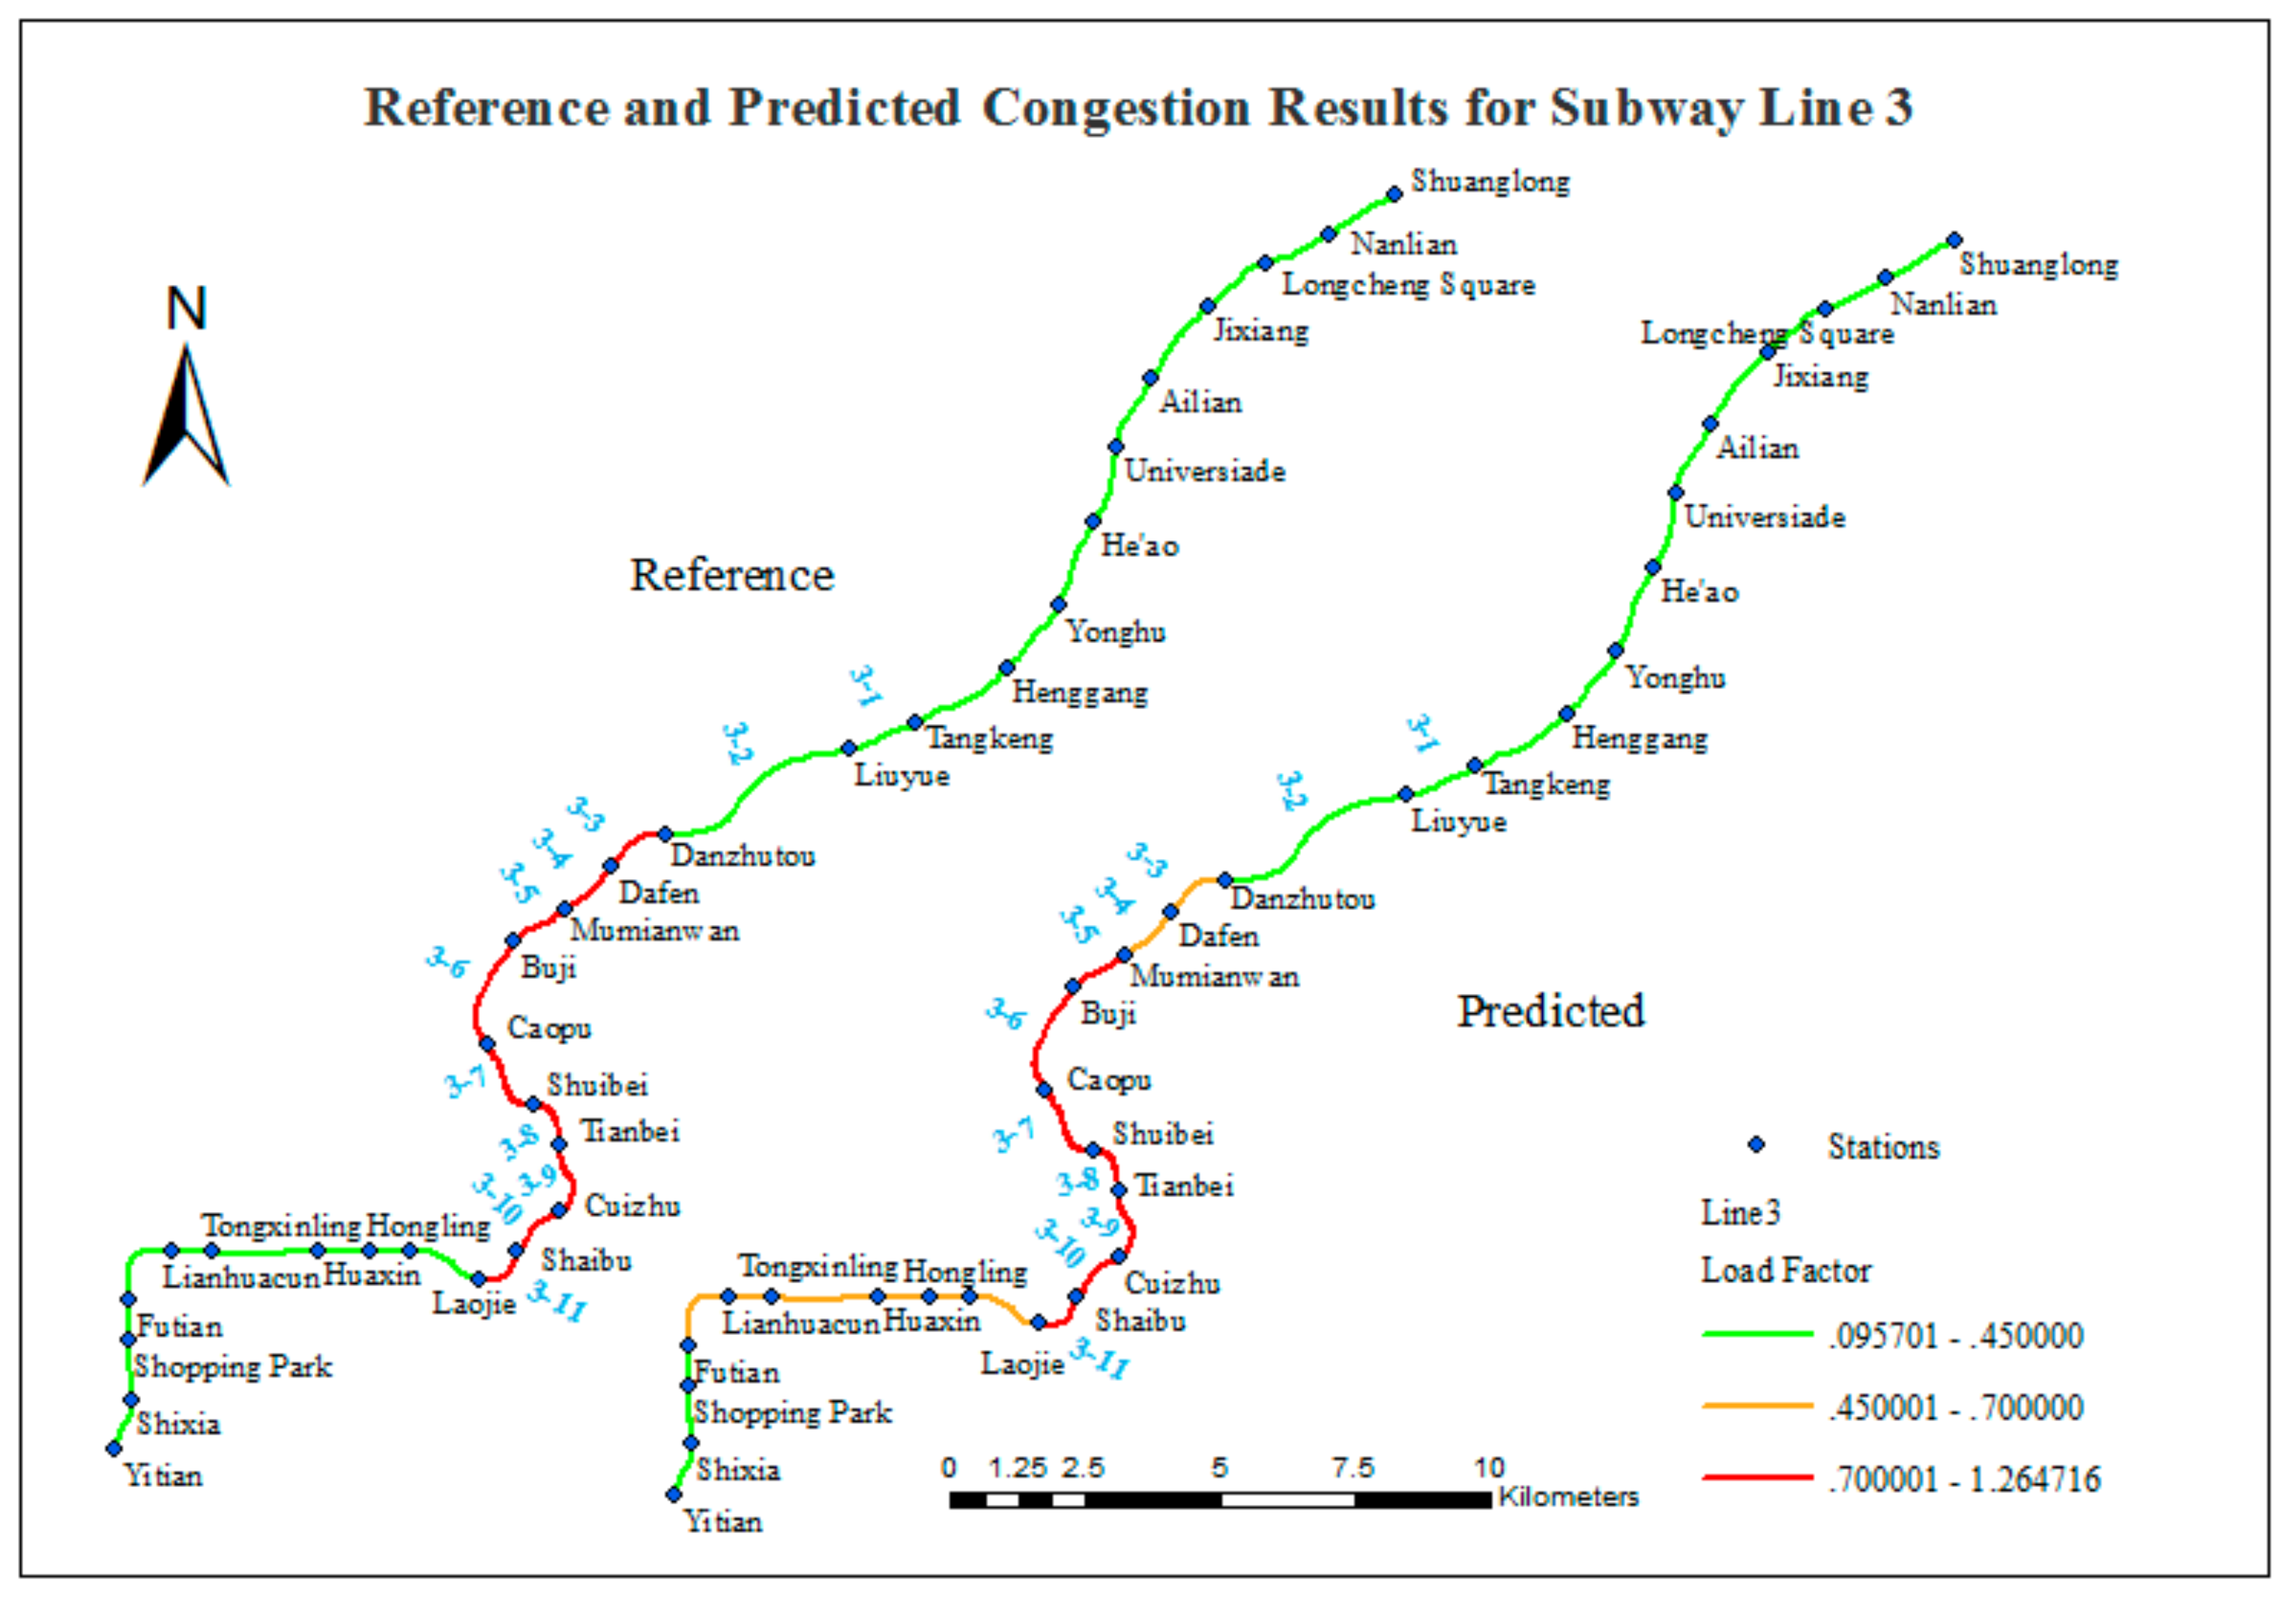
4.1. Predicted Congestion Distribution
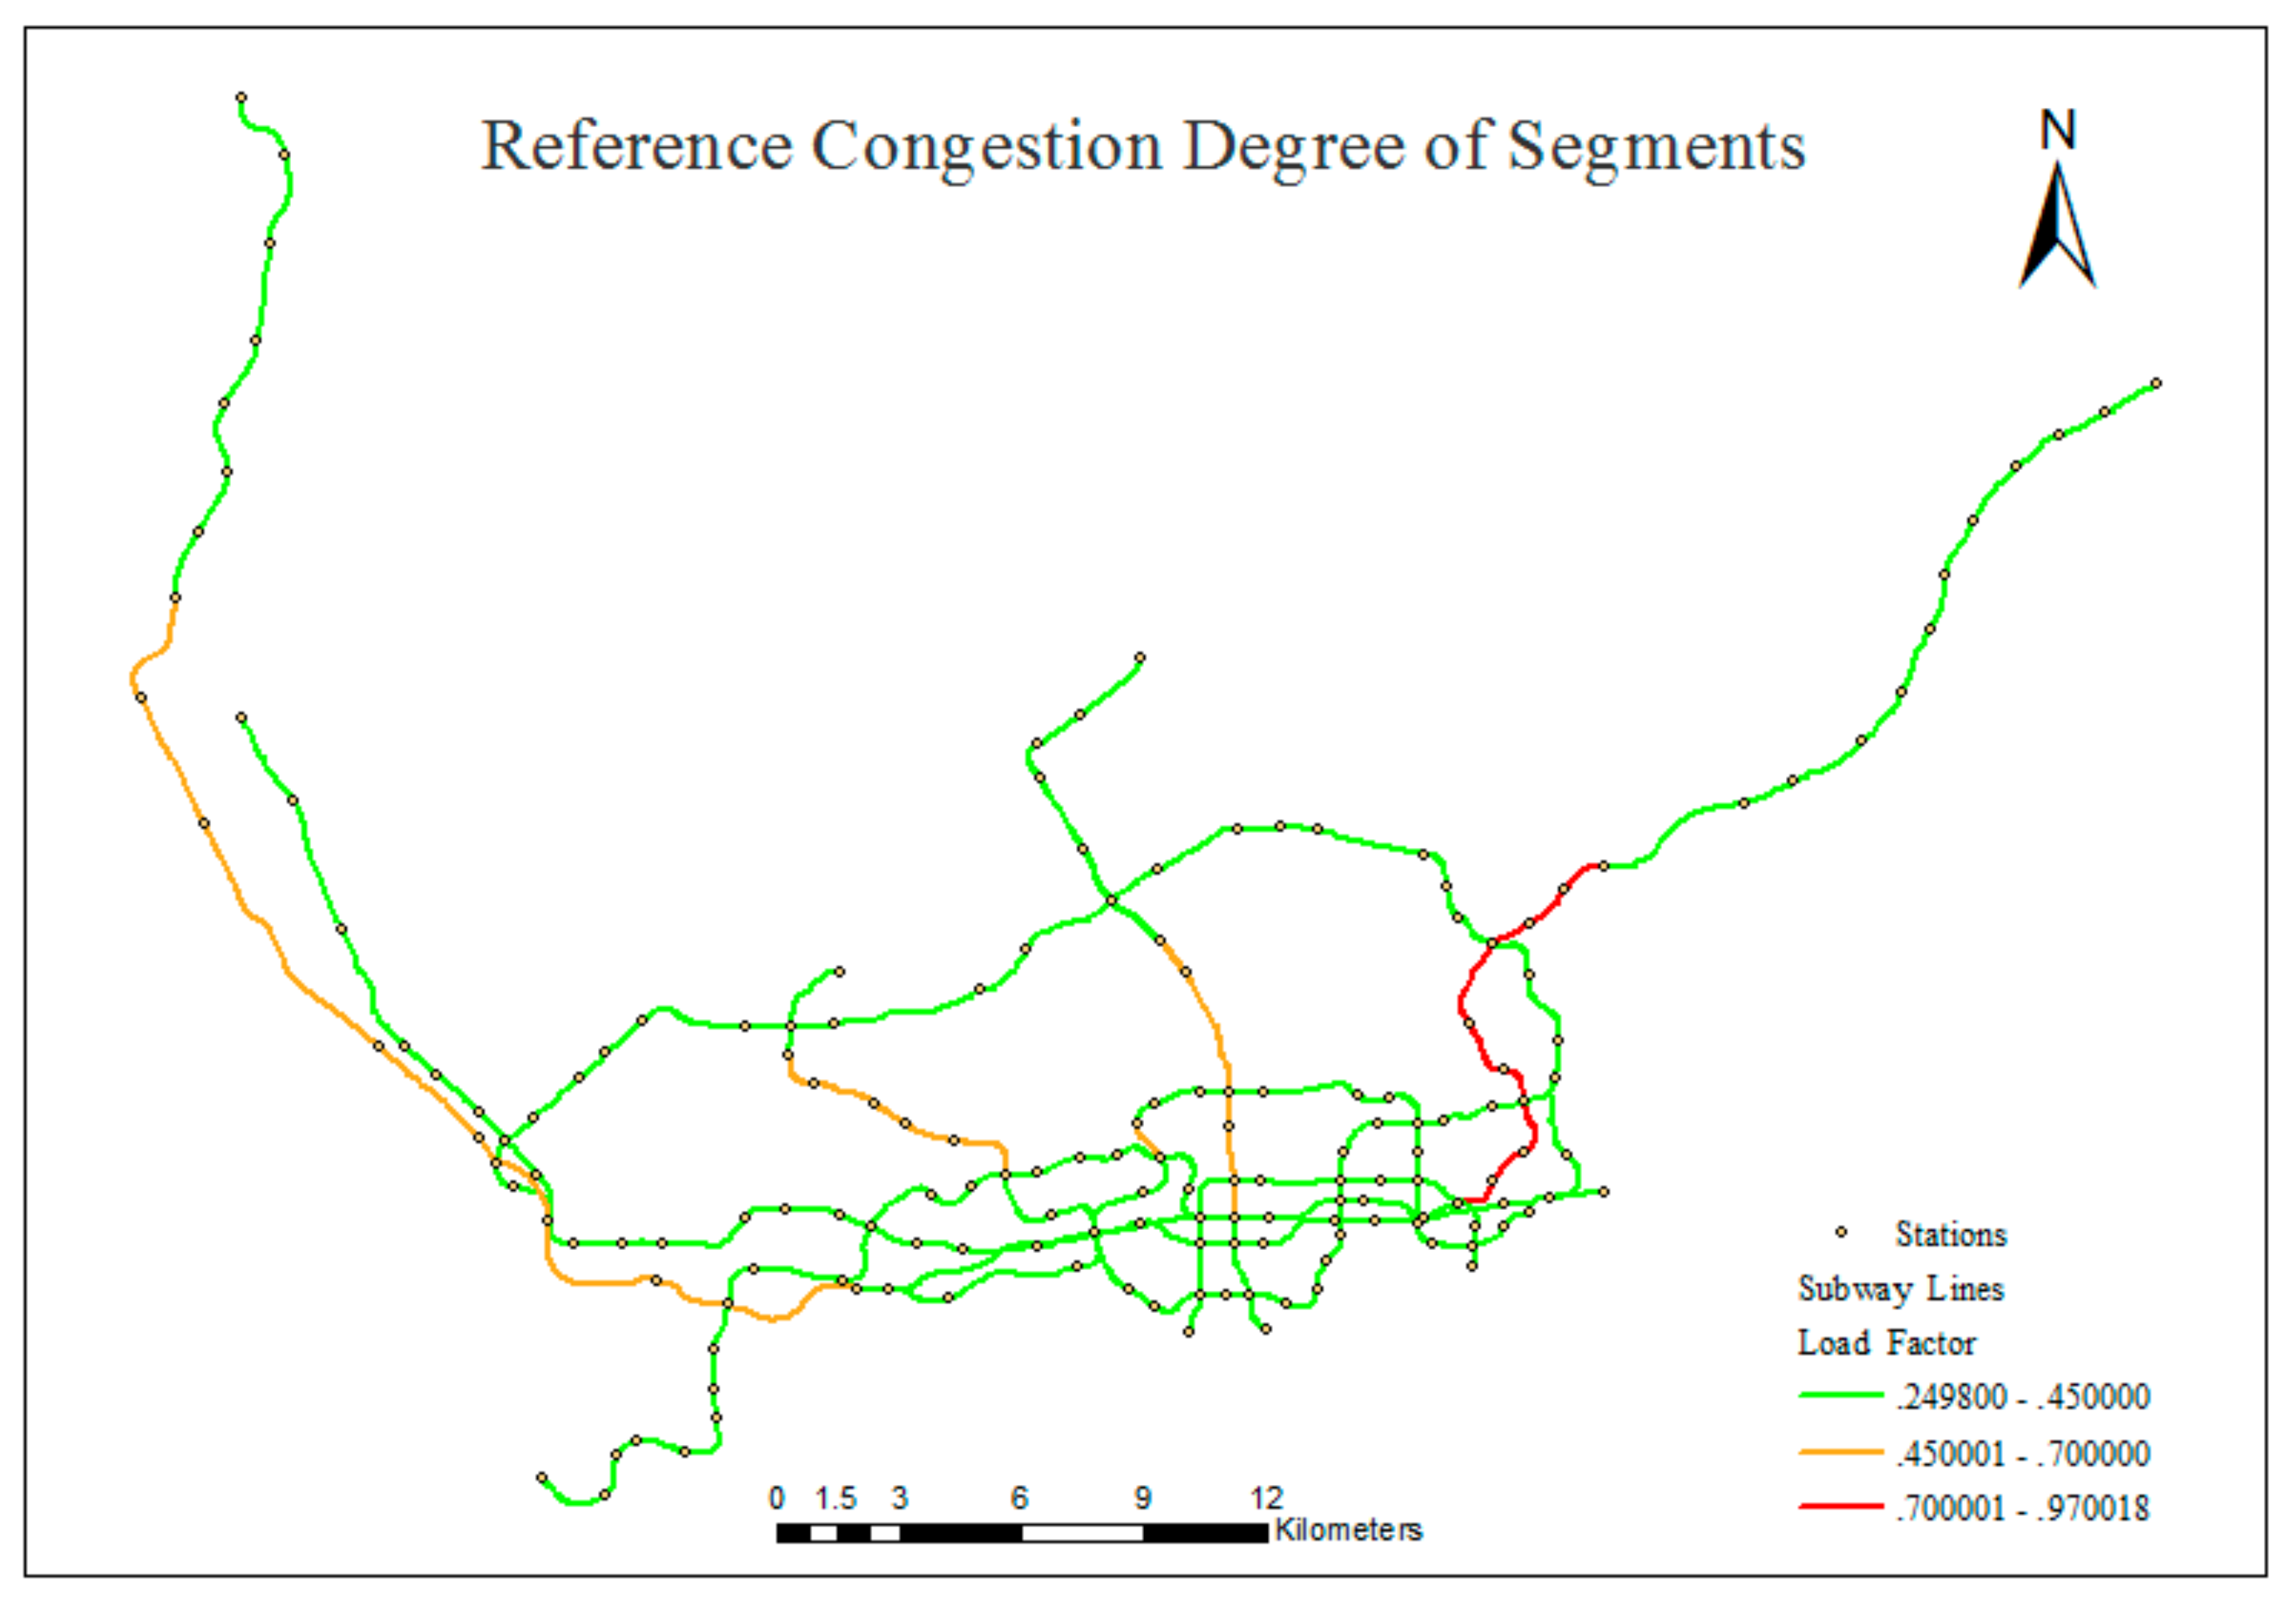
4.2. Reference Congestion Distribution
4.3. Performance Assessment
- Yitian Station to Futian Station (three stations) is labeled as smooth in both the reference data and the predicted results.
- Laojie Station to Mumianwan Station (seven stations) is labeled as congested in both the reference data and the predicted results.
- Danzhutou Station to Shuanglong Station (11 stations) is labeled as smooth in both the reference data and the predicted results.
- Futian Station to Laojie Station (six stations) is labeled as smooth in the reference data and crowded in the predicted results.
- Mumianwan Station to Danzhutou Station (two stations) is labeled as congested in the reference data and crowded in the predicted results.
- (1)
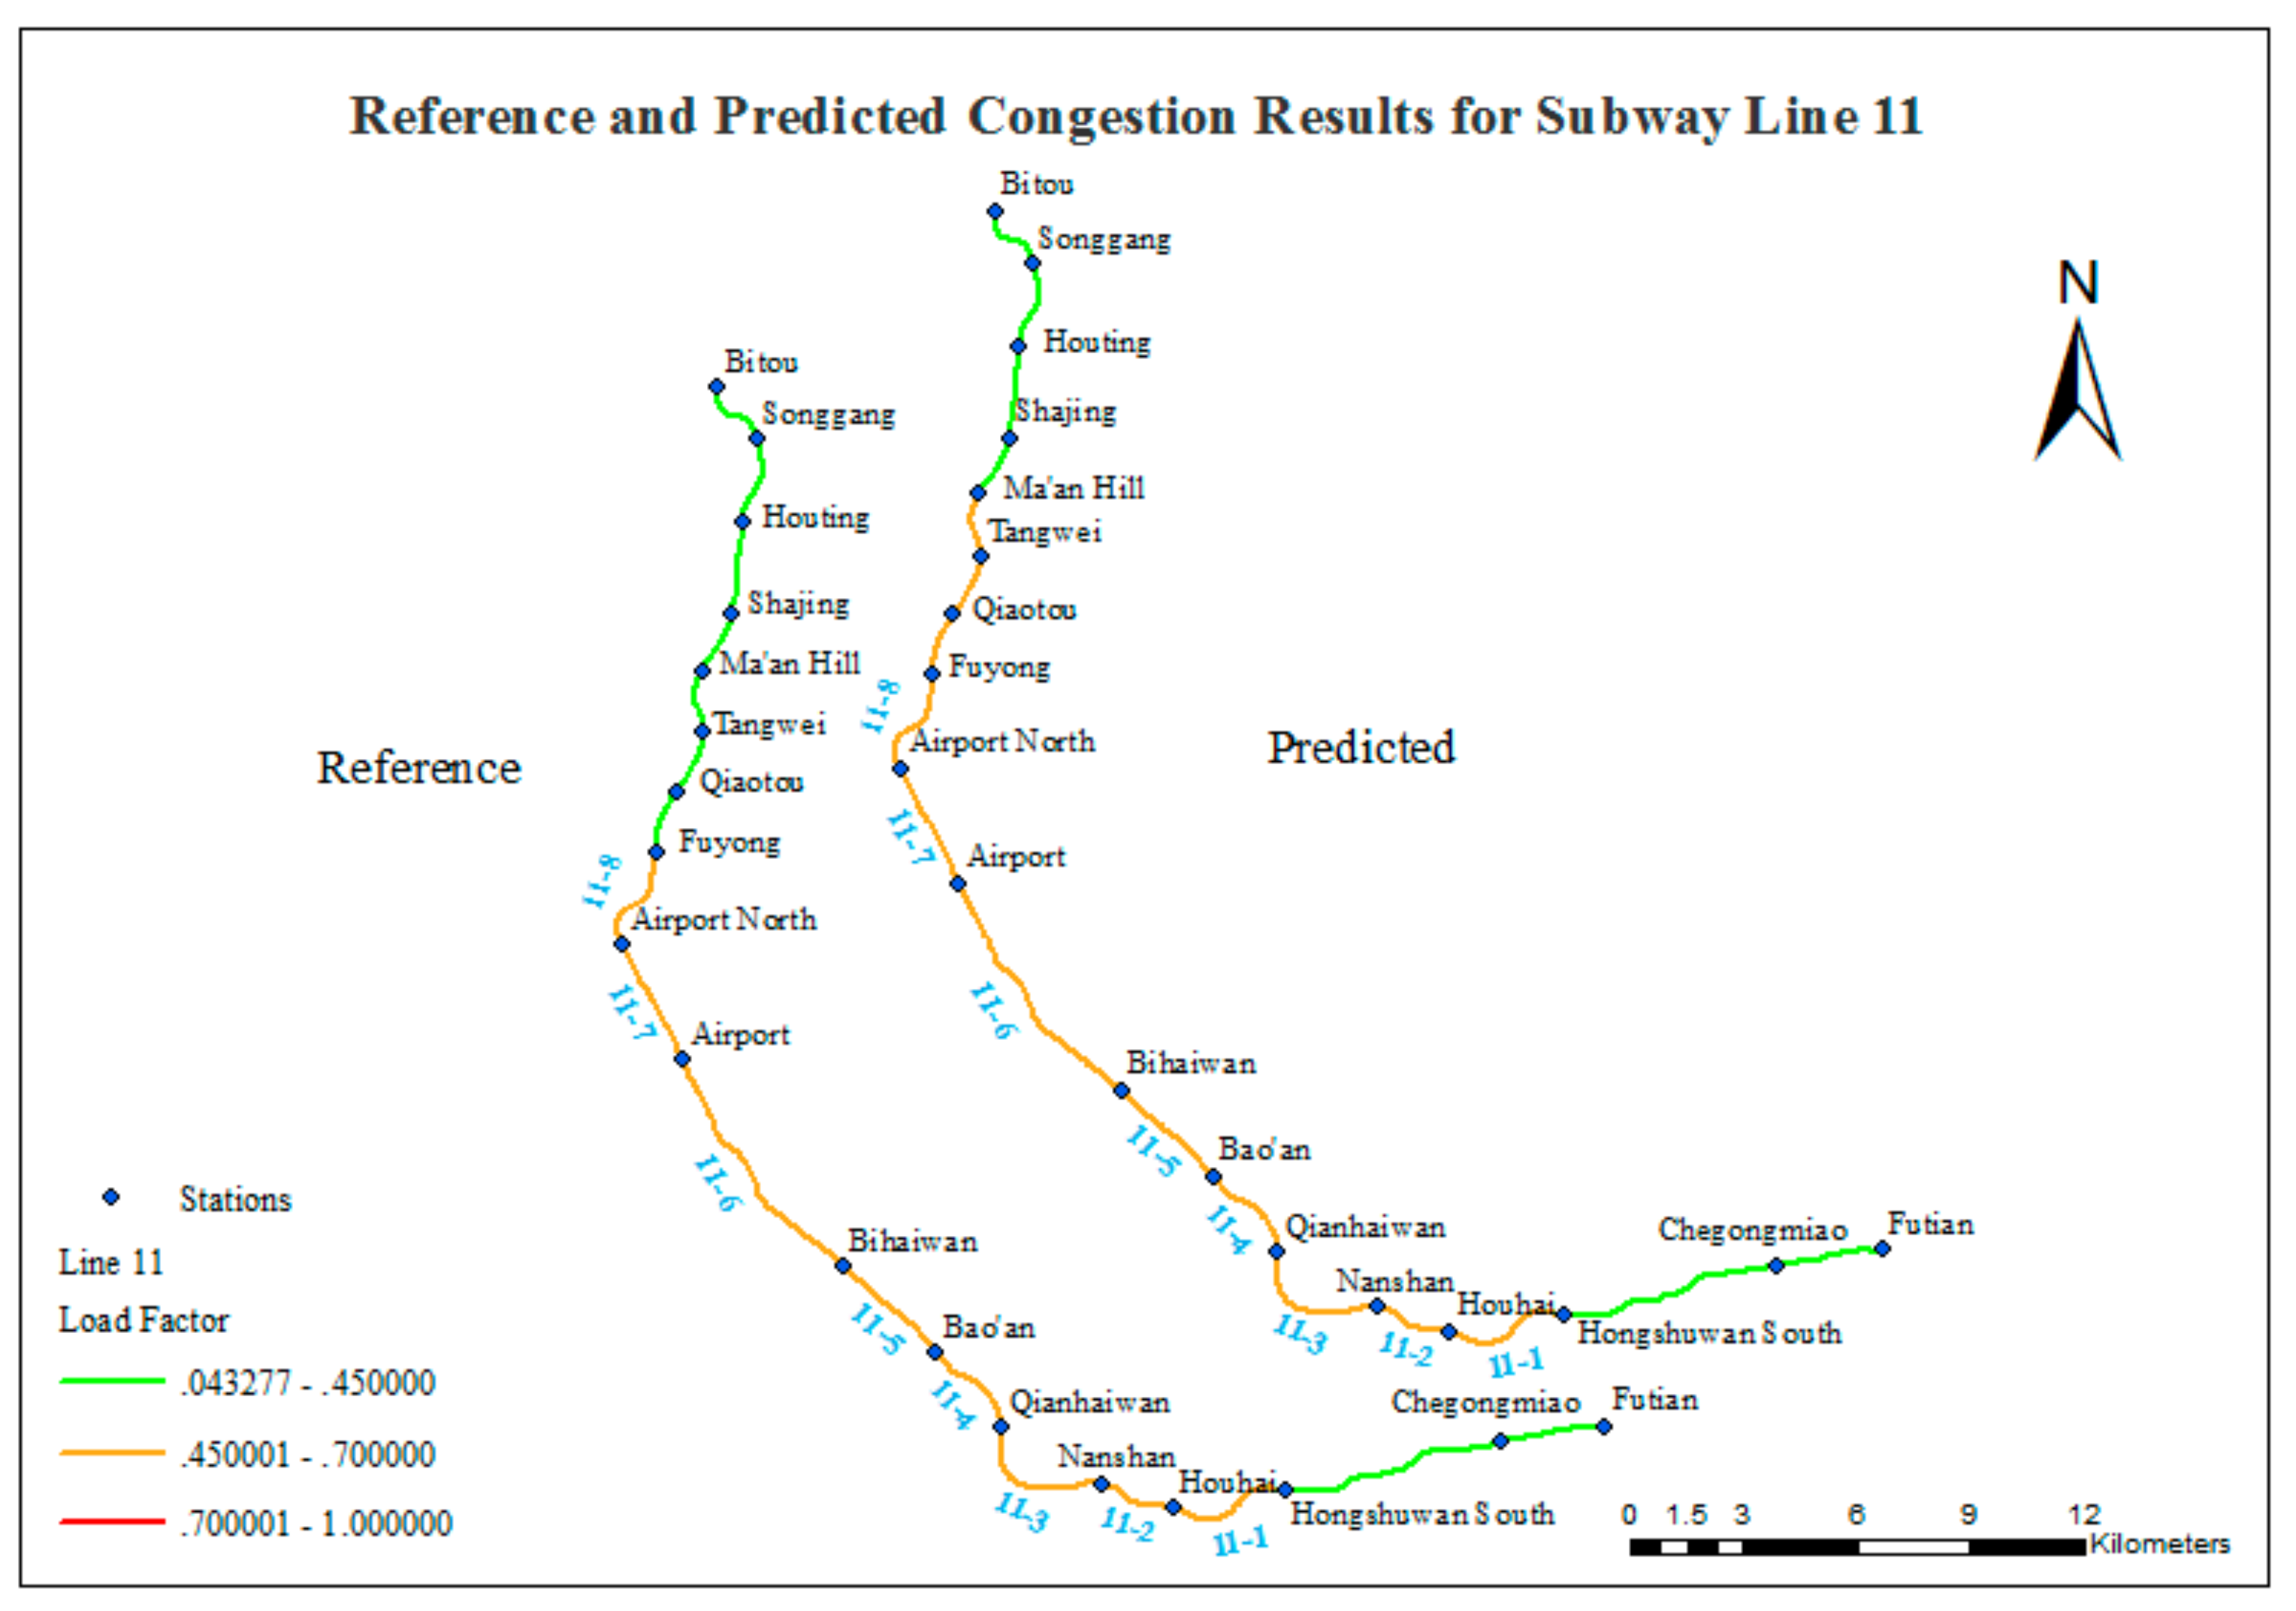
- Bitou Station to Ma’an Hill Station (four stations) is labeled as smooth in both the reference data and the predicted results.
- (2)
- Fuyong Station to Houhai Station (seven stations) is labeled as crowded in both the reference data and the predicted results.
- (3)
- Houhai Station to Futian Station (three stations) is labeled as smooth in both the reference data and the predicted results.
- (1)
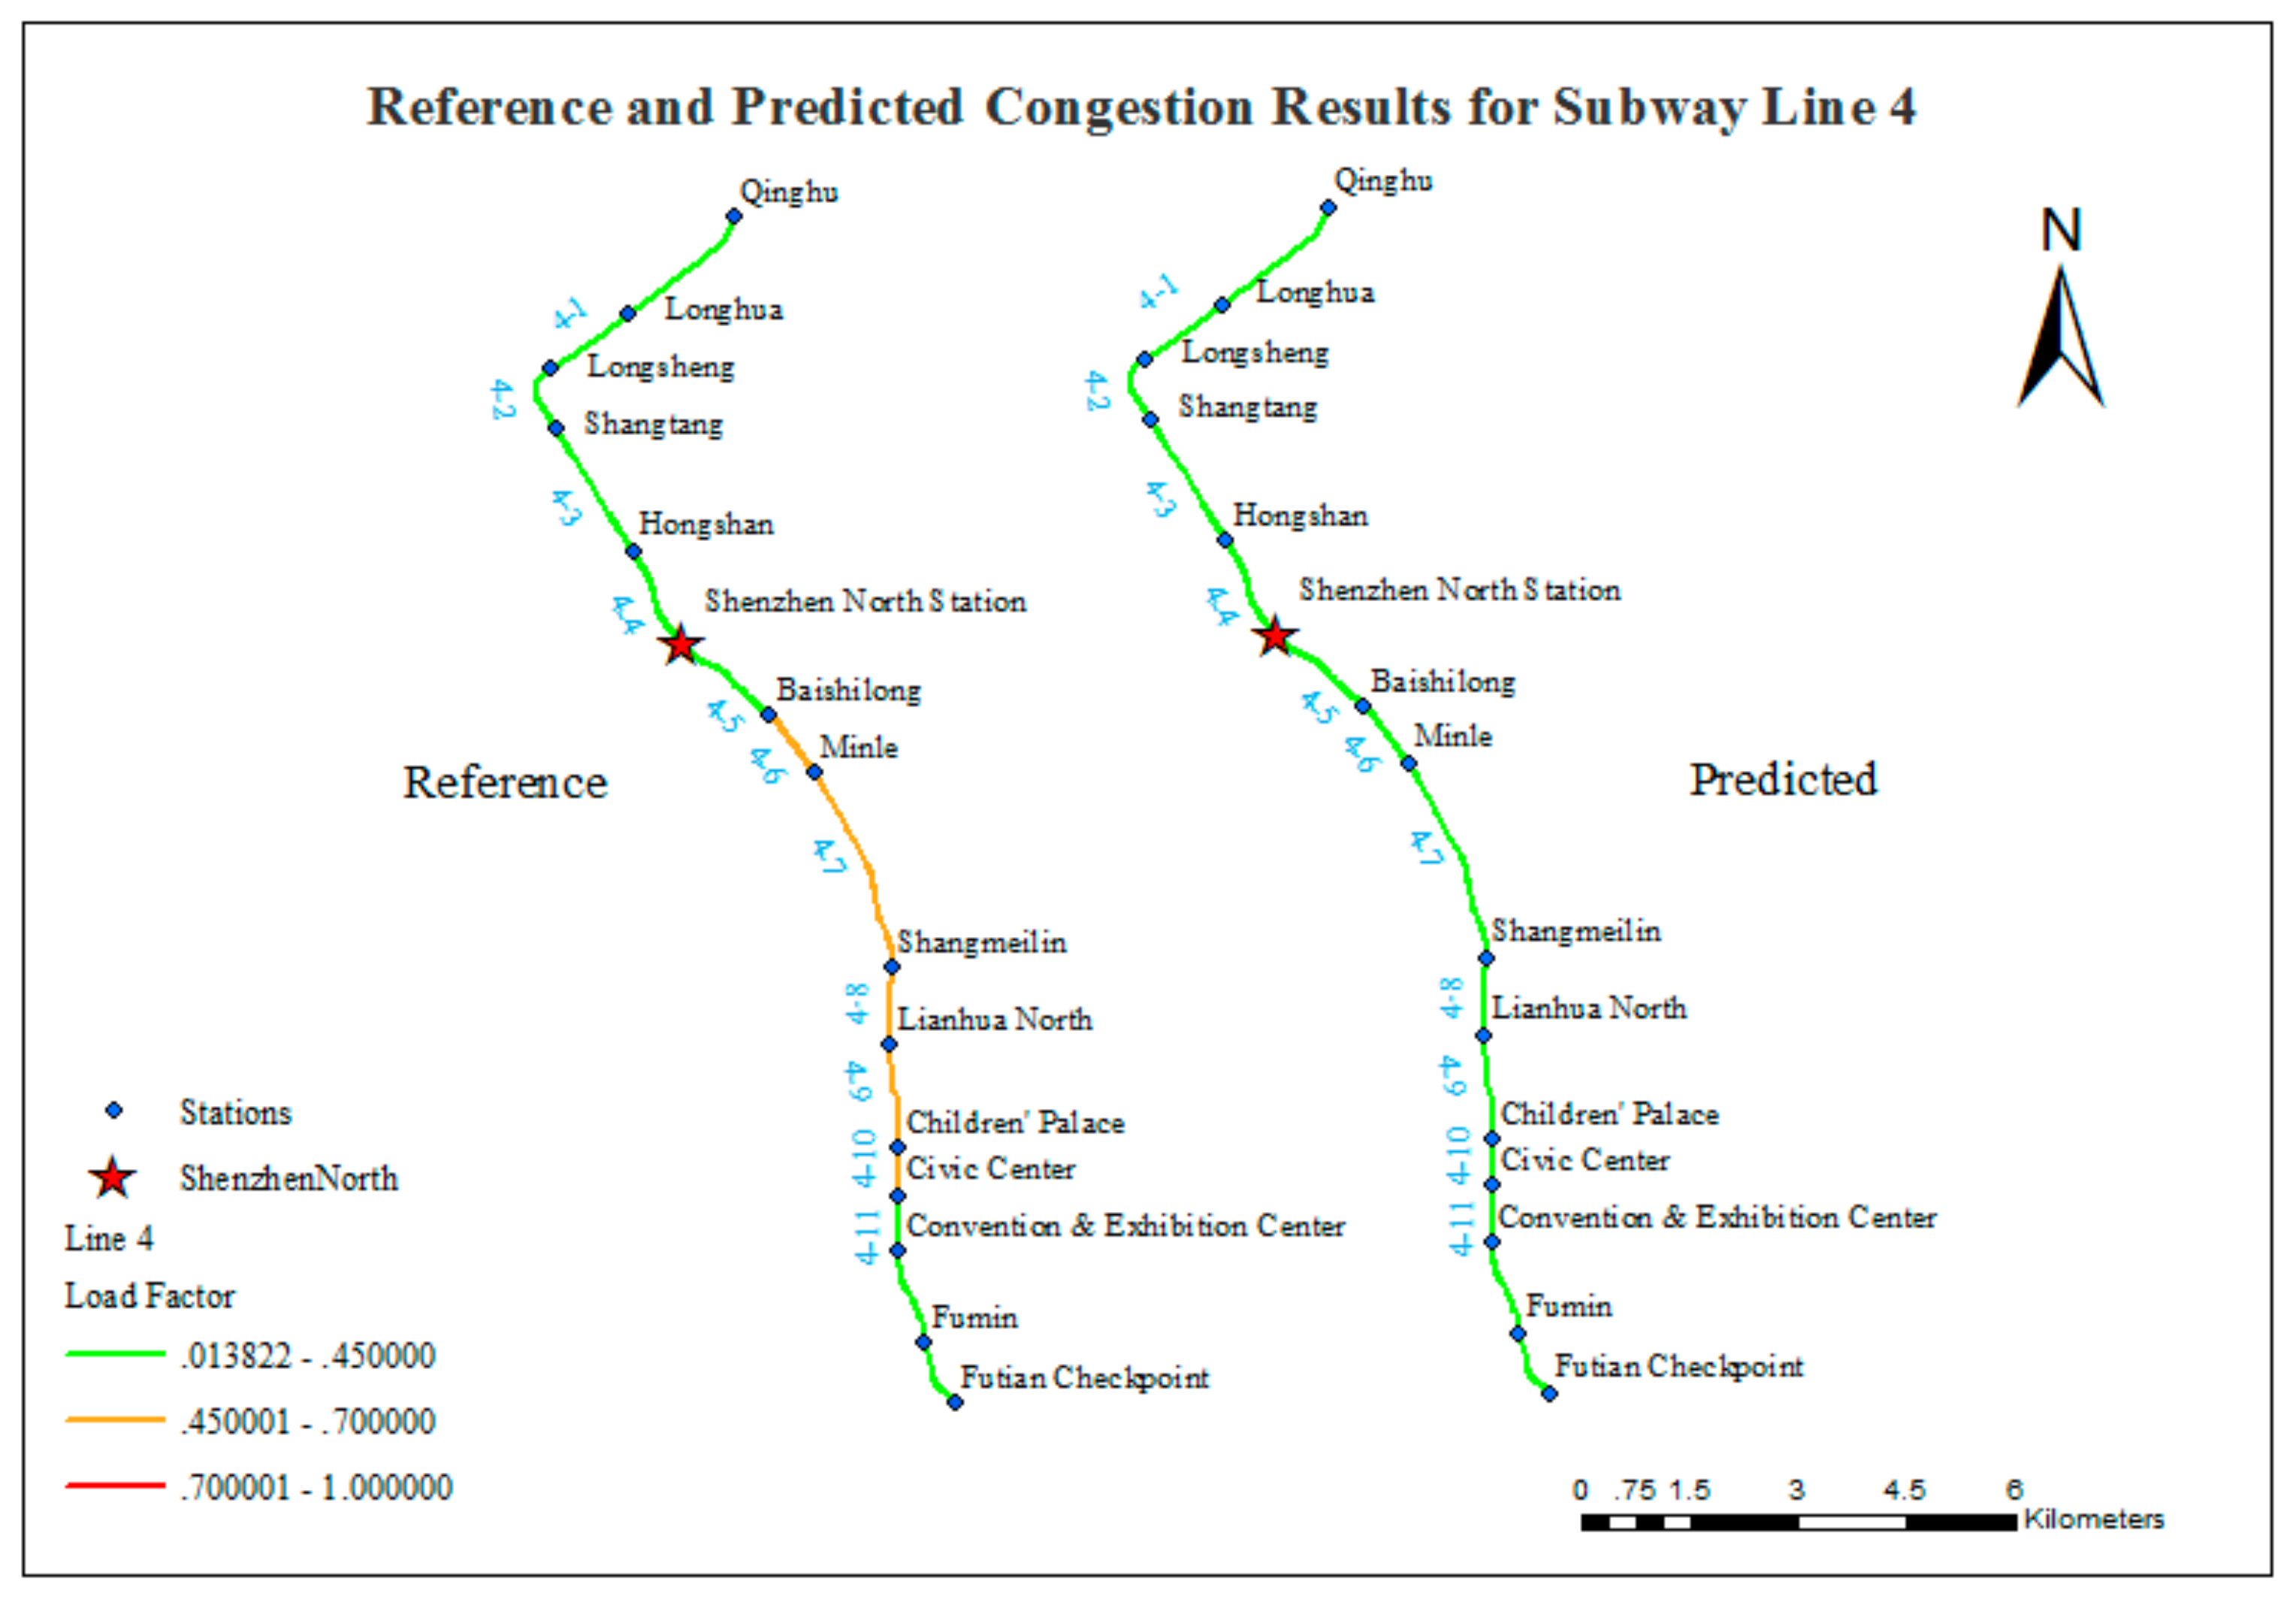
- As noted above, the prediction of congestion in the subway system of Shenzhen is based on the simulation of subway commuting behaviors. One significant assumption is that the commuting passenger flow makes up a large proportion of the total flow, and non-commuting passenger flow can be neglected. This assumption is reasonable for the subway lines other than Line 4, which includes Shenzhen North subway station that connects to Shenzhen North railway station (SZNRS). SZNRS serves a huge number of passengers traveling in and out of Shenzhen. Therefore, Shenzhen North subway station is constantly over capacity; its year-round passenger volume reached 67 million in 2015, ranking first among all of the stations. In contrast, in this experiment, the passenger flow volume for the Shenzhen North Station is 1027 and ranks 117th. Line 4 is the major subway line that connects Futian District (the downtown area) with SZNRS; thus, it carries a very large non-commuting passenger flow. This study does not consider the influence of non-commuting passenger flows, and the overall congestion conditions are underestimated for Line 4.
- (2)
- The OD information used in this study was collected in 2012. The LongHua New District has developed rapidly in recent years, and many people have moved there. Shenzhen Line 4 is the only subway line that reaches LongHua New District, and this line connects the LongHua New District with downtown. Thus, the demand for travel on Line 4 has increased rapidly in recent years, which may have produced this inconsistency.
- (3)
- Line 4 is the only one operated by MTR <Shenzhen>; the others are operated by SZMC. Different operation and management practices may have some influence on the passenger flow characteristics.
5. Conclusions
- (1)
- promising results are obtained by the proposed method;
- (2)
- data on the workplaces and homes of residents can be utilized to forecast passenger flows in public transportation systems; and
- (3)
- the predicted congested subway segments and the corresponding causes can be provided for use in traffic management-related decision support.
Author Contributions
Funding
Acknowledgments
Conflicts of Interest
Appendix A

| Segment ID | Segment | Congested (D1) | Crowded (D2) | Smooth (D3) |
|---|---|---|---|---|
| 1-1 | Science Museum to Huaqiang Road | 0 | 2 | 13 |
| 1-2 | Convention and Exhibition Center to Shopping Park | 0 | 5 | 10 |
| 1-3 | Shopping Park to Xiangmihu | 0 | 5 | 10 |
| 1-4 | Xiangmihu to Chegongmiao | 0 | 2 | 13 |
| 1-5 | Shenzhen University to Taoyuan | 1 | 3 | 11 |
| 1-6 | Taoyuan to Daxin | 1 | 3 | 11 |
| 1-7 | Liyumen to Qianhaiwan | 0 | 2 | 13 |
| 2-1 | Grand Theater to Hubei | 0 | 3 | 12 |
| 2-2 | Hubei to Huangbeiling | 0 | 2 | 13 |
| 3-1 | Tangkeng to Liuyue | 0 | 2 | 13 |
| 3-2 | Liuyue to Danzhutou | 0 | 2 | 13 |
| 3-3 | Danzhutou to Dafen | 0 | 12 | 3 |
| 3-4 | Dafen to Mumianwan | 5 | 8 | 2 |
| 3-5 | Mumianwan to Buji | 11 | 3 | 1 |
| 3-6 | Buji to Caopu | 11 | 3 | 1 |
| 3-7 | Caopu to Shuibei | 13 | 1 | 1 |
| 3-8 | Shuibei to Tianbei | 11 | 4 | 0 |
| 3-9 | Tianbei to Cuizhu | 13 | 2 | 0 |
| 3-10 | Cuizhu to Shaibu | 12 | 3 | 0 |
| 3-11 | Shaibu to Laojie | 13 | 1 | 1 |
| 4-1 | Longhua to Longsheng | 0 | 2 | 13 |
| 4-2 | Longsheng to Shangtang | 1 | 4 | 10 |
| 4-3 | Shangtang to Hongshan | 5 | 2 | 8 |
| 4-4 | Hongshan to Shenzhen North | 3 | 3 | 9 |
| 4-5 | Shenzhen North to Baishilong | 1 | 4 | 10 |
| 4-6 | Baishilong to Minle | 5 | 5 | 5 |
| 4-7 | Minle to Shangmeilin | 7 | 1 | 7 |
| 4-8 | Shangmeilin to Lianhua North | 9 | 1 | 5 |
| 4-9 | Lianhua North to Children’s Palace | 8 | 2 | 5 |
| 4-10 | Children’s Palace to Civic Center | 0 | 10 | 5 |
| 4-11 | Civic Center to Convention and Exhibition Center | 0 | 9 | 6 |
| 7-1 | Xili to Chaguang | 0 | 2 | 13 |
| 7-2 | Chaguang to Zhuguang | 0 | 3 | 12 |
| 7-3 | Zhuguang to Longjing | 0 | 3 | 12 |
| 7-4 | Longjing to Taoyuancun | 0 | 4 | 11 |
| 7-5 | Taoyuancun to Shenyun | 0 | 10 | 5 |
| 7-6 | Shenyun to Antuo Hill | 0 | 10 | 5 |
| 9-1 | Jingtian to Meijing | 0 | 3 | 12 |
| 11-1 | Hongshuwan South to Houhai | 0 | 3 | 12 |
| 11-2 | Houhai to Nanshan | 1 | 11 | 3 |
| 11-3 | Nanshan to Qianhaiwan | 1 | 10 | 4 |
| 11-4 | Qianhaiwan to Bao’an | 1 | 11 | 3 |
| 11-5 | Bao’an to Bihaiwan | 1 | 6 | 8 |
| 11-6 | Bihaiwan to Airport | 0 | 4 | 11 |
| 11-7 | Airport to Airport North | 0 | 3 | 12 |
| 11-8 | Airport North to Fuyong | 0 | 3 | 12 |
References
- Kong, X.J.; Xu, Z.Z.; Shen, G.J.; Wang, J.Z.; Yang, Q.Y.; Zhang, B.S. Urban traffic congestion estimation and prediction based on floating car trajectory data. Future Gener. Compt. Syst. 2016, 61, 97–107. [Google Scholar] [CrossRef]
- Ito, T.; Kaneyasu, R. Predicting traffic congestion using driver behavior. Procedia Comput. Sci. 2017, 112, 1288–1297. [Google Scholar] [CrossRef]
- Goudarzi, S.; Kama, M.N.; Anisi, M.H.; Soleymani, S.A.; Doctor, F. Self-Organizing Traffic Flow Prediction with an Optimized Deep Belief Network for Internet of Vehicles. Sensors 2018, 18, 3459. [Google Scholar] [CrossRef] [PubMed] [Green Version]
- Zhang, X.; Onieva, E.; Perallos, A.; Osaba, E.; Lee, V.C.S. Hierarchical fuzzy rule-based system optimized with genetic algorithms for short term traffic congestion prediction. Transp. Res. C Emerg. Technol. 2014, 43, 127–142. [Google Scholar] [CrossRef]
- Yang, Y.J.; Xu, Y.B.; Han, J.Y.; Wang, E.; Chen, W.T.; Yue, L. Efficient traffic congestion estimation using multiple spatio-temporal properties. Neurocomputing 2017, 267, 344–353. [Google Scholar] [CrossRef] [Green Version]
- Nan, Q.M.; Li, S.; Yao, Y.Q.; Li, Z.Y.; Wang, H.H.; Wang, L.X.; Sun, L.Z. A Novel Monitoring Approach for Train Tracking and Incursion Detection in Underground Structures Based on Ultra-Weak FBG Sensing Array. Sensors 2019, 19, 2666. [Google Scholar] [CrossRef] [Green Version]
- Zhang, L.M.; Liu, M.J.; Wu, X.G.; AbouRizk, S.M. Simulation-based route planning for pedestrian evacuation in metro stations: A case study. Autom. Constrol. 2016, 71, 430–442. [Google Scholar] [CrossRef]
- Prud’homme, R.; Koning, M.; Lenormand, L.; Fehr, A. Public transport congestion costs: The case of the Paris subway. Transp. Policy 2012, 21, 101–109. [Google Scholar] [CrossRef]
- Lee, H.S.; Mun, H.L.; Lee, S.K. Evacuation time at Jong-no 3ga subway station considering electric train delays and congestion. J. Transp. Secur. 2018, 11, 137–150. [Google Scholar] [CrossRef]
- Smith, B.L.; Demetsky, M.J. In Short-term traffic flow prediction models-a comparison of neural network and nonparametric regression approaches. In Proceedings of the IEEE International Conference on Systems, Man and Cybernetics, San Antonio, TX, USA, 2–5 October 1994; pp. 1706–1709. [Google Scholar]
- Smith, B.L.; Demetsky, M.J. Traffic flow forecasting: Comparison of modeling approaches. J. Transp. Eng. ASCE 1997, 123, 261–266. [Google Scholar] [CrossRef]
- Voort, M.V.D.; Dougherty, M.; Watson, S. Combining kohonen maps with arima time series models to forecast traffic flow. Transp. Res. C Emerg. 1996, 4, 307–318. [Google Scholar] [CrossRef] [Green Version]
- Williams, B.M.; Hoel, L.A. Modeling and forecasting vehicular traffic flow as a seasonal ARIMA process: Theoretical basis and empirical results. J. Transp. Eng. ASCE 2003, 129, 664–672. [Google Scholar] [CrossRef] [Green Version]
- Kumar, S.V. Traffic Flow Prediction using Kalman Filtering Technique. Procedia Eng. 2017, 187, 582–587. [Google Scholar] [CrossRef]
- Li, L.C.; Zhang, J.; Wang, Y.G.; Ran, B. Missing Value Imputation for Traffic-Related Time Series Data Based on a Multi-View Learning Method. IEEE Trans. Intell. Transp. 2019, 20, 2933–2943. [Google Scholar] [CrossRef]
- Jiao, P.P.; Li, R.M.; Sun, T.; Hou, Z.H.; Ibrahim, A. Three Revised Kalman Filtering Models for Short-Term Rail Transit Passenger Flow Prediction. Math. Probl. Eng. 2016, 2016, 10. [Google Scholar] [CrossRef] [Green Version]
- Okutani, I.; Stephanedes, Y.J. Dynamic Prediction of Traffic Volume through Kalman Filtering Theory. Transp. Res. B Meth. 1984, 18, 1–11. [Google Scholar] [CrossRef]
- Charitopoulos, V.M.; Papageorgiou, L.G.; Dua, V. Nonlinear Model-Based Process Operation under Uncertainty Using Exact Parametric Programming. Engineering 2017, 3, 202–213. [Google Scholar] [CrossRef]
- Clark, S. Traffic prediction using multivariate nonparametric regression. J. Transp. Eng. 2003, 129, 161–168. [Google Scholar] [CrossRef]
- Wang, C.; Ye, Z.R. Traffic flow forecasting based on a hybrid model. J. Intell. Transp. Syst. 2016, 20, 428–437. [Google Scholar] [CrossRef]
- Jiang, X.M.; Adeli, H. Dynamic wavelet neural network model for traffic flow forecasting. J. Transp. Eng. ASCE 2005, 131, 771–779. [Google Scholar] [CrossRef]
- Wei, Y.; Chen, M.C. Forecasting the short-term metro passenger flow with empirical mode decomposition and neural networks. Transp. Res. C Emerg. 2012, 21, 148–162. [Google Scholar] [CrossRef]
- Liu, Y.; Feng, X.S.; Wang, Q.; Zhang, H.M.Z.; Wang, X.Y. Prediction of Urban Road Congestion Using a Bayesian Network Approach. Procedia Soc. Behav. Sci. 2014, 138, 671–678. [Google Scholar] [CrossRef] [Green Version]
- Feng, X.S.; Saito, M.; Liu, Y. Improve urban passenger transport management by rationally forecasting traffic congestion probability. Int. J. Prod. Res. 2016, 54, 3465–3474. [Google Scholar] [CrossRef]
- Castro-Neto, M.; Jeong, Y.S.; Jeong, M.K.; Han, L.D. Online-SVR for short-term traffic flow prediction under typical and atypical traffic conditions. Expert Syst. Appl. 2009, 36, 6164–6173. [Google Scholar] [CrossRef]
- Rong, Y.U.; Wang, G.; Zheng, J.; Wang, H. Urban Road Traffic Condition Pattern Recognition Based on Support Vector Machine. J. Transp. Syst. Eng. Inf. Technol. 2013, 13, 130–136. [Google Scholar]
- Oswald, R.K.; Scherer, W.T.; Smith, B.L. Traffic Flow Forecasting Using Approximate Nearest Neighbor Nonparametric Regression; Institute of Transportation Library: Berkeley, CA, USA, 2000. [Google Scholar]
- Salman, S.; Alaswad, S. Alleviating road network congestion: Traffic pattern optimization using Markov chain traffic assignment. Comput. Oper. Res. 2018, 99, 191–205. [Google Scholar] [CrossRef]
- Szeto, W.Y.; Wong, S.C. Dynamic traffic assignment: Model classifications and recent advances in travel choice principles. Cent. Eur. J. Eng. 2012, 2, 1–18. [Google Scholar] [CrossRef] [Green Version]
- Lu, H.; Zhang, N.; Huang, W. Research Progress of Short Term Traffic Flow Prediction Methods. J. Transp. Eng. Inf. 2009, 7, 84–91. [Google Scholar]
- Jung, S.; Yang, H.; Park, K.; Seo, Y.; Seong, W. Monitoring Severe Slugging in Pipeline-Riser System Using Accelerometers for Application in Early Recognition. Sensors 2019, 19, 3930. [Google Scholar] [CrossRef] [Green Version]
- Sun, Y.X.; Leng, B.; Guan, W. A novel wavelet-SVM short-time passenger flow prediction in Beijing subway system. Neurocomputing 2015, 166, 109–121. [Google Scholar] [CrossRef]
- Yu, X.H.; Xiong, S.W.; He, Y.; Wong, W.E.; Zhao, Y. Research on campus traffic congestion detection using BP neural network and Markov model. J. Inf. Secur. Appl. 2016, 31, 54–60. [Google Scholar] [CrossRef]
- Cetin, N.; Burri, A.; Kai, N. A Large-Scale Agent-Based Traffic Microsimulation Based on Queue Model. In Proceedings of the Swiss Transport Research Conference, Ascona, Switzerland, 19–21 March 2003; Volume 3, pp. 42–72. [Google Scholar]
- Manley, E.; Cheng, T.; Penn, A.; Emmonds, A. A framework for simulating large-scale complex urban traffic dynamics through hybrid agent-based modelling. Comput. Environ. Urban 2014, 44, 27–36. [Google Scholar] [CrossRef]
- Li, W.; Zhu, W. A dynamic simulation model of passenger flow distribution on schedule-based rail transit networks with train delays. J. Traffic. Transp. Eng. 2016, 3, 364–373. [Google Scholar] [CrossRef] [Green Version]
- Qi, Z.; Baorning, H.; Dewei, L. Modeling and simulation of passenger alighting and boarding movement in Beijing metro stations. Transp. Res. C Emerg. 2008, 16, 635–649. [Google Scholar]
- Yu, Y.; El Kamel, A.; Gong, G.H.; Li, F.X. Multi-agent based modeling and simulation of microscopic traffic in virtual reality system. Simul. Model. Pract. Theory 2014, 45, 62–79. [Google Scholar] [CrossRef]
- Vasic, J.; Ruskin, H.J. Agent-based space-time discrete simulation of urban traffic including bicycles. Procedia Comput. Sci. 2012, 10, 860–865. [Google Scholar] [CrossRef] [Green Version]
- Melnikov, V.R.; Krzhizhanovskaya, V.V.; Lees, M.H.; Boukhanovsky, A.V. Data-driven Travel Demand Modelling and Agent-based Traffic Simulation in Amsterdam Urban Area. Procedia Comput. Sci. 2016, 80, 2030–2041. [Google Scholar] [CrossRef] [Green Version]
- Chen, X.; Li, H.Y.; Miao, J.R.; Jiang, S.X.; Jiang, X. A multiagent-based model for pedestrian simulation in subway stations. Simul. Model. Pract. Theory 2017, 71, 134–148. [Google Scholar] [CrossRef]
- D’Andre, E.; Marcelloni, F. Detection of traffic congestion and incidents from GPS trace analysis. Expert Syst. Appl. 2017, 73, 43–56. [Google Scholar] [CrossRef]
- Xu, L.; Yue, Y.; Li, Q.Q. Identifying Urban Traffic Congestion Pattern from Historical Floating Car Data. Procedia Soc. Behav. Sci. 2013, 96, 2084–2095. [Google Scholar] [CrossRef] [Green Version]
- Zhang, Y.L.; Li, C.L.; Wang, X.M.; Guo, H.; Feng, Y.L.; Chen, J.M. Rush-hour aromatic and chlorinated hydrocarbons in selected subway stations of Shanghai, China. J. Environ. Sci. 2012, 24, 131–141. [Google Scholar] [CrossRef]
- Shenzhen Comprehensive Transportation Evaluation Report. Available online: http://jtys.sz.gov.cn/zwgk/xxgkml/tjxx/index.htm (accessed on 25 December 2018).
- Jiang, C.S.; Deng, Y.F.; Hu, C.; Ding, H.; Chow, W.K. Crowding in platform staircases of a subway station in China during rush hours. Saf. Sci. 2009, 47, 931–938. [Google Scholar] [CrossRef]
- Ma, X.L.; Liu, C.C.; Wen, H.M.; Wang, Y.P.; Wu, Y.J. Understanding commuting patterns using transit smart card data. J. Transp. Geogr. 2017, 58, 135–145. [Google Scholar] [CrossRef]
- Huang, A.; Levinson, D. A model of two-destination choice in trip chains with GPS data. J. Choice Model. 2017, 24, 51–62. [Google Scholar] [CrossRef] [Green Version]
- Ferber, J. Multi-Agent System: An Introduction to Distributed Artificial Intelligence; Addison-Wesley Longman Publishing Co. Inc.: Boston, MA, USA, 1999. [Google Scholar]
- Crooks, A.; Castle, C.; Batty, M. Key challenges in agent-based modelling for geo-spatial simulation. Comput. Environ. Urban 2008, 32, 417–430. [Google Scholar] [CrossRef] [Green Version]
- Shenzhen Government Online. Available online: http://english.sz.gov.cn/aboutsz/profile/201907/t20190704_18035388.htm (accessed on 12 July 2019).
- Standard Map Service Center of the Ministry of Natural Resources of China. Available online: http://bzdt.ch.mnr.gov.cn/index.html (accessed on 10 November 2018).
- Arcgis 10.2. ArcMap: How Buffer (Analysis) Works. Available online: https://desktop.arcgis.com/en/arcmap/latest/tools/analysis-toolbox/how-buffer-analysis-works.htm (accessed on 12 April 2019).


| 2013 | 2014 | 2015 | 2016 | 2017 | |
|---|---|---|---|---|---|
| Bus | 2201.78 (−3.56%) | 2257.39 (2.53%) | 2068.92 (−8.35%) | 1867.99 (−9.71%) | 1654.25 (−11.44%) |
| Taxi | 432.30 (+5.99%) | 438.42 (1.42%) | 391.13 (−10.79%) | 373.62 (−4.48%) | 370.8 (−0.76%) |
| Subway | 917.15 (+17.39%) | 1036.75 (+13.04%) | 1121.88 (+8.21%) | 1297.13 (+15.62%) | 1655.45 (+27.62%) |
| Subway Route | Originating Station | Terminal Station | Stations | Length (km) |
|---|---|---|---|---|
| Line 1 | Luohu | Airport East | 30 | 41.0 |
| Line 2 | Chiwan | Xinxiu | 29 | 35.7 |
| Line 3 | Suanglong | Yitian | 30 | 41.7 |
| Line 4 | Futian Checkpoint | Qinghu | 15 | 20.5 |
| Line 5 | Qianhaiwan | Huangbeiling | 27 | 40.0 |
| Line 7 | Xili Lake | Tai’an | 28 | 30.1 |
| Line 9 | Hongshuwan South | Wenjin | 22 | 25.4 |
| Line 11 | Futian | Bitou | 18 | 51.9 |
| Subway Line | Peak Interval (7:30–9:00) | Common Interval | Marshalling | ||
|---|---|---|---|---|---|
| Line 1 | 2 min | 4 min | 60 | 6A | 2502 |
| Line 2 | 3.5 min | 5 min | 38 | 6A | 2502 |
| Line 3 | 3 min | 5 min | 42 | 6B | 1800 |
| Line 4 | 2.5 min | 5 min | 48 | 6A | 2502 |
| Line 5 | 3.5 min | 5 min | 38 | 6A | 2502 |
| Line 7 | 5 min | 8 min | 26 | 6A | 2502 |
| Line 9 | 5 min | 8 min | 26 | 6A | 2502 |
| Line 11 | 5 min | 8.5 min | 26 | 8A | 2564 |
| Subway Route | Reference Segments | Predicted Segments | Number of Matches | Matching Ratio | ||||
|---|---|---|---|---|---|---|---|---|
| Congested | Crowded | Smooth | Congested | Crowded | Smooth | |||
| Line 1 | 0 | 0 | 29 | 0 | 0 | 29 | 29/29 | 1.000 |
| Line 2 | 0 | 0 | 28 | 0 | 1 | 27 | 27/28 | 0.964 |
| Line 3 | 9 | 0 | 20 | 7 | 8 | 14 | 21/29 | 0.724 |
| Line 4 | 0 | 5 | 9 | 0 | 0 | 14 | 9/14 | 0.642 |
| Line 5 | 0 | 0 | 26 | 0 | 1 | 25 | 25/26 | 0.962 |
| Line 7 | 0 | 5 | 22 | 3 | 18 | 6 | 9/27 | 0.333 |
| Line 9 | 0 | 1 | 20 | 1 | 6 | 14 | 15/21 | 0.714 |
| Line 11 | 0 | 8 | 9 | 0 | 6 | 11 | 14/17 | 0.824 |
| Total | 9 | 19 | 163 | 11 | 40 | 140 | 149/191 | 0.780 |
© 2019 by the authors. Licensee MDPI, Basel, Switzerland. This article is an open access article distributed under the terms and conditions of the Creative Commons Attribution (CC BY) license (http://creativecommons.org/licenses/by/4.0/).
Share and Cite
Luo, Z.; Zhang, Y.; Li, L.; He, B.; Li, C.; Zhu, H.; Wang, W.; Ying, S.; Xi, Y. A Hybrid Method for Predicting Traffic Congestion during Peak Hours in the Subway System of Shenzhen. Sensors 2020, 20, 150. https://doi.org/10.3390/s20010150
Luo Z, Zhang Y, Li L, He B, Li C, Zhu H, Wang W, Ying S, Xi Y. A Hybrid Method for Predicting Traffic Congestion during Peak Hours in the Subway System of Shenzhen. Sensors. 2020; 20(1):150. https://doi.org/10.3390/s20010150
Chicago/Turabian StyleLuo, Zhenwei, Yu Zhang, Lin Li, Biao He, Chengming Li, Haihong Zhu, Wei Wang, Shen Ying, and Yuliang Xi. 2020. "A Hybrid Method for Predicting Traffic Congestion during Peak Hours in the Subway System of Shenzhen" Sensors 20, no. 1: 150. https://doi.org/10.3390/s20010150