1. Introduction
Agricultural activities presently use 70% of the withdrawn freshwater in the world [
1]. Therefore, it is of fundamental importance that we apply irrigation management, especially in semiarid regions with a scarcity of rainfall. Irrigation management is a part of precision agriculture, in which the correct amount of water artificially delivered to a field to satisfy the crop needs and the real production of the users is analyzed [
2].
The irrigation must supply the crop water needs at different developmental stages in a given local. Irrigation management is used to detect when to irrigate, the amount of water needed, and the irrigation frequency, based on the monitoring of crop evapotranspiration and soil moisture conditions. Crop evapotranspiration measures the water consumption by crops, according to the developmental stage of the crop and the weather conditions [
3]. The soil moisture impacts the amount of irrigation water given to the crop, as irrigation management takes into account the level of water retention in the soil. Therefore, precision agriculture can reduce water consumption in irrigation by considering the groundwater available to the crop [
2].
The choice of the best irrigation management plan depends on the data available from the monitoring field. A smart agriculture system gathers and processes data for irrigation management from several sources using computer science and information technology [
4]. Users can provide the features of different types of crop, soil, and irrigation system, as well as the readings of analog tensiometers. Tensiometers are soil sensors that detect the matric potential, which are used to estimate the moisture at different depths and monitoring points in a field. Automatic weather stations [
5] can provide public data through the Internet. Moreover, the field may have sensors and actuators which can interact with each other as objects of the Internet of Things (IoT) in order to provide services transparently to the users [
6]. Such services are related to irrigation management for monitoring (i.e., water, soil, and air) and prediction (weather and soil conditions).
However, data are not free of discrepant values (i.e., outliers), which can negatively affect the precision of irrigation management. Furthermore, data from different sources must fit into the same temporal window required for the irrigation management and the data preprocessing must be dynamic and automatic for researchers, engineers, and owners or farmers to benefit from the irrigation management plan. Data fusion is required to improve the quality of soil data in the case where several sources provide the same type of data (e.g., moisture) from the field [
7]. Data fusion also informs the decision whether to start irrigation or not in irrigation management that makes use of other types of data (such as weather or crop data).
In this paper, we propose the Smart&Green framework to offer services for smart irrigation, such as data monitoring and control, preprocessing, fusion, synchronization, storage, and irrigation management enriched by the prediction of soil moisture. The Smart&Green services are modular components which facilitate the reuse and customization of code, which are challenges/limitations to applying IoT in the smart agriculture context [
8]. Our framework allows users to set the data sources: The nearest weather station, the moisture sensors (analog or digital), the type of crop, and the features of the irrigation system in the monitored field. Therefore, Smart&Green also contributes to the solution of another challenge in applying IoT for the purpose of smart agriculture: The integration of the actual infrastructure of the users (i.e., devices, machines, and software) [
9].
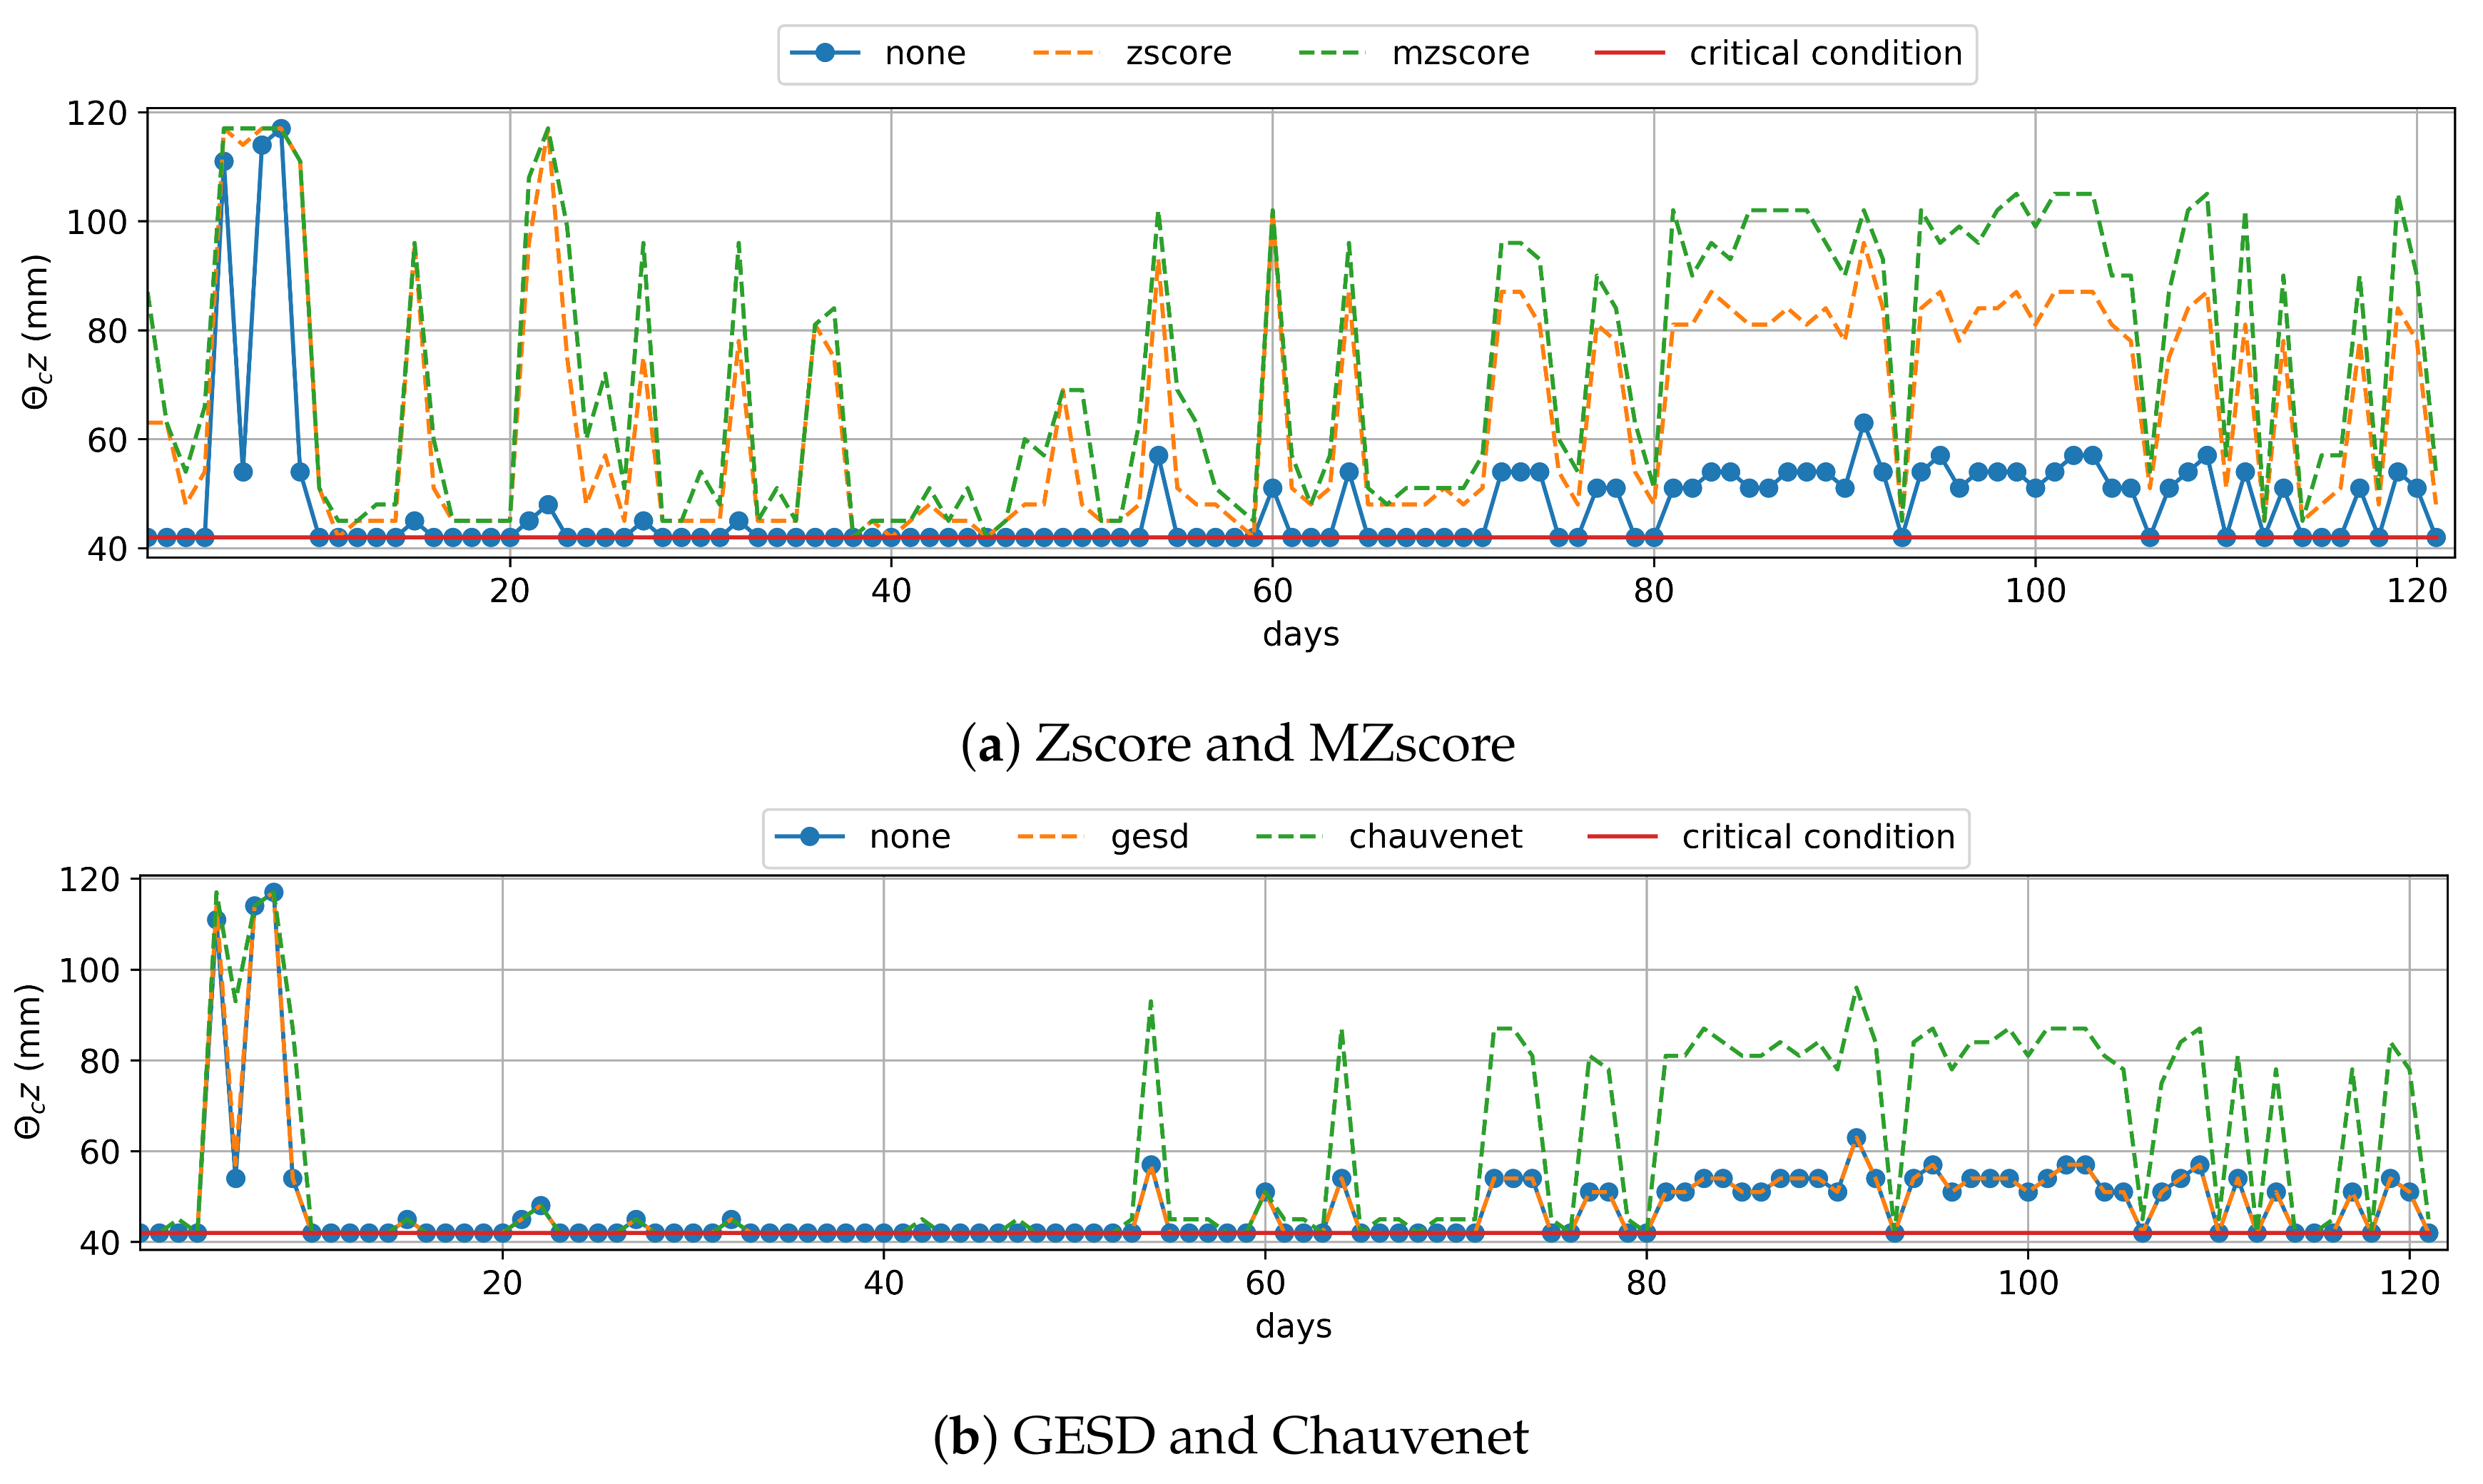
Smart&Green recommends the best irrigation management plan, according to the configuration of the monitored field. The framework also synchronizes weather and soil data, as well as the crop stage for the chosen irrigation management plan. The Fusion service allows for the definition of outlier removal criteria for the weather and soil data. The fusion service also applies the outlier removal techniques Chauvenet, Z-Score, Modified Z-Score, and Generalized ESD before data aggregation, in order to obtain general information about the soil conditions of a field. Our results show that it makes irrigation management more precise, therefore saving water.
For fields without soil moisture sensors, the prediction module estimates the soil moisture to make the amount of water irrigated more precise. In this work, we propose a computational model to predict the matric potential based on weather data available at public stations [
5], crop information, and the amount of irrigation water used. As another contribution, we provide to the scientific community a public data set containing the matric potential and irrigation data for cashew cultivation in an experimental field. The matric potential is the critical variable in measuring the soil moisture.
The computational model reduces the cost of equipment and energy, as the model allows farms to estimate the moisture without soil sensors for the same soil type. We evaluate the performance of a set of popular machine learning techniques which have been widely applied to solve regression problems. We measure the quality of the models without feature selection using the RMSE (Root Mean Squared Error) and the MAE (Mean Absolute Error) as metrics. Our results show that the combination of predicted data and the outlier removal techniques can save an average between 56.4% and 90% of irrigation water, estimated by water balance management.
The rest of the paper is structured as follows: In
Section 2, a literary review of IoT platforms for Smart Agriculture is presented.
Section 3 describes the structure and services of the Smart&Green framework.
Section 4 relates the materials and method of the implementation of Smart&Green, especially for the soil moisture prediction evaluation. The results are given in
Section 5, and we discuss our contributions in
Section 6.
Appendix A gives details about irrigation management using Smart&Green, and we formalize the problem of soil moisture prediction in
Appendix B.
2. Related Work
We carried out a systematic literature review to find the works which have answered the following research questions:
What software exists for agricultural management that automates the process of gathering, preprocessing, fusing, and synchronizing the data used in irrigation management?
Does the software implement the well-known irrigation management approaches of matric potential (Equation (
A2)) and water balance (Equation (
A3))?
Does the software forecast the soil moisture?
Can users configure the software using information about their crops, irrigation system, soil sensors, and weather stations close to the monitored field?
Most of the discovered papers have partially answered the research questions above. To our best knowledge, there have been almost no Internet of Things (IoT) platforms introduced that provide the services required for smart irrigation, such as the gathering, preprocessing, synchronization, and fusion of data; the planning and execution of irrigation management; or soil moisture prediction.
Several studies have only addressed the gathering and visualization of weather and soil data (
Section 2.1). Some works focused on data preprocessing by applying outlier detection algorithms (
Section 2.2). Some approaches used specific methods to decide when to irrigate, whereas others have implemented water balance and matric potential (
Section 2.3). Soil moisture prediction using machine learning techniques applied to crop data, satellite images, and irrigation management information has been investigated (
Section 2.4). In addition, IoT platforms have been studied, which should be flexible enough to allow users to configure them for different monitoring cases in smart agriculture (
Section 2.5).
2.1. Data Gathering
In general, most of the sensor nodes used to monitor soil data (such as temperature, humidity, and matric potential) and weather data (such as temperature and relative humidity) are operated using open, low-cost hardware platforms such as the Arduino [
10,
11,
12,
13,
14] or Raspberry Pi [
15,
16,
17]. Zigbee [
11,
17,
18,
19], LoRa [
16], Wifi [
20], Bluetooth [
14], GSM [
12], and GPRS [
21] are the predominant wireless technologies used.
Our proposal allows users choose between the CoAP [
22] and MQTT [
23] protocols for sending data to Smart&Green framework storage and later irrigation management. For devices that we can not turn into a sensor node, such as analog tensiometers, our framework has a mobile application with which users can gather data manually. The framework also allows users to choose, as a weather data source, the Brazilian automatic weather station nearest to the monitored field, from which data can be gathered via HTTP.
2.2. Data Preprocessing
Other approaches have processed soil data to detect outliers [
24,
25] and treat data using noise filtering techniques [
26]. One system applied an EKF (Extended Kalman Filter) to the soil moisture data before the execution of irrigation management, in order to avoid the actuators inappropriately starting the irrigation [
27].
The pattern recognition of water consumption by a crop radicular system, presented in [
28], is an outlier detection technique based on a time-series analysis of soil moisture gathered at several depths before, during, and after irrigation. This technique allows for the identification of sensors with poor operation, which indicates the need for calibration or change.
Our proposed framework allows users to define criteria for outlier removal for each type of weather and soil data used in irrigation management. Our framework also gives the option to execute such algorithms as Chauvenet, Z-Score, Modified Z-Score, and Generalized ESD (Extreme Studentized Deviation) to remove outliers and fuse soil moisture data, in the case when a field has several soil sensors monitoring at different depths.
2.3. Irrigation Management
Other works have automatically started irrigation by implementing algorithms for analyzing the data gathered by a wireless sensor node. In one study, an algorithm based on decision trees used the soil temperature and moisture to determine the irrigation time and the needed amount of water [
29]. Crisp rules (IF-THEN) were used to compare threshold values with the soil moisture gathered by sensors, in order to decide whether to turn on the sprinklers of an irrigation system, in [
30,
31].
Decision support platforms for the execution of traditional irrigation management, such as the matric potential (Equation (
A2)) and water balance (Equation (
A3)), have been introduced. These systems allow agronomists and farm owners to manage Internet of Things (IoT) components for field monitoring. The matric potential management uses soil data gathered by sensor nodes and images captured by unmanned aerial vehicles to correctly estimate the irrigation water need [
32].
Web systems have been used for the planning and execution of irrigation management. Beyond the visualization of soil moisture and weather data gathered by wireless sensor nodes, these systems use crisp rules for data analysis and, when it is necessary, the systems send messages to their users in order to notify about irrigation times [
33] or activate the irrigation system automatically [
34,
35]. In other approaches, the system takes the rainfall forecast (available on the Internet) into account when deciding whether to activate the irrigation system [
36]. A wireless sensor network can also plan and execute irrigation management [
37]. In this case, the sensor nodes gather and analyze soil moisture data and turn the irrigation system on until the moisture achieves the field capacity.
A SCADA (Supervisory Control and Data Acquisition) system can automatically carry out the data gathering, planning, and execution of the water balance management (see Equations (
A3) and (
A4)). The soil sensor nodes are also actuators, which control the irrigation and send data continually to a management system. The system receives data from a weather station on the farm to estimate the reference evapotranspiration
. The system also utilizes the curve of the crop coefficient
, choosing its value according to the current developmental stage of the crop [
38].
The water balance and matric potential approaches often must take data synchronization into account. Therefore, some applications have synchronized the data of previously registered crops, as well as soil and weather data, to precisely determine the irrigation water need for the current developmental stage of the crop [
39,
40,
41,
42].
The existing systems described in this section are not flexible enough to allow users to set the features of a monitored field, such as the type of crop, the type and number of soil sensors, and irrigation system parameters used. The systems usually work with a predefined configuration and infrastructure. Therefore, code reuse is impracticable for the irrigation management of agricultural fields which do not fit to the existing system configuration. Our proposal allows users to register relevant information for irrigation management: Different types of crops, soil features, irrigation systems, data sources (weather or soil), and outlier removal criteria. In this work, the framework plans the irrigation management using the matric potential (Equation (
A2)) and water balance (Equation (
A3)) approaches.
Furthermore, none of the systems could forecast the moisture levels in fields without soil sensors. Our proposal implements computational models to predict soil moisture based on weather data, crop information, and irrigation water need (IWN) (see
Appendix B). In this work, we include the predicted data in the water balance management, obtaining between 56.4% and 90% of IWN savings over six months (
Section 5.3).
2.4. Soil Moisture Prediction
In [
43], the Linear Regression, Decision Tree, Random Forest, and Gradient Boosting with Regression Tree (GBRT) machine learning (ML) techniques were applied to weather and soil sensor data (moisture and drought stress) to predict the best irrigation plan for a jojoba crop. The GBRT model outperformed the others and, so, the decision support service incorporated it as a module of the system. A model based on support vector regression (SVR) and k-means ML techniques which used weather data and forecasts, as well the soil data (temperature and moisture), to forecast the soil moisture has also been investigated [
44].
In [
45], an integrated system to monitor drought in northern China using satellite images (NOAA, MODIS, and FY3A), weather stations, and soil data has been discussed. The drought forecasting used the matric potential at the depth of the crop root, the water balance model, depletion indices, and measurements of crop stress to estimate the soil moisture and the water quantity needed for an extended period.
In this work, we apply weather data, crop information, and the amount of irrigation water used in a computational model, in order to estimate the daily matric potential of the most superficial soil layer (
Appendix B), which signals when the crop needs irrigation [
2]. We apply the predicted value in the Van Genutchen model (Equation (
A1)) to obtain the soil moisture used in irrigation management (Equations (
A2) and (
A3)) for fields without soil moisture sensors (i.e., Field 1 of
Figure A1).
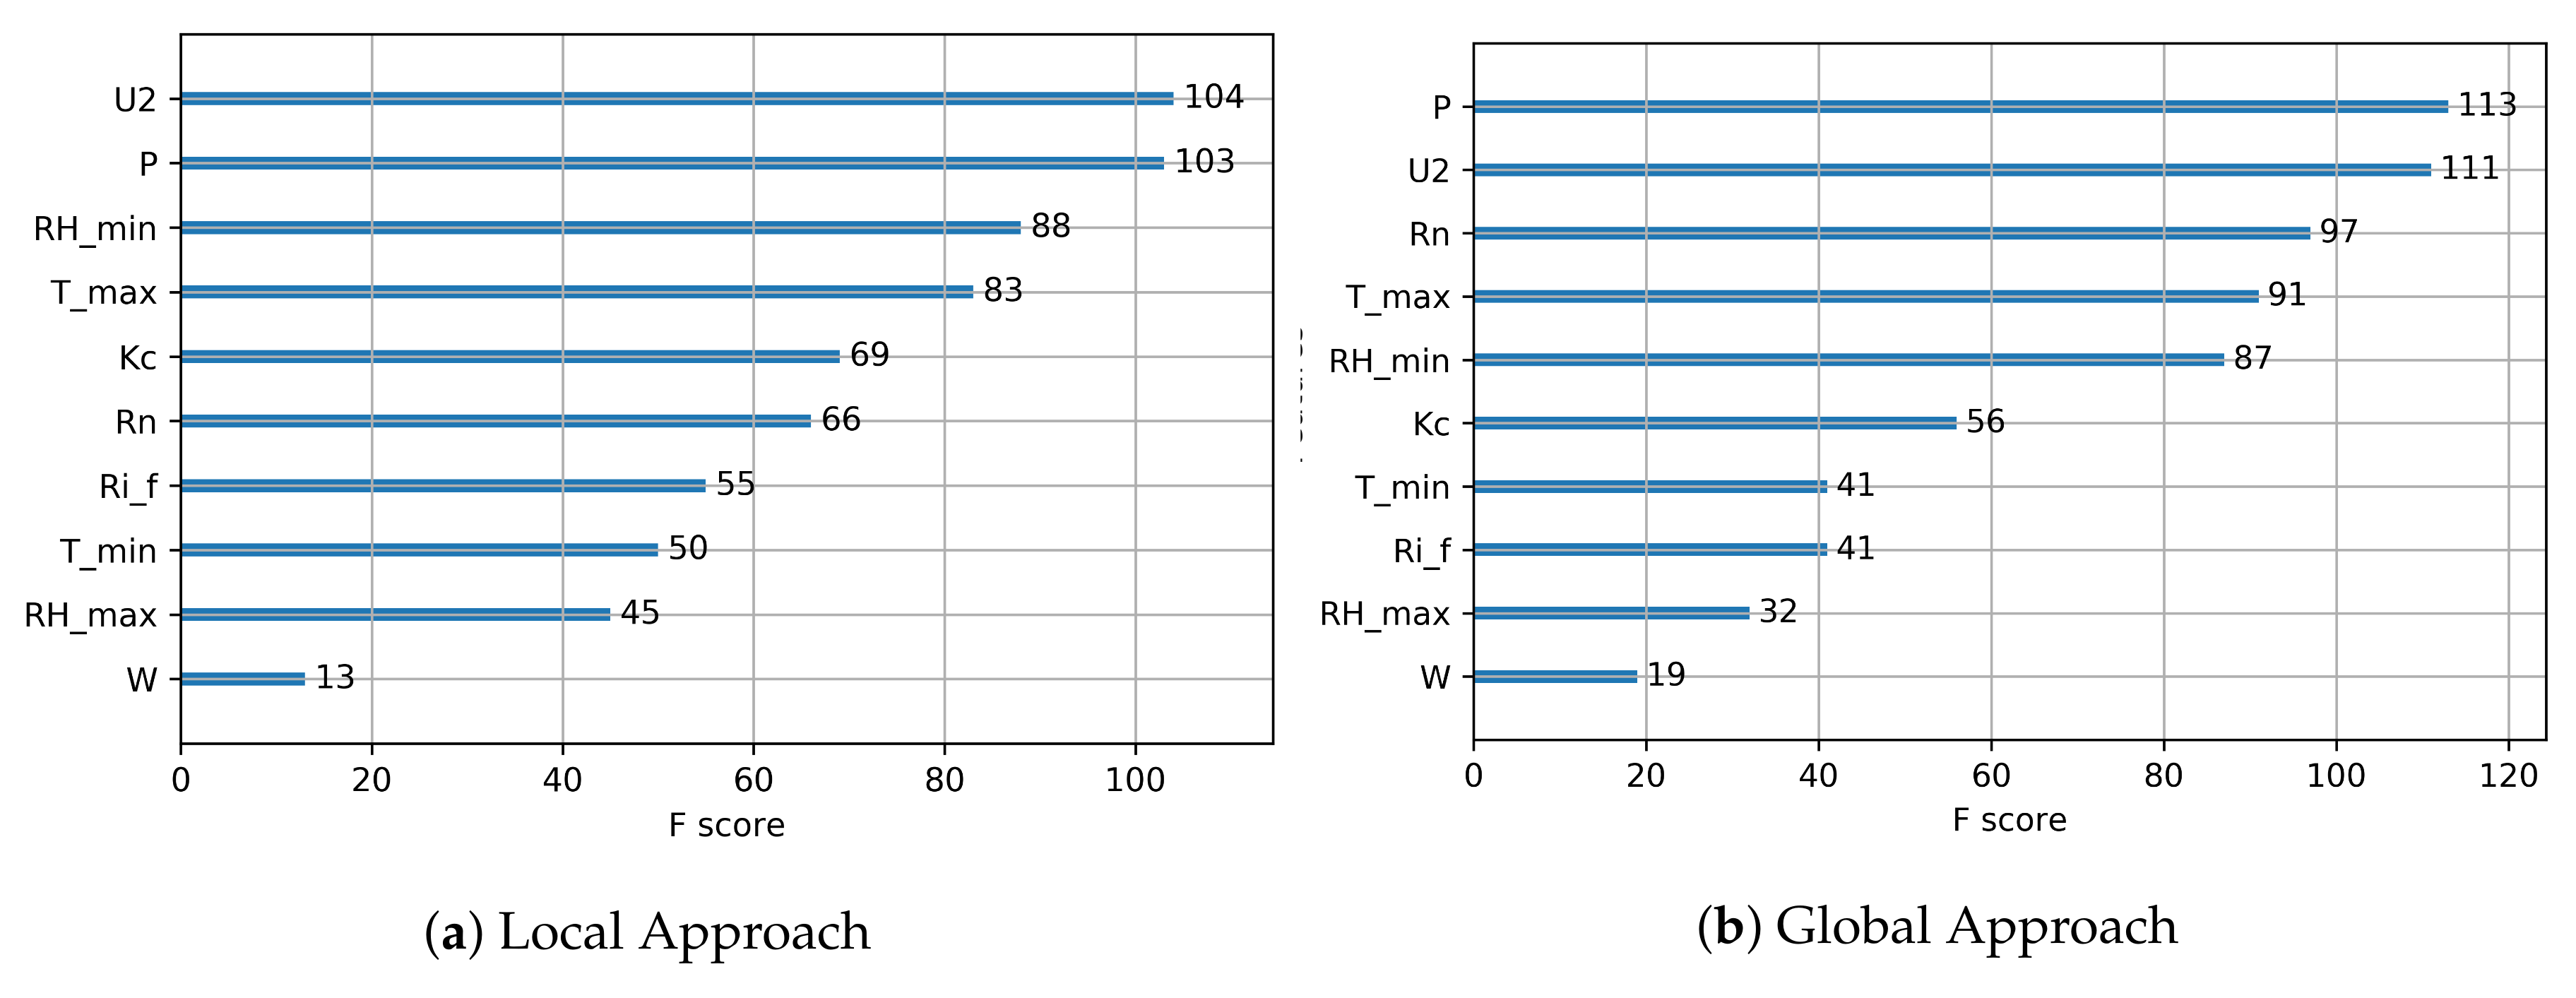
We present two different approaches: Local and global prediction models. In the local method, we create a prediction model for each monitoring point in an experimental field (
Section 4.2). In the global approach, we create a single model which can be generalized to any monitoring point. We have evaluated the performance of a set of popular ML techniques which have been widely applied to solve regression problems: Linear Regression [
46], Decision Stump [
47], M5 Model Trees and Rules [
48,
49], Random Tree, Random Forest [
50], RepTree, and GBRT [
51,
52]. Our results show that GBRT outperforms the other evaluated techniques in both approaches.
2.5. IoT Platforms for Smart Agriculture
SWAMP (Smart Water Management Platform), introduced in [
53], is one of the related methods which is most similar to our proposal. SWAMP has components to allow for the implementation of different IoT applications for irrigation management, based on the crop and soil moisture approaches. Users can customize the services for the gathering (MQTT or LoRa), processing, and synchronization of data with different types of crops, weather, and country. Therefore, different field configurations can reuse these services for data analysis and storage, highlighting the excellent flexibility of SWAMP. However, their techniques for the processing and the fusion of data have not been detailed, and no application or service for the prediction of soil moisture has been provided.
The Agro-IoT framework, introduced in [
54], is also related to our proposal, which provides users real-time data gathering, aggregation (fusion), and analysis in the context of smart farming. Agro-IoT reuses several components to implement IoT applications, according to the needs of the monitored field. Agro-IoT provides similar services to our proposed method; that is, it also provides the management of devices (i.e., registration of sensors and actuators) and event detection through data analysis. However, it does not contain modules for data synchronization and outlier removal or soil moisture prediction.
3. Proposal
In this paper, we propose Smart&Green: An Internet of Things (IoT) framework for the smart agriculture domain. A framework consists of “
a specific implementation of a skeleton of infrastructure used for the conception of a work” [
55]. Work is any activity performed by users or software. In this proposal, the work consists of the planning of irrigation management (
Appendix A). In fields where there are no soil moisture sensors, a computational model can estimate the soil moisture for the same soil type using weather, crop, and irrigation data. Agronomists, researchers, and farmers conduct irrigation management through software which uses Smart&Green.
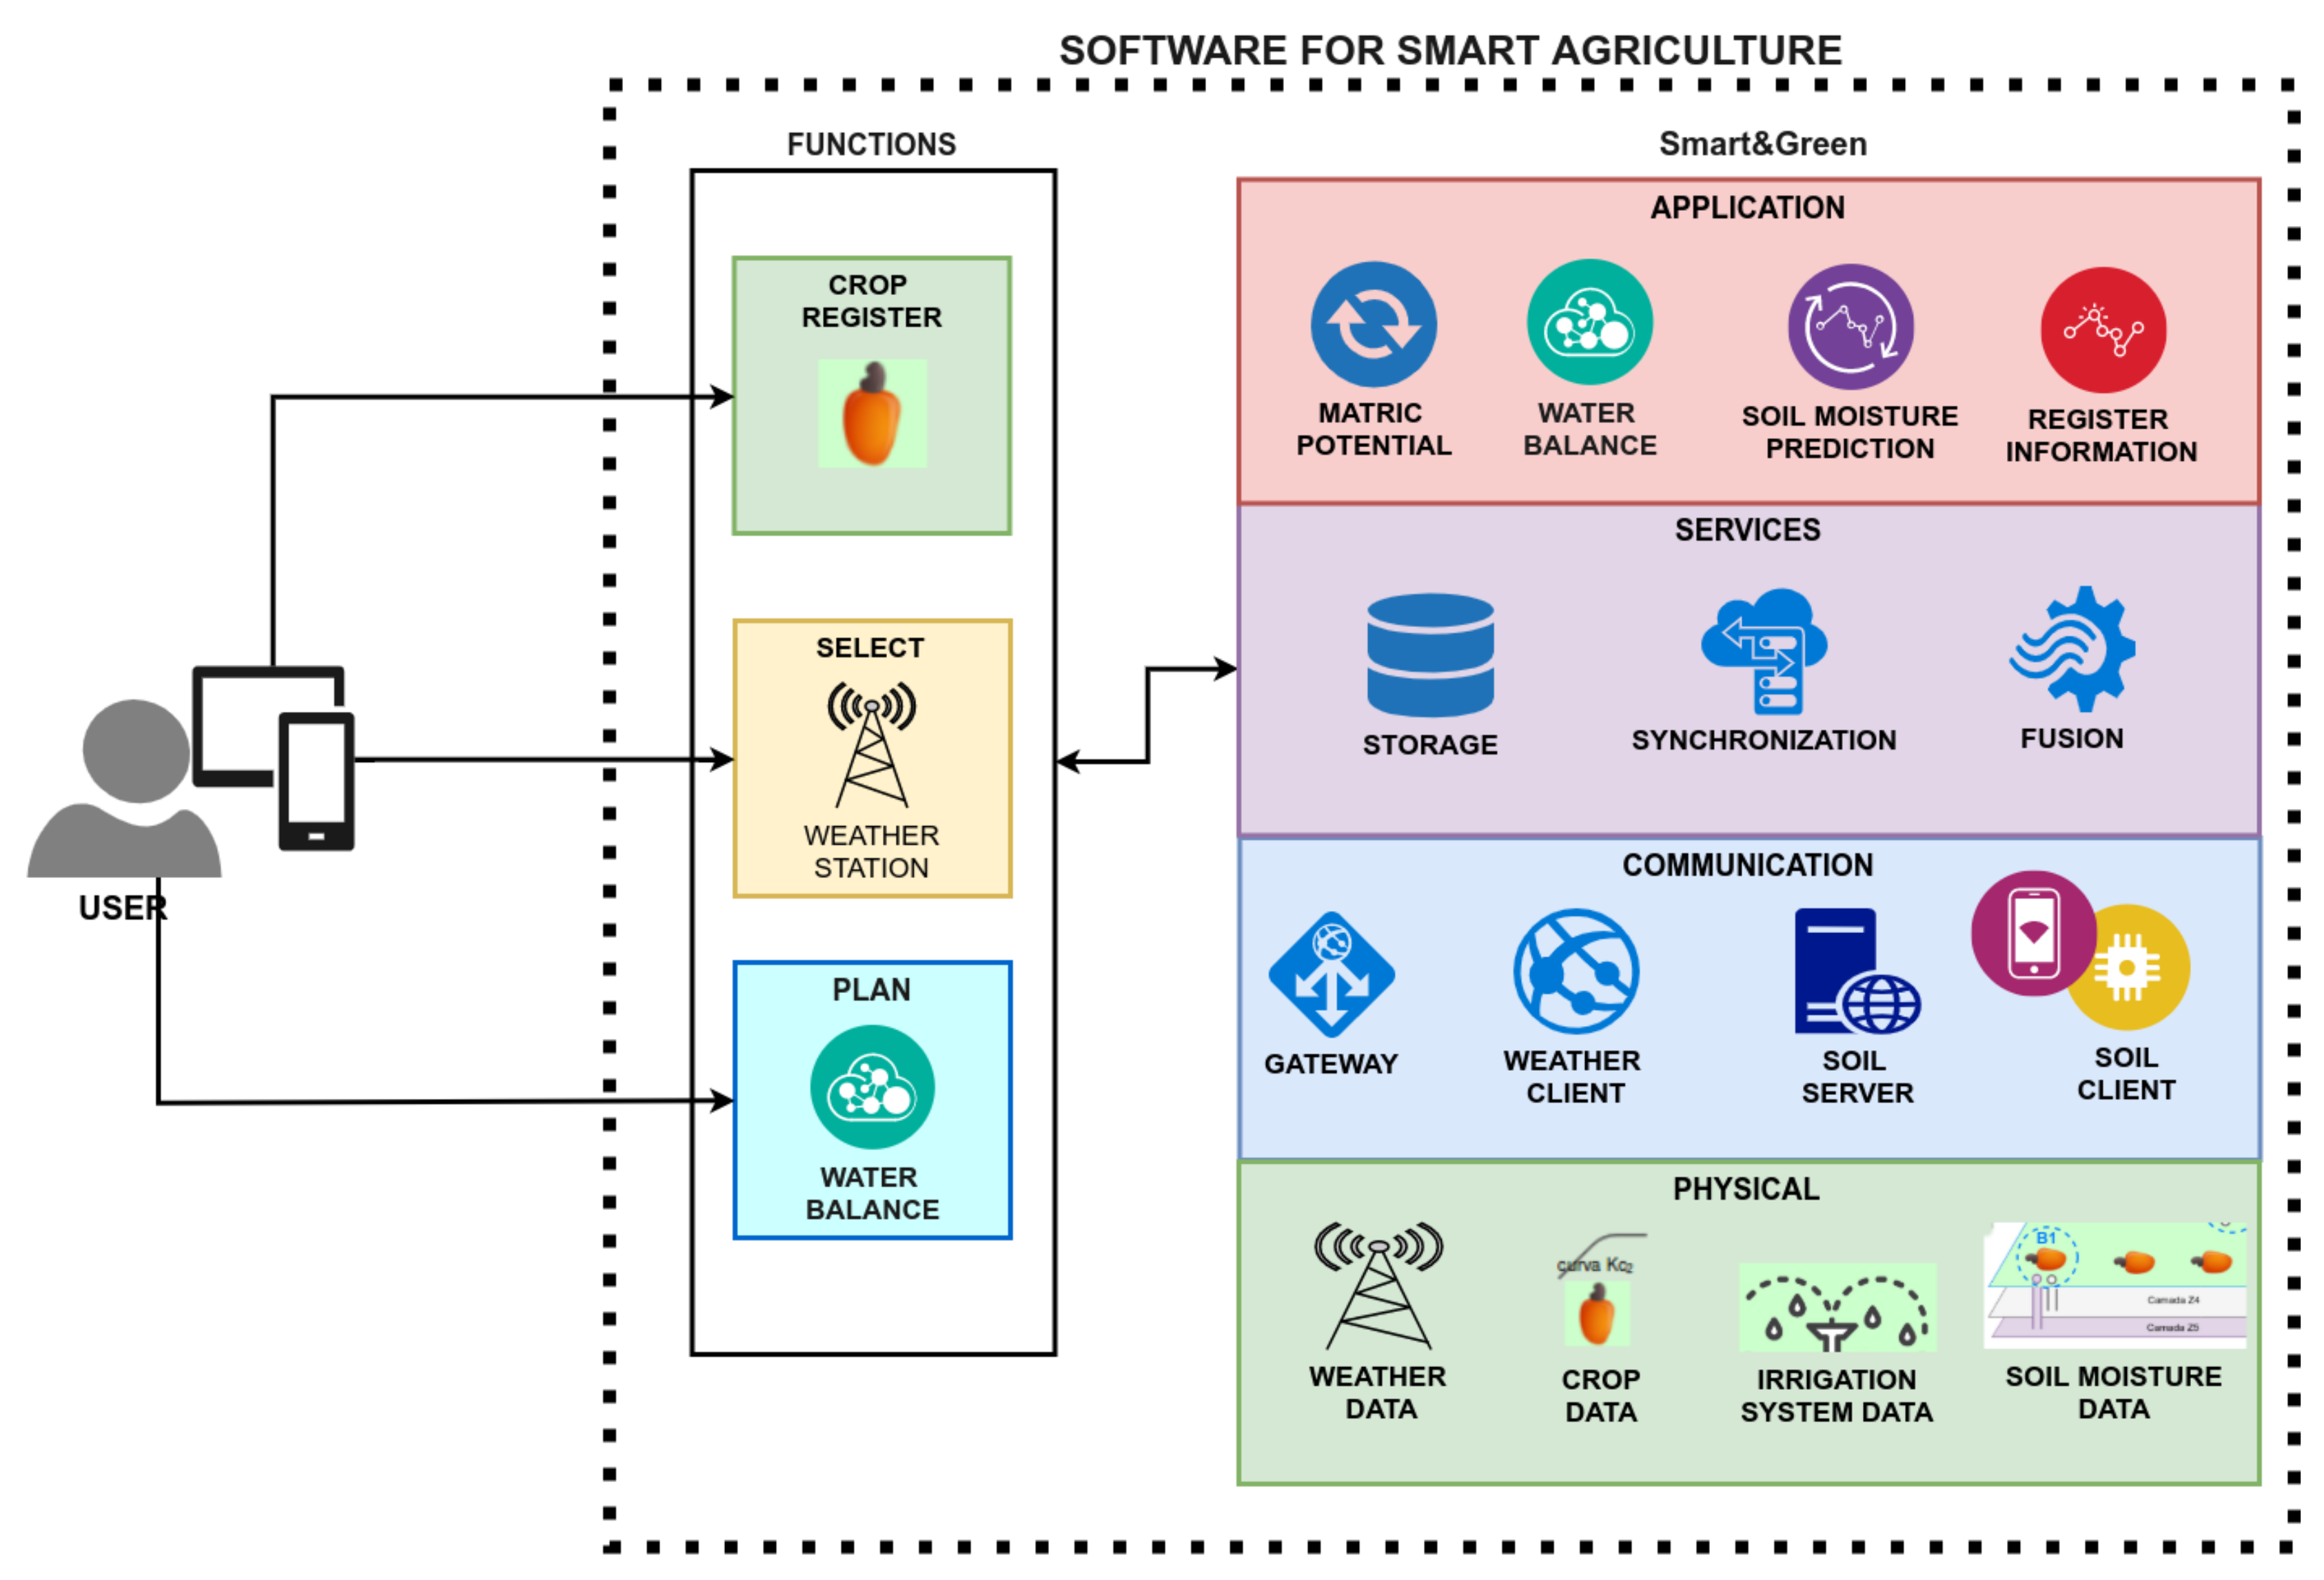
Figure 1 presents the conceptual architecture of Smart&Green, divided into four layers: Application, Services, Communication, and Physical.
In software engineering, a framework can also be “
a mini architecture that can be reused and that provides behavior and a generic structure for a family of software abstractions in a context that specifies the collaboration and use of them into a given domain” [
56]. Therefore, given the smart agriculture domain and the context of smart irrigation, the Smart&Green framework specifies the structure of a set of concrete and abstract classes to implement modules for the gathering, storage, synchronization, and fusion of data, as well as mathematical models (
Appendix A) which describe irrigation management. Irrigation management determines the behaviors of the classes and modules. As a mini architecture, the proposed framework can be reused with different smart agriculture software with the generic functionalities of irrigation management.
3.1. Application Layer
The application layer provides facilities for the automatization of irrigation management (
Appendix A) and soil moisture prediction. Through this layer, users of an agriculture management system can insert information about the farm infrastructure: The types of crops and irrigation system to each monitored field, the monitored soil layers, and the weather stations closest to the farm.
3.1.1. Irrigation Management Automatization
The Matric Potential and Water Balance modules implement well-known irrigation management methods (
Appendix A). These modules use information registered by users as well as that from weather and soil data sources. Smart&Green selects the best irrigation management based on the data available. The principal functions of the Register Module are as follows:
User register: Smart&Green framework allows two types of users: Specialist and regular. Specialist users can provide agronomic information, such as different types of crops, soil, and irrigation system features. They can also register outlier removal criteria for weather and soil data and choose algorithms for the fusion service. Regular users can register farms and fields.
Farm Register: Users provide information about the farm, such as address and geographical co-ordinates (i.e., latitude and altitude) for the Smart&Green framework, and select the weather station closest to the farm.
Crop register: A specialist user can create types of crops using information such as a description, the curve of the crop coefficient, and the critical moisture condition.
System Irrigation Register: A specialist user inserts the type of irrigation systems, such as “micro-sprinkler”.
Weather Station Register: Smart&Green automatically selects the weather station closest to the farm using the geographical co-ordinates. Users can confirm this or choose another one.
Soil Sensor Register: The user can insert the types of soil sensors used. Smart&Green already has analog and digital tensiometers.
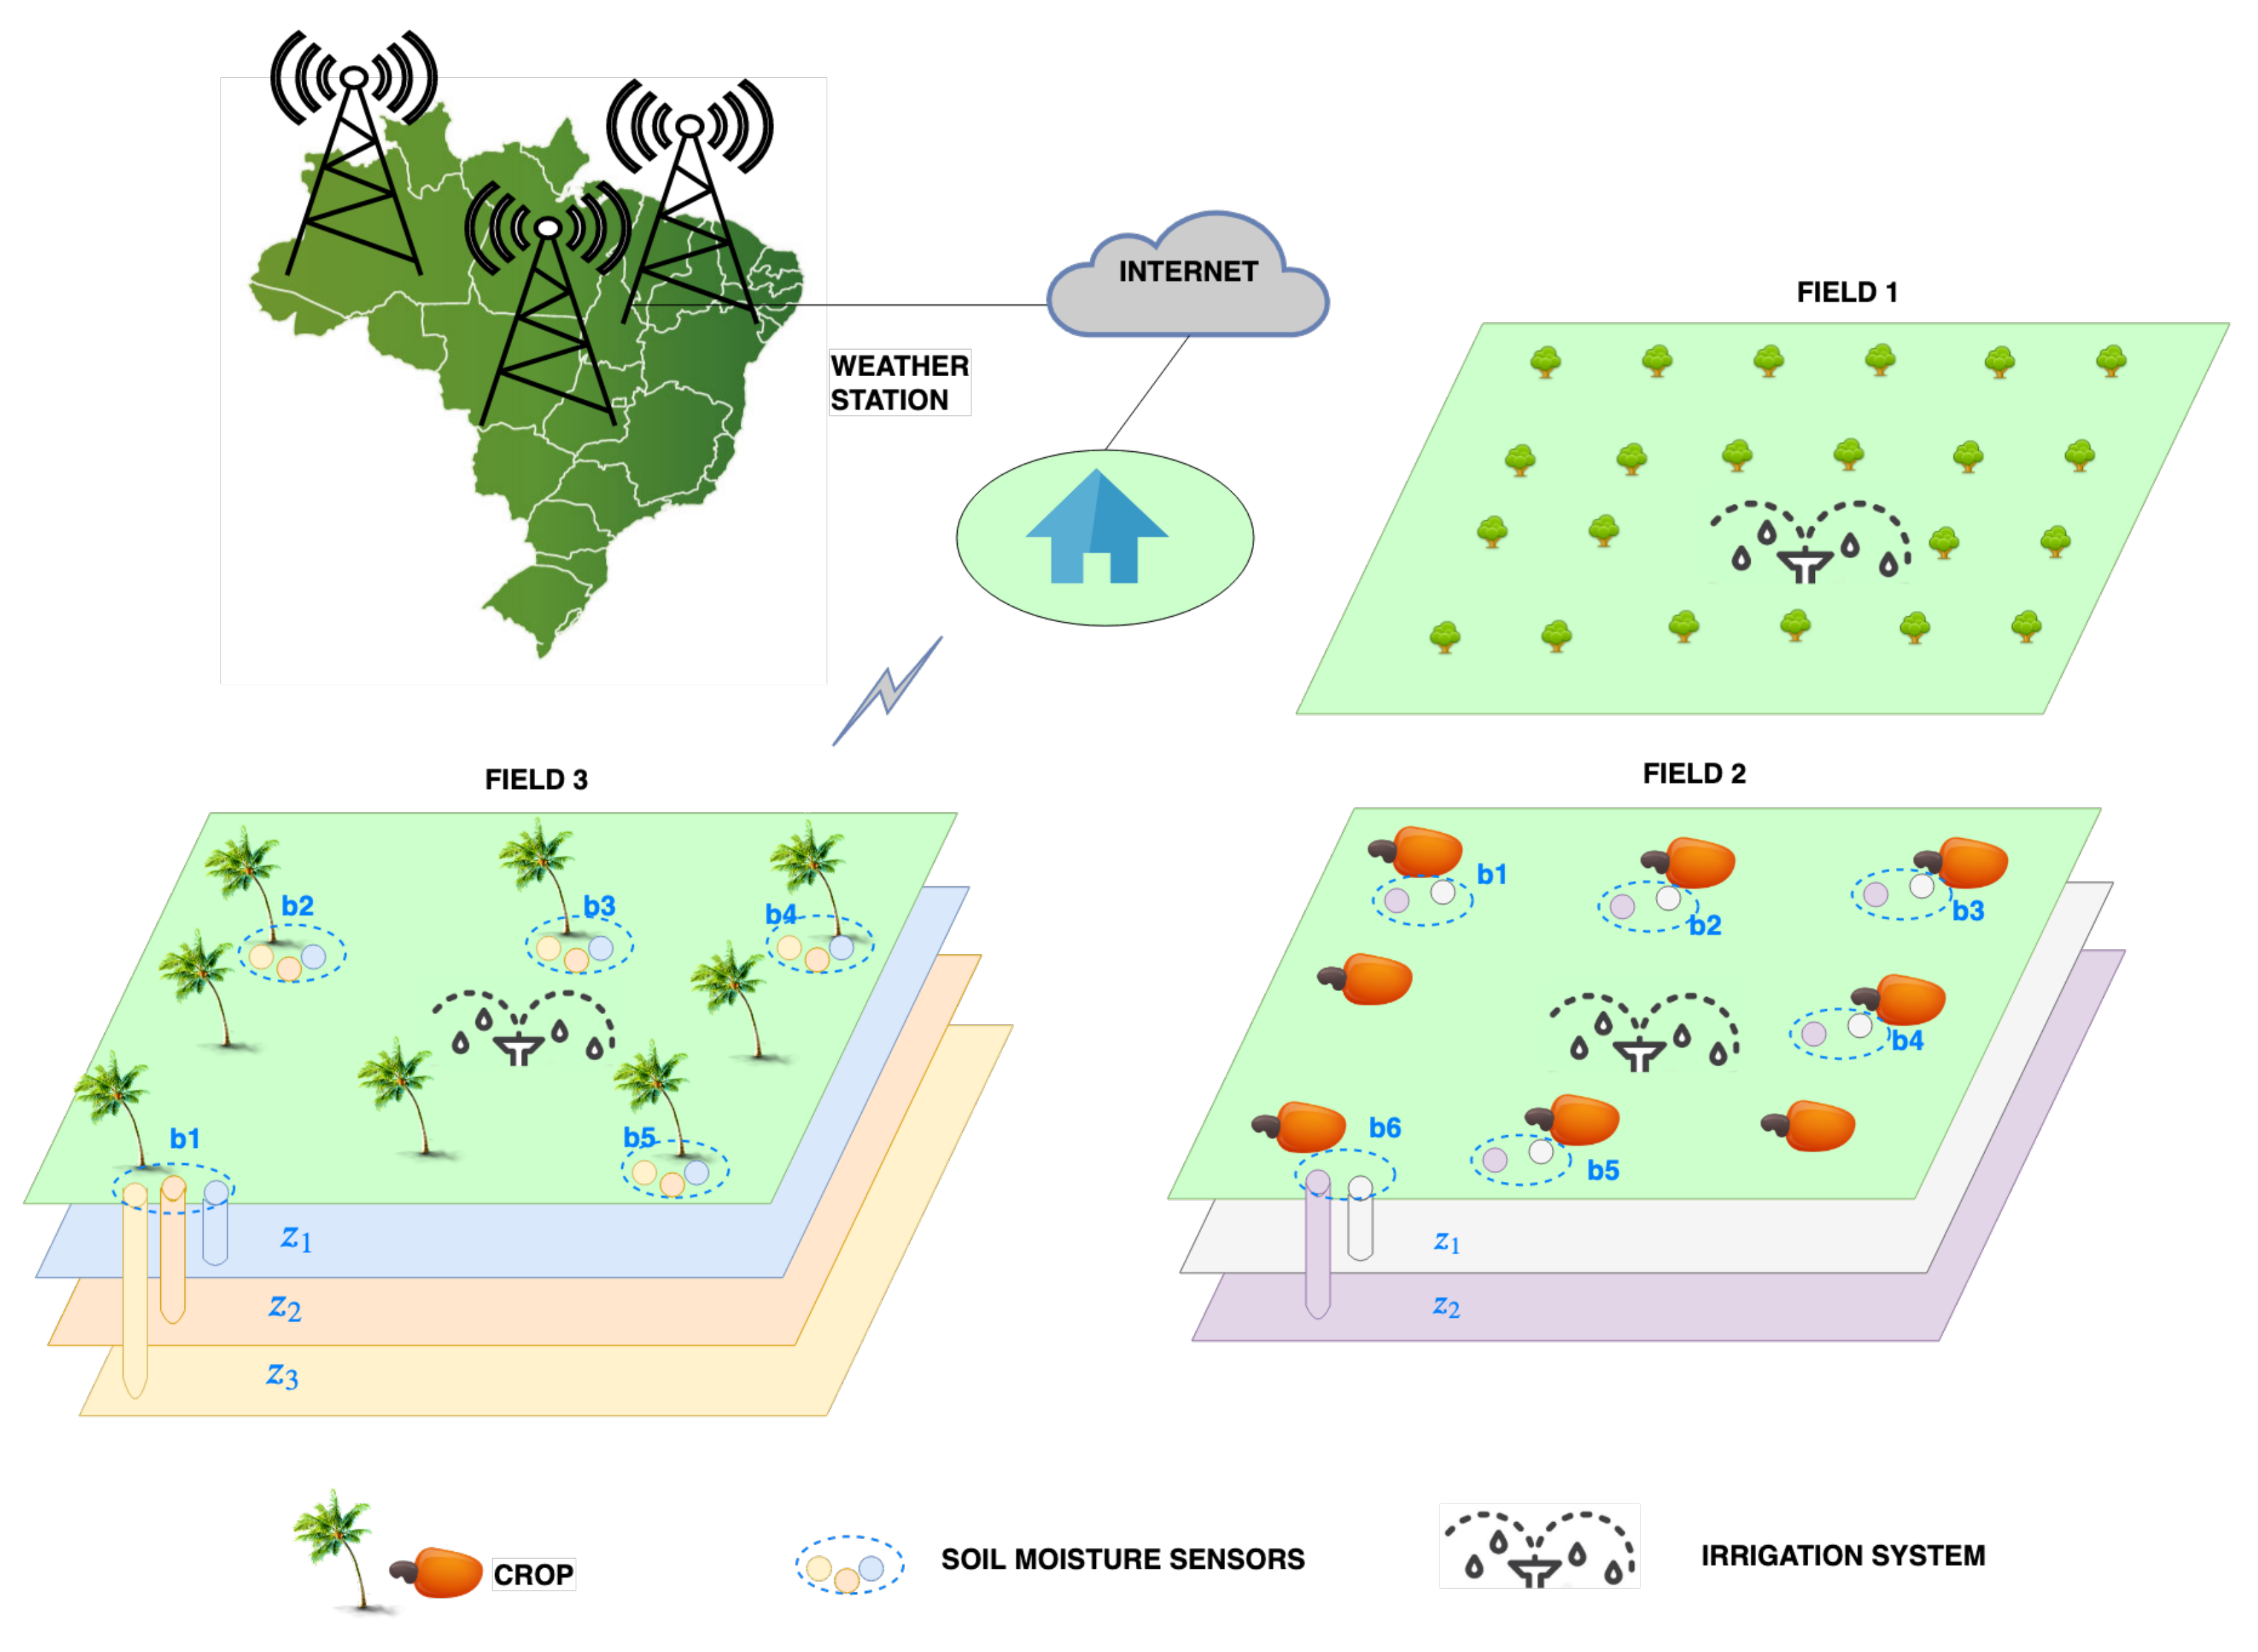
Field Register: Users set the field configuration features (
Figure A1), such as the type of crop, irrigation system, soil, and if there are soil monitoring points. The developmental stage of the crop represents the number of days since the initial cultivation. Effective precipitation (mm/h) and efficiency of the irrigation system are necessary for irrigation management, in order to compute the irrigation time. In the case of monitoring points, users can register the type of soil moisture sensor (analog or digital) and the depth
z monitored for each monitoring point in the field.
Field Communication register: In the case where the monitored fields have sensor nodes that automatically gather soil data, users can define the type of communication to send the data to the framework. Users set the IP address and specific configuration (CoAP or MQTT).
Outlier Removal Criteria Register: Specialist users can create a threshold for minimum and maximum values of each type of weather and soil moisture data used in irrigation management.
The Smart&Green framework suggests an irrigation management plan, according to the data of a registered field. For fields without soil moisture sensors (Field 1 of
Figure A1), Smart&Green indicates the water balance without soil moisture data (i.e., without the term
in Equation (
A3)) or the water balance with the soil moisture data created by the soil moisture prediction module (
Section 3.1.2). For fields with soil moisture sensors (see Fields 2 and 3 of
Figure A1), the framework calculates the matric potential (Equation (
A2)) or water balance using the soil moisture data.
3.1.2. Soil Moisture Prediction
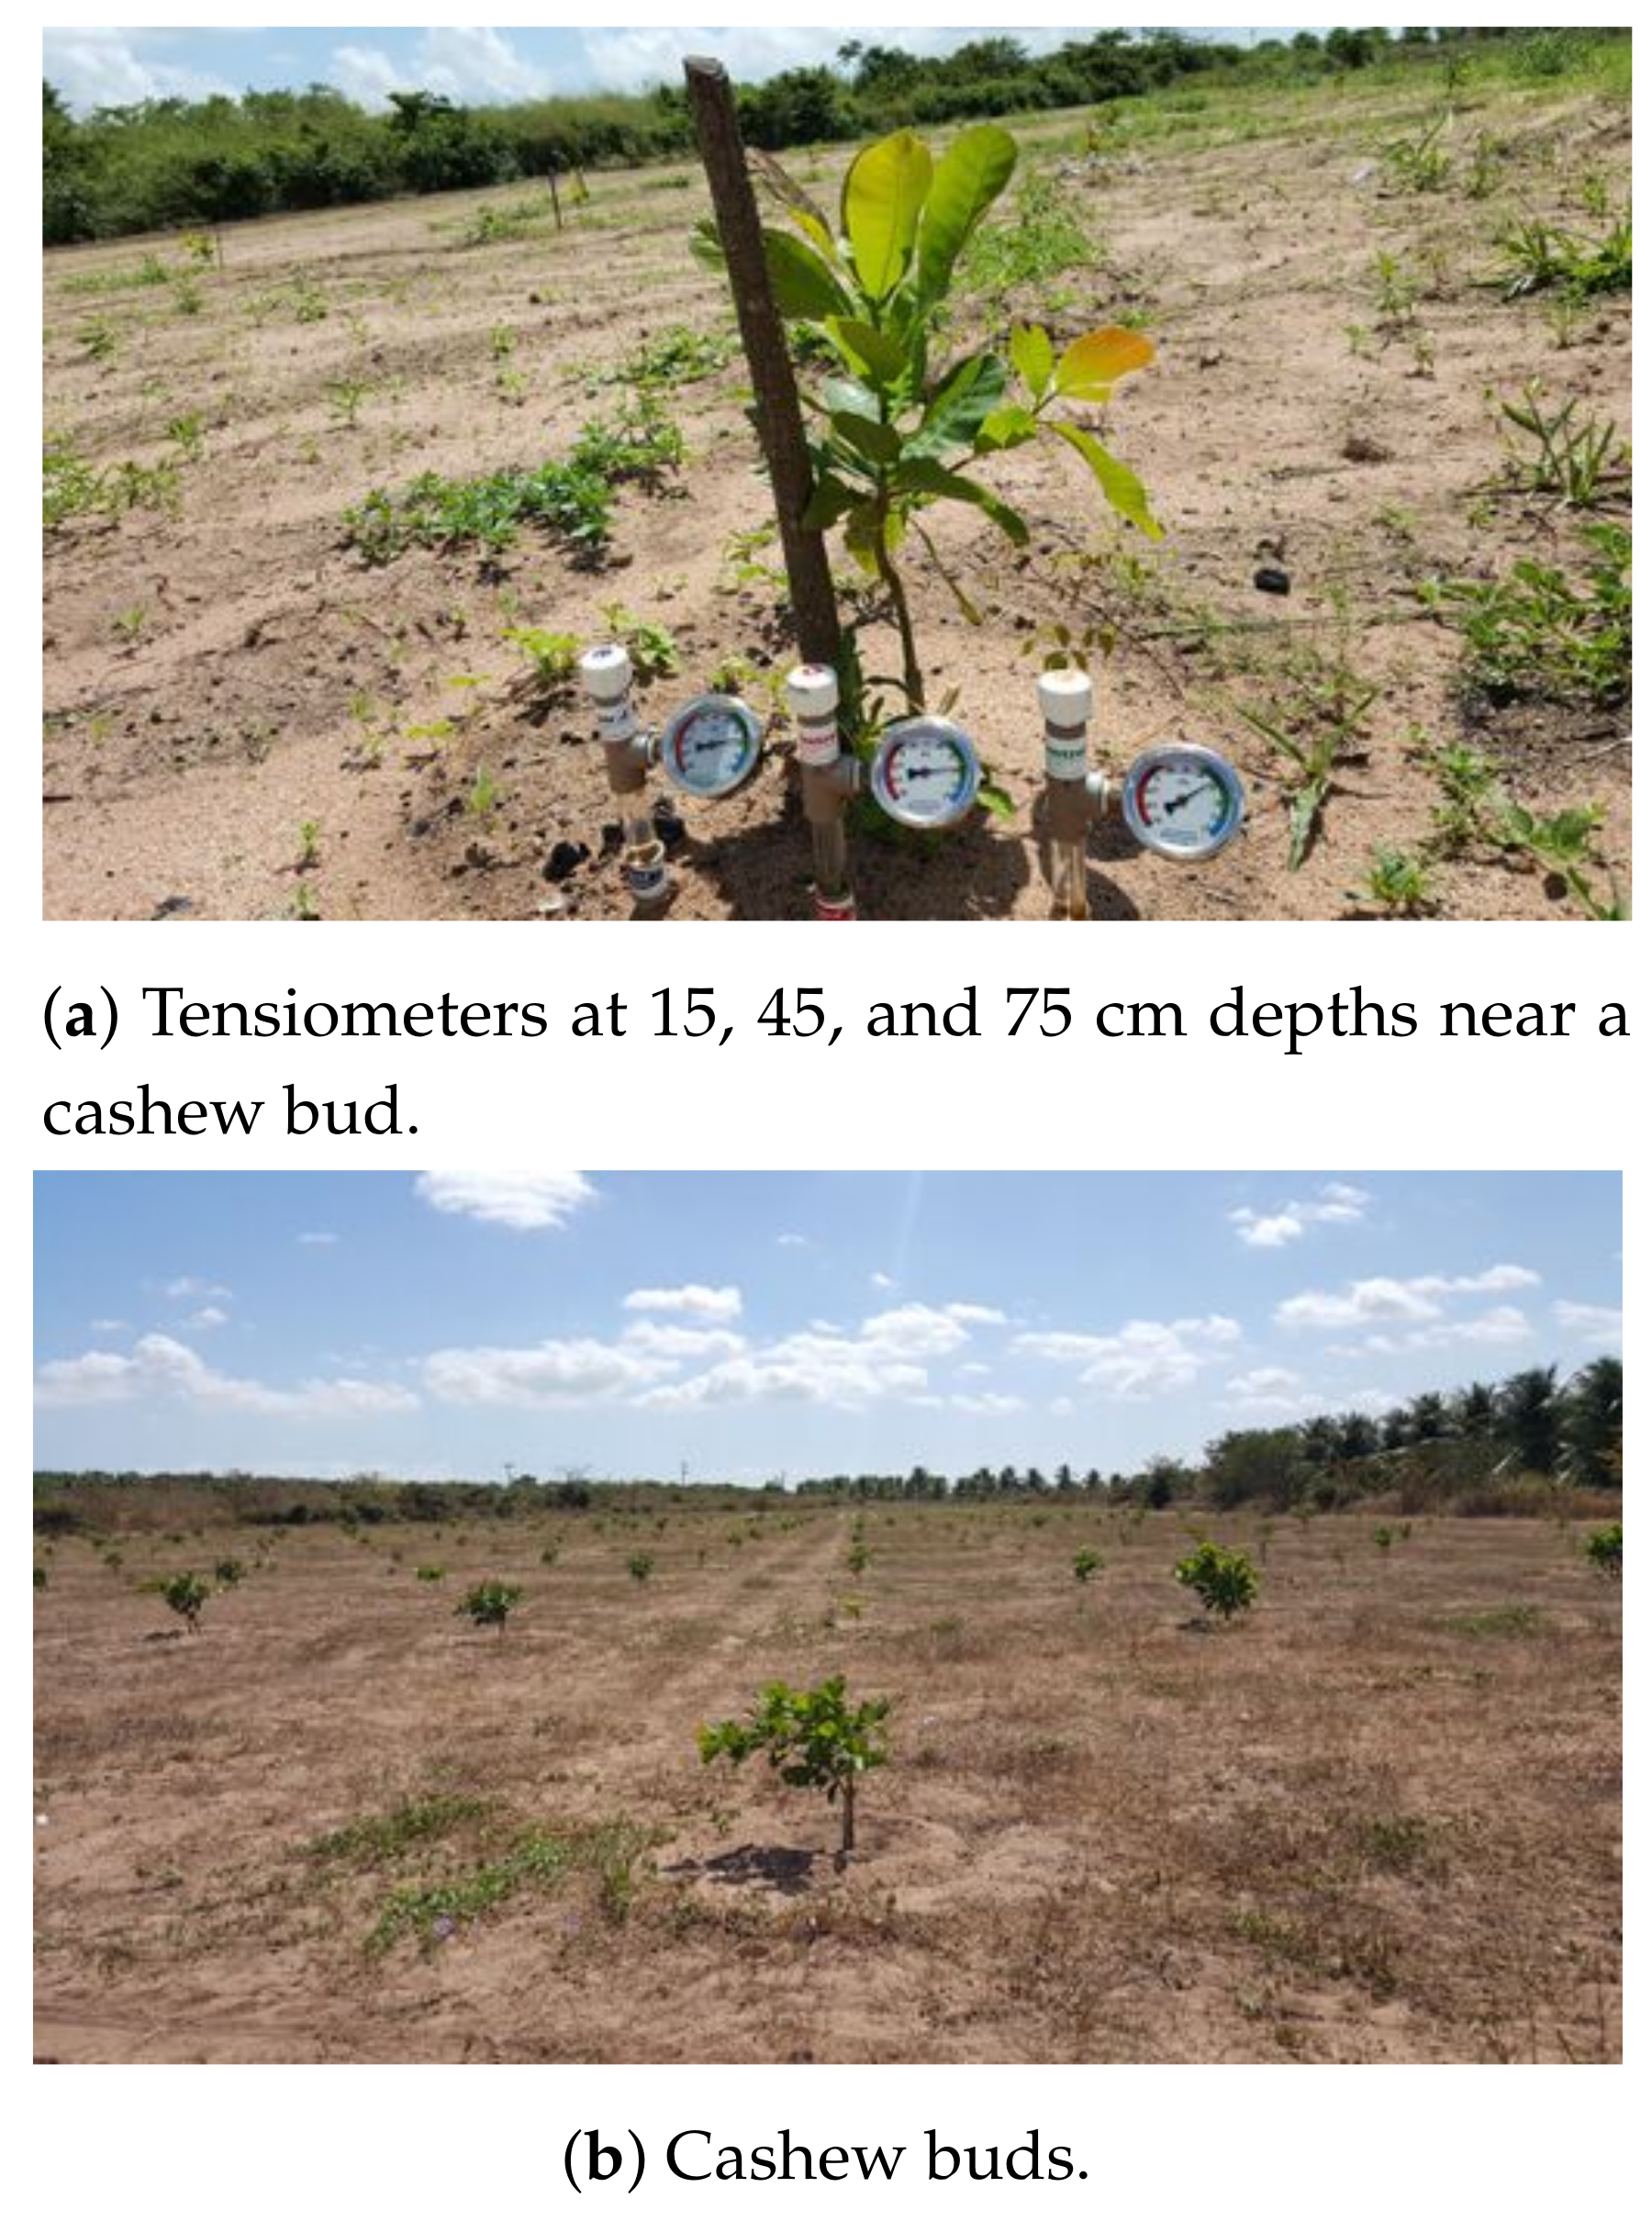
In this work, we address a large field (over 7500 m
) to produce one type of crop on a large scale, in which the soil is monitored by a hundred tensiometers (i.e., soil moisture sensors) at three different depths. To investigate this scenario, we present the local and global approaches, which can be used to learn a prediction function
(
Appendix B).
The local approach creates a different prediction function for each tensiometer at the superficial soil layer of the field. For this, it uses the observations recorded by a tensiometer and a weather station , as well the water amount given to the crop and the crop coefficient related to the current life stage of the crop. The local approach defines the prediction in terms of n different functions for local predictions. However, if a field has a large number of tensiometers, a large number of distinctive prediction models must be trained.
The global approach creates only one prediction function using the information from all tensiometers. Therefore, the global prediction model might not fit some individual tensiometers.
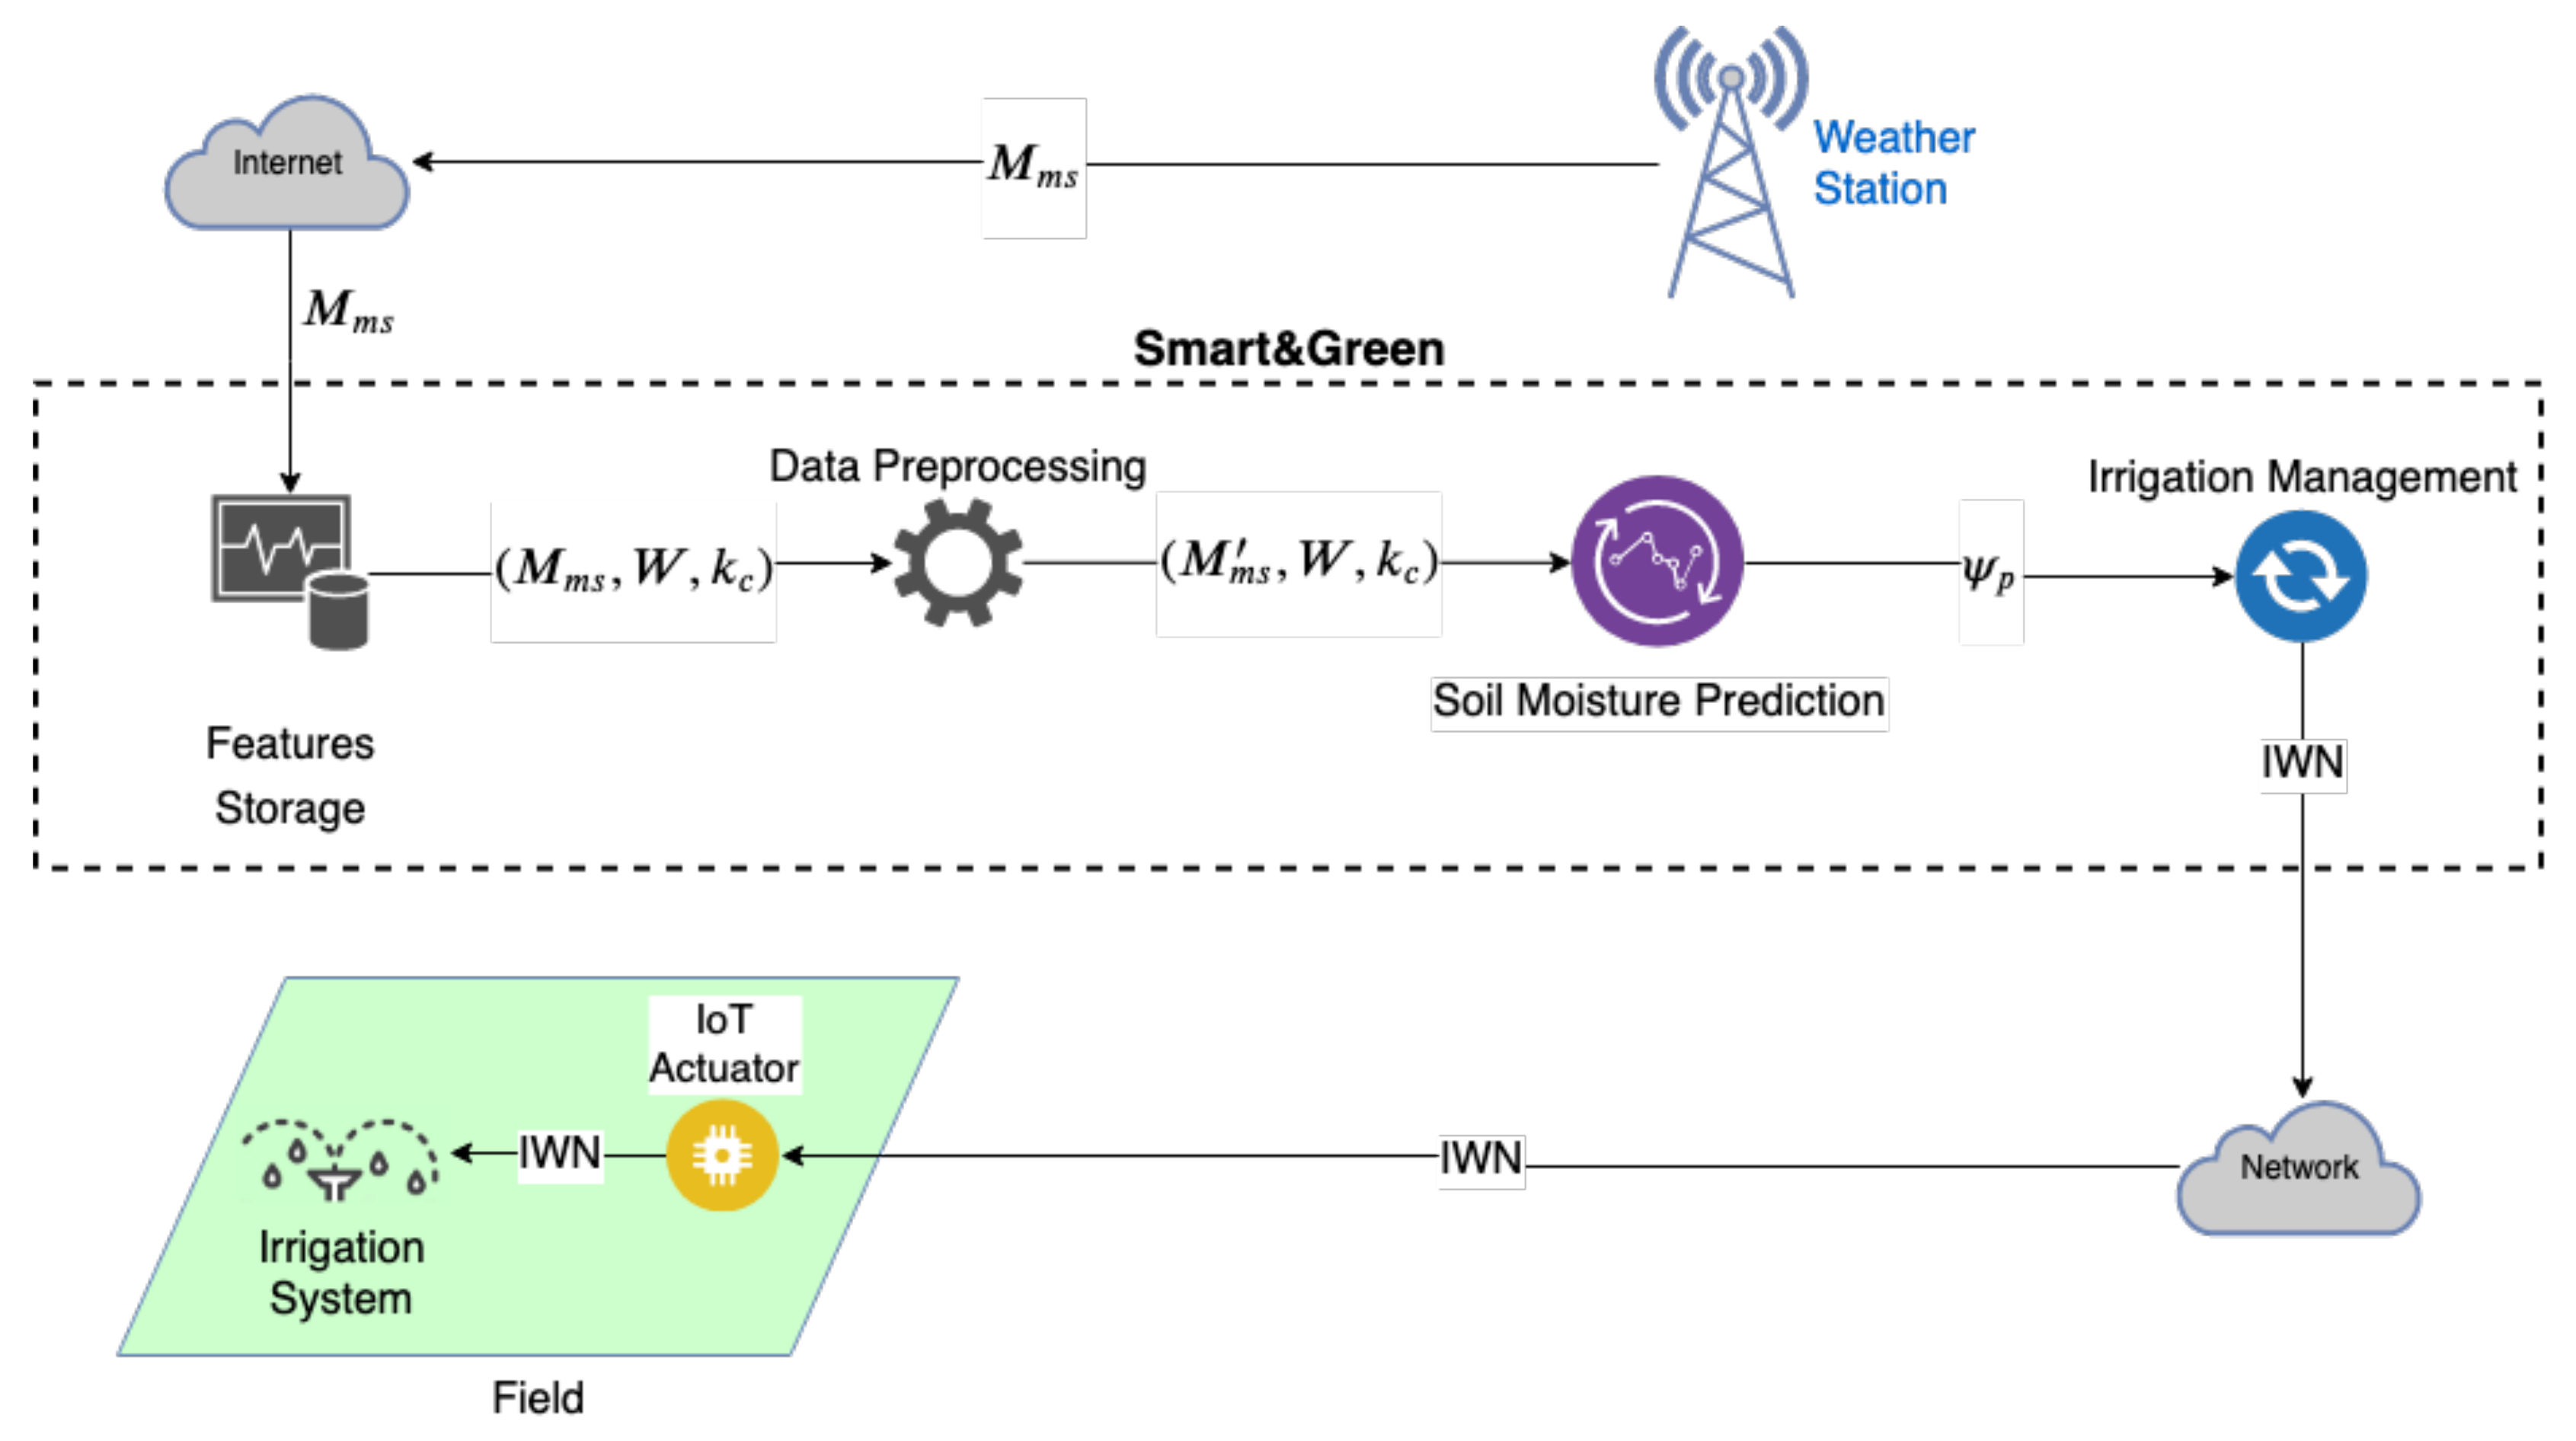
The Smart&Green framework implements the prediction model as a modular service (
Figure 2) to complement the irrigation management of fields without soil moisture sensors (e.g., field 1 in
Figure A1). The framework automatically retrieves and stores the meteorological data set
published on the Internet by weather stations. We defined
in
Appendix B.
The framework daily preprocesses the
data to remove possible outliers. The module of soil moisture prediction estimates the matric potential
of a field, based on
(
Appendix B). The irrigation management module computes the current soil moisture
by applying
on the Van Genutchen [
57] model, following Equation (
A1). Then, the obtained
is applied to Equation (
A2) or (
A3) to calculate the irrigation water need (IWN).
In the Internet of Things (IoT) context, the framework sends the IWN value to an actuator to start the irrigation system. The irrigation system stops when the field receives the amount of water specified by the IWN. Although this present work does not handle an automatic irrigation system, this issue is a concern for the full implementation of an IoT system for smart farms.
3.2. Service Layer
The Service layer supports the Application layer by storing data provided by Smart&Green users and synchronizing crop, weather station, and soil data when required by any irrigation management module. The Service layer also carries out fusion tasks for data of soil moisture sensors (e.g., fields 2 and 3 of
Figure A1) or the soil moisture prediction.
The Storage service provides centralized data persistence for the monitoring of weather, crop, and soil data in the fields. The Synchronization service selects the crop coefficient which is appropriate to the current development stage of the crop and retrieves the weather data for the period needed for irrigation management. The service also requests the Communication layer for new data from the Internet, if needed.
In the case of soil data, the Synchronization service selects data from all monitoring points
in the field, taking into account the period of irrigation management. If there are no data available, the service requests new data from the user (field 2 of
Figure A1) or the Communication layer (Field 3 of
Figure A1). Finally, the Synchronization service makes the data set composed of
available.
The Irrigation Management Modules use the Fusion service if there is a field with monitoring points, each with one or more soil moisture sensors (e.g., tensiometers) at different depths
z (e.g., fields 2 and 3 of
Figure A1). The Fusion service can also treat data created in soil moisture prediction when irrigation management is required for fields without soil moisture sensors. Data fusion consists of processing the data to detect and remove outliers (DRO) and submitting data to a co-operative function (CF), according to a multilevel data fusion architecture [
58].
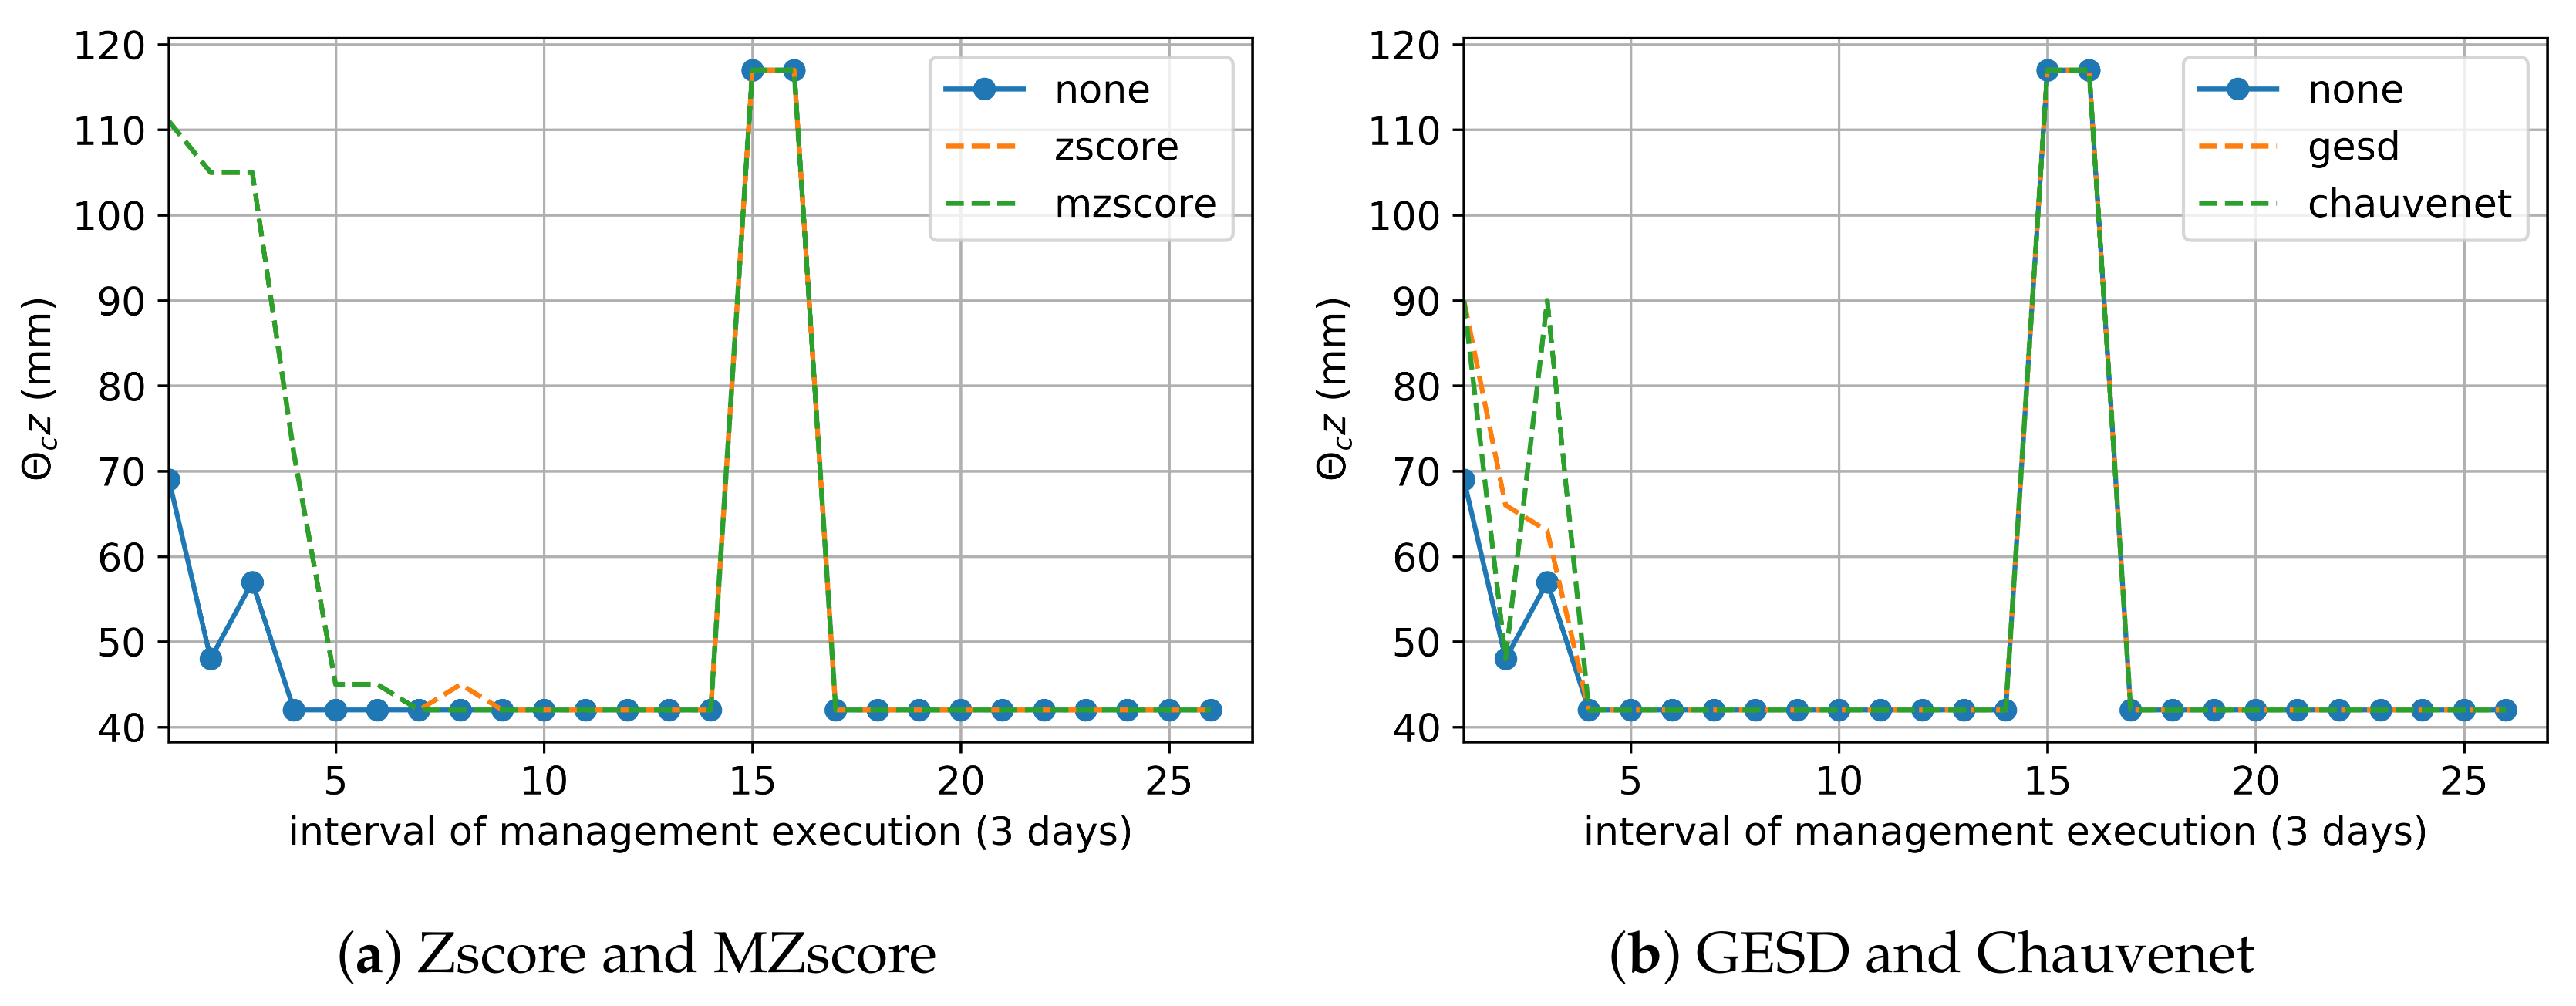
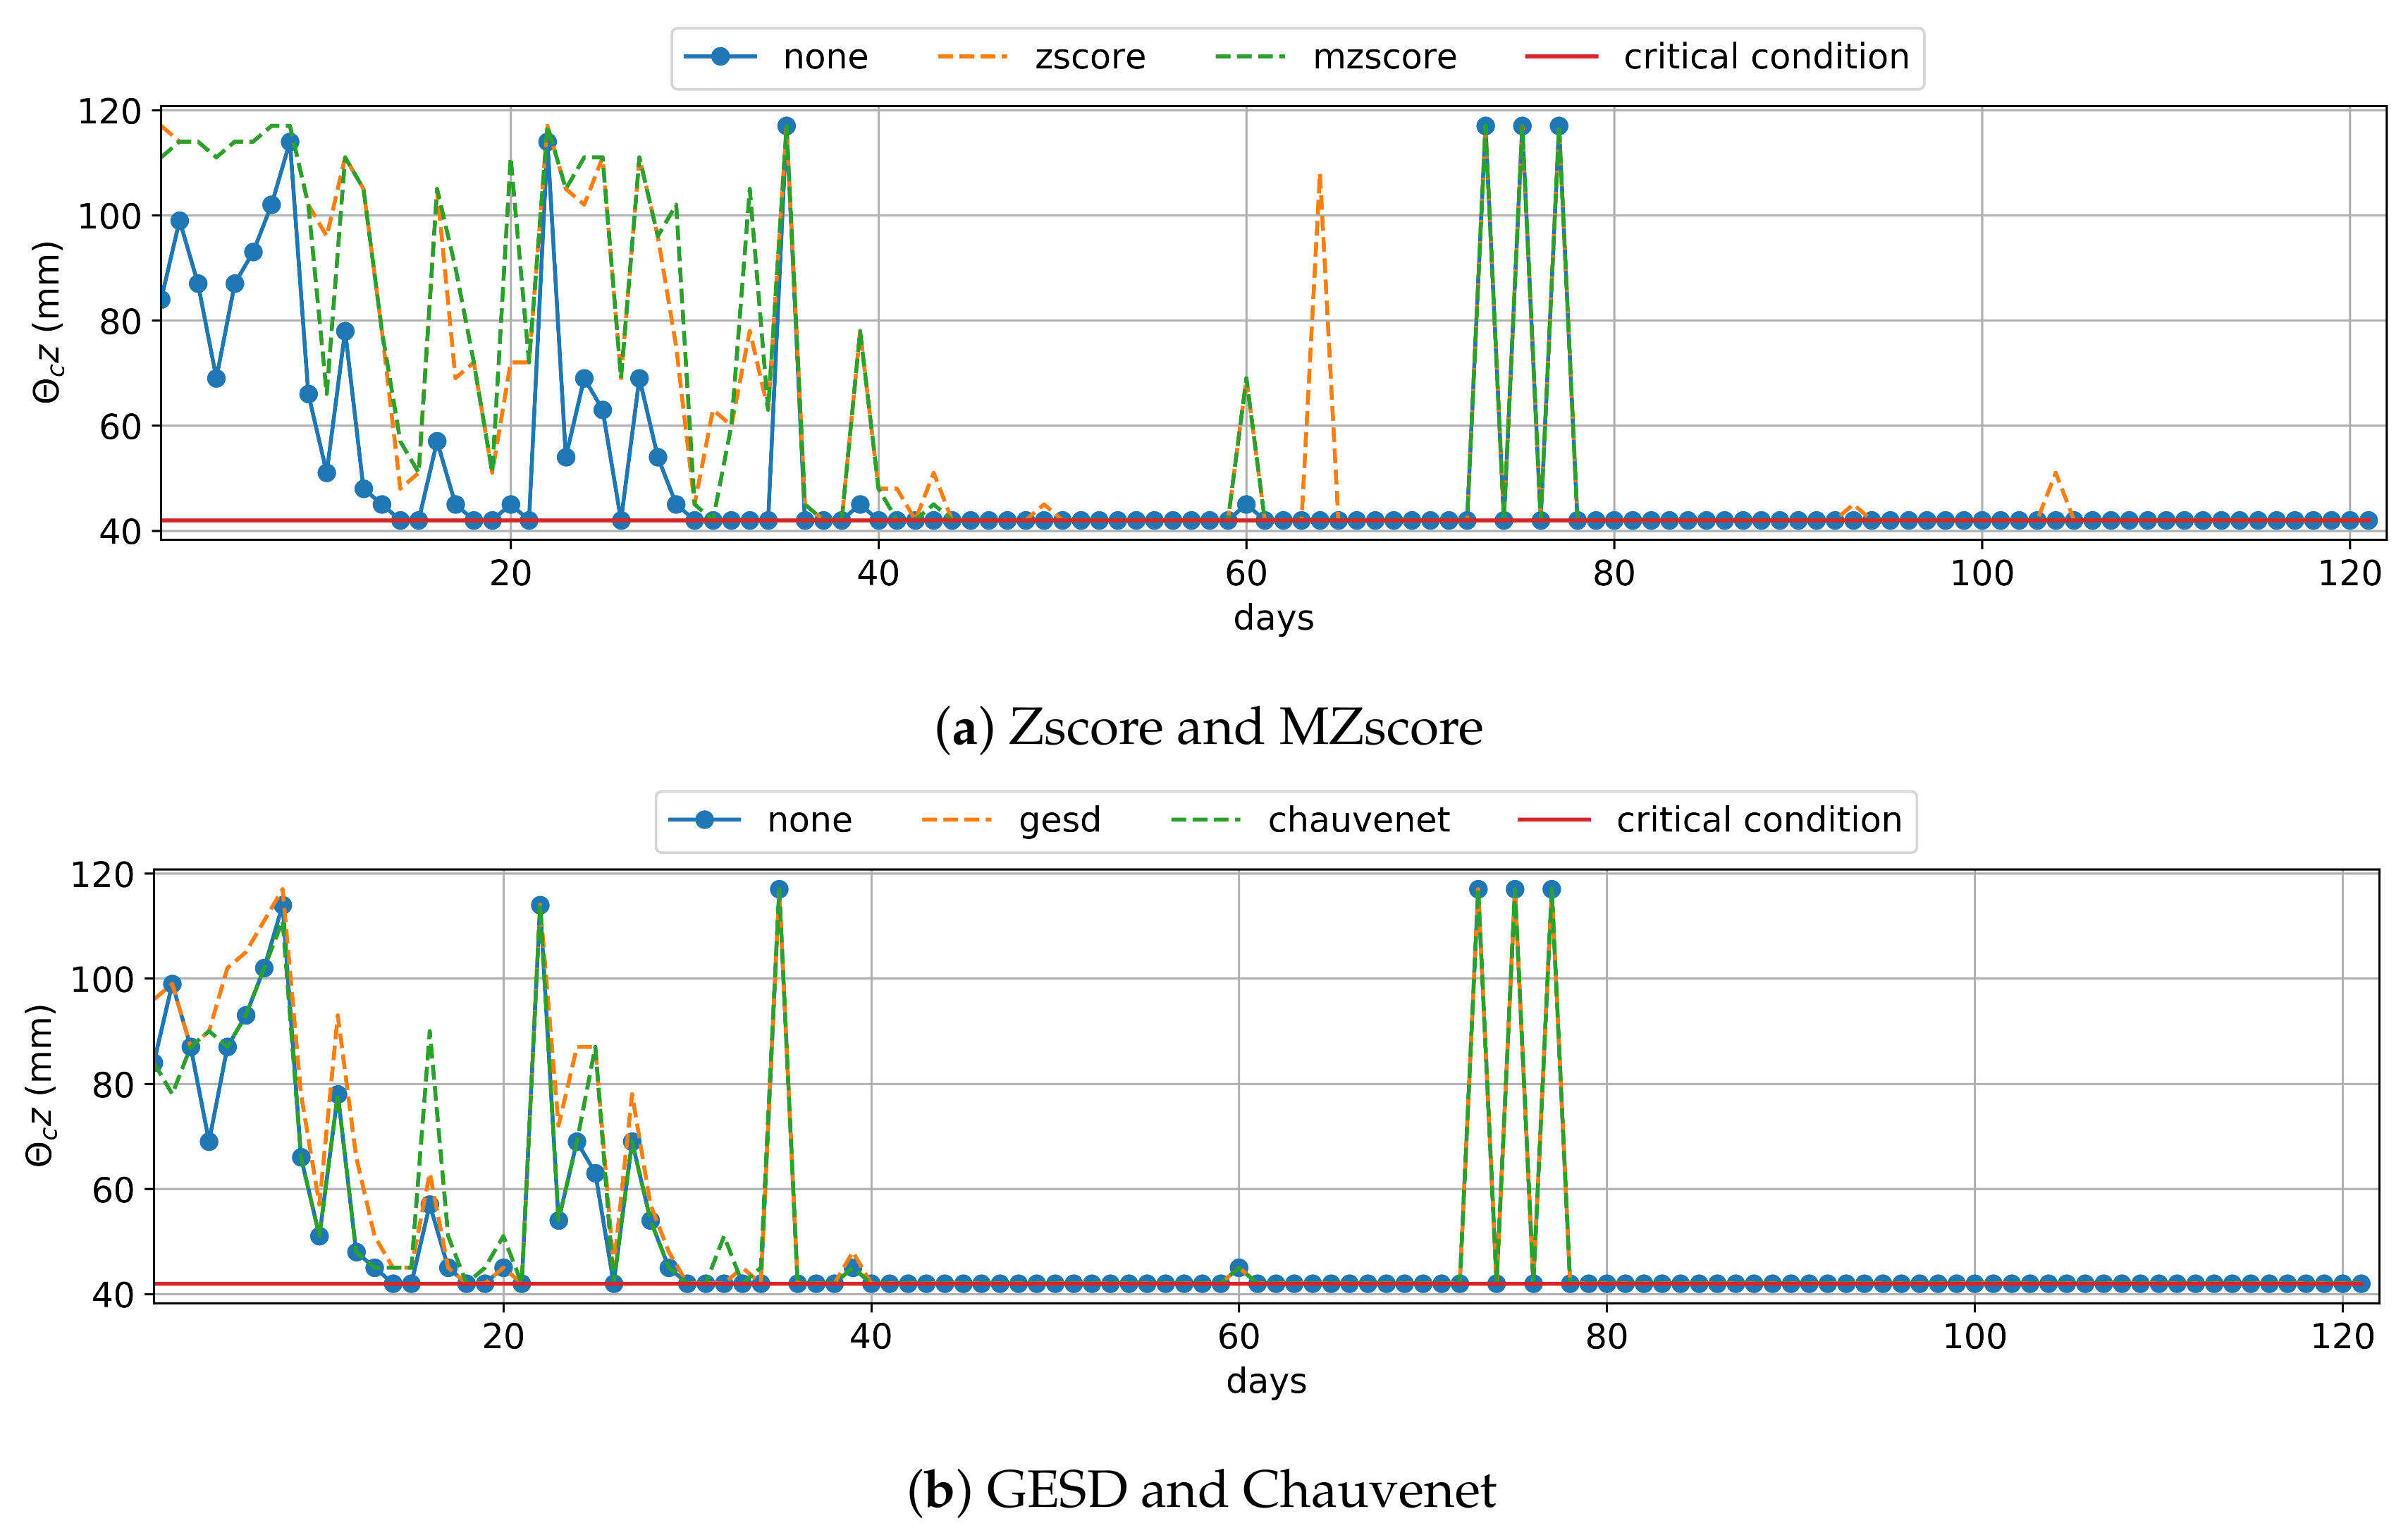
DRO tasks apply criteria and algorithms defined by specialist users to immediately detect and remove outliers. The Register module of the Application layer allows for the creation of threshold values for soil data. DRO algorithms are specific to the soil layer monitored. According to [
58], the Z-score is more efficient for data series at the most superficial soil layer (e.g.,
cm). In contrast, the Generalized ESD (Extreme Studentized Deviate) algorithm works well with data at depth of
cm. The Smart&Green framework has implementations of the Chauvenet, Z-Score, Modified Z-Score, and Generalized ESD algorithms.
A co-operative function (CF) [
59] aggregates one type of data gathered at different monitoring points of a field. Smart&Green uses the mean function as the CF to aggregate soil moisture data at the same depth. For example, Field 2 of
Figure A1 has six monitoring points at two depths. Therefore, the framework calculates the mean of each set of six samples gathered at a given depth
z. After fusion, the data are ready for irrigation management at the Application layer, which decides whether irrigation should be started.
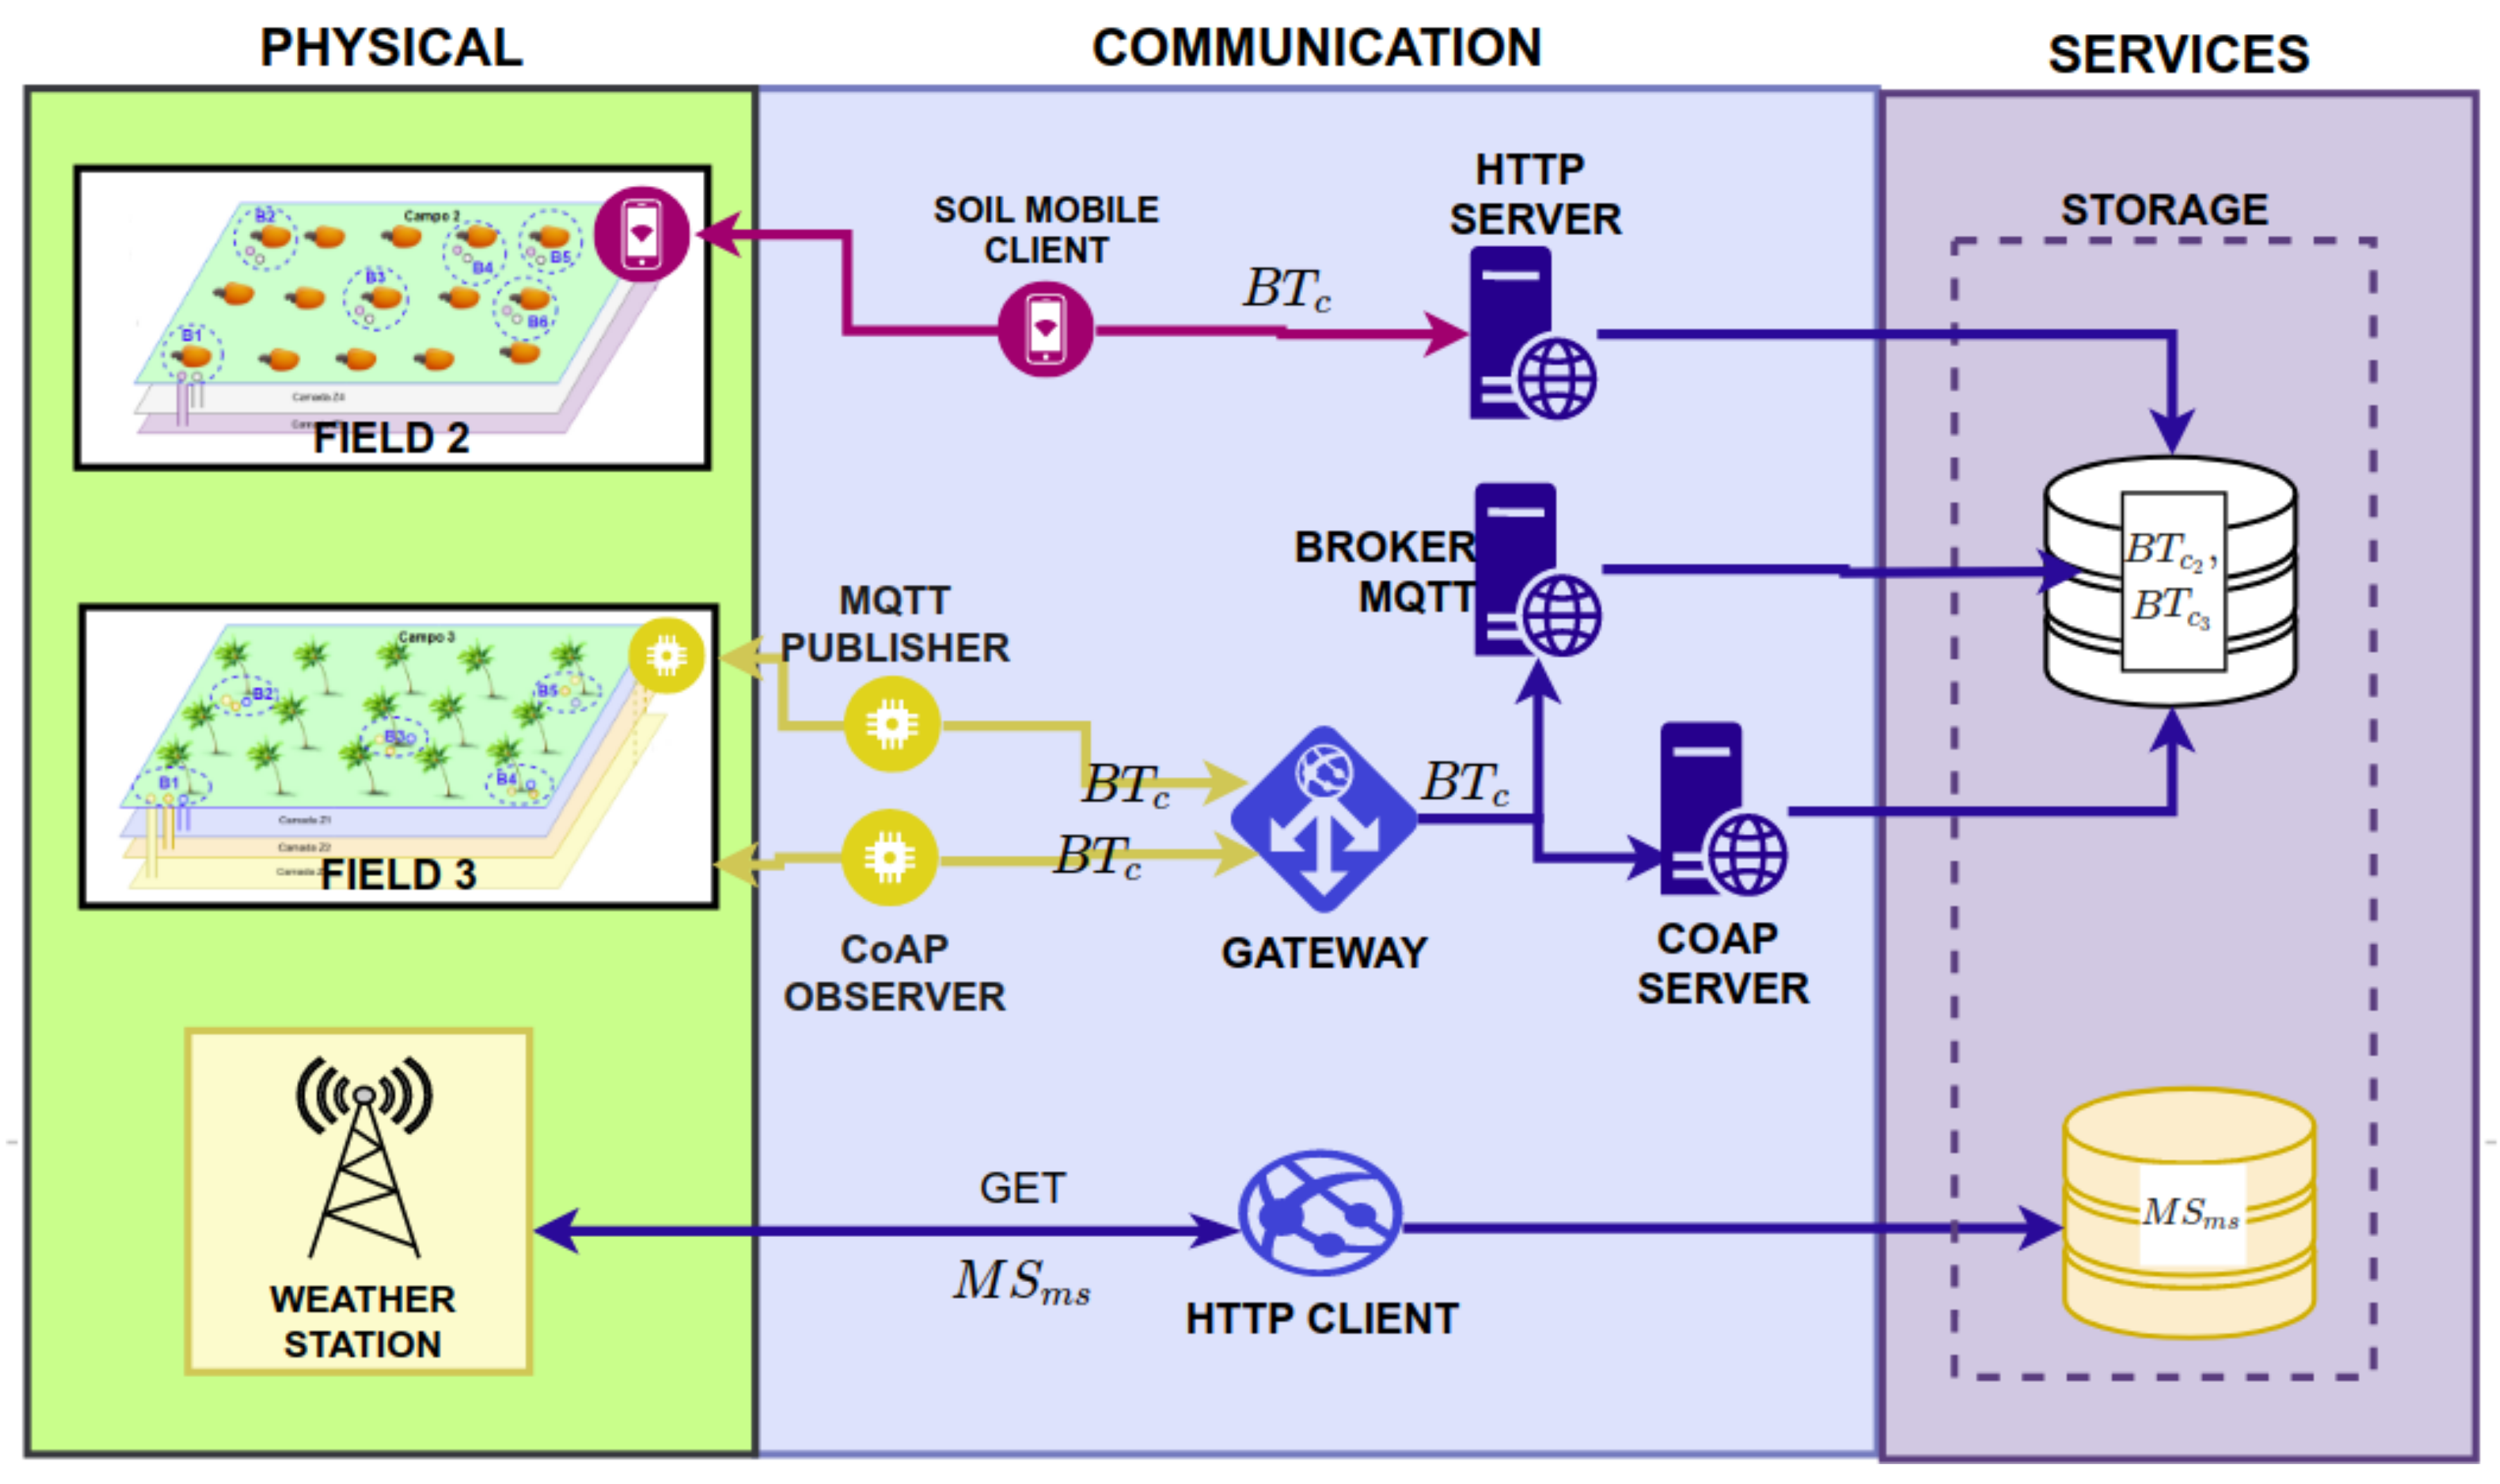
3.3. Communication Layer
The Communication Layer has a set of software to gather weather and soil data through network protocols. This includes a weather client, four soil clients, three soil servers, and a gateway (see
Figure 3). The weather client consists of an HTTP client which downloads weather station data from the Internet and stores them. Smart&Green offers an API to gather data from Brazilian automatic weather stations [
5].
The soil client gathers the matric potential data if the field has tensiometers installed. If the tensiometers are analog, users have to manually collect the data, using a mobile application that sends it to the framework via HTTP. If the tensiometers are digital, they are integrated into sensor nodes that send the data to a gateway near the field. The gateway hosts CoAP and MQTT clients, which forward the data to the servers of the framework.
6. Conclusions
Smart Agriculture presently lacks an Internet of Things (IoT) platform for the gathering, preprocessing, and storage of data used in irrigation management, which also allows for the reuse of code to different sets of crops, soil, irrigation system, and weather data sources. In this paper, we have proposed the Smart&Green IoT framework which executes an irrigation management plan using the water balance and potential matric approaches according to the crop, as well as irrigation system information provided by users and the weather and soil moisture data available close to the monitored fields. Smart&Green can be used to preprocess soil moisture data with outlier removal criteria and techniques of Zscore, MZscore, GESD, and Chauvenet to provide a more precise irrigation water need (IWN) in irrigation management.
For large fields without soil moisture sensors, we have considered the problem of predicting the soil moisture by analyzing the weather data, crop coefficients, and amount of irrigation water. We have formally introduced the problem of soil prediction and designed a methodology which uses training models according to two different approaches: Local and global. These approaches determine the implementation of prediction models based on supervised machine learning techniques.
The local approach trains a model for each soil sensor in the field, achieving high performance. However, this approach can lead to a high cost of data management if there are a large number of sensors, as it requires the training and maintainence of a large number of distinctive prediction models. On the other hand, the global approach trains a single prediction model over the observations of all the sensors. Our results show that gradient boosting with regression trees (GBRT) outperformed the other evaluated techniques in both approaches. The local approach had the best results with gradient boost, although the results using the global prediction model were also acceptable.
Furthermore, we have designed a module to support irrigation management with our prediction models, based on GBRT. We evaluated irrigation management using the water balance and matric potential approaches with real and predicted data of soil moisture, as well as the impact of preprocessing data with outlier removal techniques. The real data was part of a data set collected from an experimental field for research in the city of Paraipaba, Brazil, in which cashews and other raw materials were grown. We also report that the dataset will be made publicly available to ensure the reproducibility of our results and promote research developments in this field (see
Supplementary Materials).
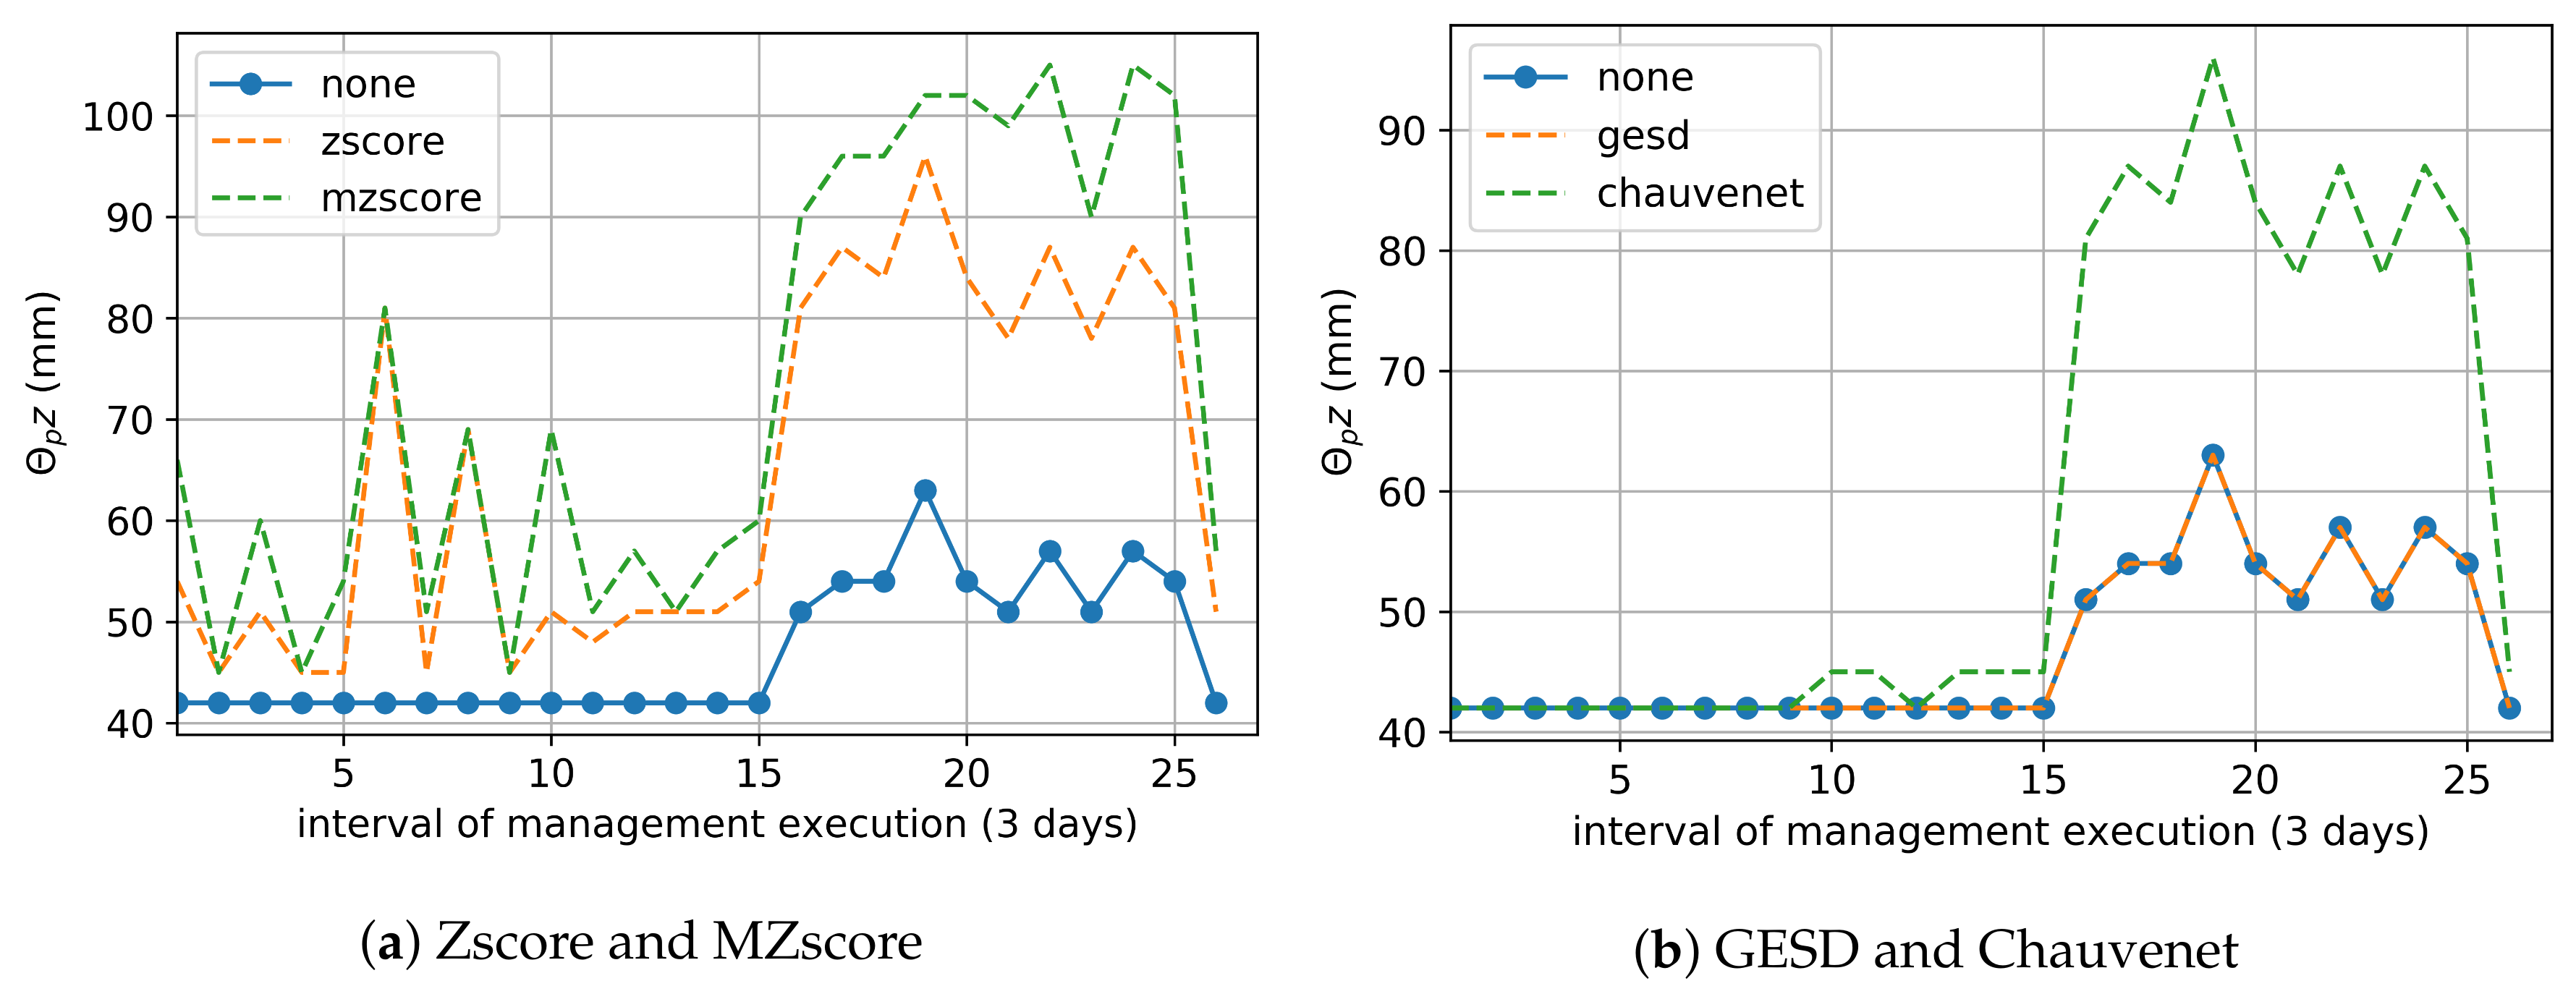
The use of real soil moisture data from the data set in the water balance approach saved as much as 90.4% of the IWN obtained for the water balance when using only weather and crop data. Zscore and MZscore applied to the real moisture data saved 89.3% of IWN, optimizing the tradeoff between IWN saving and healthy crop development. For the matric potential approach, Zscore and MZscore obtained (on average) 20.7% and 14.1% of the IWN savings obtained by matric potential without the use of any outlier removal technique. Considerating a field without soil moisture sensors, we obtained a reduction between 56.4% and 90% of the water balance IWN based on only weather and crop data, when we use our global and local approaches to predict the soil moisture data. Zscore, MZscore, and Chauvenet preprocess the predicted data to optimize the tradeoff without outweighing the performance of water balance using real moisture data. We do not recommend the use of predicted data in the matric potential approach, as the computational models (with errors) outperform mostly the same approach using real data in terms of water savings, according to our results.

 ,
, 


