A POI and LST Adjusted NTL Urban Index for Urban Built-Up Area Extraction
Abstract
1. Introduction
2. Data
2.1. Study Area
2.2. Data Preparation
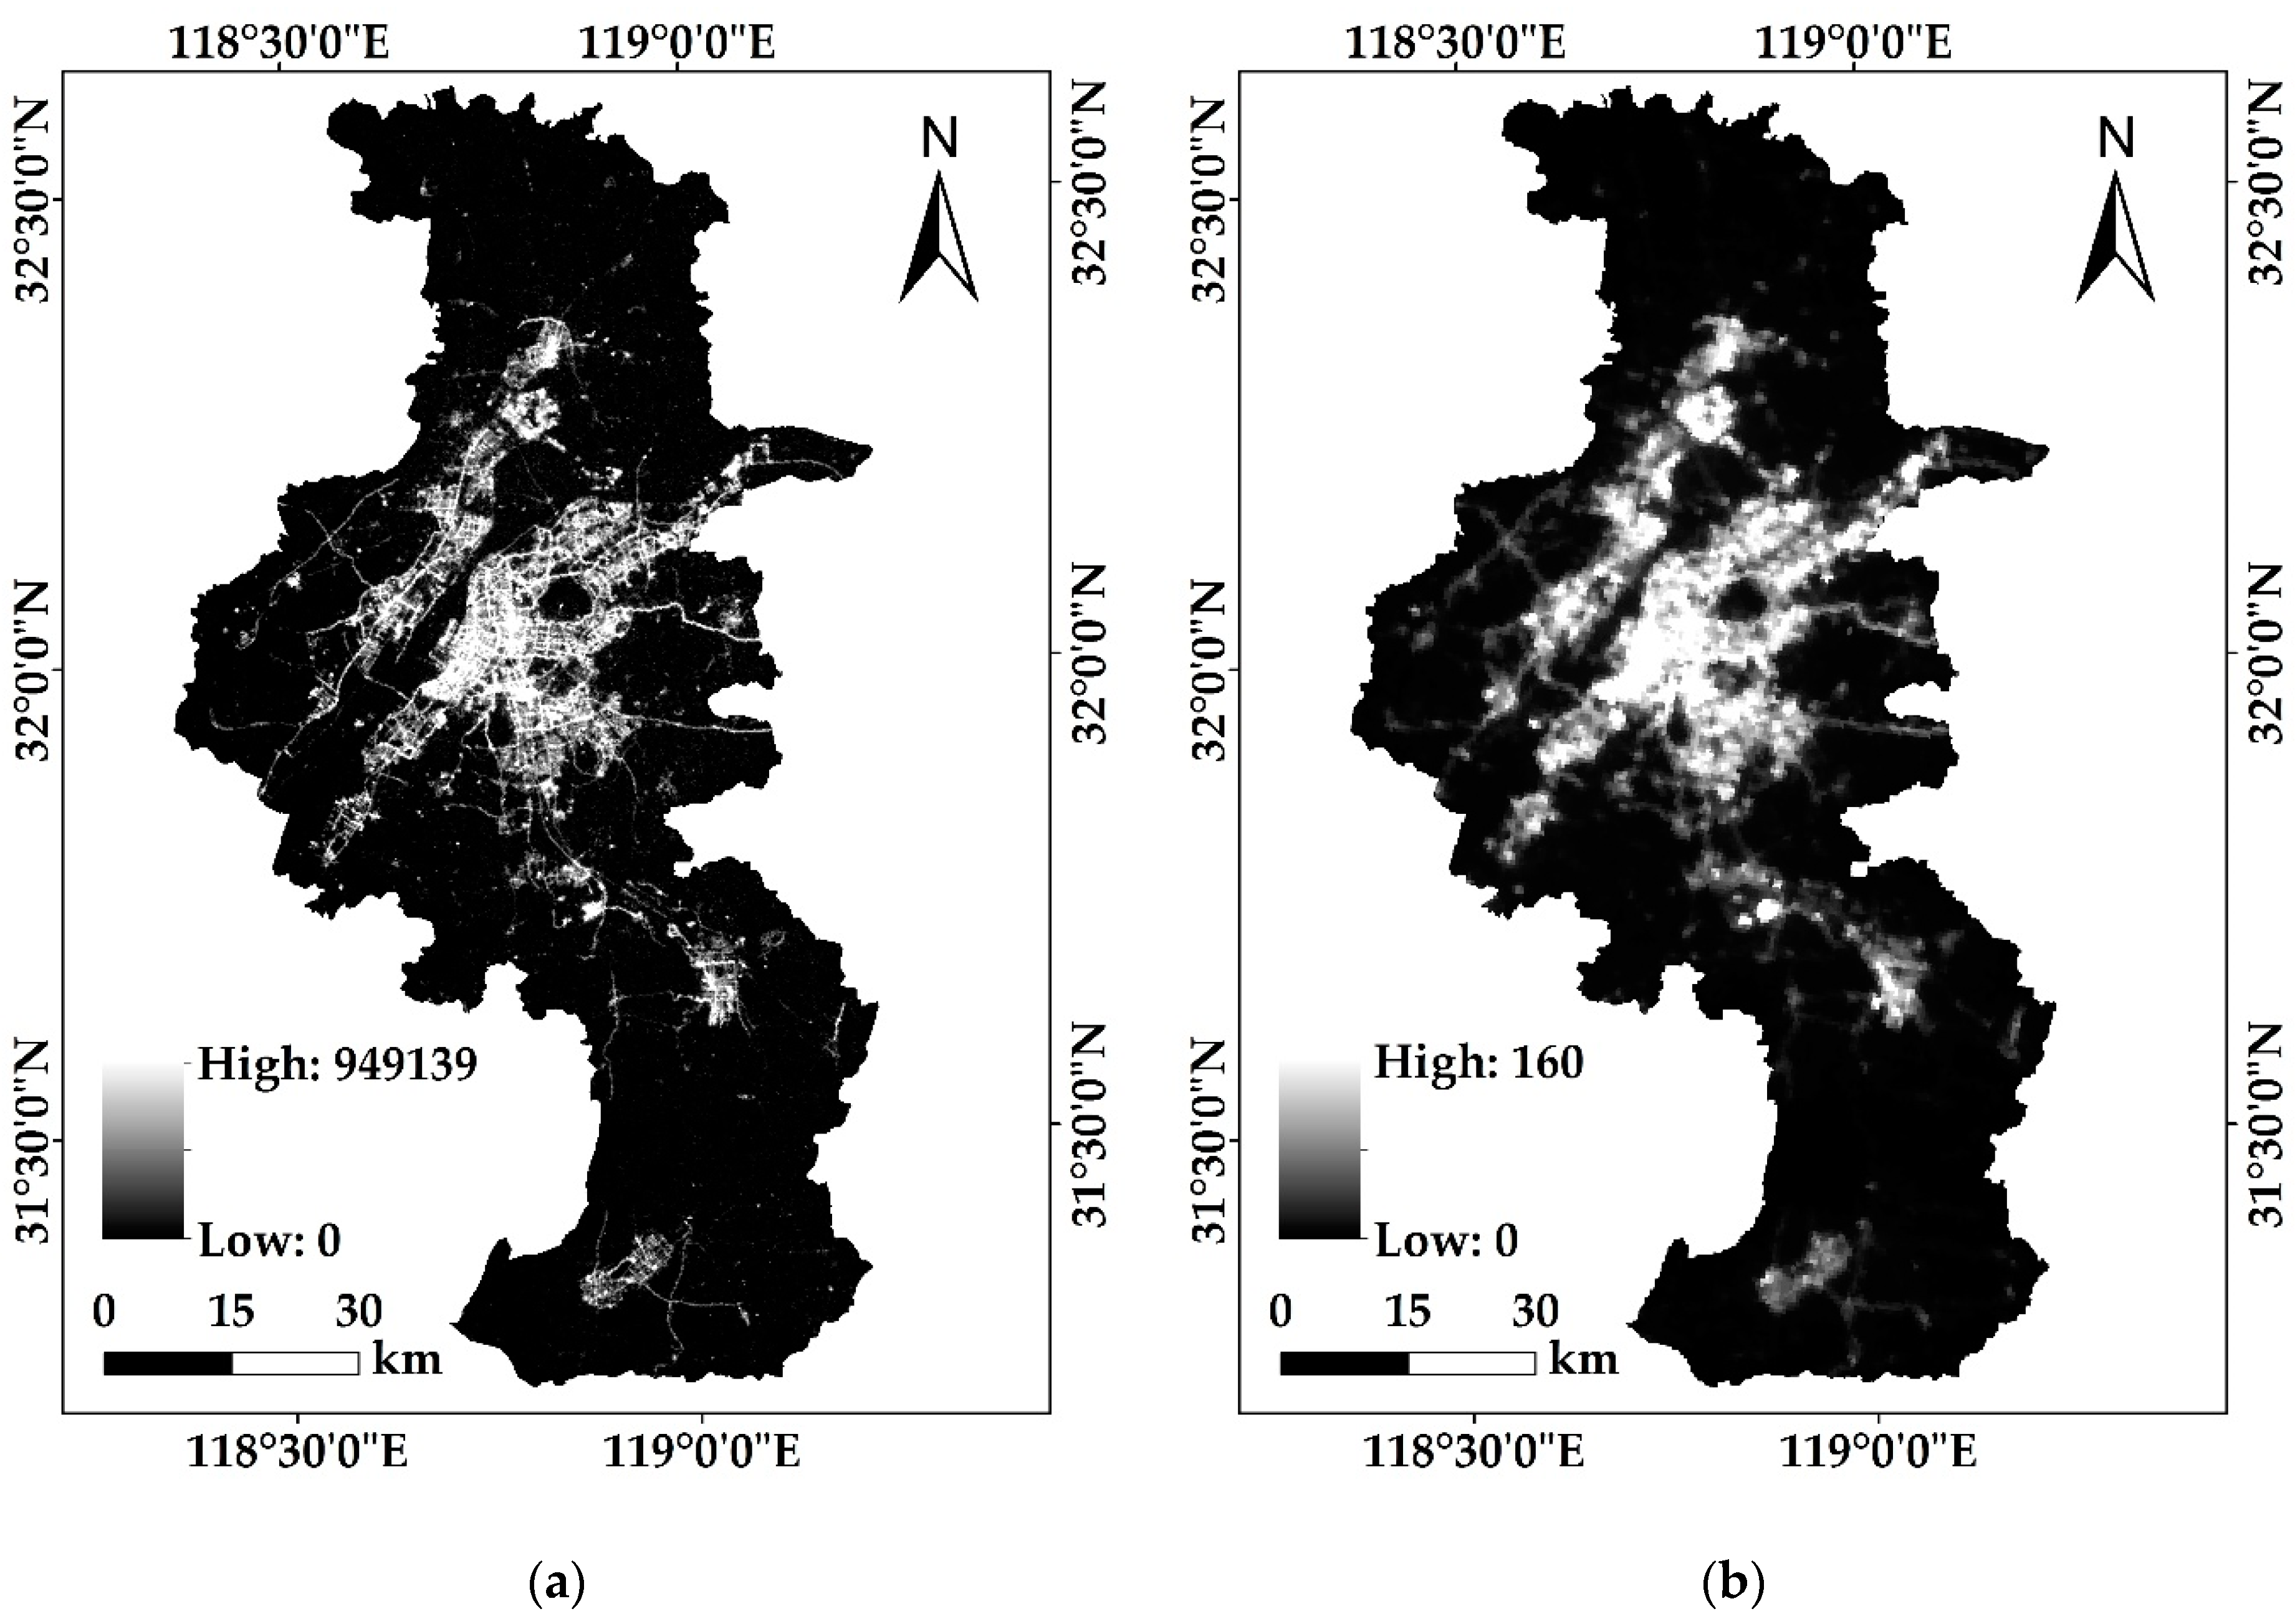
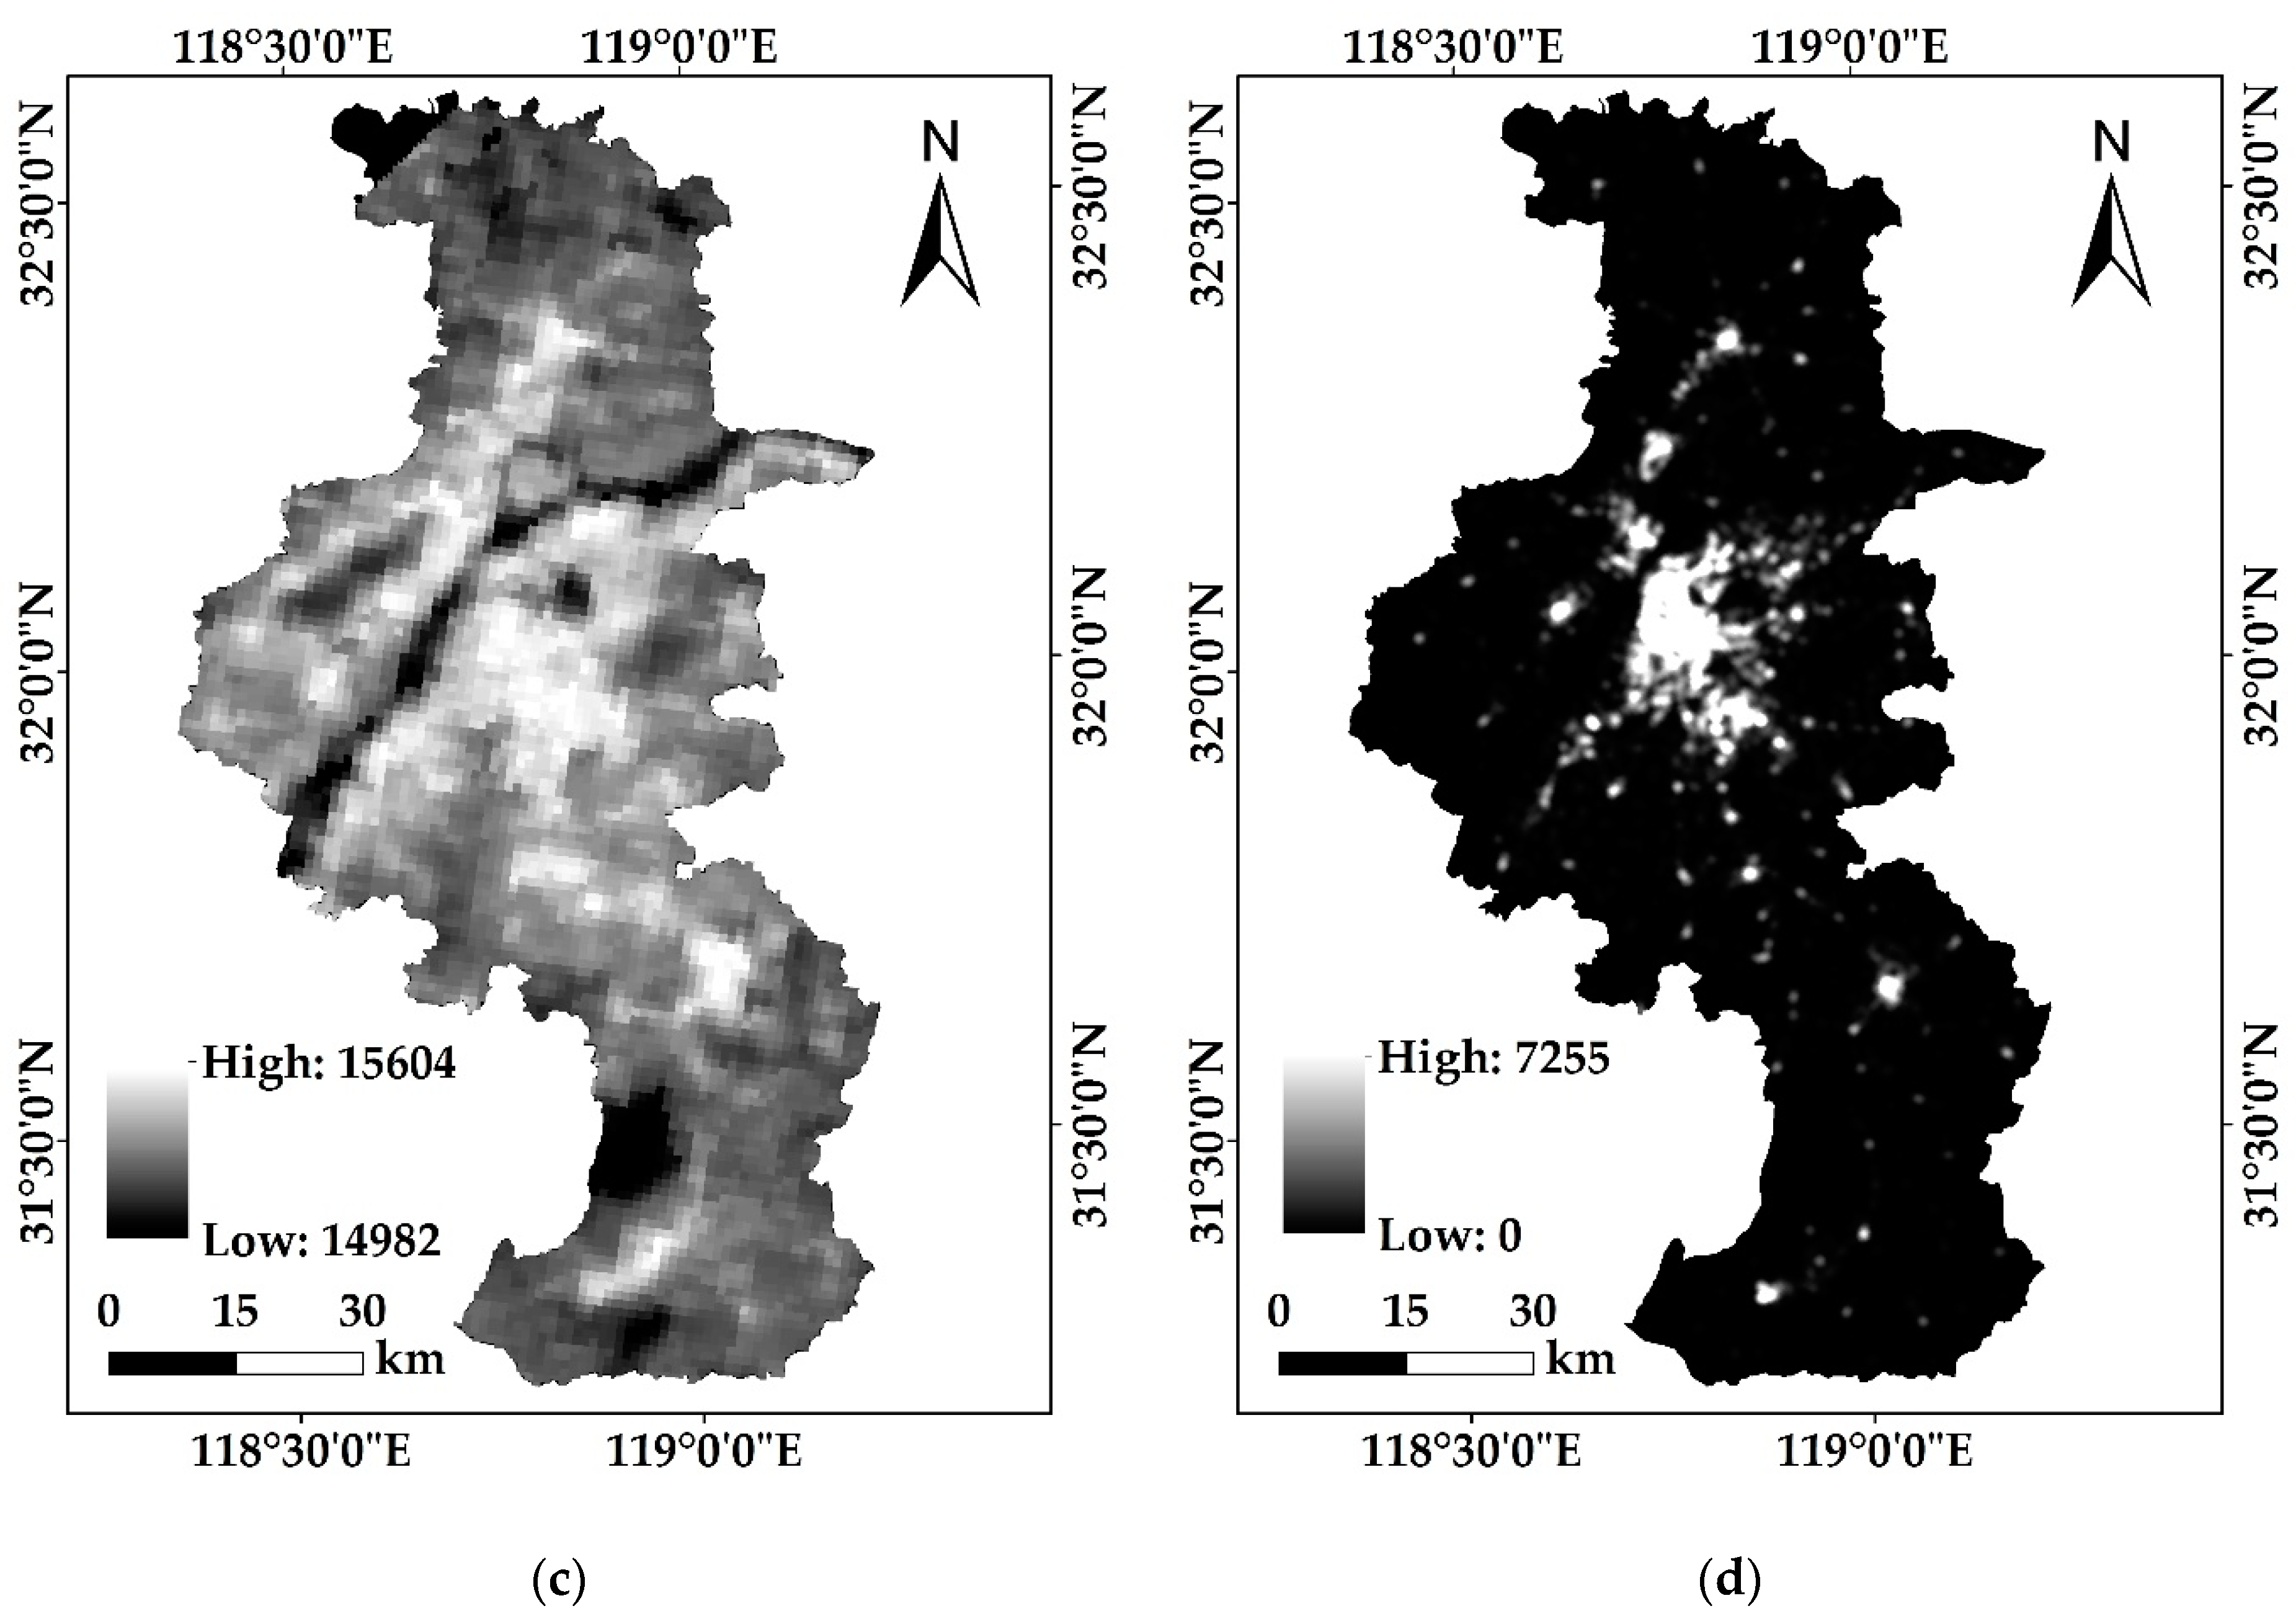
- NTL data includes Luojia 1-01 and NPP/VIIRS images (Figure 2a,b), the selection date of which is July 2018. Luojia 1-01 is provided by the High-Resolution Earth Observation System of the Hubei Data and Application Center. NPP/VIIRS is provided by the National Geophysical Data Center (NGDC). Table 1 shows the specific parameters of Luojia 1-01 and NPP/VIIRS.
- POI was crawled in May 2018 through the Amap API. After data cleaning, Nanjing’s POI totaled 366,123, divided into 13 categories, mainly including catering, shopping, culture, and life. Kernel density estimation was used to pre-process the POI data.
- LST (resolution 1KM, Figure 2c) is derived from the MODIS eight-day composite product (MOD11A2) in July 2018 provided by NASA (http://ladsweb.nascom.nasa.gov), the accuracy of which is better than 1 °C [29].
- The NDVI comes from the MOD13Q1 product (http://modis.gsfc.nasa.gov) provided by NASA. It has a 16-day temporal resolution and a 250 m spatial resolution. Data in June–September 2018 with the best effect was selected for averaging and min-max normalization.
- The reference built-up areas data is provided by the Resource and Environment Data Cloud Platform (http://www.resdc.cn/). It has a 100 m spatial resolution and is produced by visual interpretation and field investigation.
3. Methods
3.1. PLANUI: The POI and LST Adjusted NTL Urban Index
3.2. The Implement of PLANUI
3.3. The Evaluations of PLANUI
3.3.1. The Extraction Method
3.3.2. Accuracy Assessment
4. Results
4.1. Comparison of Spatial Distributions
4.2. Extraction Results
4.2.1. Comparison between Extraction Results and the Reference
4.2.2. Accuracy Assessment
5. Discussion
5.1. Advantages of PLANUI
5.2. Difference for the Indexes Based on Luojia-1 and NPP/VIIRS
5.3. Applications of PLANUI
5.4. Uncertainties and Prospects
6. Conclusions
- (1)
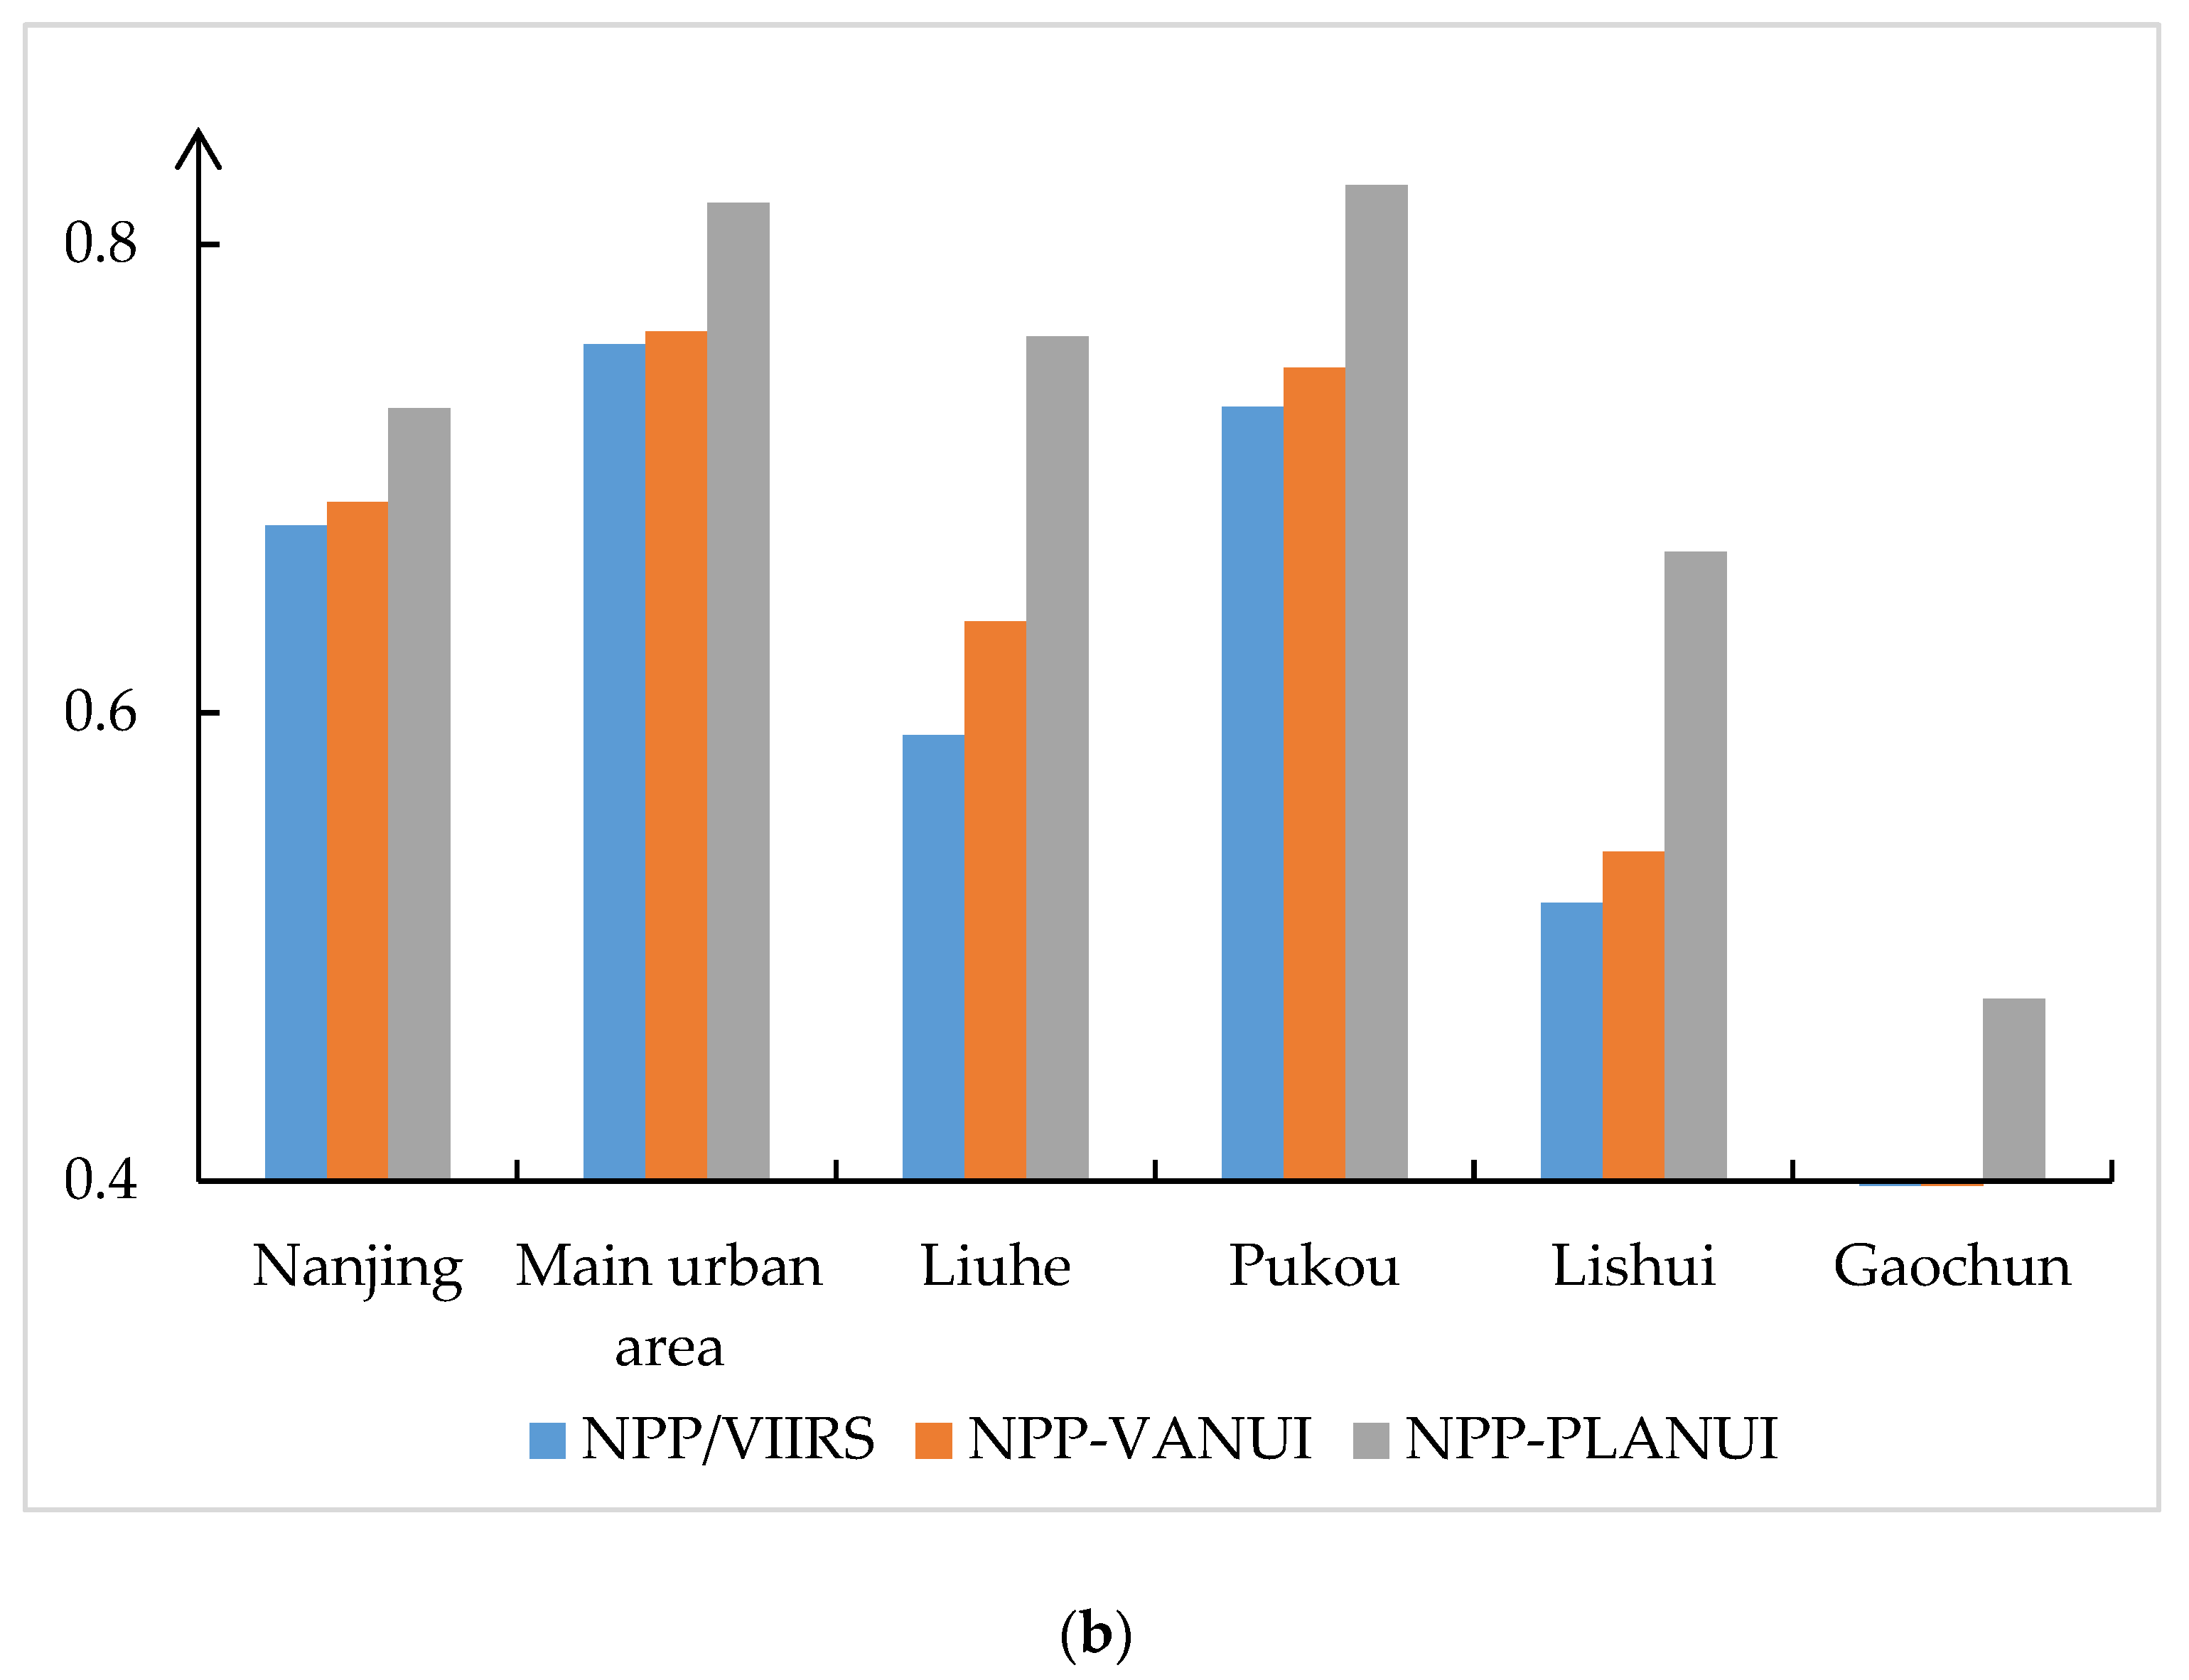
- Compared with the VANUI index, the PLANUI can make the extraction results closer to the reference data in overall shape and detail information, and can significantly improve the accuracy of the urban built-up areas extracted.
- (2)
- The PLANUI has extensive applicability, both for regions with varying degrees of economic development and NTL data with different resolutions. In the main urban area, PLANUI can increase the boundary and internal details while ensuring high accuracy. In the non-main urban area, PLANUI can increase the extraction accuracy by adding missing urban built-up areas. LJ-PLANUI can fill the holes inside the urban built-up areas and reduce falsely extracted parts. NPP-PLANUI can significantly reduce the overflow effect to solve the problem of border expansion and can also make up the lack of urban built-up area information.
- (3)
- Due to the fact that Luojia 1-01 images have a higher spatial resolution than the NPP/VIIRS images, LJ-PLANUI is better than NPP-PLANUI in showing the details of the interior and boundary of the urban built-up areas and performs better than NPP-PLANUI in the areas with poor economic development.
- (4)
- LJ-PLANUI has achieved more significant accuracy improvement than NPP-PLANUI, which shows that PLANUI is suitable for high-resolution NTL data. In the future, PLANUI can be utilized with more high-resolution night light data to conduct built-up area extraction research, so it has a broad application prospect. Moreover, PLANUI can provide an effective approach for research on urban built-up area extraction and contribute to the research investigating urban expansion, urban planning, and urban pattern governance.
Author Contributions
Funding
Conflicts of Interest
References
- Elvidge, C.D.; Baugh, K.E.; Dietz, J.B.; Bland, T.; Sutton, P.C.; Kroehl, H.W. Radiance calibration of DMSP-OLS low-light imaging data of human settlements. Remote Sens. Environ. 1999, 68, 77–88. [Google Scholar] [CrossRef]
- Elvidge, C.D.; Tuttle, B.T.; Sutton, P.C.; Baugh, K.E.; Howard, A.T.; Milesi, C.; Bhaduri, B.L.; Nemani, R. Global distribution and density of constructed impervious surfaces. Sensors 2007, 7, 1962–1979. [Google Scholar] [CrossRef]
- Xu, T.T.; Coco, G.; Gao, J. Extraction of urban built-up areas from nighttime lights using artificial neural network. Geocarto Int. 2019, 34, 1–18. [Google Scholar] [CrossRef]
- Toshiaki, I. Restoring urbanization process in china in the 1990s by using non-radiance calibrated DMSP/OLS nighttime light imagery and statistical data. Chin. Sci. Bull. 2006, 13, 88–94. [Google Scholar]
- Ma, T.; Zhou, C.H.; Pei, T.; Haynie, S.; Fan, J. Quantitative estimation of urbanization dynamics using time series of DMSP/OLS nighttime light data: A Comparative Case Study from China’s Cities. Remote Sens. Environ. 2012, 124, 99–107. [Google Scholar] [CrossRef]
- Shi, K.F.; Huang, C.; Yu, B.L.; Yin, B.; Huang, Y.X.; Wu, J.P. Evaluation of NPP-VIIRS night-time light composite data for extracting built-up urban areas. Remote Sens. Lett. 2014, 5, 358–366. [Google Scholar] [CrossRef]
- Shi, K.F.; Yu, B.L.; Huang, Y.X.; Hu, Y.J.; Yin, B.; Chen, Z.Q.; Chen, L.J.; Wu, J.P. Evaluating the ability of NPP-VIIRS nighttime light data to estimate the gross domestic product and the electric power consumption of China at multiple scales: A comparison with DMSP-OLS data. Remote Sens. 2014, 6, 1705–1724. [Google Scholar] [CrossRef]
- Shi, K.F.; Chen, Y.; Yu, B.L.; Xu, T.B.; Chen, Z.Q.; Liu, R.; Li, L.Y.; Wu, J.P. Modeling spatiotemporal CO2 (carbon dioxide) emission dynamics in China from DMSP-OLS nighttime stable light data using panel data analysis. Appl. Energy 2016, 168, 523–533. [Google Scholar] [CrossRef]
- Sutton, P.C. A scale-adjusted measure of ‘Urban sprawl’ using nighttime satellite imagery. Remote Sens. Environ. 2003, 86, 353–369. [Google Scholar] [CrossRef]
- Small, C.; Pozzi, F.; Elvidge, C.D. Spatial analysis of global urban extent from DMSP/OLS nighttime lights. Remote Sens. Environ. 2005, 96, 277–291. [Google Scholar] [CrossRef]
- Jing, W.L.; Yang, Y.P.; Yue, X.F.; Zhao, X. Mapping urban areas with integration of DMSP/OLS nighttime light and MODIS data using machine learning techniques. Remote Sens. 2015, 7, 12419–12439. [Google Scholar] [CrossRef]
- Goldblatt, R.; Stuhlmacher, M.F.; Tellman, B.; Clinton, N.; Hanson, G.; Georgescu, M.; Wang, C.Y.; Serrano-Candela, F.; Khandelwal, A.K.; Cheng, W.; et al. Using Landsat and nighttime lights for supervised pixel-based image classifification of urban land cover. Remote Sens. Environ. 2018, 205, 253–275. [Google Scholar] [CrossRef]
- Cao, X.; Chen, J.; Imura, H.; Higashi, O. A SVM-based method to extract urban areas from DMSP-OLS and SPOT VGT data. Remote Sens. Environ. 2009, 113, 2205–2209. [Google Scholar] [CrossRef]
- Hao, R.F.; Yu, D.Y.; Sun, Y.; Cao, Q.; Liu, Y.; Liu, Y.P. Integrating multiple source data to enhance variation and weaken the blooming effect of DMSP-OLS light. Remote Sens. 2015, 7, 1422–1440. [Google Scholar] [CrossRef]
- Lu, D.S.; Tian, H.Q.; Zhou, G.M.; Ge, H.L. Regional mapping of human settlements in southeastern China with multi-sensor remotely sensed data. Remote Sens. Environ. 2008, 112, 3668–3679. [Google Scholar] [CrossRef]
- Zhang, Q.L.; Schaaf, C.; Seto, K.C. The Vegetation Adjusted NTL Urban Index: A new approach to reduce saturation and increase variation in nighttime luminosity. Remote Sens. Environ. 2013, 129, 32–41. [Google Scholar] [CrossRef]
- Zhuo, L.; Zhang, X.F.; Zheng, J.; Tao, H.Y.; Guo, Y.B. An EVI-based method to reduce saturation of DMSP/OLS nighttime light data. Acta Geogr. Sin. 2015, 70, 157–168. [Google Scholar]
- Xu, Z.N.; Gao, X.L. A novel method for identifying the boundary of urban build-up areas with POI data. Acta Geogr. Sin. 2016, 71, 928–939. [Google Scholar]
- Zhao, W.F.; Li, Q.Q.; Li, B.J. Extracting hierarchical landmarks form urban POI data. J. Remote Sens. 2011, 15, 973–988. [Google Scholar]
- Yu, B.C.; Liu, Y.X.; Chen, G. Urban spatial structure of port city in south china sea based on spatial coupling between nighttime light data and POI. J. Geo-Inf. Sci. 2018, 20, 854–861. [Google Scholar]
- Pan, S.D. Spatial coupling between housing development and economic growth based on nighttime light remote sensing and residential POI. J. Geo-Inf. Sci. 2017, 19, 646–652. [Google Scholar]
- Weng, Q.H. Fractal analysis of satellite-detected urban heat island effect. Photogramm. Eng. Remote Sens. 2003, 69, 555–566. [Google Scholar] [CrossRef]
- Weng, Q.H.; Lu, D.S.; Schubring, J. Estimation of land surface temperature–vegetation abundance relationship for urban heat island studies. Remote Sens. Environ. 2004, 89, 467–483. [Google Scholar] [CrossRef]
- He, C.Y.; Liu, Z.F.; Gou, S.Y.; Zhang, Q.F.; Zhang, J.S.; Xu, L.L. Detecting global urban expansion over the last three decades using a fully convolutional network. Environ. Res. Lett. 2019, 14, 034008. [Google Scholar] [CrossRef]
- Zhang, X.Y.; Li, P.J. A temperature and vegetation adjusted NTL urban index for urban area mapping and analysis. ISPRS J. Photogramm. Remote Sens. 2018, 135, 93–111. [Google Scholar] [CrossRef]
- Ou, J.P.; Liu, X.P.; Liu, P.H.; Liu, X.J. Evaluation of Luojia 1-01 nighttime light imagery for impervious surface detection: A comparison with NPP-VIIRS nighttime light data. Int. J. Appl. Earth Obs. Geoinf. 2019, 81, 1–12. [Google Scholar] [CrossRef]
- Li, X.; Zhao, L.X.; Li, D.R.; Xu, H.M. Mapping urban extent using Luojia 1-01 nighttime light imagery. Sensors 2018, 18, 3665. [Google Scholar] [CrossRef]
- Jiang, W.; He, G.J.; Long, T.F.; Guo, H.X.; Yin, R.Y.; Leng, W.C.; Liu, H.C.; Liu, G.Z. Potentiality of using Luojia 1-01 nighttime light imagery to investigate artificial light pollution. Sensors 2018, 18, 2900. [Google Scholar] [CrossRef]
- Wan, Z.M. New refinements and validation of the collection-6 MODIS land-surface temperature/emissivity product. Remote Sens. Environ. 2014, 140, 36–45. [Google Scholar] [CrossRef]
- Huang, X.M.; Schneider, A.; Friedl, M.A. Mapping sub-pixel urban expansion in China using MODIS and DMSP/OLS nighttime lights. Remote Sens. Environ. 2016, 175, 92–108. [Google Scholar] [CrossRef]
- Zheng, H.H.; Gui, Z.F.; Li, F.; Wu, H.Y.; Wu, X.F.; Zhang, J.Y.; Han, W.J. Urban build-up area extraction method based on nighttime light images and point of interest data. Geogr. Geo-Inf. Sci. 2019, 35, 31–38. [Google Scholar]
- Yang, J.; Zhu, J.; Sun, Y.Z.; Zhao, J.H. Delimitating Urban Commercial Central Districts by Combining Kernel Density Estimation and Road Intersections: A Case Study in Nanjing City, China. ISPRS Int. J. Geo-Inf. 2019, 8, 93. [Google Scholar] [CrossRef]
- Yu, W.H.; Ai, T.H. The visualization and analysis of POI features under network space supported by kernel density estimation. Acta Geod. Cartogr. Sin. 2015, 44, 82–90. [Google Scholar]
- Heidenreich, N.B.; Schindler, A.; Sperlich, S. Bandwidth selection for kernel density estimation: A review of fully automatic selectors. AStA-Adv. Stat. Anal. 2013, 97, 403–433. [Google Scholar] [CrossRef]
- Zou, Y.H.; Peng, H.Q.; Liu, G.; Yang, K.D.; Xie, Y.H.; Weng, Q.H. Monitoring urban clusters expansion in the middle reaches of the Yangtze River, China, using time-series nighttime light images. Remote Sens. 2017, 9, 1007. [Google Scholar] [CrossRef]
- Xie, Y.H.; Weng, Q.H. Updating urban extents with nighttime light imagery by using an object-based thresholding method. Remote Sens. Environ. 2016, 187, 1–13. [Google Scholar] [CrossRef]
- Shu, S.; Yu, B.L.; Wu, J.P.; Liu, H.X. Methods for deriving urban built-up area using nighttime light data: Assessment and application. Remote Sens. Technol. Appl. 2011, 26, 169–176. [Google Scholar]
- Milesi, C.; Elvidge, C.D.; Nemani, R.R.; Running, S.W. Assessing the environmental impacts of human settlements using satellite data. Manag. Environ. Qual. Int. J. 2003, 14, 99–107. [Google Scholar] [CrossRef]
- Henderson, M.; Yeh, E.T.; Gong, P.; Elvidge, C.; Baugh, K. Validation of urban boundaries derived from global night-time satellite imagery. Int. J. Remote Sens. 2003, 24, 595–609. [Google Scholar] [CrossRef]
- Lüscher, P.; Weibel, R. Exploiting empirical knowledge for automatic delineation of city centres from large-scale topographic databases. Comput. Environ. Urban Syst. 2013, 37, 18–34. [Google Scholar] [CrossRef]
- Lafortezza, R.; Sanesi, G. Nature-based solutions: Settling the issue of sustainable urbanization. Environ. Res. 2019, 172, 394–398. [Google Scholar] [CrossRef] [PubMed]
- Deng, X.Z.; Huang, J.K.; Rozelle, S.; Zhang, J.P.; Li, Z.H. Impact of urbanization on cultivated land changes in China. Land Use Policy 2015, 45, 1–7. [Google Scholar] [CrossRef]
- Kuang, W.H.; Liu, J.Y.; Dong, J.W.; Chi, W.F.; Zhang, C. The rapid and massive urban and industrial land expansions in China between 1990 and 2010: A CLUD-based analysis of their trajectories, patterns, and drivers. Landsc. Urban Plan. 2016, 145, 21–33. [Google Scholar] [CrossRef]
- Wei, Y.H.D.; Li, H.; Yue, W.Z. Urban land expansion and regional inequality in transitional China. Landsc. Urban Plan. 2017, 163, 17–31. [Google Scholar] [CrossRef]
- Zhou, D.C.; Zhao, S.Q.; Zhang, L.X.; Liu, S.G. Remotely sensed assessment of urbanization effects on vegetation phenology in China’s 32 major cities. Remote Sens. Environ. 2016, 176, 272–281. [Google Scholar] [CrossRef]
- Yuan, M.; Song, Y.; Huang, Y.P.; Shen, H.F.; Li, T.W. Exploring the association between the built environment and remotely sensed PM2.5 concentrations in urban areas. J. Clean Prod. 2019, 220, 1014–1023. [Google Scholar] [CrossRef]
- Zheng, Z.H.; Chen, Y.B.; Wu, Z.F.; Ye, X.Y.; Guo, G.H.; Qian, Q.L. The desaturation method of DMSP/OLS nighttime light data based on vector data: Taking the rapidly urbanized china as an example. Int. J. Geogr. Inf. Sci. 2018, 33, 431–453. [Google Scholar] [CrossRef]


| Satellite | Luojia 1-01 | NPP-VIIRS |
|---|---|---|
| Spatial Resolution | 130 m | 750 m |
| Width | 250 km | 3060 km |
| Spectrum Range | 0.46–0.98 | 0.5–0.9 |
| Radiometric Resolution | 14 bits | 14 bits |
| Available Years | June 2018–present | November 2011–present |
| Study Area | Index | Luojia 1-01 | LJ- VANUI | LJ- PLANUI | NPP/VIIRS | NPP- VANUI | NPP- PLANUI |
|---|---|---|---|---|---|---|---|
| Precision | 0.73 | 0.74 | 0.81 | 0.78 | 0.79 | 0.81 | |
| Nanjing | Recall | 0.63 | 0.64 | 0.70 | 0.67 | 0.68 | 0.71 |
| F1-score | 0.68 | 0.69 | 0.75 | 0.72 | 0.73 | 0.76 | |
| Main | Precision | 0.84 | 0.84 | 0.88 | 0.82 | 0.82 | 0.87 |
| urban | Recall | 0.77 | 0.78 | 0.86 | 0.85 | 0.85 | 0.88 |
| area | F1-score | 0.80 | 0.81 | 0.87 | 0.84 | 0.84 | 0.87 |
| Precision | 0.79 | 0.79 | 0.82 | 0.74 | 0.78 | 0.80 | |
| Liuhe | Recall | 0.63 | 0.65 | 0.83 | 0.65 | 0.68 | 0.86 |
| F1-score | 0.70 | 0.71 | 0.83 | 0.69 | 0.73 | 0.83 | |
| Precision | 0.89 | 0.90 | 0.91 | 0.89 | 0.92 | 0.91 | |
| Pukou | Recall | 0.67 | 0.69 | 0.85 | 0.76 | 0.76 | 0.87 |
| F1-score | 0.76 | 0.78 | 0.88 | 0.82 | 0.83 | 0.89 | |
| Precision | 0.69 | 0.71 | 0.89 | 0.76 | 0.79 | 0.89 | |
| Lishui | Recall | 0.52 | 0.53 | 0.63 | 0.46 | 0.48 | 0.59 |
| F1-score | 0.60 | 0.61 | 0.74 | 0.58 | 0.60 | 0.71 | |
| Precision | 0.66 | 0.64 | 0.88 | 0.62 | 0.73 | 0.88 | |
| Gaochun | Recall | 0.46 | 0.47 | 0.51 | 0.13 | 0.23 | 0.39 |
| F1-score | 0.54 | 0.54 | 0.64 | 0.22 | 0.34 | 0.55 |
© 2020 by the authors. Licensee MDPI, Basel, Switzerland. This article is an open access article distributed under the terms and conditions of the Creative Commons Attribution (CC BY) license (http://creativecommons.org/licenses/by/4.0/).
Share and Cite
Li, F.; Yan, Q.; Bian, Z.; Liu, B.; Wu, Z. A POI and LST Adjusted NTL Urban Index for Urban Built-Up Area Extraction. Sensors 2020, 20, 2918. https://doi.org/10.3390/s20102918
Li F, Yan Q, Bian Z, Liu B, Wu Z. A POI and LST Adjusted NTL Urban Index for Urban Built-Up Area Extraction. Sensors. 2020; 20(10):2918. https://doi.org/10.3390/s20102918
Chicago/Turabian StyleLi, Fei, Qingwu Yan, Zhengfu Bian, Baoli Liu, and Zhenhua Wu. 2020. "A POI and LST Adjusted NTL Urban Index for Urban Built-Up Area Extraction" Sensors 20, no. 10: 2918. https://doi.org/10.3390/s20102918
APA StyleLi, F., Yan, Q., Bian, Z., Liu, B., & Wu, Z. (2020). A POI and LST Adjusted NTL Urban Index for Urban Built-Up Area Extraction. Sensors, 20(10), 2918. https://doi.org/10.3390/s20102918


