2.1. Hand-Held Device: Hardware Design
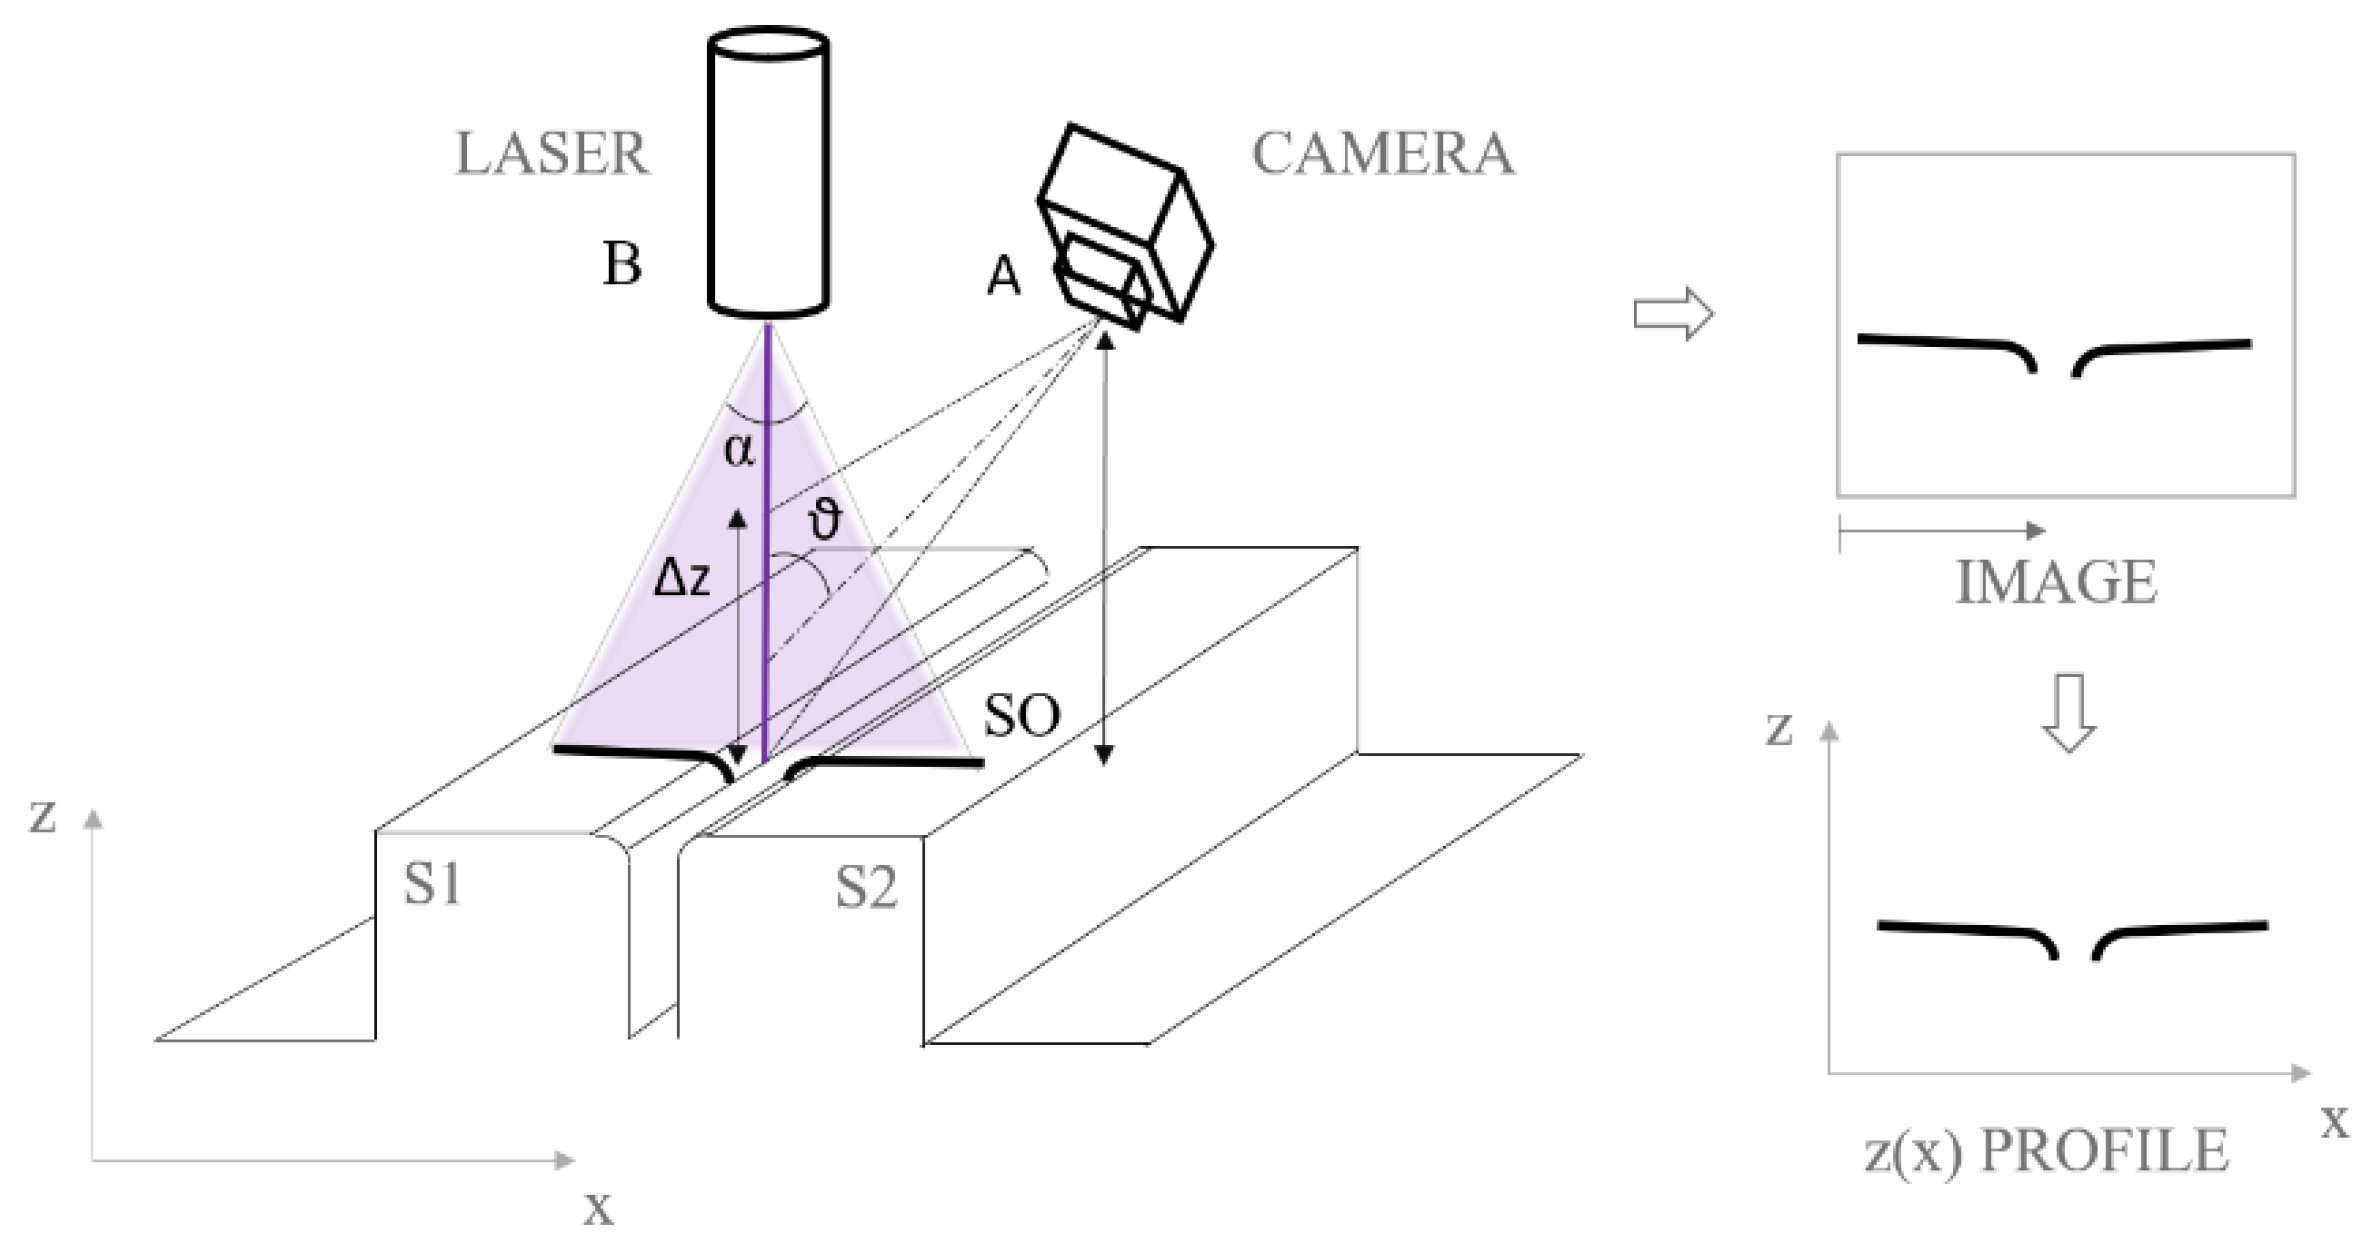
Laser line triangulation is a well-known technique: a laser line is projected onto a target surface while a camera, framing the scene from a certain angle
θ, detects light scattered by the target surface. Even if a laser scanner is capable of providing3D shape, the scope of this paper is to address gap and flush measurement, not a full 3D shape reconstruction.
Figure 3 shows the laser triangulation system, implemented with the laser axis orthogonal to the surface and an inclined camera. Once the laser profile z(x) is extracted from the raw image, gap and flush values can be calculated by dedicated processing algorithms.
Laser triangulation technology is well known; however, no commercial device today offers a series of characteristics like portability, computational power, wireless network connectivity, sensing capabilities, battery supply, a human–machine interface, and the possibility to implement smart behaviors, all integrated to a smartphone. Indeed, all the former characteristics are typical of today’s smartphones. For this reason, it has been quite straightforward to scale down the optical triangulation system to insert it into a smartphone cover.
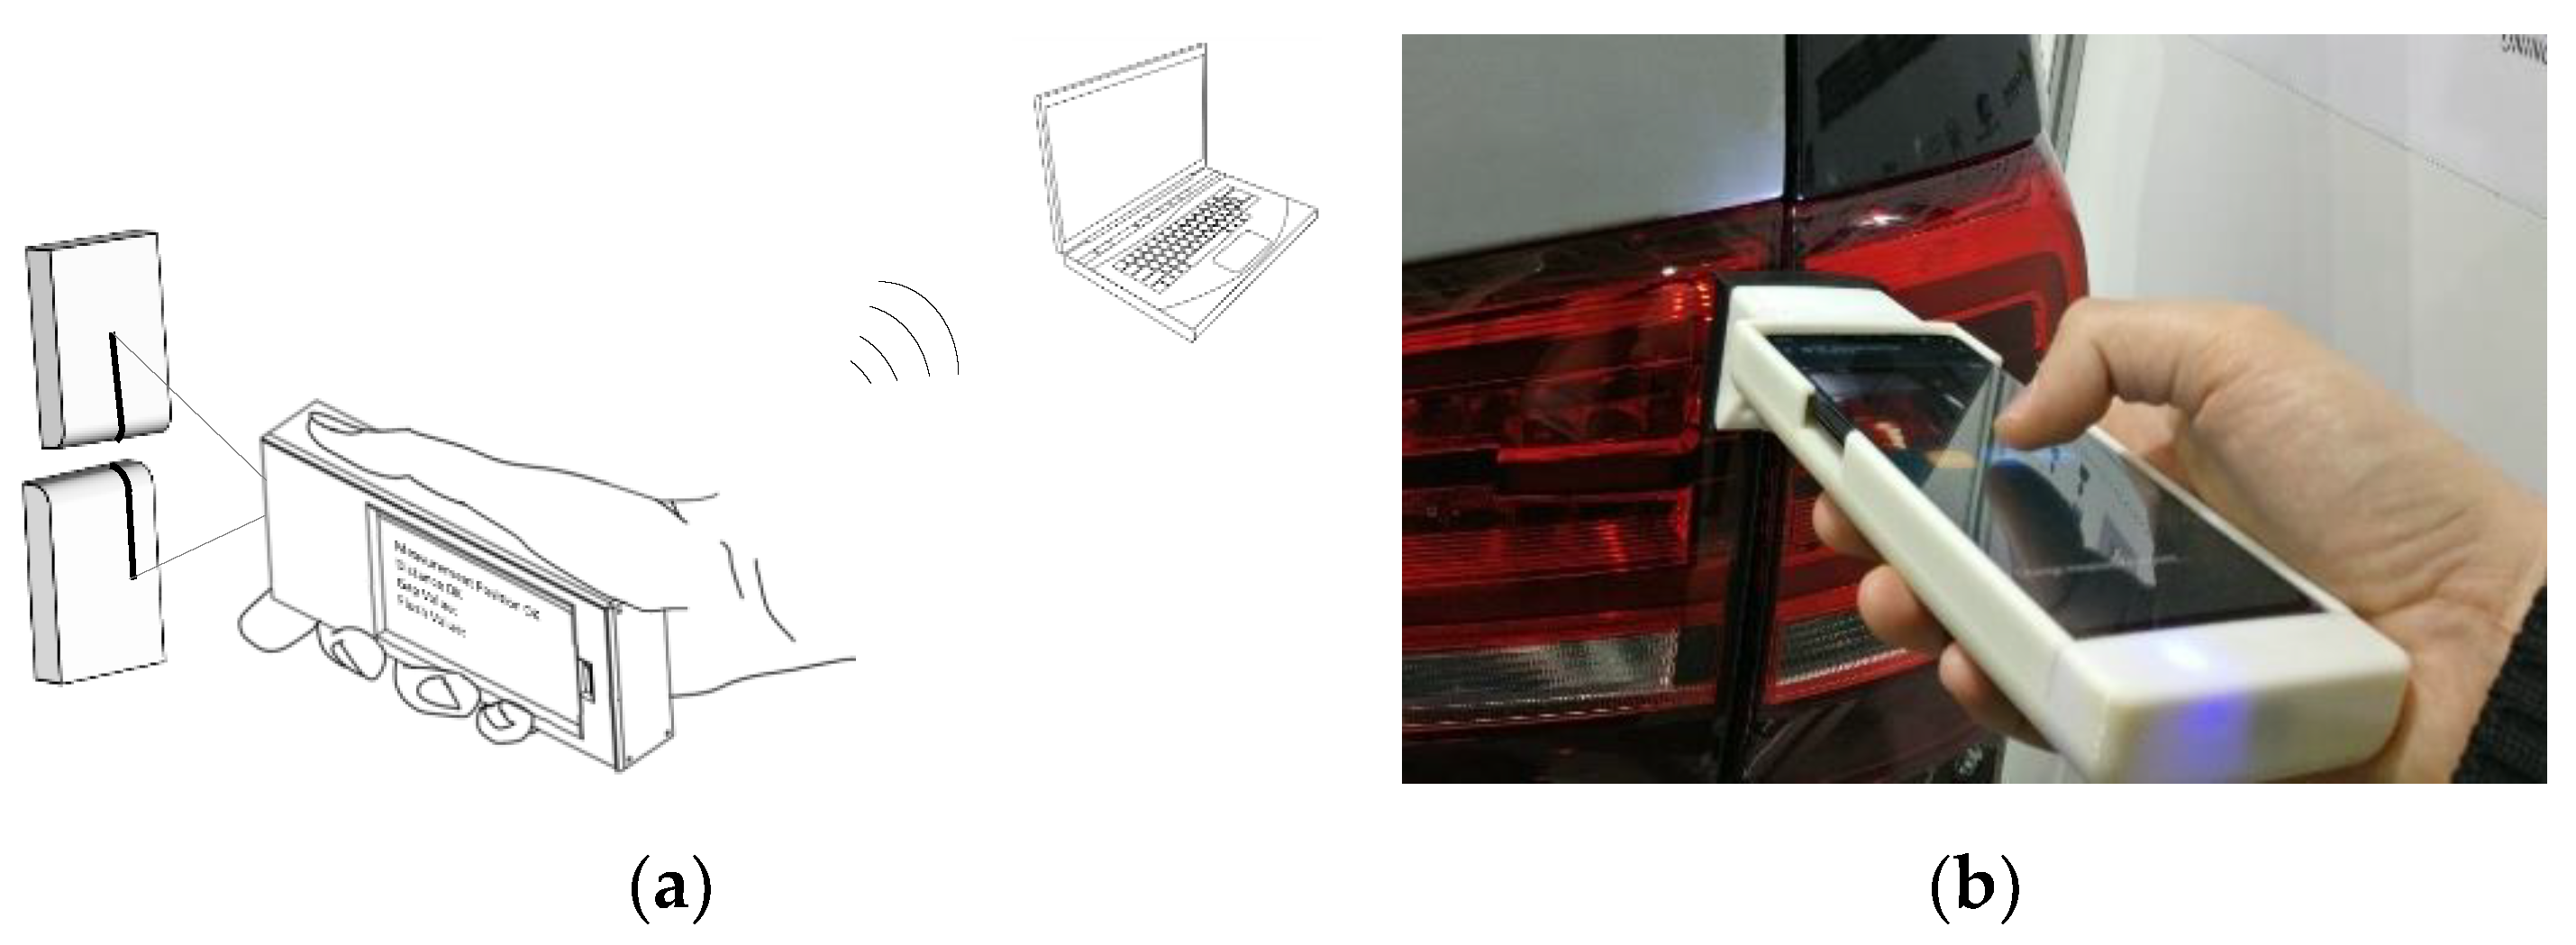
Figure 4 shows a sketch of the device in the hands of an operator (the picture is taken from the patent associated to the device [
20]) and a picture taken while measuring gap and flush on rear headlights.
The cover is realized in polylactide (PLA) by additive manufacturing; it hosts the smartphone and has a front hood hosting the laser triangulation system. A rubber seal covers the front part of the hood, which constitutes the measuring end of the device: this solution allows the system to take measurements with contact or non-contact to the target surface. Indeed, if the hood is put into contact with the target surface, the benefits are twofold: the hood prevents ambient light from spoiling the measurement, while the rubber seal prevents scratches on the surface.
With reference to the notation reported in
Figure 3, it should be highlighted that the laser line projector is mounted to have the projected line parallel to the smartphone display. This way an operator should project the laser line orthogonally to the target surface and to the gap to be measured, as described in
Figure 4. The aperture angle of the laser sheet is α = 60°. The camera (also hosted in the cover) has its optical axis forming an angle θ = 45° with respect to the laser axis. It is true that a solution with the camera inclined with respect to the laser loses sensitivity in the
z direction if compared to the reversed solution (optical axis of the camera perpendicular to the target and optical axis of the laser inclined with respect to the camera); however, this specific design choice was adopted since it gives the best performance on surfaces ranging from optical diffusive behavior (e.g., metal parts) to highly reflective ones (e.g., chromed parts). In fact, if the solution with inclined laser was adopted, the amount of light scattered to the camera sensor from highly reflective surfaces would have been too small, thus decreasing the signal-to-noise ratio on the image and therefore increasing the uncertainty on the measurement. The system is designed to operate at a stand-off distance SO = 20 mm, over a range Δz = 15 mm.
In designing the laser triangulation system, the choice of the laser wavelength is extremely relevant. The following variables have to be considered:
optical properties of the target surface (scattering, diffusivity, absorption);
characteristics of laser, wavelength and coherence;
spectral sensitivity of the camera.
For what the optical properties of target surfaces are concerned, one may find the following conditions in a car assembly process:
- (a)
rough galvanized metal sheet not painted;
- (b)
smooth, polished and painted metal sheet;
- (c)
smooth polished and painted polymeric surfaces;
- (d)
smooth transparent surfaces with different color, in glass or polymers.
The portable laser system addressed in this paper is meant to be used at the final assembly of the car doors, tailgate and lights, therefore it will operate on surfaces type (b), (c), and (d), i.e., smooth surfaces with different colors and eventually transparent surfaces. Surface roughness Ra strongly influences the angular distribution of scattered light. For smooth polished surfaces, such as those of our application, Ra is very small, in the same order of magnitude of the wavelength of visible light λ. Despite roughness being small, the range of Ra values that interests surface types (b), (c), and (d) is wide; hence, the choice of laser wavelength has to be made as a trade-off, i.e., as the wavelength ensuring overall high performance on the whole range. In making this choice, it should be recalled that when the ratio Ra/λ decreases, the surface tends to become a mirror, and scattered light is very directional.
Figure 5 shows a qualitative sketch of the angular distribution of scattered light (different wavelengths) from rough surfaces. The shorter the wavelength, the wider the scattered light diagram. In a laser triangulation system, this is detrimental because it reduces light collected by the camera lens, thus reducing image contrast. To improve diffusive light scattering, the choice of a short wavelength is therefore mandatory in order to have an optically rougher surface (higher Ra/λ ratio). From this analysis, in order to improve angular light scattering, a violet laser source is the best candidate because of its short λ.
A second aspect to be dealt with is light reflectance at different wavelength. Spectral reflection coefficient of different surfaces depends on surface colors, coating layers, and pigments.
For what concerns painted metal, different painting colors provide different reflectance values. A spectrophotometric analysis of different painted metal surfaces was performed (not reported here): white color is characterized by the flattest and largest reflectance, in the order of 80% over the whole visible spectrum, while black is characterized by the lowest reflectance, in the order of 10% over the whole visible spectrum. Given these large differences in reflectance over the whole spectrum, it is difficult to identify the optimal wavelength for a generic painted metal surface.
Concerning headlights, their spectral reflectance depends on the color of the transparent plastic layers, on the characteristics of the functional facets that are involved in redirecting the incoming light, and on technology used for their fabrication [
21]. We measured the spectral reflectance with a spectrophotometer, and it can be observed that plastic headlights present an increase in the total reflectance in the lower spectral range, i.e., the blue to violet region (
Figure 6).
The final choice on laser wavelength fell on a violet laser (λ = 405 nm); in fact, this choice satisfies requirements set by angular light scattering on smooth surfaces and improves reflectance on plastic headlights while keeping a sufficient reflectance on metal surfaces painted in different colors. Moreover, laser diodes working at this wavelength are well available on the market (low-cost), as are their conditioning optical components.
A final remark concerns the choice of the laser source is as follows: low coherence lasers are to be preferred, because the resulting speckle pattern is less evident, thus improving laser line profile. A low coherence laser has been therefore used in the device: its power is 5 mW, which allows for a good signal to be acquired by the camera. However, this means a class II laser, which poses eye safety issues for the users and people nearby. The smart strategy to assure eye safety is briefly discussed at the end of
Section 2.4.
As a consequence of the aforementioned aspects, the camera and its lens should have high sensitivity in the violet region, be compact, and provide an adequate resolution. Even if it is not mandatory in a triangulation system, the camera installed on the device discussed in this paper is an RGB camera: this choice enables the implementation of strategies for recognizing the surface color and adapting camera exposure. (discussed later in
Section 2.4). The camera used in the device is a Raspberry PiCam (Raspberry Pi Foundation, Cambridge, UK). The camera uses a low size sensor (sensor optical size: ¼’’) with relatively high pixel distribution (2592 × 1944 pixels) adjustable focus (focal length: 3.6 mm; numerical aperture F#: 2.9) together with a good spectral response in the violet region (QE of 65% at 405 nm), as shown in
Figure 7. Moreover, it is assembled on a small board (size: 25 × 24 × 9 mm;), which eases installation inside the cover of the smartphone.
2.2. Hand-Held Device: Software Design
The camera, operating at 8-bit, is driven by a Raspberry Pi Zero (Raspberry Pi Foundation, Cambridge, UK) installed in the casing. Once acquired, the RGB image is sent to the smartphone via type-C USB link. Then, image processing takes place through the computational resources of the smartphone. The smartphone communicates with the Raspberry Pi Zero exploiting the Termux environment (Android terminal emulator and Linux environment app), which is also used for running the image processing algorithms (Python) and the device’s human-machine interface (HMI).
When translating from 2D camera coordinates to 3D world coordinates, the accuracy of the estimated 3D coordinates of a point in the space is limited by the imaging system resolution. If the feature size targeted is beyond the resolution of the system, which is limited by the pixel size of the detector, algorithms which estimate features positions to subpixel accuracy are useful [
23].
The image of the laser line projected onto the target surface is processed to determine its position with subpixel accuracy. The laser line runs almost horizontal in the acquired images and has a gaussian intensity profile; its vertical position is found by processing light intensity profiles along the columns, which are close to orthogonal to the line. This is done on the blue plane of the RGB image, since it is expected to be the one exhibiting the highest SNR, given the wavelength of the laser. The Gaussian Kernel algorithm [
24], which balances performance and computational load, is exploited to extract the laser peak intensity.
Figure 8 shows the laser line acquired by the blue channel of the camera and the superimposed red dots, representing the central intensity peak of the laser line, extracted by the Gaussian Kernel algorithm; the fitting is quite remarkable both in the straight part of the laser line and in the curved part.
Data points of the left and right edges are then clustered exploiting the k-means algorithm [
25]. Results of this step are reported as red and blue lines in
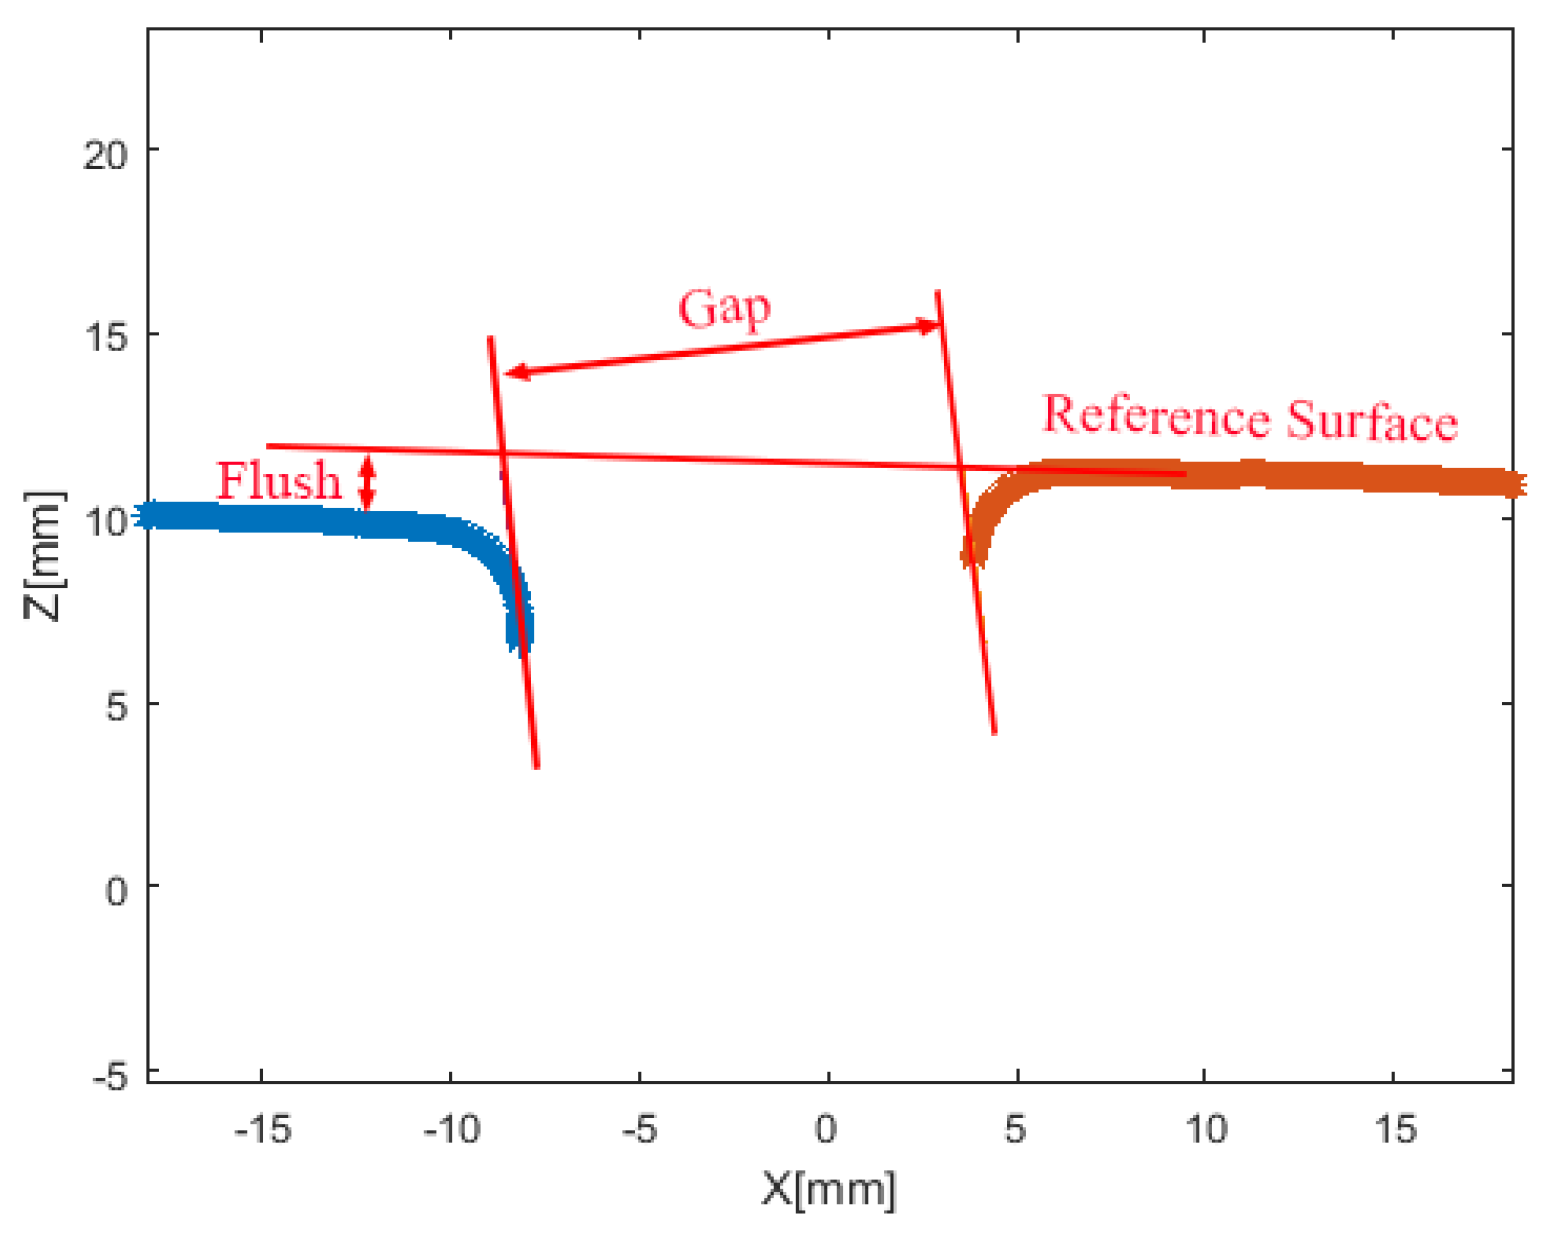
Figure 9. These point clouds are processed to extract gap and flush values.
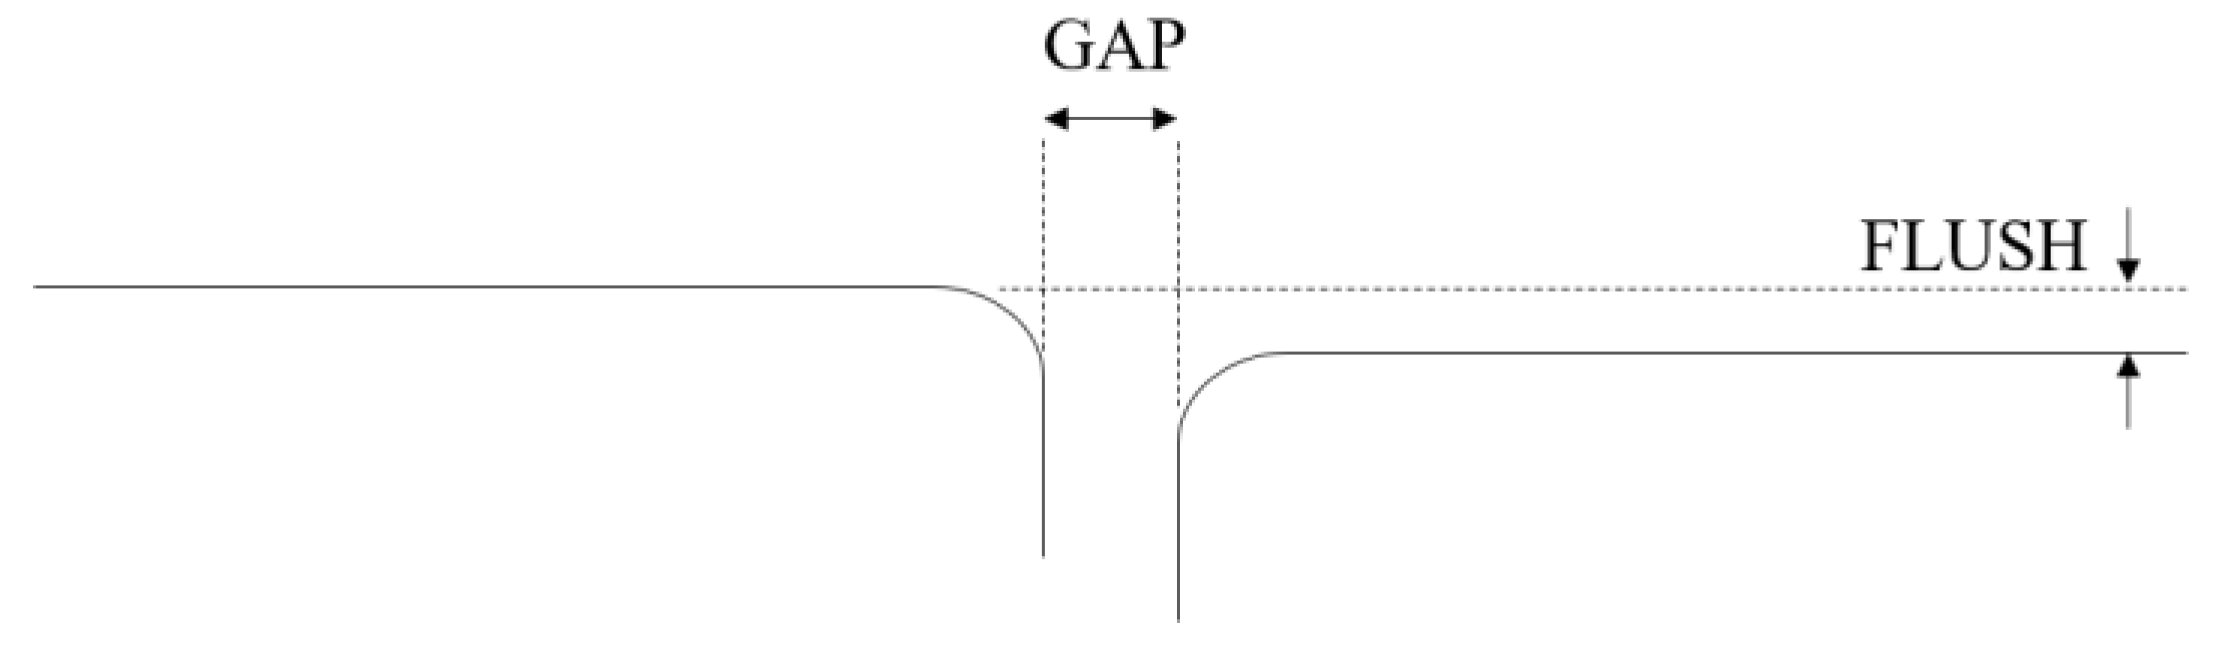
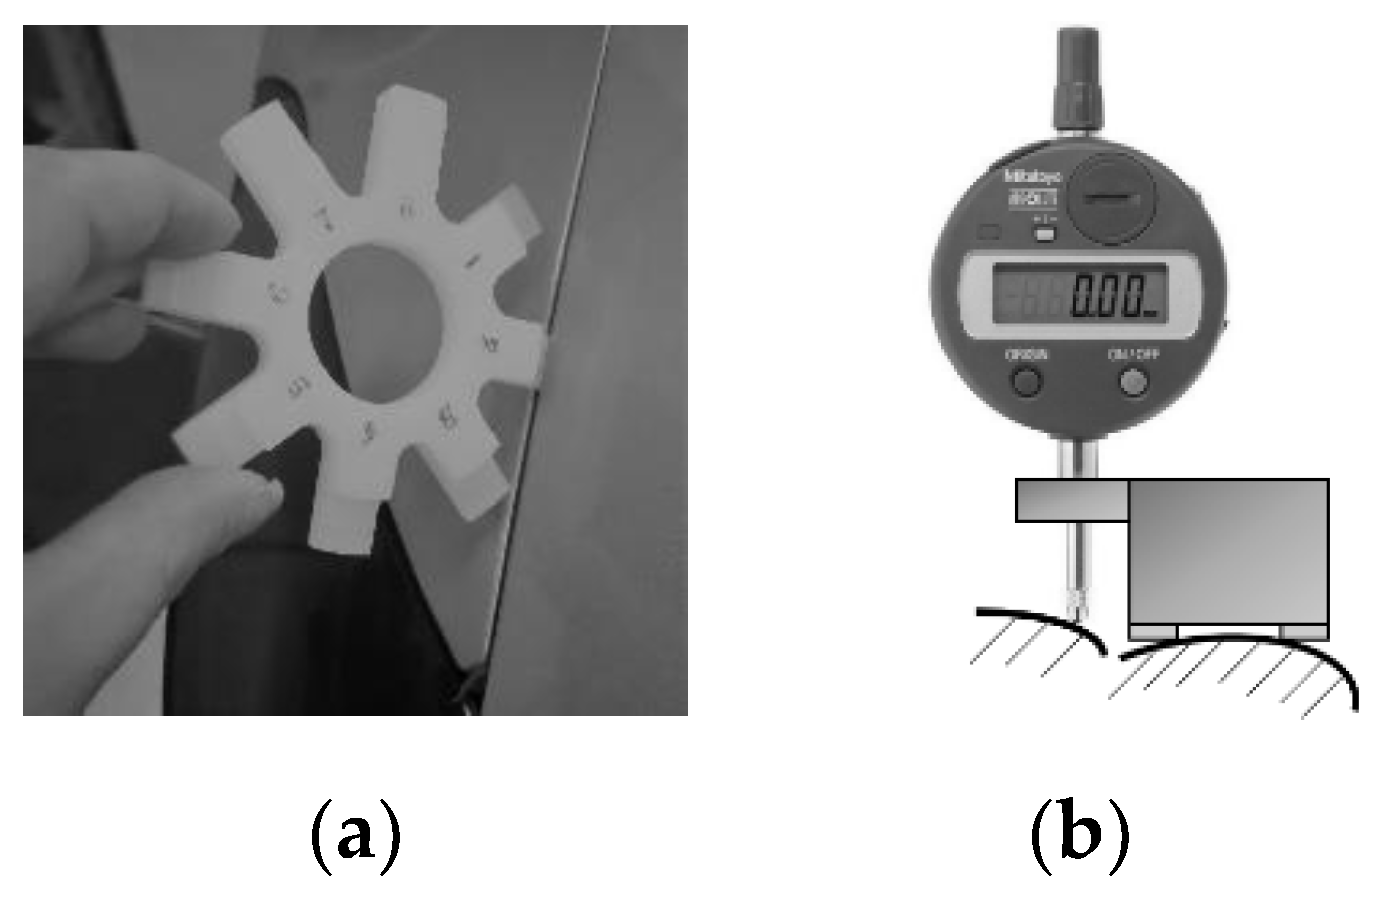
The gap and flush algorithm simulates how a manual feeler gauge and dial gauge operate. The feeler gauge is a parallelepiped solid body inserted between the parts; its thickness is the measured gap. The dial gauge measures the flush as the distance of the tangent to one of the parts from the other part.
Figure 9 describes the corresponding geometry, where the blue and red points are the result of the laser line profile extraction performed by the algorithm presented above. This choice in the evaluation of the gap was made to avoid the use of additional assumptions, e.g., bead radii, and to make it robust to geometrical changes on the profiles. The following steps are considered for extracting gap values:
Identification of the facing edges of the two clustered point clouds;
Identification of the two parallel lines tangent to both facing edges;
Calculation of the distance between the lines identified at the previous step;
For the flush determination the algorithm is based on the following steps:
- (a)
Identification of a reference cluster among the two clustered point clouds (the reference coincides with a reference surface on the car, e.g., the frame when measuring gap and flush at the tailgate)
- (b)
Identification of the straightest line fitting the reference point cloud;
- (c)
Calculation of the distance between the line identified at the previous step and the other point cloud;
- (d)
Recognition of the point cloud extremes;
- (e)
Fitting the “reference” cloud with a straight line;
- (f)
Determination of the angle corresponding to the maximum distance between the reference line and the other point cloud.
With respect to classical circle fit algorithms adopted in gap and flush extraction, the algorithm adopted shows higher robustness to noisy data and lack of data points on the groove.
2.3. System Calibration
Moving from pixel to real-world coordinates requires a calibration of the device. With respect to model-based approaches [
26], a direct calibration [
27] was considered. A direct calibration in a triangulation device consists in mapping the target distance z and the lateral position x to sensor coordinates (
i,j). This can be done by traversing along the z direction a target made of parallel stripes orthogonal to the x direction. The calibration target is realized by a flat panel with equally spaced black and white parallel stripes. Stripes have been obtained by printing on a paper sheet on a flat rigid support at 1200 dpi. The uncertainty of the calibration target therefore is 0.02 mm for gap values in x and y direction. The uncertainty in z direction, corresponding to flush measurement, is 0.01 mm, limited by the micrometric traversing stage adopted.
During calibration, the smartphone is fixed on a support so that the laser line projects orthogonal to the target surface; alignment uncertainty is below 0.5°.
The calibration we performed maps real world x and z coordinates into pixel coordinates and uses a fitting second order polynomial model as the calibration model. This approach inherently accounts for all components of uncertainty, optical distortion, triangulation geometry, camera parameters.
The target is scanned over the z-range (or depth of field) of the device by a micrometric stage and for each z-position an image is acquired. Data obtained can be plotted as point clouds
x(
i,
j) and
z(
i,
j),
i,j representing pixels, and then fitted with two polynomial surfaces
Hx(
i,
j) and
Hz(
i,
j), which will represent the calibration functions.
Figure 10 reports the data clouds
x(
i,
j) and
z(
i,
j) acquired in the calibration process. superimposed to the polynomial fitting functions. The calibration uncertainty is then computed by estimating the standard deviation of the residuals of the experimental data with respect to the fitting function. The standard deviation of the residuals turns out to be 0.15 mm and 0.12 mm respectively for
x and
z surfaces. Then, the expanded uncertainty of calibration is
Ux = 0.30 mm in
x direction (gap) and
Uz = 0.24 mm in
z direction (flush) (coverage factor
k = 2 and confidence level 95%) [
19]. This is the calibration uncertainty of the device; in operating conditions uncertainty can increase, especially due to surface characteristics and to operator handling the device.
2.4. Smart Behaviors
As a hand-held device targeting HITL tasks, the device needs to ease interaction with the operator as well as ensuring that measurement performed by the operator can be trust (e.g., if the operator is asked to measure on a certain point—tailgate to body frame—the device should check whether she/he is measuring there and not somewhere else—e.g., headlights). Indeed, this is fully in line with the “Operator 4.0” vision addressed by Romero et al. [
28]. A continuous interaction loop has been implemented: the device checks operator decisions by comparing them with its own strategies. If and only if results of these checks comply with pre-set acceptable strategies is measurement then allowed by the device.
The measurement procedure involves the operator at different levels, as shown in
Figure 11. The operator interacts with the device through the touch screen of the smartphone, where a graphic interface (HMI) is displayed. At the beginning of the inspection, the operator is asked to select the measurement point and to point the device towards the measurement he/she selected. Then, to check operator decision and avoid him/her measuring in different points from the selection, a color picture of the part is automatically taken by the device, with the laser source switched off, and algorithms for recognizing and classifying the framed part are run. If the result of this classification states that the measurement point selected by the operator is really the one he/she pointed the device at, then the procedure can go on; otherwise, the operator is asked to check the right position of the device. This cross-check has a twofold implication: on the one hand, it makes it possible to reduce the assignation of gap and flush values to wrong measurement points, and on the other hand, it makes it possible to optimize the measurement conditions (i.e., optimize the exposure time of the camera with respect to materials/colors characterizing the part under inspection) to guarantee the largest possible contrast of the laser line image and, hence, a lower uncertainty on result of the measurement.
Indeed, since different materials/colors of the same car have different optical scattering characteristics at the same laser wavelength illumination, it is important to optimize the camera exposure time to guarantee the best image result. To perform this operation in an automated way it is fundamental to somehow recognize the measurement point on which the measurement is taking place. Indeed, once the measurement point is recognized, a recall of materials/colors characterizing that measurement point can be performed from a pre-set database and the best camera exposure time for that combination of materials/colors can be set.
The recognition of the measurement position is performed on the device by running a Convolutional Neural Network (CNN) named Alexnet [
29]. This is a pre-trained CNN that takes the color image of the part (with laser source switched off) under inspection as input and classifies the image according to the classes defined during the learning phase (metal, plastic, glass, different color). Each class embeds an optimized exposure time determined during dedicated in-line experiments on different cars. Therefore, once a label is assigned to the part under inspection (classification result), the camera exposure time can be set accordingly, thus ensuring the best result in terms of image quality, laser line profile extraction, and gap and flush measurement.
Figure 12 reports some results from a set of 62 images of different parts of the same car’s samples. The CNN dataset has been populated with 650 images of the same parts, with 30% of the images used for training and the remaining 70% for data validation. As can be seen, the CNN correctly classifies 75% of the images. The CNN fails in classifying the image received in the 13% of the whole population. Left to right inversion (LT/RT) represents the main source of classification error. This is quite straightforward, since the CNN is invariant to image scaling and rotation.
Given the few images that were used for training the network, these results are quite remarkable. Some misclassifications are still present. However, it is expected that, once the device runs continuously in the production line and more images are available, the behavior of the CNN becomes more and more stable, thus providing more accurate classification results.
Another smart behavior implemented in this hand-held triangulation system is to assure it is used within the calibration range of the device. For this purpose, an infrared time-of-flight distance sensor, mounted in the same enclosure hosting the laser triangulation, was embedded in the device with a twofold purpose—to enable the measurement to be consistent with the calibration range of the device and ensure the operator eye safety. In fact, the laser is switched on only if the measurement point is recognized as valid and the target-to-sensor distance is within the measuring range.
If and only if the results of these checks comply with operator decisions then the permission to start measurement is provided and a feedback to the operator when the measurement is done is given.

 ,
, 