Counting of Hong-Ou-Mandel Bunched Optical Photons Using a Fast Pixel Camera

 , and
, and 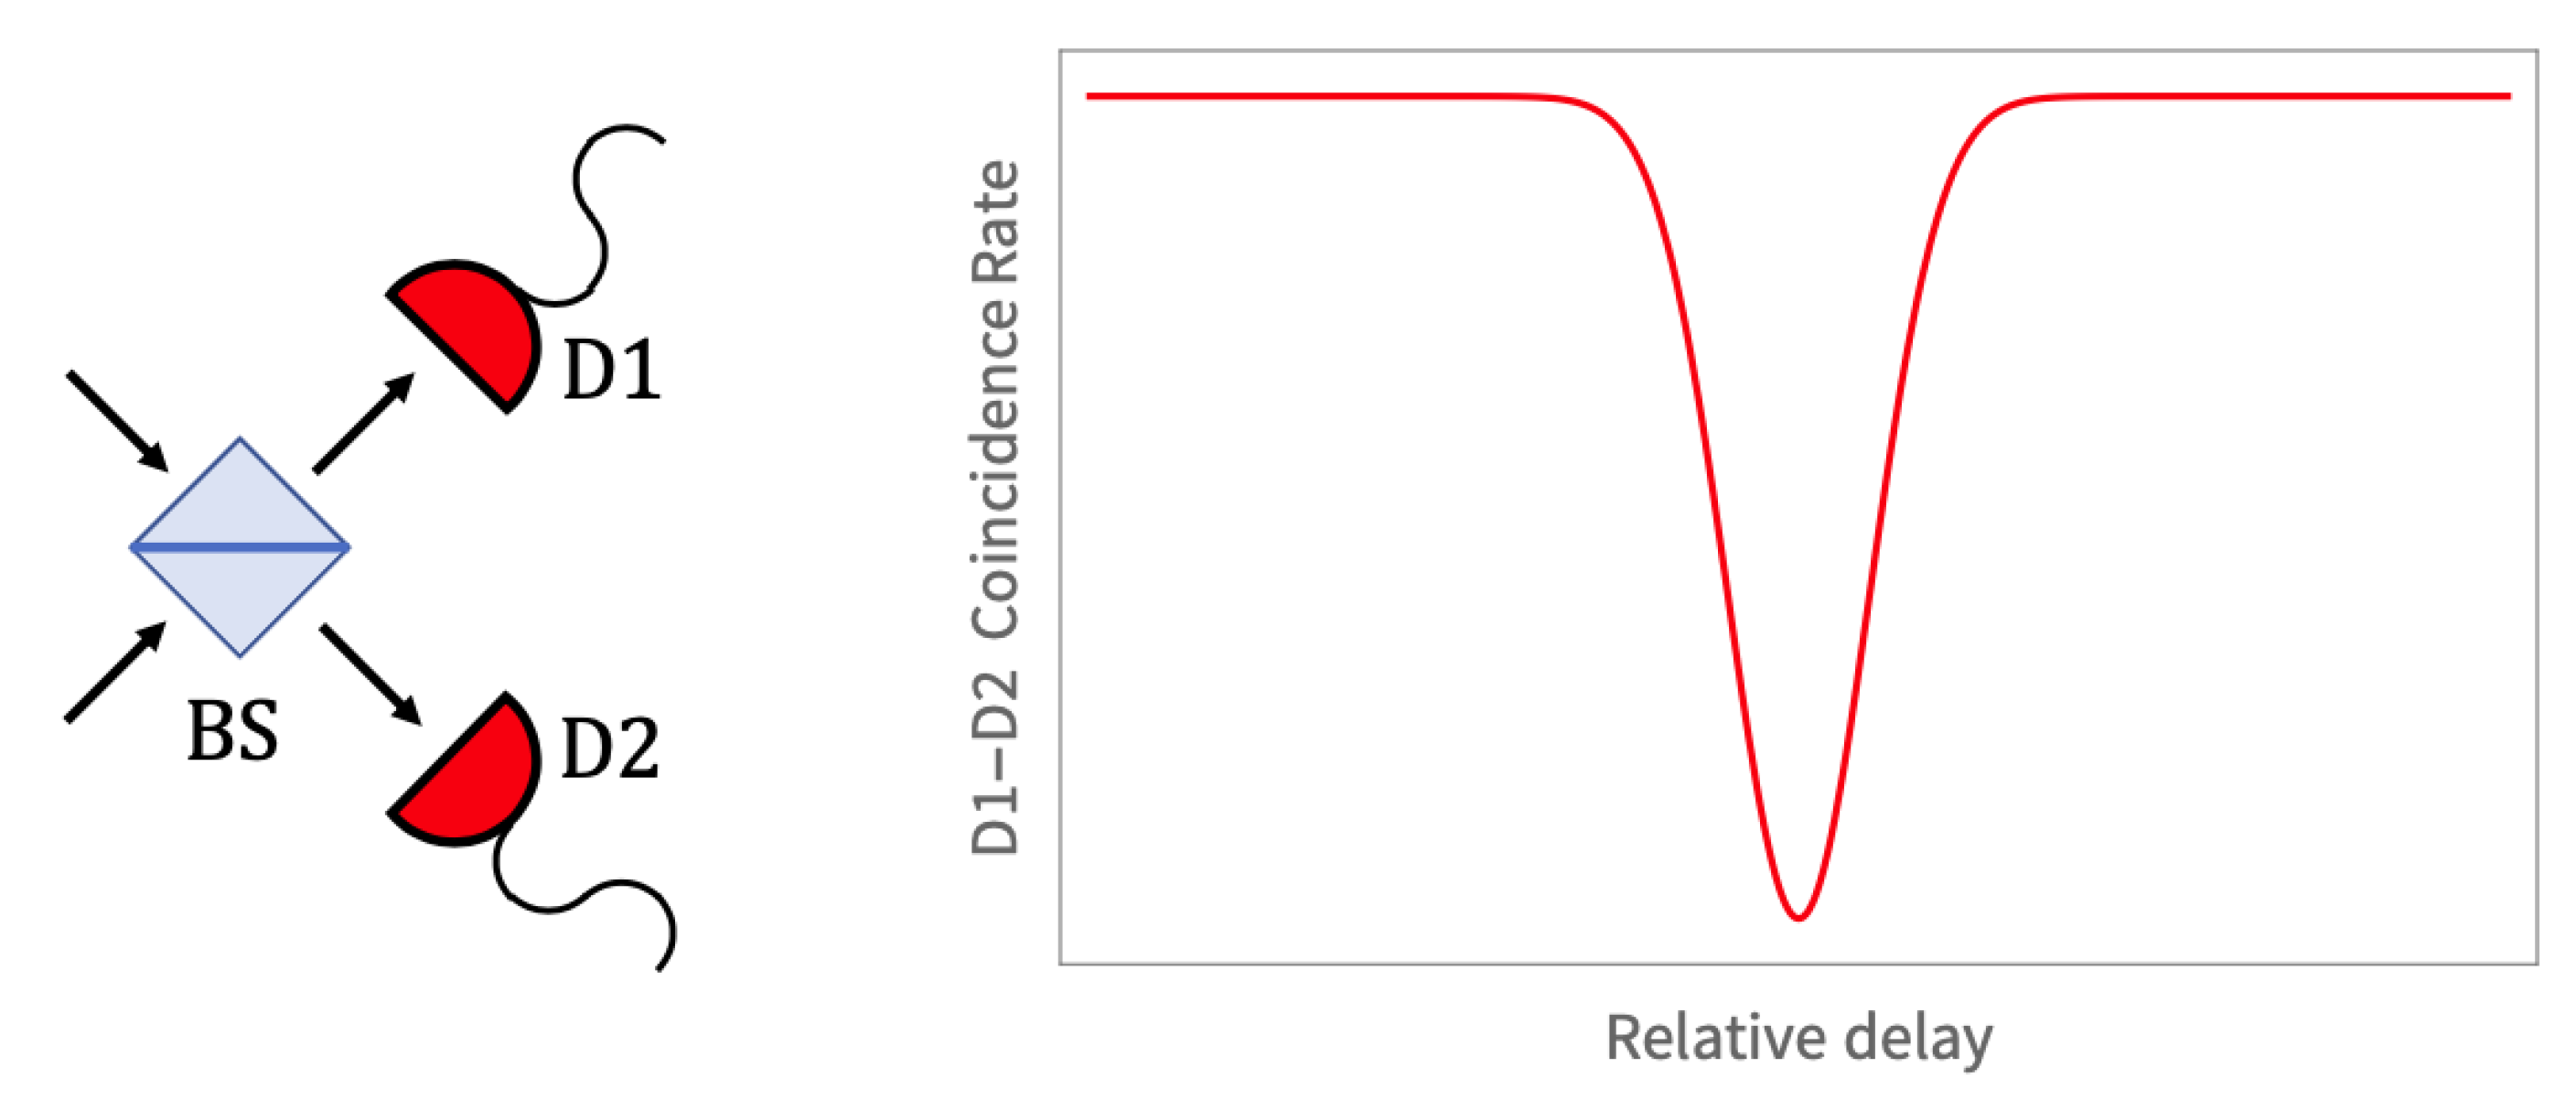
Abstract
1. Introduction
2. Single-Photon Counting Detectors
3. Counting of Bunched Single Photons in a Fast Camera
Tpx3Cam Fast Camera
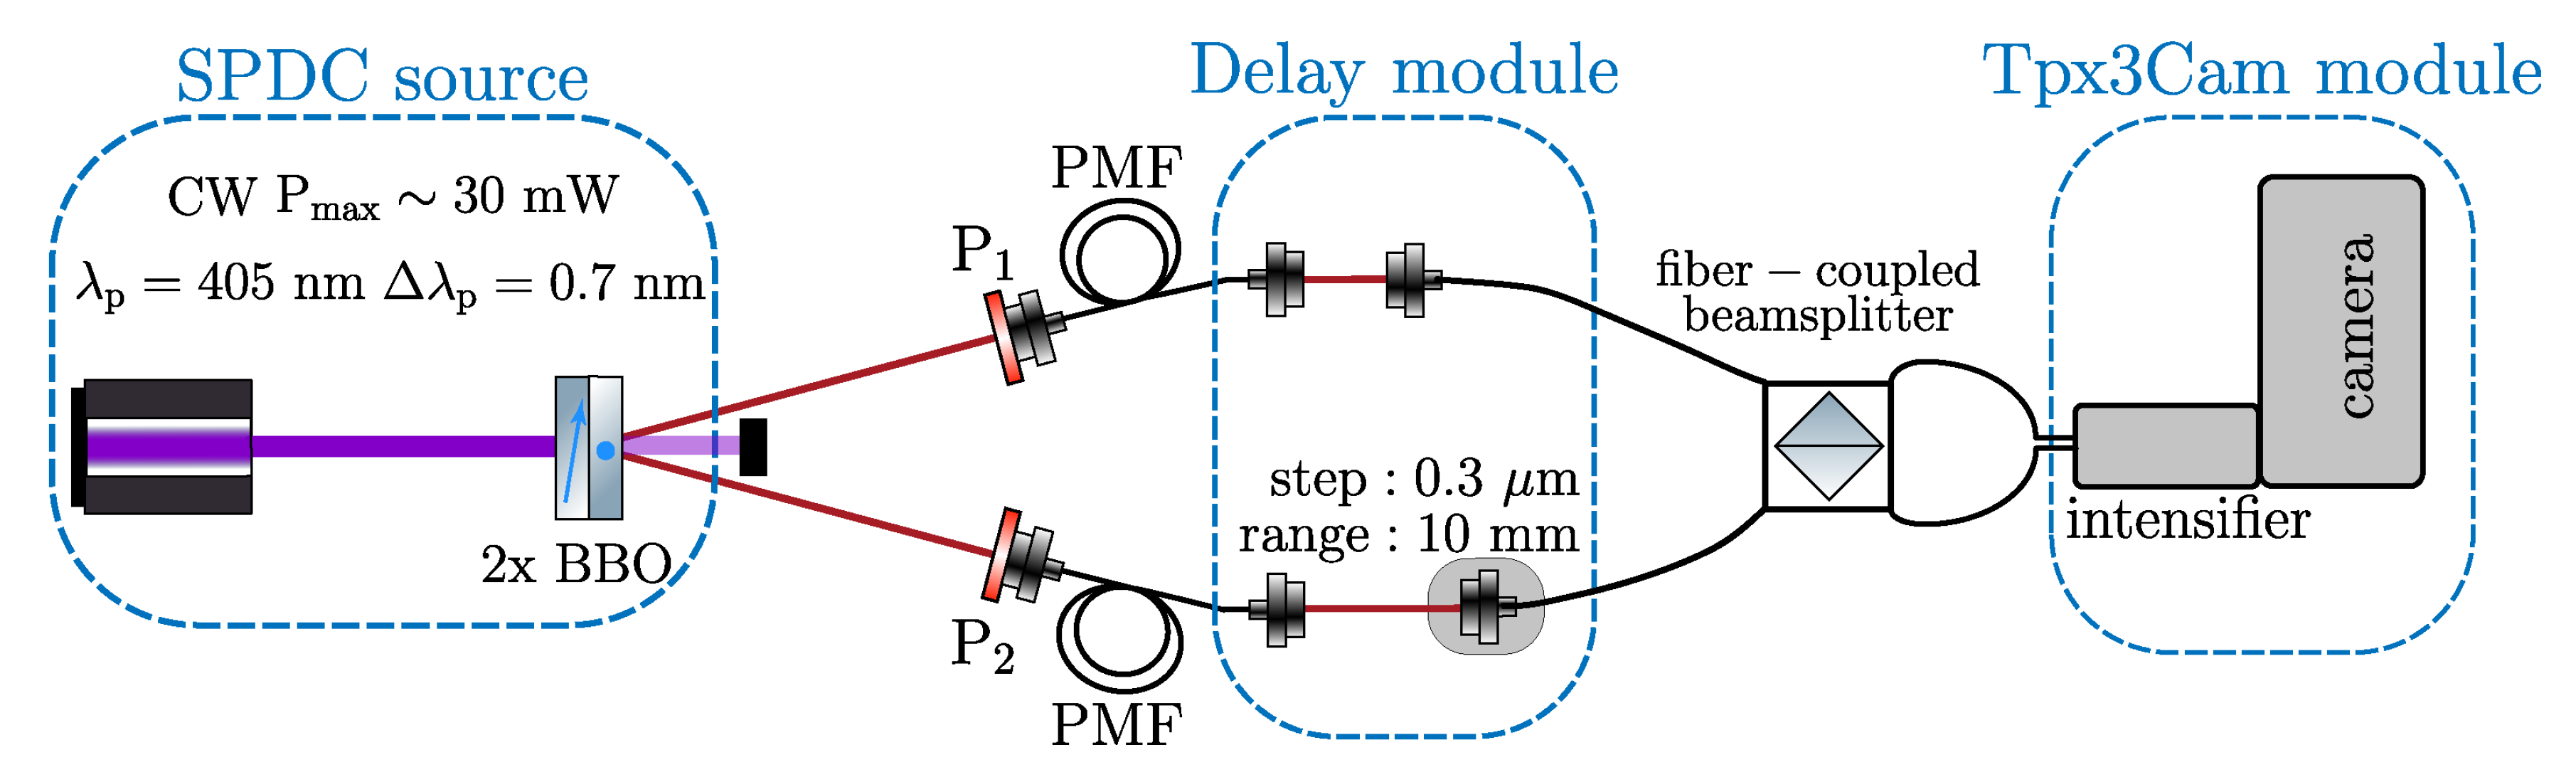
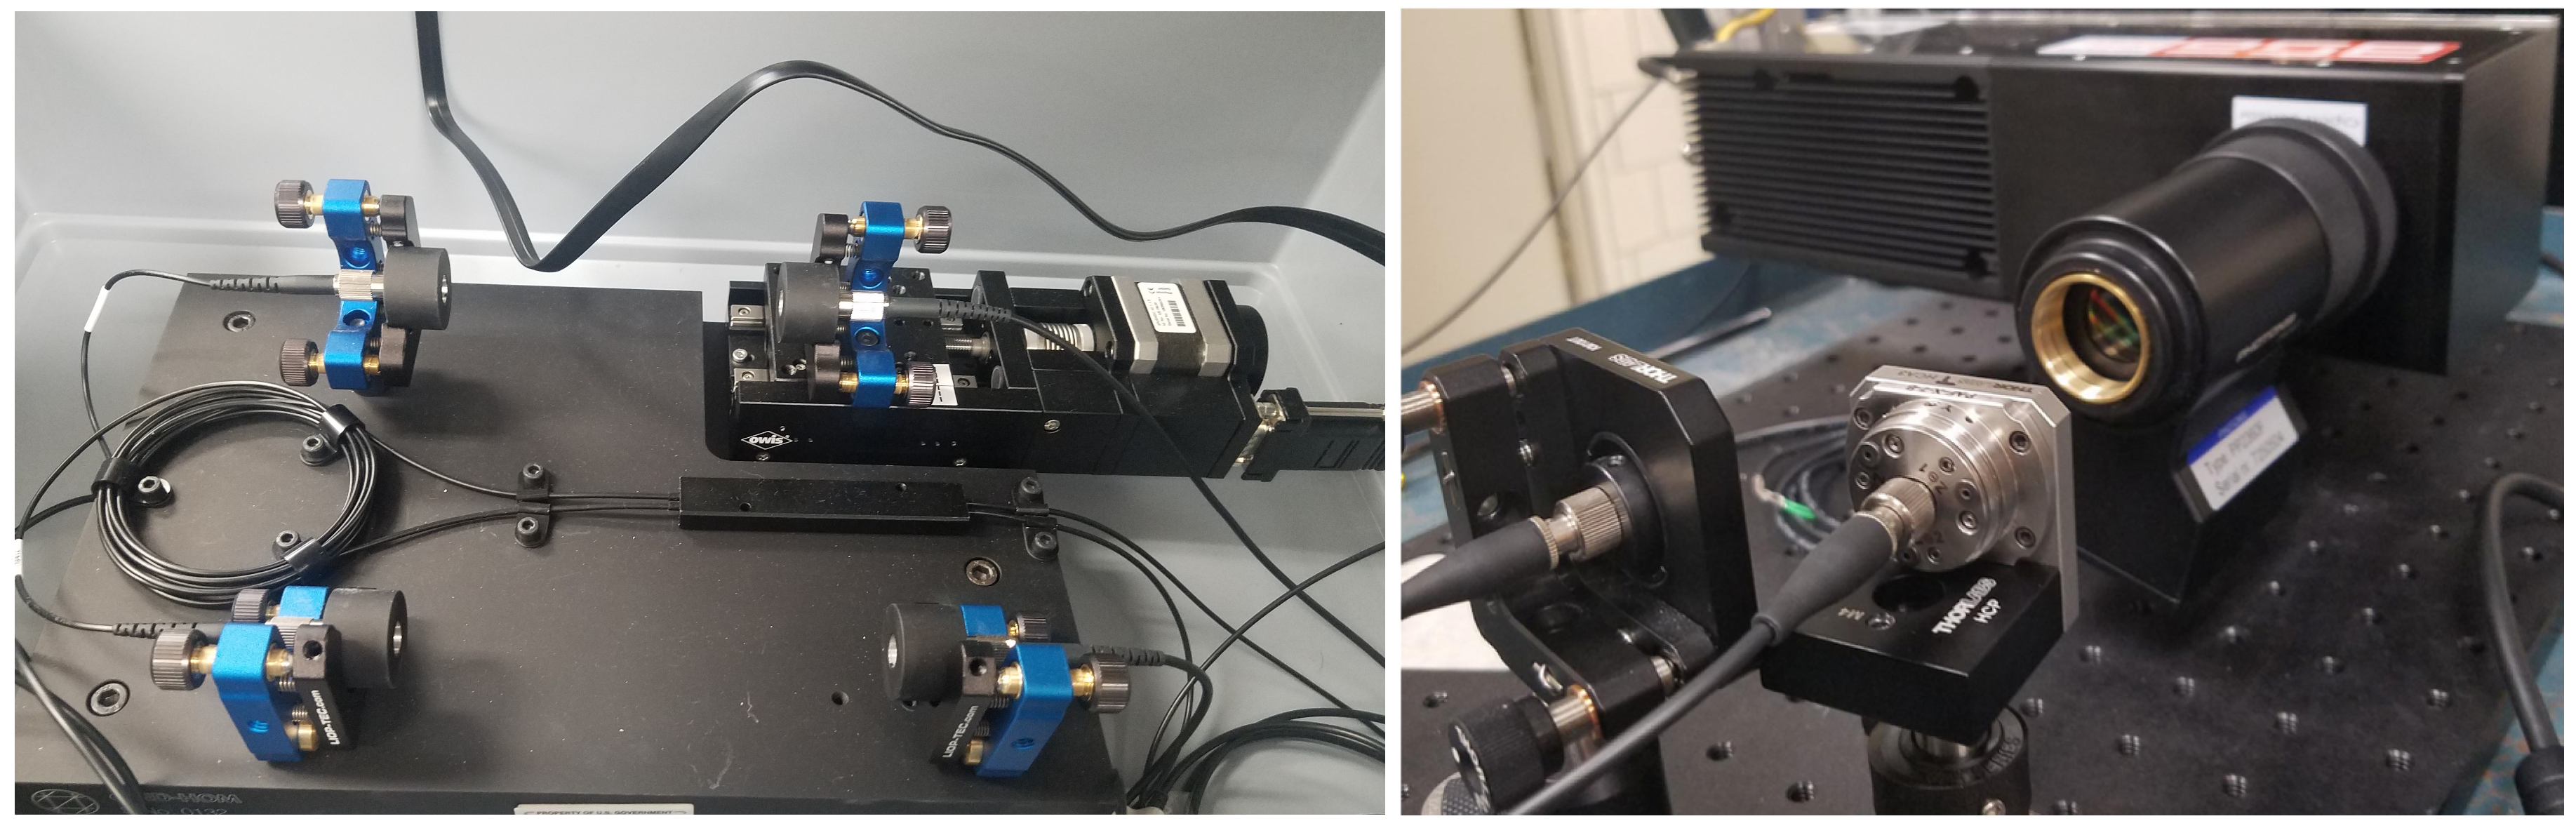
4. Experimental Setup
5. Data Analysis
6. Theory: SPDC Bi-Photon Spectrum and Hong-Ou-Mandel Effect
7. Results
8. Discussion and Conclusions
Author Contributions
Funding
Acknowledgments
Conflicts of Interest
Abbreviations
| AOM | acousto-optic modulator |
| CW | continuous wave |
| MCP | micro-channel plate |
| MKID | microwave kinetic inductance device |
| PDE | photon detection efficiency |
| PMF | polarization maintaining fiber |
| QE | quantum efficiency |
| SiPM | silicon photomultiplier |
| SNSPD | superconducting nanowire single photon detector |
| SPDC | spontaneous parametric down conversion |
| TES | transition edge sensor |
References
- Ollivier, H.; Maillette de Buy Wenniger, I.; Thomas, S.; Wein, S.C.; Harouri, A.; Coppola, G.; Hilaire, P.; Millet, C.; Lemaître, A.; Sagnes, I.; et al. Reproducibility of high-performance quantum dot single-photon sources. ACS Photonics 2020, 7, 1050–1059. [Google Scholar] [CrossRef]
- Saffman, M.; Walker, T.G. Creating single-atom and single-photon sources from entangled atomic ensembles. Phys. Rev. A 2002, 66, 06540. [Google Scholar] [CrossRef]
- Firstenberg, O.; Adams, C.S.; Hofferberth, S. Nonlinear quantum optics mediated by Rydberg interactions. J. Phys. B At. Mol. Opt. 2016, 49, 152003. [Google Scholar] [CrossRef]
- Ma, L.; Tang, X.; Slattery, O.T. Optical quantum memory and its applications in quantum communication systems. J. Res. Natl. Inst. Stan. 2020, 125, 125002. [Google Scholar] [CrossRef]
- Scriminich, A.; Namazi, M.; Flament, M.; Gera, S.; Sagona-Stophel, S.; Vallone, G.; Villoresi, P.; Figueroa, E. Hong-Ou-Mandel interference between two weak coherent pulses retrieved from room-temperature quantum memories. In Proceedings of the Quantum Information and Measurement (QIM), Rome, Italy, 4–6 April 2019. [Google Scholar] [CrossRef]
- Chen, Y.A.; Chen, S.; Yuan, Z.S.; Zhao, B.; Chuu, C.S.; Schmiedmayer, J.; Pan, J.W. Memory-built-in quantum teleportation with photonic and atomic qubits. Nat. Phys. 2008, 4, 103–107. [Google Scholar] [CrossRef]
- Motes, K.R.; Olson, J.P.; Rabeaux, E.J.; Dowling, J.P.; Olson, S.J.; Rohde, P.P. Linear Optical Quantum Metrology with Single Photons: Exploiting Spontaneously Generated Entanglement to Beat the Shot-Noise Limit. Phys. Rev. Lett. 2015, 114, 170802. [Google Scholar] [CrossRef]
- Jeffrey, E.; Peters, N.A.; Kwiat, P.G. Towards a periodic deterministic source of arbitrary single-photon states. New J. Phys. 2004, 6, 100. [Google Scholar] [CrossRef]
- Ramelow, S.; Mech, A.; Giustina, M.; Gröblacher, S.; Wieczorek, W.; Beyer, J.; Lita, A.; Calkins, B.; Gerrits, T.; Nam, S.W.; et al. Highly efficient heralding of entangled single photons. Opt. Express 2013, 21, 6707–6717. [Google Scholar] [CrossRef] [PubMed]
- Hong, C.K.; Ou, Z.Y.; Mandel, L. Measurement of subpicosecond time intervals between two photons by interference. Phys. Rev. Lett. 1987, 59, 2044–2046. [Google Scholar] [CrossRef]
- Hadfield, R.H. Single-photon detectors for optical quantum information applications. Nat. Photonics 2009, 3, 696–705. [Google Scholar] [CrossRef]
- Seitz, P.; Theuwissen, A.J. (Eds.) Single-Photon Imaging; Springer: Berlin, Germany, 2011. [Google Scholar] [CrossRef]
- Migdall, A.; Polyakov, S.V.; Fan, J.; Bienfang, J.C. (Eds.) Single-Photon Generation and Detection; Experimental Methods in the Physical Sciences; Academic Press: Cambridge, MA, USA, 2013; Volume 45. [Google Scholar]
- Zhang, L.; Neves, L.; Lundeen, J.S.; Walmsley, I.A. A characterization of the single-photon sensitivity of an electron multiplying charge-coupled device. J. Phys. B At. Mol. Opt. 2009, 42, 114011. [Google Scholar] [CrossRef]
- Avella, A.; Ruo-Berchera, I.; Degiovanni, I.P.; Brida, G.; Genovese, M. Absolute calibration of an EMCCD camera by quantum correlation, linking photon counting to the analog regime. Opt. Lett. 2016, 41, 1841. [Google Scholar] [CrossRef] [PubMed]
- Moreau, P.A.; Toninelli, E.; Gregory, T.; Padgett, M.J. Imaging with quantum states of light. Nat. Rev. Phys. 2019, 1, 367–380. [Google Scholar] [CrossRef]
- Gasparini, L.; Bessire, B.; Unternährer, M.; Stefanov, A.; Boiko, D.; Perenzoni, M.; Stoppa, D. SUPERTWIN: Towards 100kpixel CMOS quantum image sensors for quantum optics applications. In Proceedings of the Quantum Sensing and Nano Electronics and Photonics XIV, San Francisco, CA, USA, 27 January 2017. [Google Scholar]
- Perenzoni, M.; Pancheri, L.; Stoppa, D. Compact SPAD-Based Pixel Architectures for Time-Resolved Image Sensors. Sensors 2016, 16, 745. [Google Scholar] [CrossRef] [PubMed]
- Lee, M.J.; Charbon, E. Progress in single-photon avalanche diode image sensors in standard CMOS: From two-dimensional monolithic to three-dimensional-stacked technology. Jpn. J. Appl. Phys. 2018, 57, 1002A3. [Google Scholar] [CrossRef]
- Jiang, L.A.; Dauler, E.A.; Chang, J.T. Photon-number-resolving detector with 10 bits of resolution. Phys. Rev. A 2007, 75, 062325. [Google Scholar] [CrossRef]
- Morimoto, K.; Ardelean, A.; Wu, M.L.; Ulku, A.C.; Antolovic, I.M.; Bruschini, C.; Charbon, E. Megapixel time-gated SPAD image sensor for 2D and 3D imaging applications. Optica 2020, 7, 346. [Google Scholar] [CrossRef]
- Brida, G.; Caspani, L.; Gatti, A.; Genovese, M.; Meda, A.; Berchera, I.R. Measurement of Sub-Shot-Noise Spatial Correlations without Background Subtraction. Phys. Rev. Lett. 2009, 102, 213602. [Google Scholar] [CrossRef]
- Brida, G.; Degiovanni, I.P.; Florio, A.; Genovese, M.; Giorda, P.; Meda, A.; Paris, M.G.A.; Shurupov, A. Experimental Estimation of Entanglement at the Quantum Limit. Phys. Rev. Lett. 2010, 104, 100501. [Google Scholar] [CrossRef] [PubMed]
- Reichert, M.; Sun, X.; Fleischer, J.W. Quality of spatial entanglement propagation. Phys. Rev. A 2017, 95, 063836. [Google Scholar] [CrossRef]
- Jost, B.M.; Sergienko, A.V.; Abouraddy, A.F.; Saleh, B.E.A.; Teich, M.C. Spatial correlations of spontaneously down-converted photon pairs detected with a single-photon-sensitive CCD camera. Opt. Express 1998, 3, 81–88. [Google Scholar] [CrossRef] [PubMed]
- Jachura, M.; Chrapkiewicz, R. Shot-by-shot imaging of Hong–Ou–Mandel interference with an intensified sCMOS camera. Opt. Lett. 2015, 40, 1540–1543. [Google Scholar] [CrossRef] [PubMed][Green Version]
- Fickler, R.; Krenn, M.; Lapkiewicz, R.; Ramelow, S.; Zeilinger, A. Real-Time Imaging of Quantum Entanglement. Sci. Rep. 2013, 3, 1914. [Google Scholar] [CrossRef] [PubMed]
- Just, F.; Filipenko, M.; Cavanna, A.; Michel, T.; Gleixner, T.; Taheri, M.; Vallerga, J.; Campbell, M.; Tick, T.; Anton, G.; et al. Detection of non-classical space-time correlations with a novel type of single-photon camera. Opt. Express 2014, 22, 17561–17572. [Google Scholar] [CrossRef] [PubMed]
- Vallerga, J.; Tremsin, A.; DeFazio, J.; Michel, T.; Alozy, J.; Tick, T.; Campbell, M. Optical MCP image tube with a quad Timepix readout: Initial performance characterization. J. Instrum. 2014, 9, C05055. [Google Scholar] [CrossRef]
- Tremsin, A.; Vallerga, J. Unique capabilities and applications of Microchannel Plate (MCP) detectors with Medipix/Timepix readout. Radiat. Meras. 2020, 130, 106228. [Google Scholar] [CrossRef]
- Nomerotski, A. Imaging and time stamping of photons with nanosecond resolution in Timepix based optical cameras. Nucl. Instrum. Meth. A 2019, 937, 26–30. [Google Scholar] [CrossRef]
- John, J.J.; Brouard, M.; Clark, A.; Crooks, J.; Halford, E.; Hill, L.; Lee, J.W.L.; Nomerotski, A.; Pisarczyk, R.; Sedgwick, I.; et al. PImMS, a fast event-triggered monolithic pixel detector with storage of multiple timestamps. J. Instrum. 2012, 7, C08001. [Google Scholar] [CrossRef]
- Divochiy, A.; Marsili, F.; Bitauld, D.; Gaggero, A.; Leoni, R.; Mattioli, F.; Korneev, A.; Seleznev, V.; Kaurova, N.; Minaeva, O.; et al. Superconducting nanowire photon-number-resolving detector at telecommunication wavelengths. Nat. Photonics 2008, 2, 302–306. [Google Scholar] [CrossRef]
- Zhu, D.; Colangelo, M.; Chen, C.; Korzh, B.A.; Wong, F.N.C.; Shaw, M.D.; Berggren, K.K. Resolving Photon Numbers Using a Superconducting Nanowire with Impedance-Matching Taper. Nano Lett. 2020. [Google Scholar] [CrossRef]
- Korzh, B.; Zhao, Q.Y.; Allmaras, J.P.; Frasca, S.; Autry, T.M.; Bersin, E.A.; Beyer, A.D.; Briggs, R.M.; Bumble, B.; Colangelo, M.; et al. Demonstration of sub-3 ps temporal resolution with a superconducting nanowire single-photon detector. Nat. Photonics 2020, 14, 250–255. [Google Scholar] [CrossRef]
- Cabrera, B.; Clarke, R.M.; Colling, P.; Miller, A.J.; Nam, S.; Romani, R.W. Detection of single infrared, optical, and ultraviolet photons using superconducting transition edge sensors. Appl. Phys. Lett. 1998, 73, 735–737. [Google Scholar] [CrossRef]
- Lita, A.E.; Miller, A.J.; Nam, S.W. Counting near-infrared single-photons with 95% efficiency. Opt. Express 2008, 16, 3032. [Google Scholar] [CrossRef] [PubMed]
- Day, P.K.; LeDuc, H.G.; Mazin, B.A.; Vayonakis, A.; Zmuidzinas, J. A broadband superconducting detector suitable for use in large arrays. Nature 2003, 425, 817–821. [Google Scholar] [CrossRef] [PubMed]
- Mazin, B.A.; O’Brien, K.; McHugh, S.; Bumble, B.; Moore, D.; Golwala, S.; Zmuidzinas, J. ARCHONS: A highly multiplexed superconducting optical to near-IR camera. In Ground-Based and Airborne Instrumentation for Astronomy III; McLean, I.S., Ramsay, S.K., Takami, H., Eds.; SPIE: Paris, France, 2010. [Google Scholar] [CrossRef]
- Kok, P.; Munro, W.J.; Nemoto, K.; Ralph, T.C.; Dowling, J.P.; Milburn, G.J. Linear optical quantum computing with photonic qubits. Rev. Mod. Phys. 2007, 79, 135–174. [Google Scholar] [CrossRef]
- O’Brien, J.L. Optical Quantum Computing. Science 2007, 318, 1567–1570. [Google Scholar] [CrossRef] [PubMed]
- Fisher-Levine, M.; Nomerotski, A. TimepixCam: A fast optical imager with time-stamping. J. Instrum. 2016, 11, C03016. [Google Scholar] [CrossRef]
- Zhao, A.; Beuzekom, M.V.; Bouwens, B.; Byelov, D.; Chakaberia, I.; Cheng, C.; Maddox, E.; Nomerotski, A.; Svihra, P.; Visser, J.; et al. Coincidence velocity map imaging using Tpx3Cam, a time stamping optical camera with 1.5 ns timing resolution. Rev. Sci. Instrum. 2017, 88, 113104. [Google Scholar] [CrossRef]
- Nomerotski, A.; Chakaberia, I.; Fisher-Levine, M.; Janoska, Z.; Takacs, P.; Tsang, T. Characterization of TimepixCam, a fast imager for the time-stamping of optical photons. J. Instrum. 2017, 12, C01017. [Google Scholar] [CrossRef]
- Poikela, T.; Plosilab, J.; Westerlundb, T.; Campbellc, M.; De Gasparic, M.; Llopartc, X.; Gromovd, V.; Kluitd, R. Timepix3: A 65K channel hybrid pixel readout chip with simultaneous ToA/ToT and sparse readout. J. Instrum. 2014, 9, C05013. [Google Scholar] [CrossRef]
- Cricket. Available online: https://www.photonis.com/product/hi-qephotocathodes (accessed on 19 June 2020).
- Ianzano, C.; Svihra, P.; Flament, M.; Hardy, A.; Cui, G.; Nomerotski, A.; Figueroa, E. Fast camera spatial characterization of photonic polarization entanglement. Sci. Rep. 2020, 10. [Google Scholar] [CrossRef] [PubMed]
- Nomerotski, A.; Katramatos, D.; Stankus, P.; Svihra, P.; Cui, G.; Gera, S.; Flament, M.; Figueroa, E. Spatial and temporal characterization of polarization entanglement. Int. J. Quantum Inf. 2020, 18, 1941027. [Google Scholar] [CrossRef]
- Zhang, Y.; England, D.; Nomerotski, A.; Svihra, P.; Ferrante, S.; Hockett, P.; Sussman, B. Multidimensional quantum-enhanced target detection via spectrotemporal-correlation measurements. Phys. Rev. A 2020, 101, 053808. [Google Scholar] [CrossRef]
- Sen, R.; Hirvonen, L.M.; Zhdanov, A.; Svihra, P.; Andersson-Engels, S.; Nomerotski, A.; Papkovsky, D. New luminescence lifetime macro-imager based on a Tpx3Cam optical camera. Biomed. Opt. Express 2020, 11, 77–88. [Google Scholar] [CrossRef] [PubMed]
- Turecek, D.; Jakubek, J.; Soukup, P. USB 3.0 readout and time-walk correction method for Timepix3 detector. J. Instrum. 2016, 11, C12065. [Google Scholar] [CrossRef]
- Ou, Z.Y.J. Multi-Photon Quantum Interference; Springer International Publishing: Cham, Switzerland, 2007. [Google Scholar]
- Cialdi, S.; Castelli, F.; Paris, M.G. Properties of entangled photon pairs generated by a CW laser with small coherence time: Theory and experiment. J. Mod. Opt. 2009, 56, 215–225. [Google Scholar] [CrossRef]
- Franson, J.D. Nonlocal cancellation of dispersion. Phys. Rev. A 1992, 45, 3126–3132. [Google Scholar] [CrossRef] [PubMed]
- Steinberg, A.M.; Kwiat, P.G.; Chiao, R.Y. Dispersion cancellation and high-resolution time measurements in a fourth-order optical interferometer. Phys. Rev. A 1992, 45, 6659–6665. [Google Scholar] [CrossRef]
- Steinberg, A.M.; Kwiat, P.G.; Chiao, R.Y. Dispersion cancellation in a measurement of the single-photon propagation velocity in glass. Phys. Rev. Lett. 1992, 68, 2421–2424. [Google Scholar] [CrossRef]
- Rarity, J.G.; Tapster, P.R. Fourth-order interference in parametric downconversion. J. Opt. Soc. Am. B 1989, 6, 1221–1226. [Google Scholar] [CrossRef]
- Orlov, D.; Ruardij, T.; Pinto, S.D.; Glazenborg, R.; Kernen, E. High collection efficiency MCPs for photon counting detectors. J. Instrum. 2018, 13, C01047. [Google Scholar] [CrossRef]
- Orlov, D.A.; Glazenborg, R.; Ortega, R.; Kernen, E. UV/visible high-sensitivity MCP-PMT single-photon GHz counting detector for long-range lidar instrumentations. Ceas Space J. 2019, 11, 405–411. [Google Scholar] [CrossRef]
- Xia, T.; Lichtman, M.; Maller, K.; Carr, A.W.; Piotrowicz, M.J.; Isenhower, L.; Saffman, M. Randomized Benchmarking of Single-Qubit Gates in a 2D Array of Neutral-Atom Qubits. Phys. Rev. Lett. 2015, 114, 100503. [Google Scholar] [CrossRef] [PubMed]
- Graham, T.M.; Kwon, M.; Grinkemeyer, B.; Marra, Z.; Jiang, X.; Lichtman, M.T.; Sun, Y.; Ebert, M.; Saffman, M. Rydberg-Mediated Entanglement in a Two-Dimensional Neutral Atom Qubit Array. Phys. Rev. Lett. 2019, 123, 230501. [Google Scholar] [CrossRef]


© 2020 by the authors. Licensee MDPI, Basel, Switzerland. This article is an open access article distributed under the terms and conditions of the Creative Commons Attribution (CC BY) license (http://creativecommons.org/licenses/by/4.0/).
Share and Cite
Nomerotski, A.; Keach, M.; Stankus, P.; Svihra, P.; Vintskevich, S. Counting of Hong-Ou-Mandel Bunched Optical Photons Using a Fast Pixel Camera. Sensors 2020, 20, 3475. https://doi.org/10.3390/s20123475
Nomerotski A, Keach M, Stankus P, Svihra P, Vintskevich S. Counting of Hong-Ou-Mandel Bunched Optical Photons Using a Fast Pixel Camera. Sensors. 2020; 20(12):3475. https://doi.org/10.3390/s20123475
Chicago/Turabian StyleNomerotski, Andrei, Michael Keach, Paul Stankus, Peter Svihra, and Stephen Vintskevich. 2020. "Counting of Hong-Ou-Mandel Bunched Optical Photons Using a Fast Pixel Camera" Sensors 20, no. 12: 3475. https://doi.org/10.3390/s20123475
APA StyleNomerotski, A., Keach, M., Stankus, P., Svihra, P., & Vintskevich, S. (2020). Counting of Hong-Ou-Mandel Bunched Optical Photons Using a Fast Pixel Camera. Sensors, 20(12), 3475. https://doi.org/10.3390/s20123475