1. Introduction
Piezoelectric acceleration sensors (or accelerometers) built using Pb(Zr,Ti)O
3 (PZT) ceramics are widely used in the field of structural health monitoring owing to outstanding characteristics such as a fast response, excellent dynamic range and linearity, long term stability and minimal power consumption [
1,
2,
3]. In detecting abnormal vibrations of structural components, such accelerometers perform best with a high sensitivity (low threshold) and a high resonant frequency (wide frequency usable range) simultaneously. Unfortunately, all piezoelectric type accelerometers are basically a compromise between sensitivity and resonant frequency. To be specific, these two performance characteristics are fundamentally associated by a trade-off relation: namely, one property must increase at the sacrifice of the other [
4,
5,
6,
7,
8,
9]. In considering the possible presence of alternative designs of the sensor components, therefore, challenges always exist in seeking advanced sensor designs with improved performances related to these two characteristics.
Our recent numerical investigation found that in constructing an accelerometer, the performances of these two characteristics were significantly influenced by the design factors (geometry, dimensions and configuration) of the components (e.g., seismic mass, piezo element, tail, base and insulating layer etc.) [
10]. To obtain better performances, moreover, it was necessary to carefully choose the component design by optimizing the design variables of each component, which was possible by thoroughly understanding the relationship between the design characteristic and the physical functionality. The numerically analyzed results also revealed that the structure of the accelerometer could be designed according to the requirements of the sensing application.
In this study, we extended our previous numerical work [
10] to a real system, offering important information about the role of the design characteristics on the physical functionalities of a compression-mode accelerometer. Given the valid range of the meta model produced using the design of experiments (DOE) technique [
10], we chose four set values of resonant frequency between 25 and 40 kHz to numerically optimize the accelerometer design via metamodeling. We obtained the four sets of accelerometer designs with a variation of the resonant frequency and successfully fabricated and assembled the accelerometer modules using the proposed designs. We investigated both theoretically and experimentally their performance characteristics related to the two performance indicators, sensitivity, and frequency response.
2. Materials and Methods
As shown in
Figure 1, the basic structure of a compression-type piezoelectric accelerometer was employed as a design reference for the numerical analysis. Two piezoceramic rings are connected electrically in parallel and mechanically in series. They are sandwiched under a compressive force between the head and tail by a screw.
The numerical analysis was performed via harmonic and piezoelectric analysis using a commercial finite element modeling software (ANSYS V18). The modeling was performed for a piezoelectric accelerometer module under two boundary conditions, free and fixed conditions. We selected ten design variables of accelerometer module for numerical analysis: head outer diameter (OD), head height, piezoceramic OD, piezoceramic inner diameter (ID), piezoceramic thickness, tail OD, tail height, insulating layer thickness, base OD and base height. The materials used for the head, piezoceramic ring, tail, base, and insulating layer were tungsten, PZT, 316 stainless steel and epoxy, respectively. The kriging model was adopted for building the approximation of the relationship between the design variables (input) and the performances (output) and used for optimization of design variables. Its mathematical description is given elsewhere [
11,
12,
13]. The optimization was carried out to find the optimum values of the employed design variables using a program called Easy Design, in a way that maximize the electric voltage, representing sensitivity, at different set values of resonant frequency. Here, the electric voltage was obtained assuming 1
g (=9.8 m s
−2) of constant gravitational acceleration at 159 Hz (angular frequency
ω = 1/2π
f = 0.001). The optimization process was iterated until a satisfactory result was achieved. Details on these optimization processes as well as all the material data used for numerical analysis were described in ref. [
10].
For the experimental investigation of the numerically analyzed results, accelerometer sensor modules were fabricated by assembling internal sensor components and piezoceramic rings manufactured with the same materials and designs as those proposed from the numerical optimization. The frequency response of the accelerometer modules was characterized by measuring the electrical impedance and phase versus frequency spectra using a precision impedance analyzer (HP 4294A; Agilent; Santa Clara, CA, USA) to find whether there is any distinct resonance in the frequency range of 0.04–50 kHz. The applied test signal was 0.5 V (DC bias = 0 V). The measurements were carried out under both the free and fixed conditions to compare with the numerically analyzed results.
The frequency response characteristic was also measured via vibration tests under fixed (or mounted) condition of accelerometer using a vibration exciter (SE-9; SPEKTRA, Dresden, Germany), coupled with a function generator and data acquisition system (m + p VibPilot; m + p International, Hannover, Germany), a signal conditioner (Model 133; Endevco, San Juan Capistrano, CA, USA) and a power amplifier (PA 14-500; SPEKTRA). The sensor calibration was made by an internal high-frequency reference accelerometer (352A60; PCB, New York, NY, USA), which is shear-type with a sensitivity of 10 mV/g and a resonant frequency of 95 kHz. The measurements were conducted in the frequency range of 0.01–40 kHz with an applied acceleration of 1 g. The vibration systems were controlled by the Microsoft Windows-based software (m + p VibControl; m + p International).
The charge sensitivity was measured using a portable accelerometer calibrator (28959FV; Endevco) that included a built-in vibration exciter, signal generator, computer-controlled amplifier/servo mechanism and so on. The applied range of acceleration was between 1–10 g. The sensitivity was measured at a constant frequency f of 159 Hz.
3. Results
In this study, we optimized the design variables of the PZT-based accelerometer using the DOE test points used in our previous investigation [
10]. According to the results, the present metamodel was valid between 25–47.5 kHz in resonant frequency due to the dimensional limits of size range of the design variables. The optimization was thus carried out by employing four different set values of resonant frequency
fs, 25, 30, 35, 40 kHz, thereby creating four accelerometer designs according to the resonant frequency. To avoid the complexity involved in modeling different geometric dimensions of piezoceramic samples as well as the difficulty in experimentally preparing piezoceramic samples of different sizes or shapes with identical physical properties, the dimensions of piezoceramic ring were kept constant: 12.6 mm for the O.D., 7.5 mm for the I.D. and 2.7 mm for the thickness. All of the other design variables except for those related to the piezoceramic ring were considered for the optimization. The optimized results of the design variables at each
fs as well as the corresponding results of resonant frequency
fr and electric voltage
Ev are presented in
Table 1 and
Figure 2. The results optimized at each
fs clearly indicate that the
Ev changes in inverse proportion to the
fr with exponential decay. As highlighted by underlining in
Table 1, four results showing the
fr value closest to
fs were taken among them for further optimization.
Since the epoxy layer was known to be sensitive to the sensing performances [
10], next we investigated the isolated effect of the epoxy used as the insulating layer on the resonant frequency and electric voltage. For this, we considered the size range of the epoxy thickness, 0.3–1.0 mm: About 0.3 mm is considered as minimum thickness that can be experimentally controlled for insulating. Using the above underlined results (
Table 1), only the epoxy thickness was varied in this size range. An increase in the insulating epoxy thickness negatively affected the resonant frequency (
Figure 3a), while its effects on the electric voltage was negligible (
Figure 3b). Thus, the results revealed that a smaller thickness is preferable for enhancing the sensing performance. We also note the results of
Figure 3c showing the effect of the epoxy property, i.e., Young’s modulus. As the Young’s modulus of the epoxy increases, the value of
fr increases until it approaches 5–10 GPa but the increase of
fr is insignificant beyond this range. According to the result, we confirmed that the epoxy used in this study possesses a desirable property of Young’s modulus (~9.5 GPa) in terms of resonant frequency. Finally, we obtained the optimum thickness of the epoxy layer, i.e., 0.3 mm.
Figure 4a presents the
fr and
Ev properties of the final four designs obtained before and after the numerical optimization of the epoxy layer. It is found that the values of
fr were increased by about 1.2–1.7 kHz by optimizing the epoxy layer, as compared to those underlined in
Table 1. The cross-sectional views of corresponding final designs and their dimensional properties are presented in
Figure 4b and
Table 2, respectively.
Figure 5 shows the impedance-frequency characteristics obtained from the numerical simulation under free and fixed boundary conditions for the four optimized designs. As determined from
Figure 5, the values of
fr for the fixed mode decreased by about 9.4–10.6 kHz, compared to the free mode (
Table 2). This indicates that the
fr value decreases when the accelerometer is attached or mounted on certain structures for practical application.
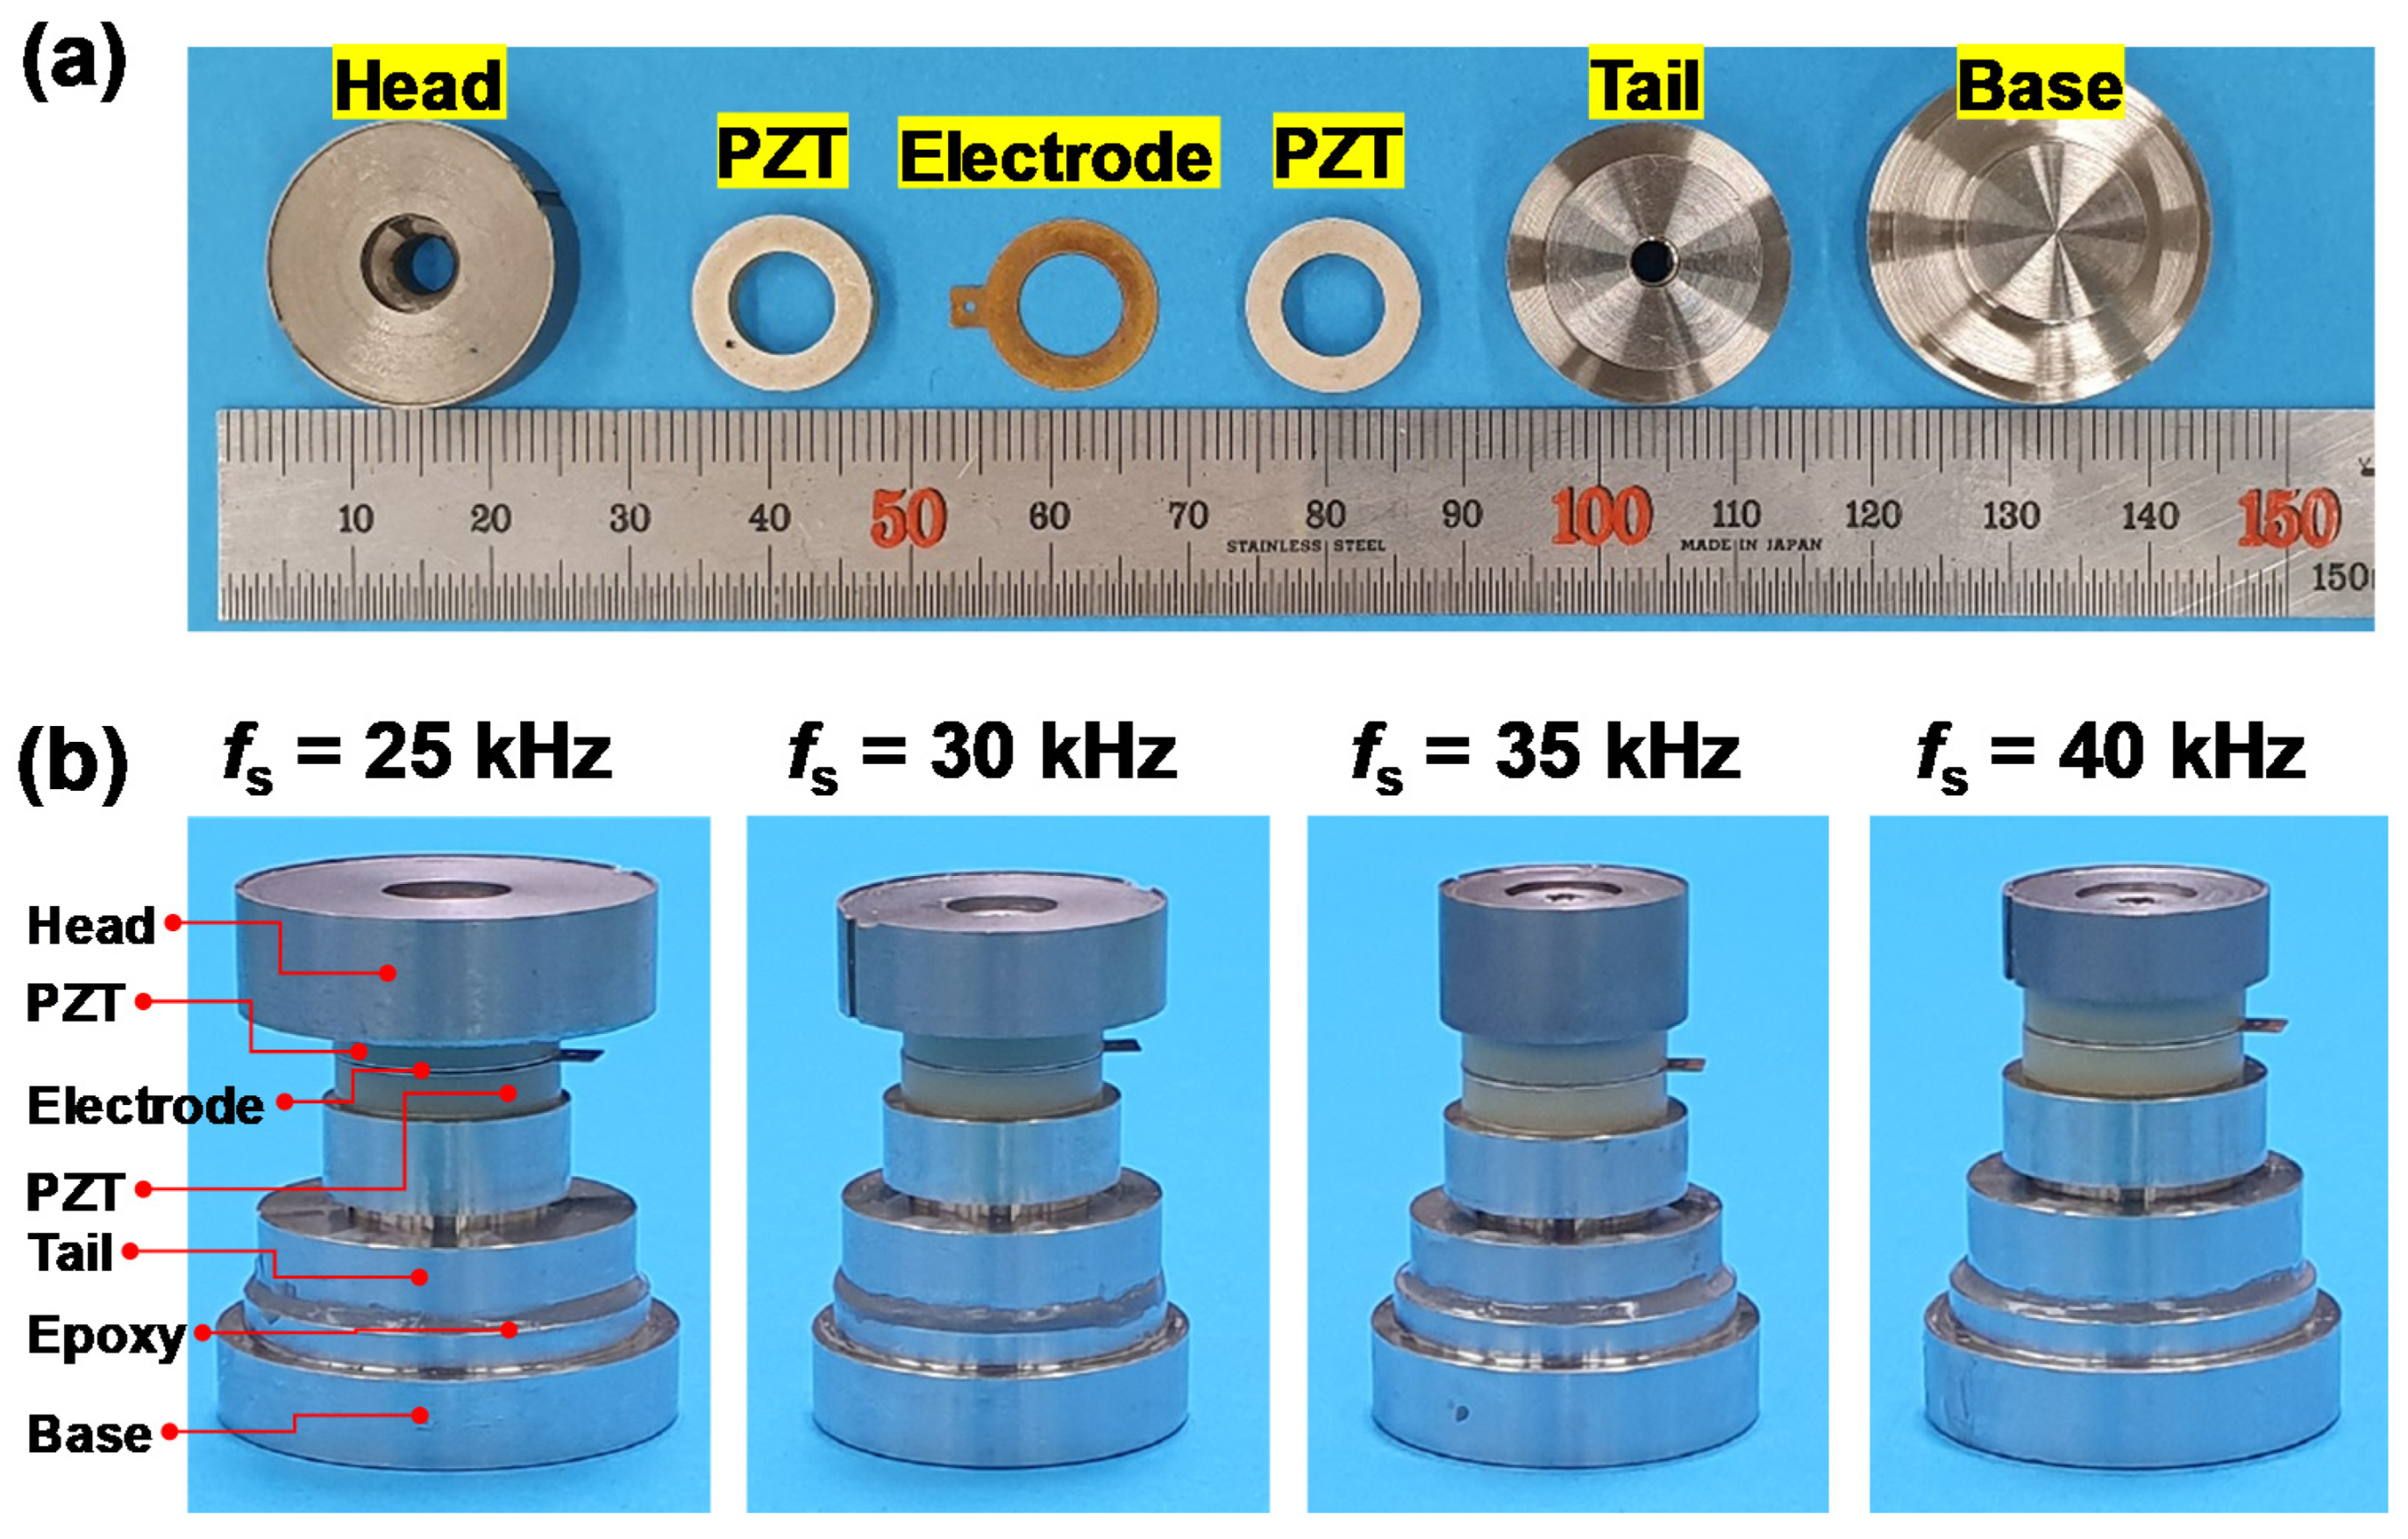
For experimental validation of the above numerical results, the accelerometer modules were fabricated using the components and PZT ceramic rings manufactured in accordance with the four optimized designs (
Table 2). Including the head, tail, base, and PZT ceramic rings, the fabricated internal components for the four different optimized designs are shown in
Figure 6a. The four accelerometer modules assembled using them are also shown in
Figure 6b. The epoxy thickness was constantly maintained in the range of 0.3–0.34 mm by precisely controlling the amount of injected epoxy using a specially designed injection mold. After the alignment of the manufactured sensor components, all the components were tightened with a screw using an optimized torque value of about 2.0 N⋅m [
10]. As summarized in
Table 3, the PZT ceramic rings used in this study had a static piezoelectric coefficient
d33 of 400 pC/N and a Curie temperature
Tc of 367 °C, which are comparable to those of the commercial PZT 5A that are widely used for piezoelectric-typed sensors [
14]. The dimensions of the PZT ceramic rings were also nearly the same as those used for the above numerical analysis.
The frequency response was first evaluated through an impedance test and a vibration experiment. To compare with the numerically analyzed results, both the free and fixed conditions were realized in a real experiment.
Figure 7a,b show the impedance spectra measured under the free and fixed conditions and the frequency response characteristics obtained from the vibration experiments under the fixed condition, respectively. The
fr values determined from those experiments are presented in
Figure 7c as a comparison with the numerical ones. According to the impedance test, the experimentally measured
fr values for the fixed condition were lower by 7.3–10.3 kHz than those for the free condition, which was similar to the above numerical investigation (
Figure 5).
On the other hand, it is noted that the experimental values of fr were slightly lower than the numerical ones. The differences were about 2.3–4.5 kHz for the free condition and about 0.9–3.2 kHz for the fixed condition. One of the reasons for such differences might be related to the difficulties in uniformly maintaining the epoxy thickness at the numerical size of 0.32 mm. We also speculated that it may be related to loose boundaries or interfaces inside the real system, which was different from the numerical analysis assuming the perfect contacts between the components. There being no significant difference in the fixed fr values between the impedance test (16.1–30 kHz) and the vibration experiment (14.7–29.3 kHz) proves the reliability of the proposed accelerometer modules. Importantly, these values of fr under the fixed condition are substantially high compared to those of commercial piezoelectric accelerometers (20–30 kHz).
We investigated the sensitivity properties of the four optimized accelerometer modules using a portable accelerometer calibrator.
Figure 8a shows the charge-to-acceleration characteristics depending on the accelerometer design. In the investigated acceleration range (1–10
g), the values of Pearson’s correlation coefficient
r, as a measure of the linear correlation between two variables, were found to be almost “unity” with perfect linearity, indicating an excellent reliability of the proposed accelerometer modules. The charge sensitivity
Sq can be determined from the slope or the linear relation between them. The obtained
Sq varied from 296.8 to 79.4 pC/
g, depending on the design (
fs value). The design dependency of the experimentally measured
Sq is consistent with that of the numerically calculated
Ev (
Figure 8b). By considering only the piezoceramic and mass (head), the charge sensitivity was simplified and given by Equation (1) [
15].
Here,
n,
ms, and
g are the number of piezoceramic layers, the weight of the seismic mass, and the acceleration, respectively. Hence, the
Sq is proportional to the design parameters
n and
ms as well as the material characteristic
d33. In this work, the
ms (weight of the head) varied depending on the design, because the dimensions of the head (head OD
x1, head height
x2) changed with the design (
Table 2). Given that other parameters, such as
n and
d33, are fixed, the comparison between the experimentally measured
Sq and
ms showed that there is a direct proportional relationship between them (
Table 4), which is in good agreement with Equation (1). On the other hand,
ms negatively affects the resonant frequency
fr. Therefore, a change in
ms must produce the opposite effect on the sensitivity and resonant frequency. The
fr-dependent behavior of
Sq calculated by Equation (1) was also identical to that of the experimentally measured one. However, we also note that there is a difference in their absolute values: the measured values were lower by 73–79% compared to the calculated ones. This might have been due to the presence of other components (e.g., tail, base, epoxy, etc.) and interfaces negatively affecting the sensitivity property in a real sensor system. The results of the fixed
fr and the corresponding
Sq (or
Ev) values clearly showed that there is an inverse relationship between the sensitivity and resonant frequency. Consequently, the design variables can only improve one of the two performances, i.e., sensitivity or resonant frequency, but with sacrifice to the other, when the material properties are fixed. According to our results, we also recommend that the accelerometer design be constructed according to the desired performance on the line of the optimized curve,
Sq versus
fr. For example, either a design with high sensitivity as well as relatively low resonant frequency can be chosen by requirement, or a design with high resonant frequency at the expense of sensitivity may be favored for a wider spectrum of vibration sensing.


