2.1. UWB Sensor and Repiratory Signal Patterns
UWB sensors have primarily been used for shortrange wireless communication; however, recently, they have been widely used for object motion detection and bio-signal detection.
The UWB sensor uses a wide range of frequency bands; thus, it has the advantage of less interference with other narrowband or wideband signals.
In particular, UWB signals use very narrow pulses, i.e., a few nanoseconds or picoseconds. Therefore, it is possible to precisely measure the distance and position of an object with a low-spectrum power density characteristic in a wide frequency band.
The specifications of the UWB sensor used in our experiment are given in
Table 1, and the data were measured via UART communication with a PC.
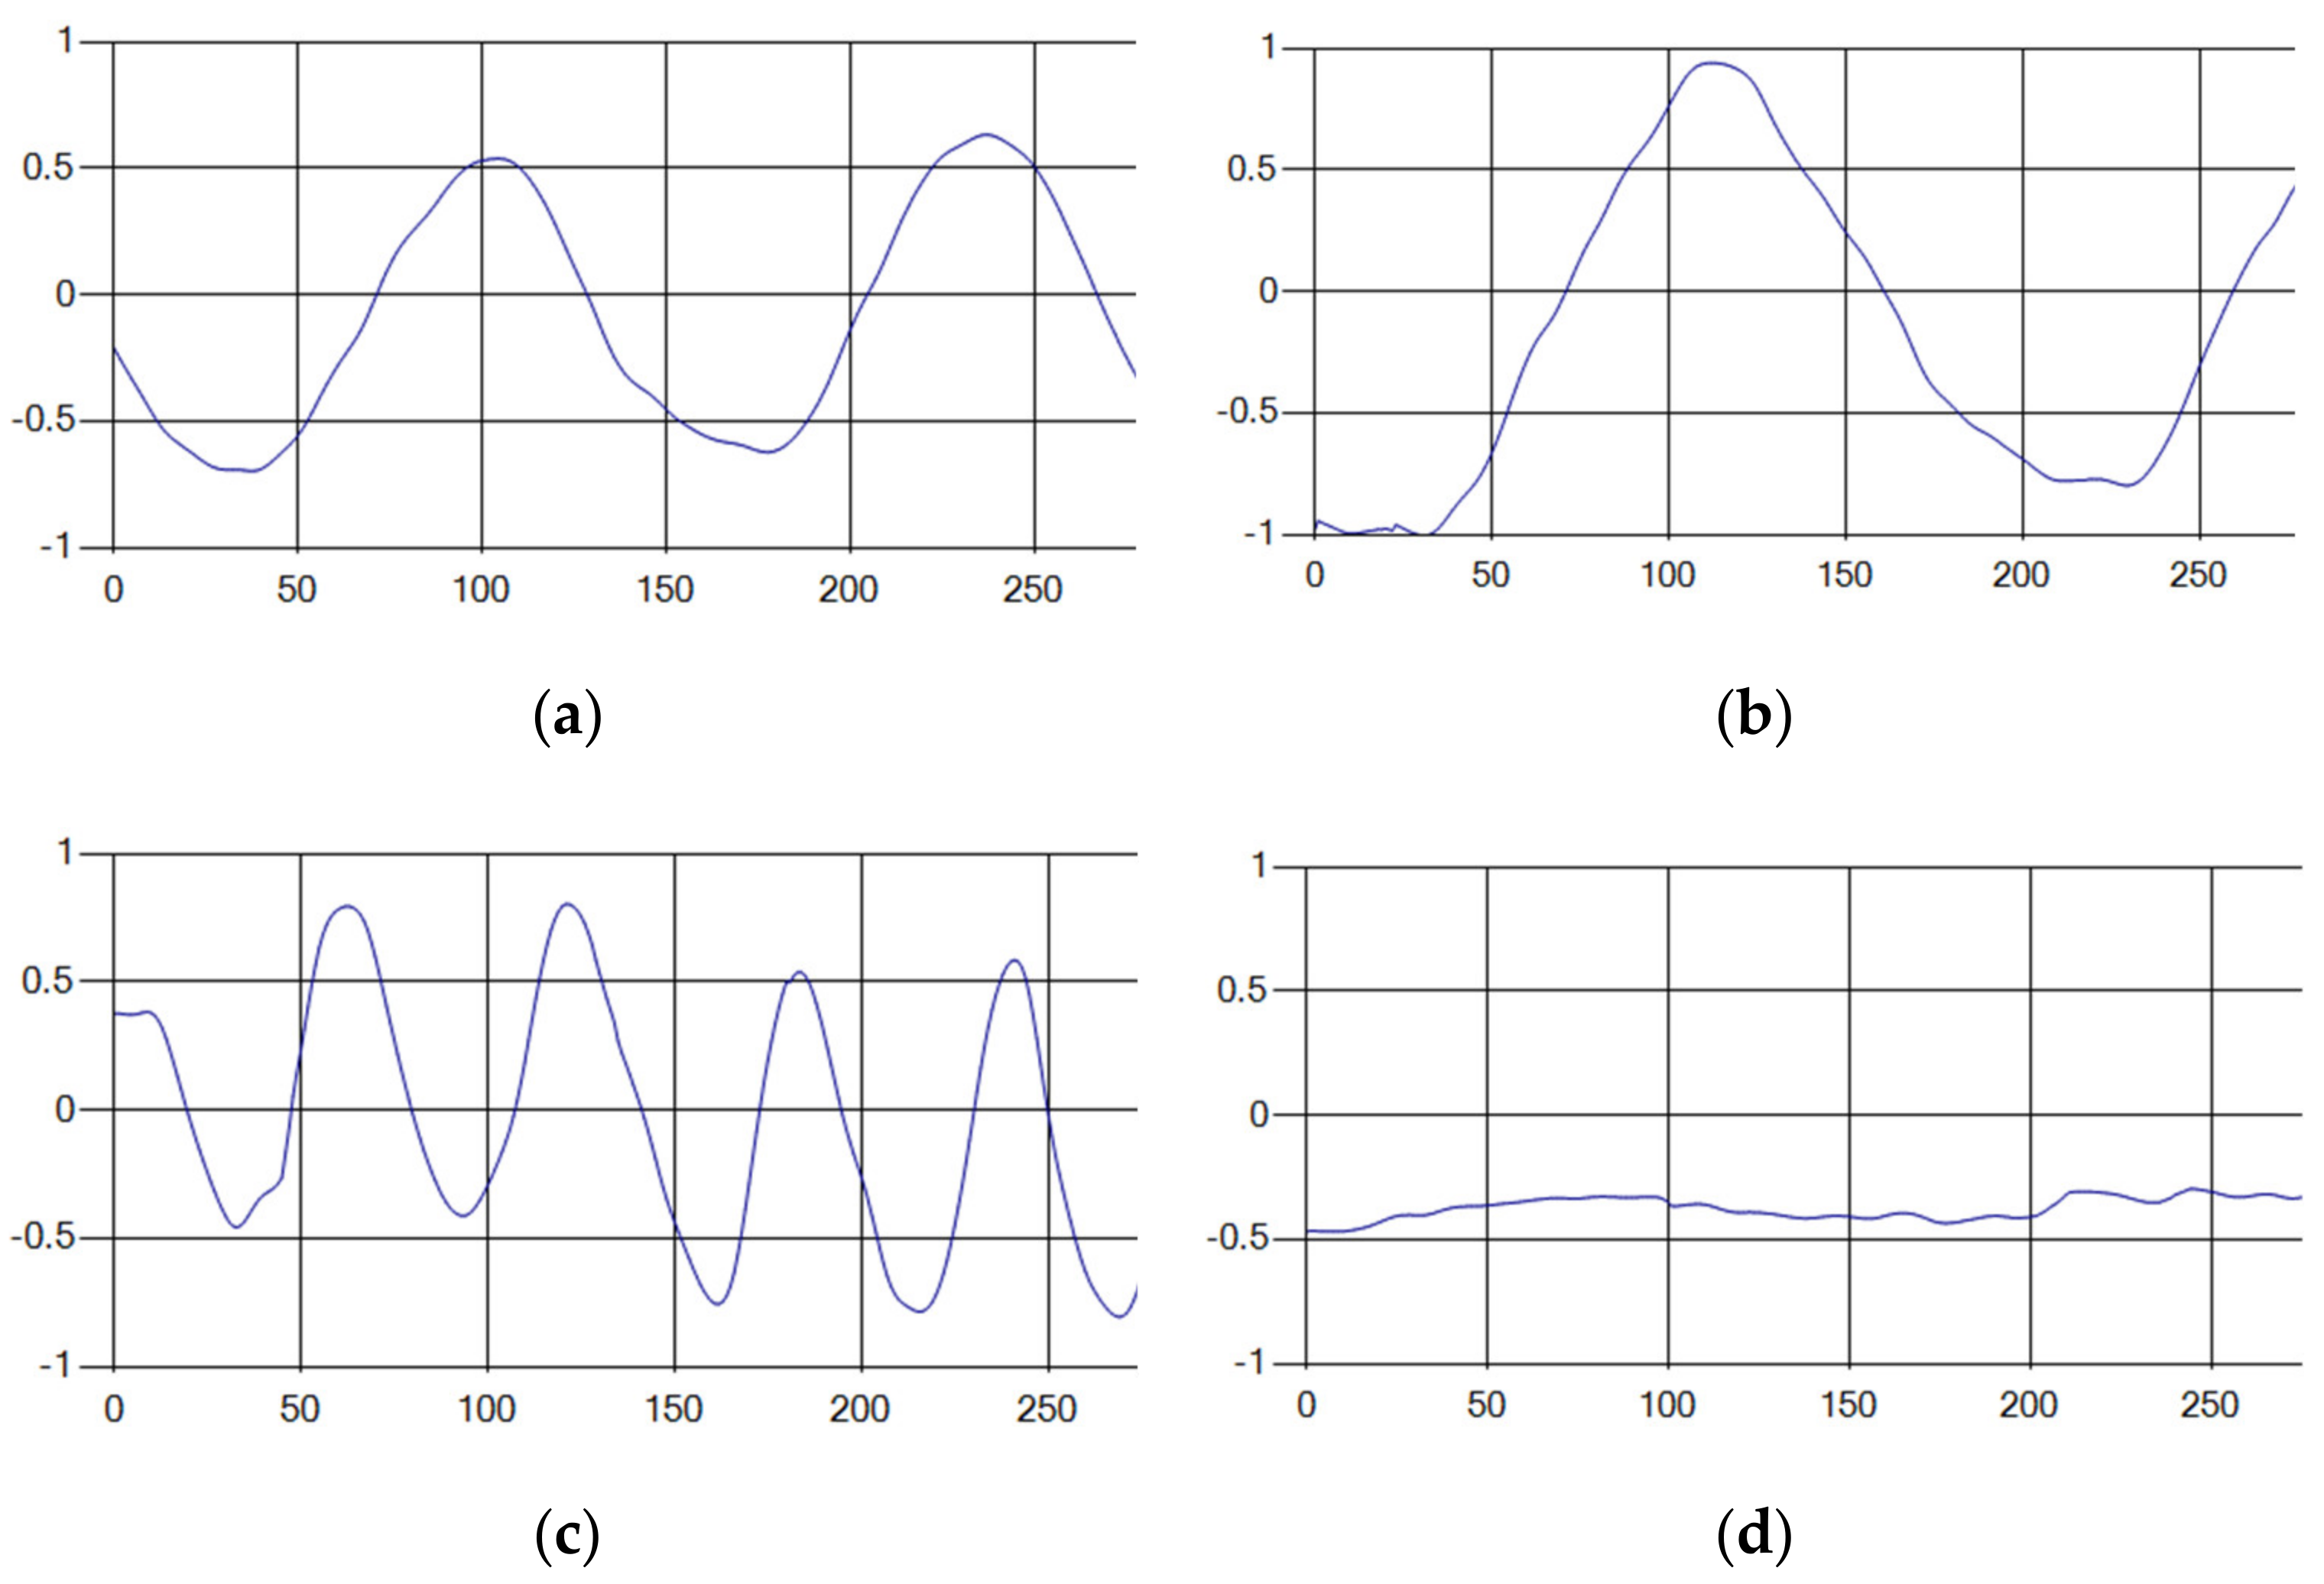
The respiratory signals of the UWB sensor rise in inspiration and descend in expiration. The amplitude of the respiratory signal is determined by the degree of deep respiration, and, as the length of one respiration lengthens, the period of the signal increases [
25,
26,
27,
28].
These respiratory signals appear in various forms depending on the type of respiration, and the medical field defines the respiration type as given in
Table 2 based on the number of respirations per minute [
29,
30,
31].
Each respiration type is measured using a UWB sensor (
Figure 1), and each signal demonstrates a distinct difference.
2.2. 1D CNN for Signal Pattern Recognition
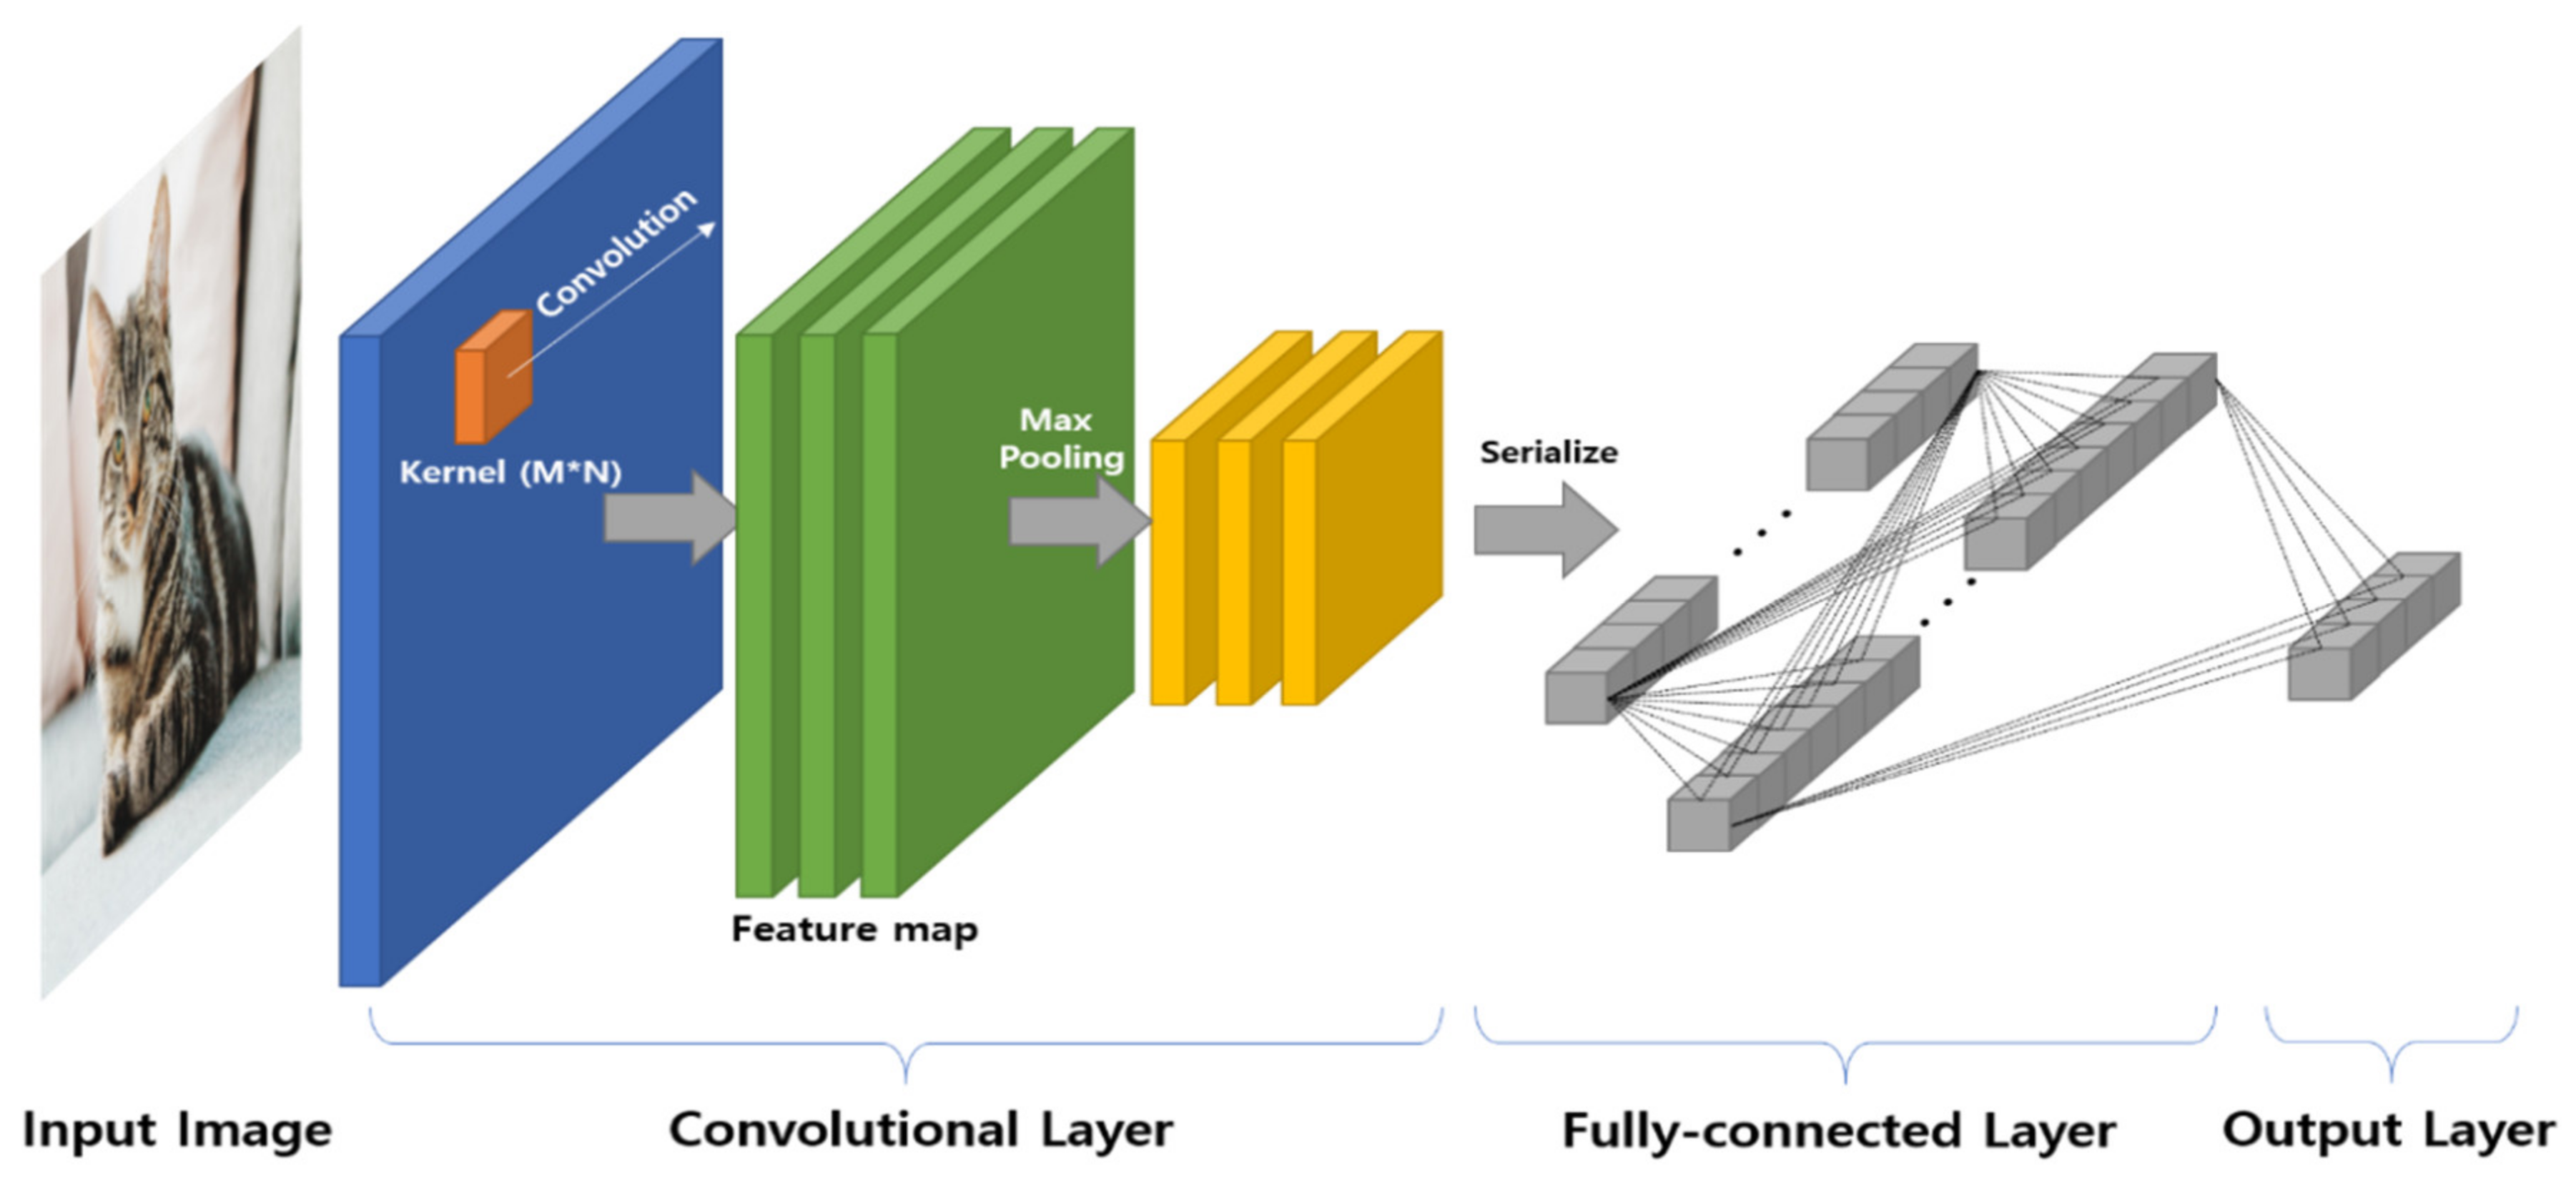
Generally, CNNs are used for object detection or recognition based on image data. Thus, as shown in
Figure 2, the convolutional layer uses an M × N type kernel for feature extraction of the image. In addition, features extracted by performing convolution with multiple kernels are processed into vector form and connected to the fully-connected layer.
In addition, this layer is connected to the output layer, and through an iterative learning process, a model that can derive the classification result is constructed.
The respiratory signal comprises a one-dimensional signal (rather than an image) to learn respiratory patterns using an existing CNN. Therefore, the respiratory signal must be transformed into two-dimensional image data. However, since one-dimensional data have time continuity, if the data are transformed into two-dimensional data, the time continuity characteristic for a respiratory signal may be impaired.
In addition, the structure of one-dimensional data changes to a matrix. As a result, unspecific features may be added between each row in the convolution result. Due to these problems, the performance of the neural network can be degraded. Thus, it is necessary to construct a CNN that is suitable for one-dimensional data characteristics.
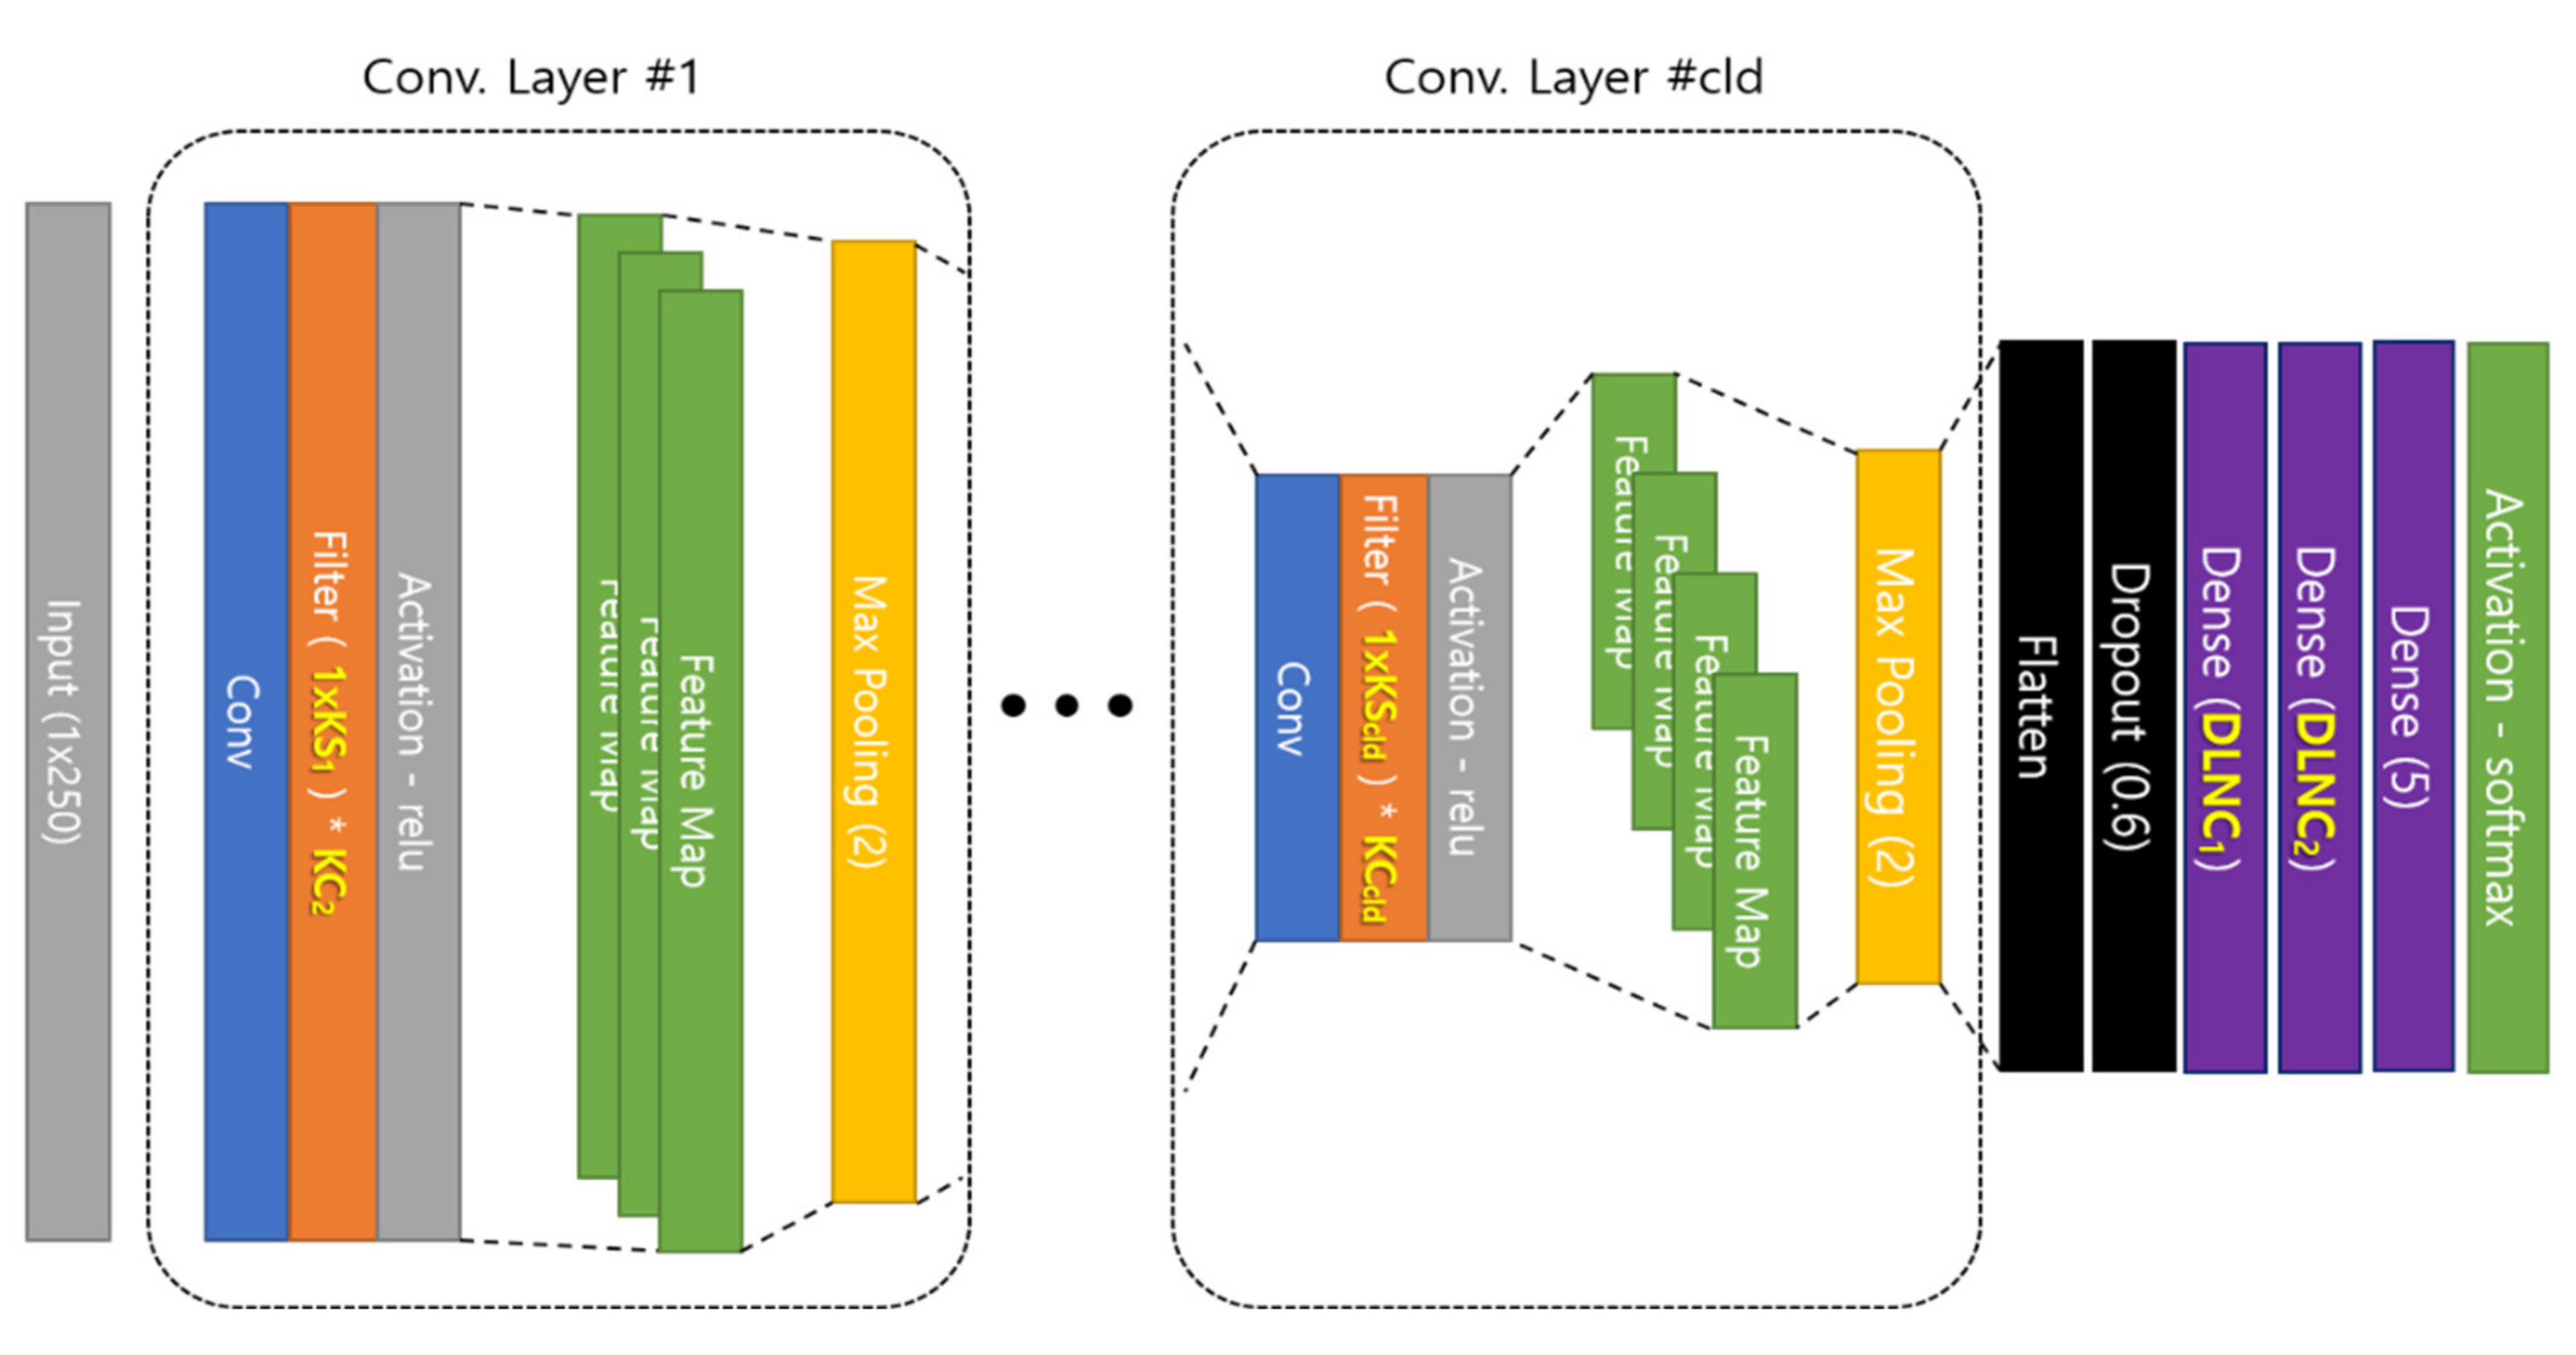
A CNN for learning the one-dimensional data is shown in
Figure 3. Here, the convolutional layer receives input data in the form of a vector and performs convolution using a 1 × N type kernel. As a result, the feature map is also extracted in the form of one-dimensional data. In the subsequent learning process, the fully-connected layer is structured in the same manner as a general CNN, and learning is performed via backpropagation.
As described above, a CNN can be designed with a structure to learn 2D and 1D data, and the optimization model is completed through feedforward and backpropagation processes. For learning via backpropagation, learning proceeds with various optimization techniques. Generally, stochastic gradient descent (SGD) based on the gradient descent method is employed.
Recent deep neural networks use several optimization methods to improve SGD. Such methods attempt to minimize errors for various hyperparameters and learn the data of a given neural network. Thus, the hyperparameter settings are largely determined by existing studies or experiments.
2.3. Hyperparameters in 1D CNN
The hyperparameters in a CNN can be composed of various components depending on the structure of the neural network. The basic hyperparameters are shown in
Table 3. Here, kernel size and kernel count are the most influential factors relative to recognition or detection performance. The hyperparameters other than the kernel size and kernel count in
Table 3 are already reported the ranges of values close to optimization through various studies [
32,
33,
34].
However, the kernel size and count should be applied differently depending on the characteristics of the input data. Thus, the kernel size and count must be found through repeated experiments or experience.
Methods to optimize these hyperparameters have been studied in various ways. The basic optimization methods are summarized as follows.
Manual search: This method sets the hyperparameter value depending on the researcher’s intuition or experience and can be used when the understanding of neural network structure and learning data is high. However, this method is inefficient because hyperparameter setting criteria are very ambiguous and many experiments are required.
Grid search: This method finds the hyperparameter that yields the best performance by predetermining several values for each hyperparameter and combining the values.
Random search: This method finds the best combination by setting the minimum and maximum range of values that each hyperparameter can have and selecting values randomly within the specified range. This method can be better than the manual search and grid search methods in terms of performance over time.
Bayesian optimization: Bayesian optimization constructs a specific range of value for a hyperparameter based on a good case studied in the past and optimizing within the determined range. This method has good performance over time but must be studied previously.
In the existing study of respiration pattern recognition using the UWB sensor signal, the 1D CNN hyperparameters were optimized using the grid search method. However, to improve the neural network’s performance, a better method to optimize hyperparameters is required. The Bayesian optimization method, which demonstrates good performance, can be used when existing studies are abundant; however, for 1D CNN-based respiration pattern recognition, it is difficult to use this method due to a lack of related studies. The random search method can also take a very long time because it optimizes the values randomly selected for given ranges without prescribed rules.
2.4. Harmony Search Algorithm
The harmony search (HS) algorithm solves optimization problems based on stochastic theory. This algorithm solves such problems by modeling the process for the music-inspired player to produce better chords.
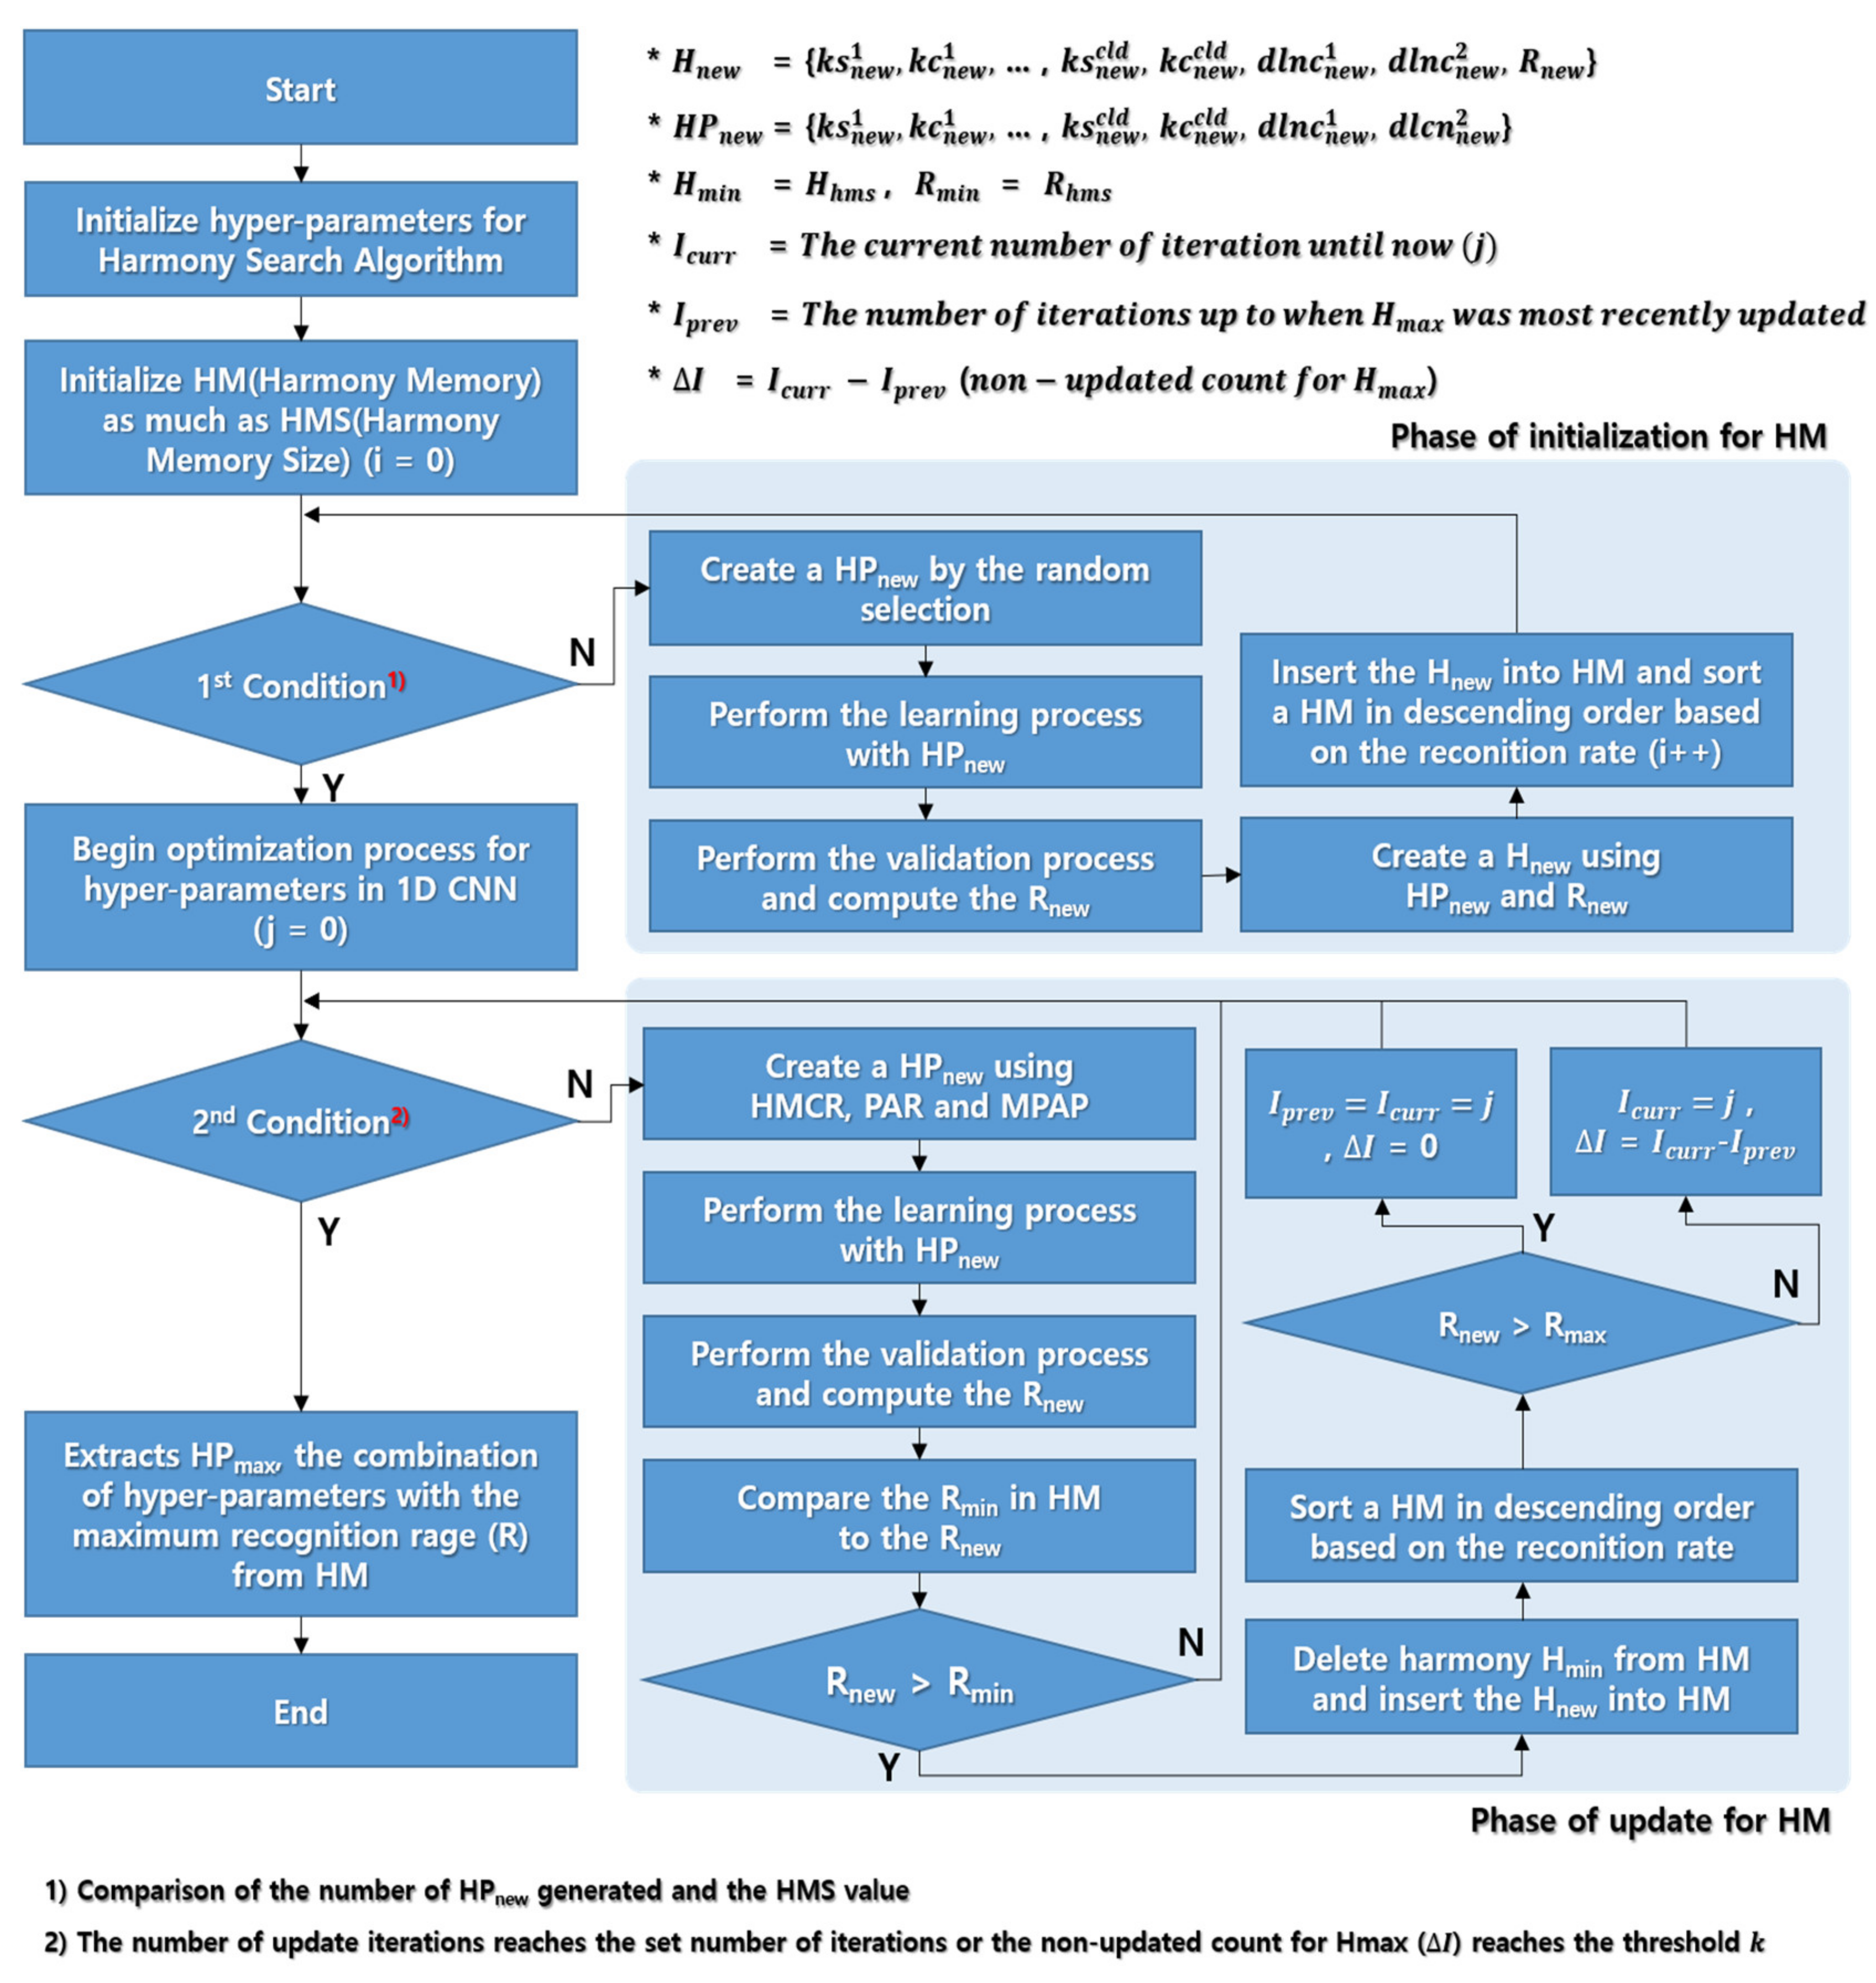
The HS and genetic algorithms are similar relative to the method by which they probabilistically approach the solution through a random process; however, they differ in the process of constructing the initial value group. The HS algorithm comprises five processes, i.e., the initial value setting, harmony memory (HM) initialization, new harmony creation, HM update, and repetition processes [
35,
36].
Step 1: Initial value setting
To optimize the hyperparameters used in the HS algorithm, initial values must be set for the hyperparameters. Here, the HS algorithm has three parameters, i.e., harmony memory size (HMS), harmony memory considering ratio (HMCR), and pitch adjusting ratio (PAR). In addition, an objective function is required. The objective function is used to evaluate the quality of various chords, and the optimization problem is solved by maximizing or minimizing the value of the objective function.
Step 2: Initialize harmony memory
Harmony memory is used by the player to find the best chord among multiple chords, and one chord comprises several variables. The number of initialization chords is configured to have the HMS, and the objective function is set to evaluate the chord. During initialization of HM, the values of each variable are determined by random selection. Here, the value is selected in the range of the random selection for each variable. The objective function is calculated by the values of the variables comprising harmony, and the HM is updated with the values of the variables and the objective function.
Step 3: Create new harmony
This process removes bad chords from HM and finds better chords. Here, the HS optimization hyperparameter HMCR is used to determine whether to create a completely new chord or make a chord by slightly adjusting the existing chords. The HMCR is set to a real value between 0 and 1, and, if this value is too low, new chords are created frequently, which can be result in an inefficient optimization process. Conversely, if the HMCR value is too high, the existing chord is selected frequently and searched around it; thus, there is a risk of falling into the local minimum or maximum. Therefore, it is necessary to find a suitable HMCR to ensure sufficient performance of the HS algorithm. When using an existing chord in the HMCR, it is necessary to adjust the pitch, which is determined by hyperparameter PAR, which is set to a real value between 0 and 1. Here, if the value is large to be close to 1, it is used by changing the existing chord. In addition, when the pitch is corrected by PAR, the amount of change is adjusted by the maximum pitch adjustment proportion (MPAP) and maximum pitch adjustment index (MPAI) values. MPAP is a pitch adjustment value used for discrete variables, and MPAI is a pitch adjustment value used for continuous variables. Pitch adjustment values serve to search around existing chords. If the value is small, a local search is performed, and if it is large, a wide range is searched.
Step 4: HM update
For chords newly created by HMCR and PAR, the objective function value is calculated for comparison with other chords. Then, the objective function value of the new chord is compared to the worst chord of the HM composed so far. Here, if the new chord is better than HM’s worst chord, the bad chord is replaced by the new chord.
Step 5: Iteration and results
Steps 3 and 4 are performed as many times as the set number of iterations, and optimization is finished by selecting the chord that demonstrates the best performance in the final HM. The performance of the HS algorithm is ultimately determined by the values of HMS, HMCR, PAR, MPAP, and MPAI. These five variables should also be set to appropriate values in reference to existing studies or experiments.
The HS algorithm has five hyperparameters to be set. Thus, it is possible to reduce the number of variables to be tested and effectively find the solution.
Therefore, this paper proposes an optimization method for 1D CNN hyperparameters based on the HS algorithm and demonstrates the superiority of the proposed method by applying it to existing 1D CNN respiration pattern recognition system.


