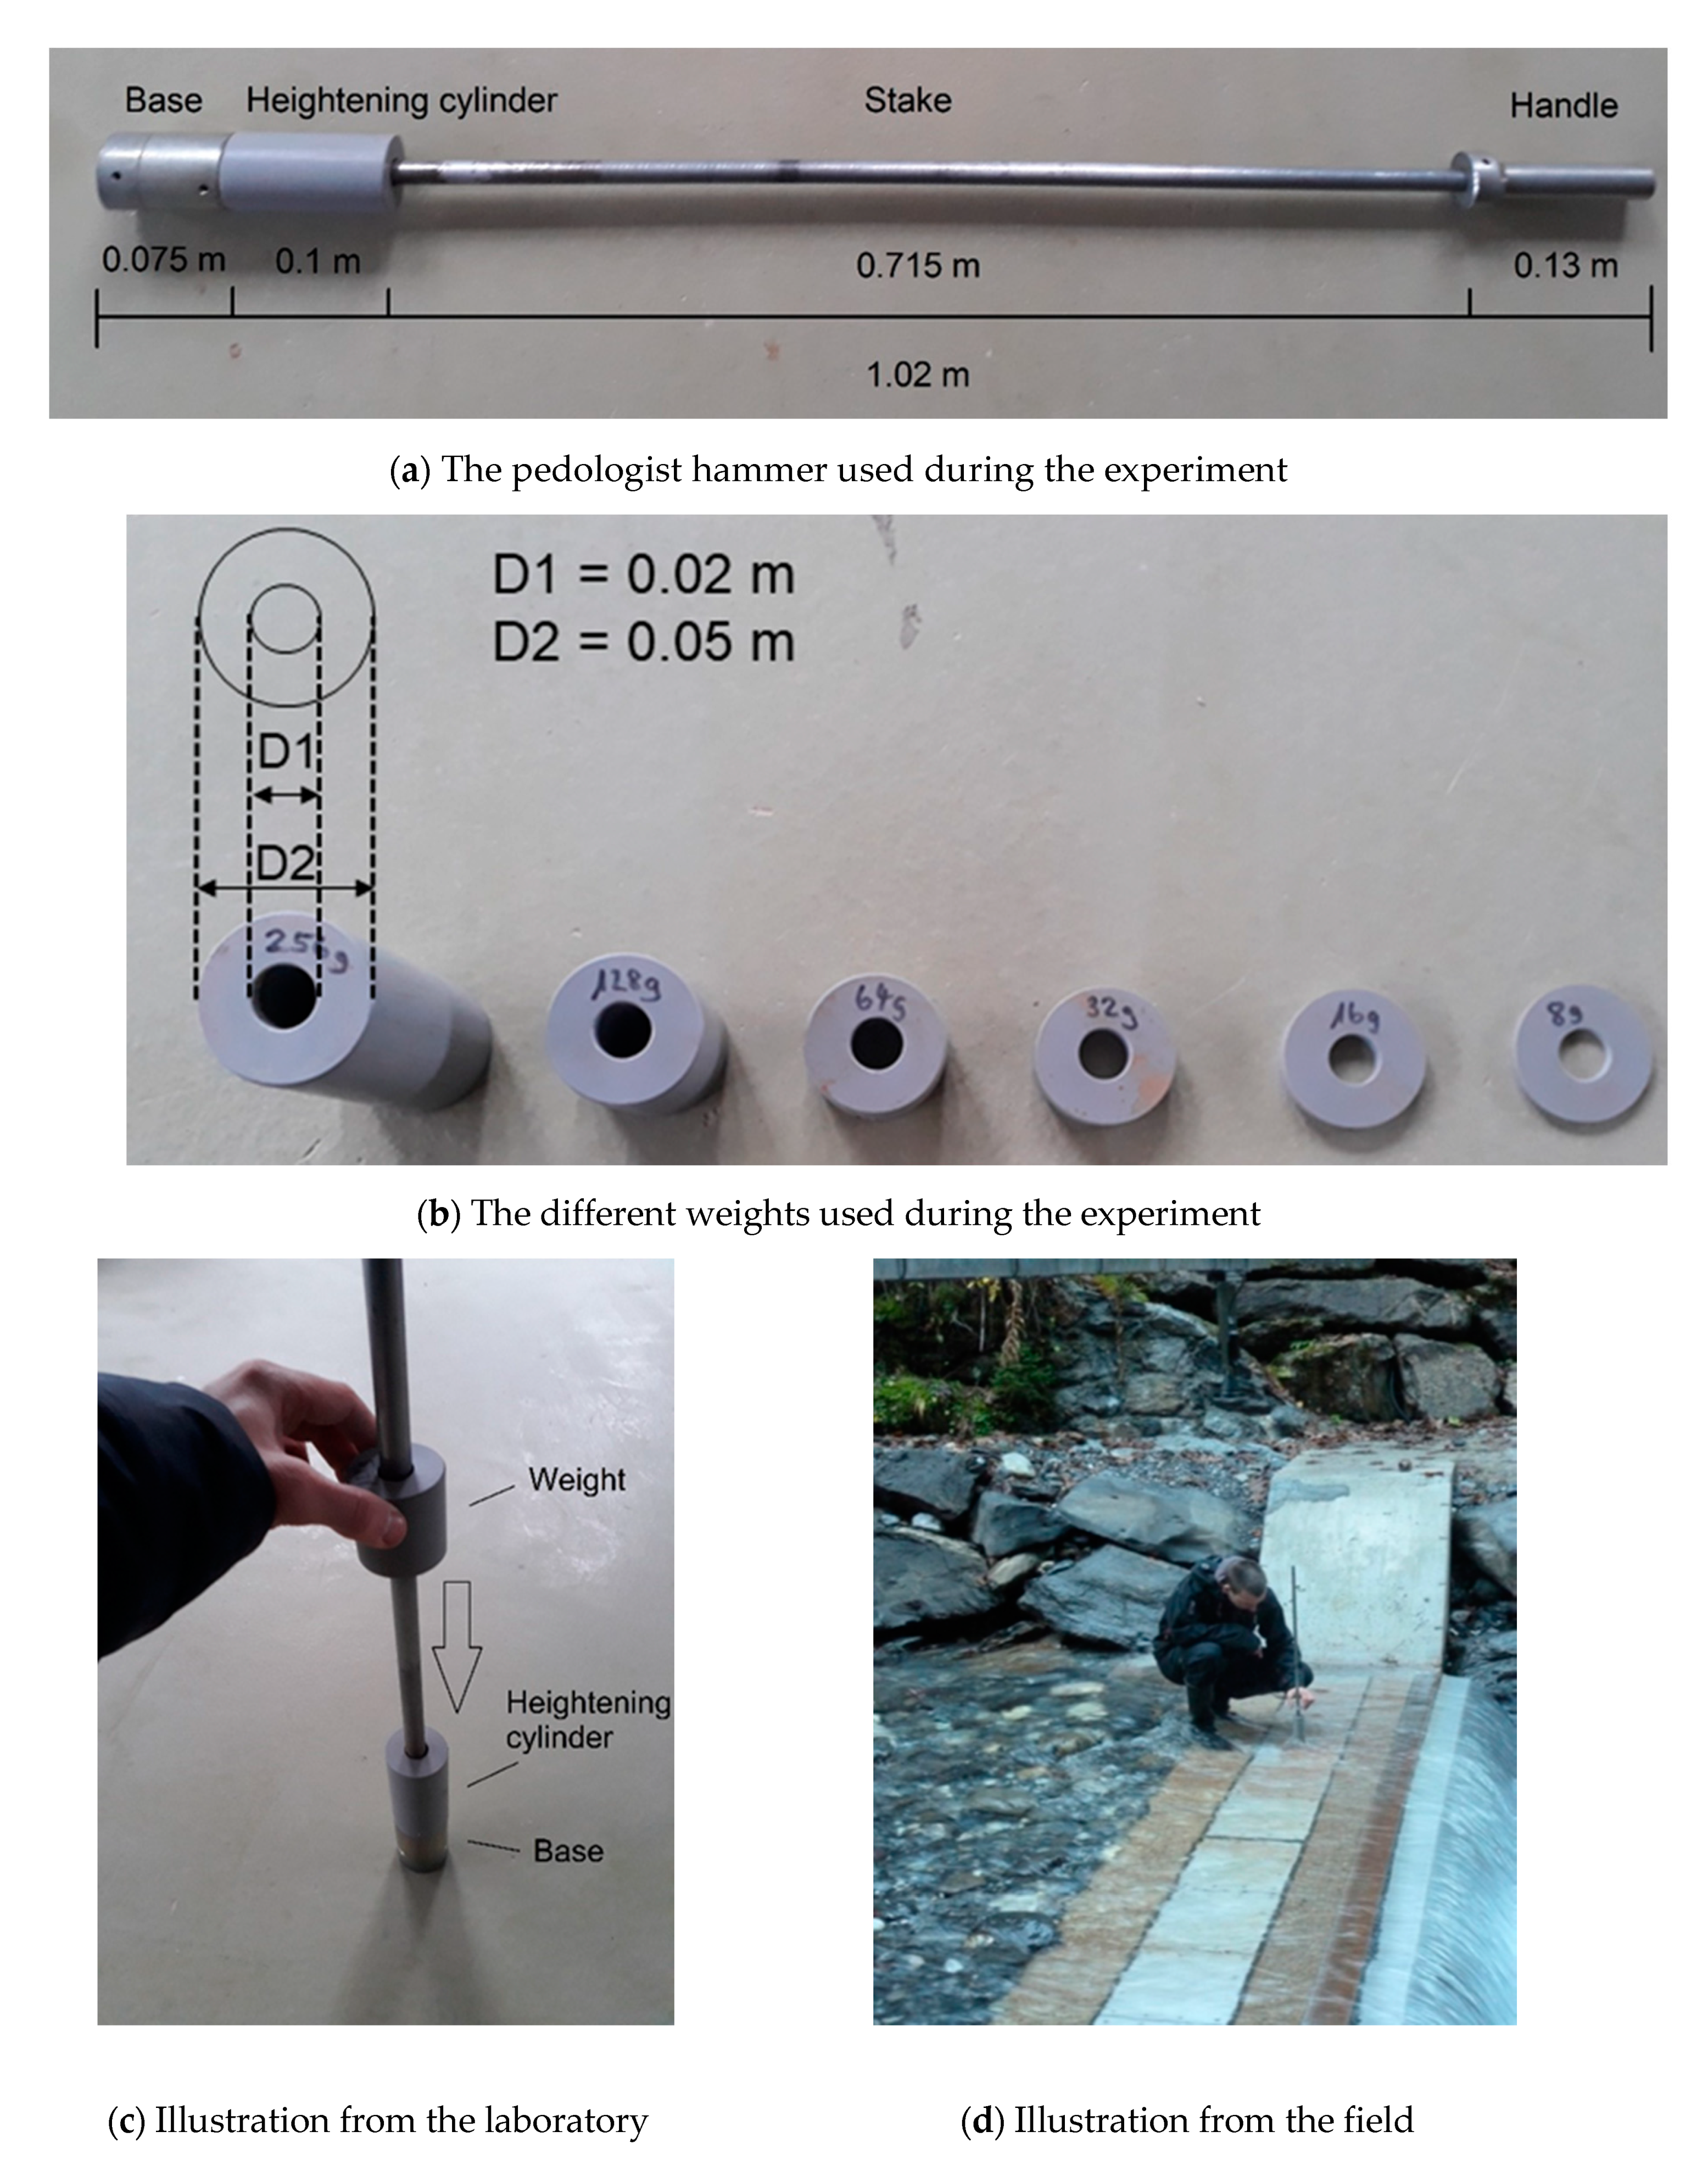
Figure 1.
Set up of (a) the pedologist hammer, (b) the weights used for the experiment, (c) illustration of the experiment in the laboratory and (d) in the field.
Figure 1.
Set up of (a) the pedologist hammer, (b) the weights used for the experiment, (c) illustration of the experiment in the laboratory and (d) in the field.
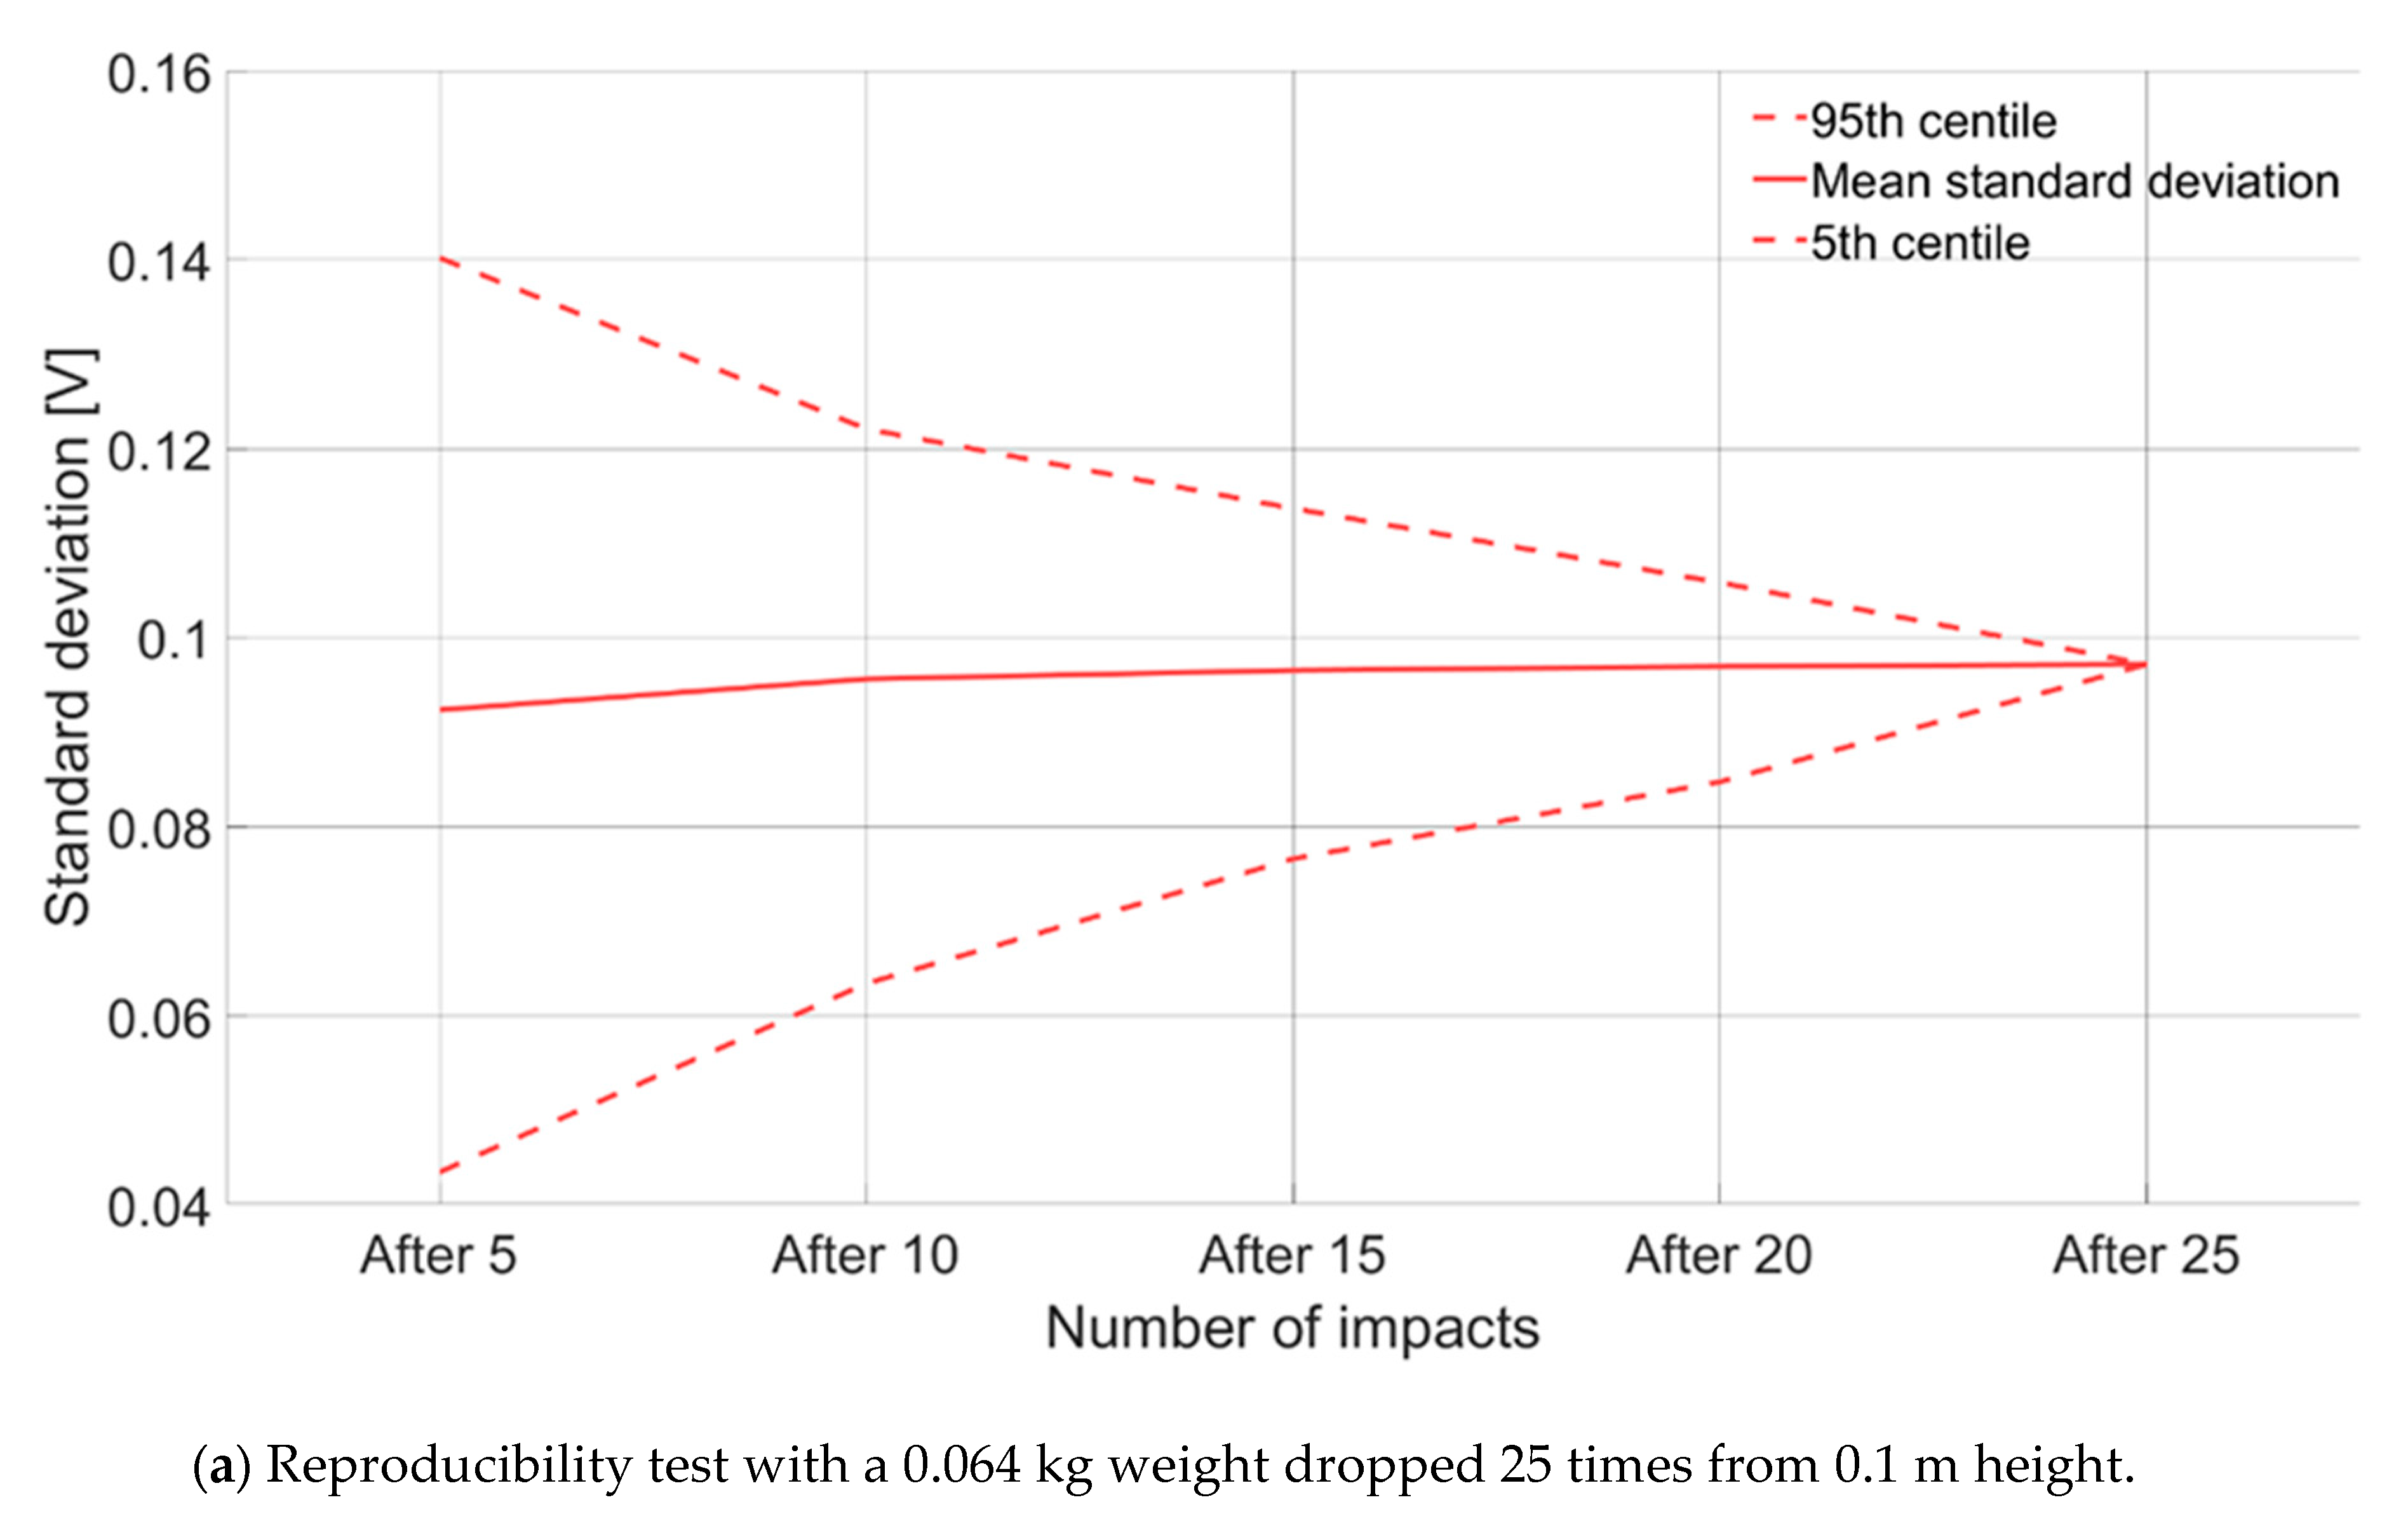
Figure 2.
(a) Reproducibility test conducted in the VAW laboratory with a weight of 0.064 kg dropped 25 times from a 0.1 m height, the graph shows the standard deviation of maximum amplitudes as function of cumulative number of tests calculated in 5 million random combinations; (b) voltage associated to 10 impacts induced by a 0.064 kg weight dropped from a 0.1 m height. The maximum positive amplitude (V) is recorded for each impact.
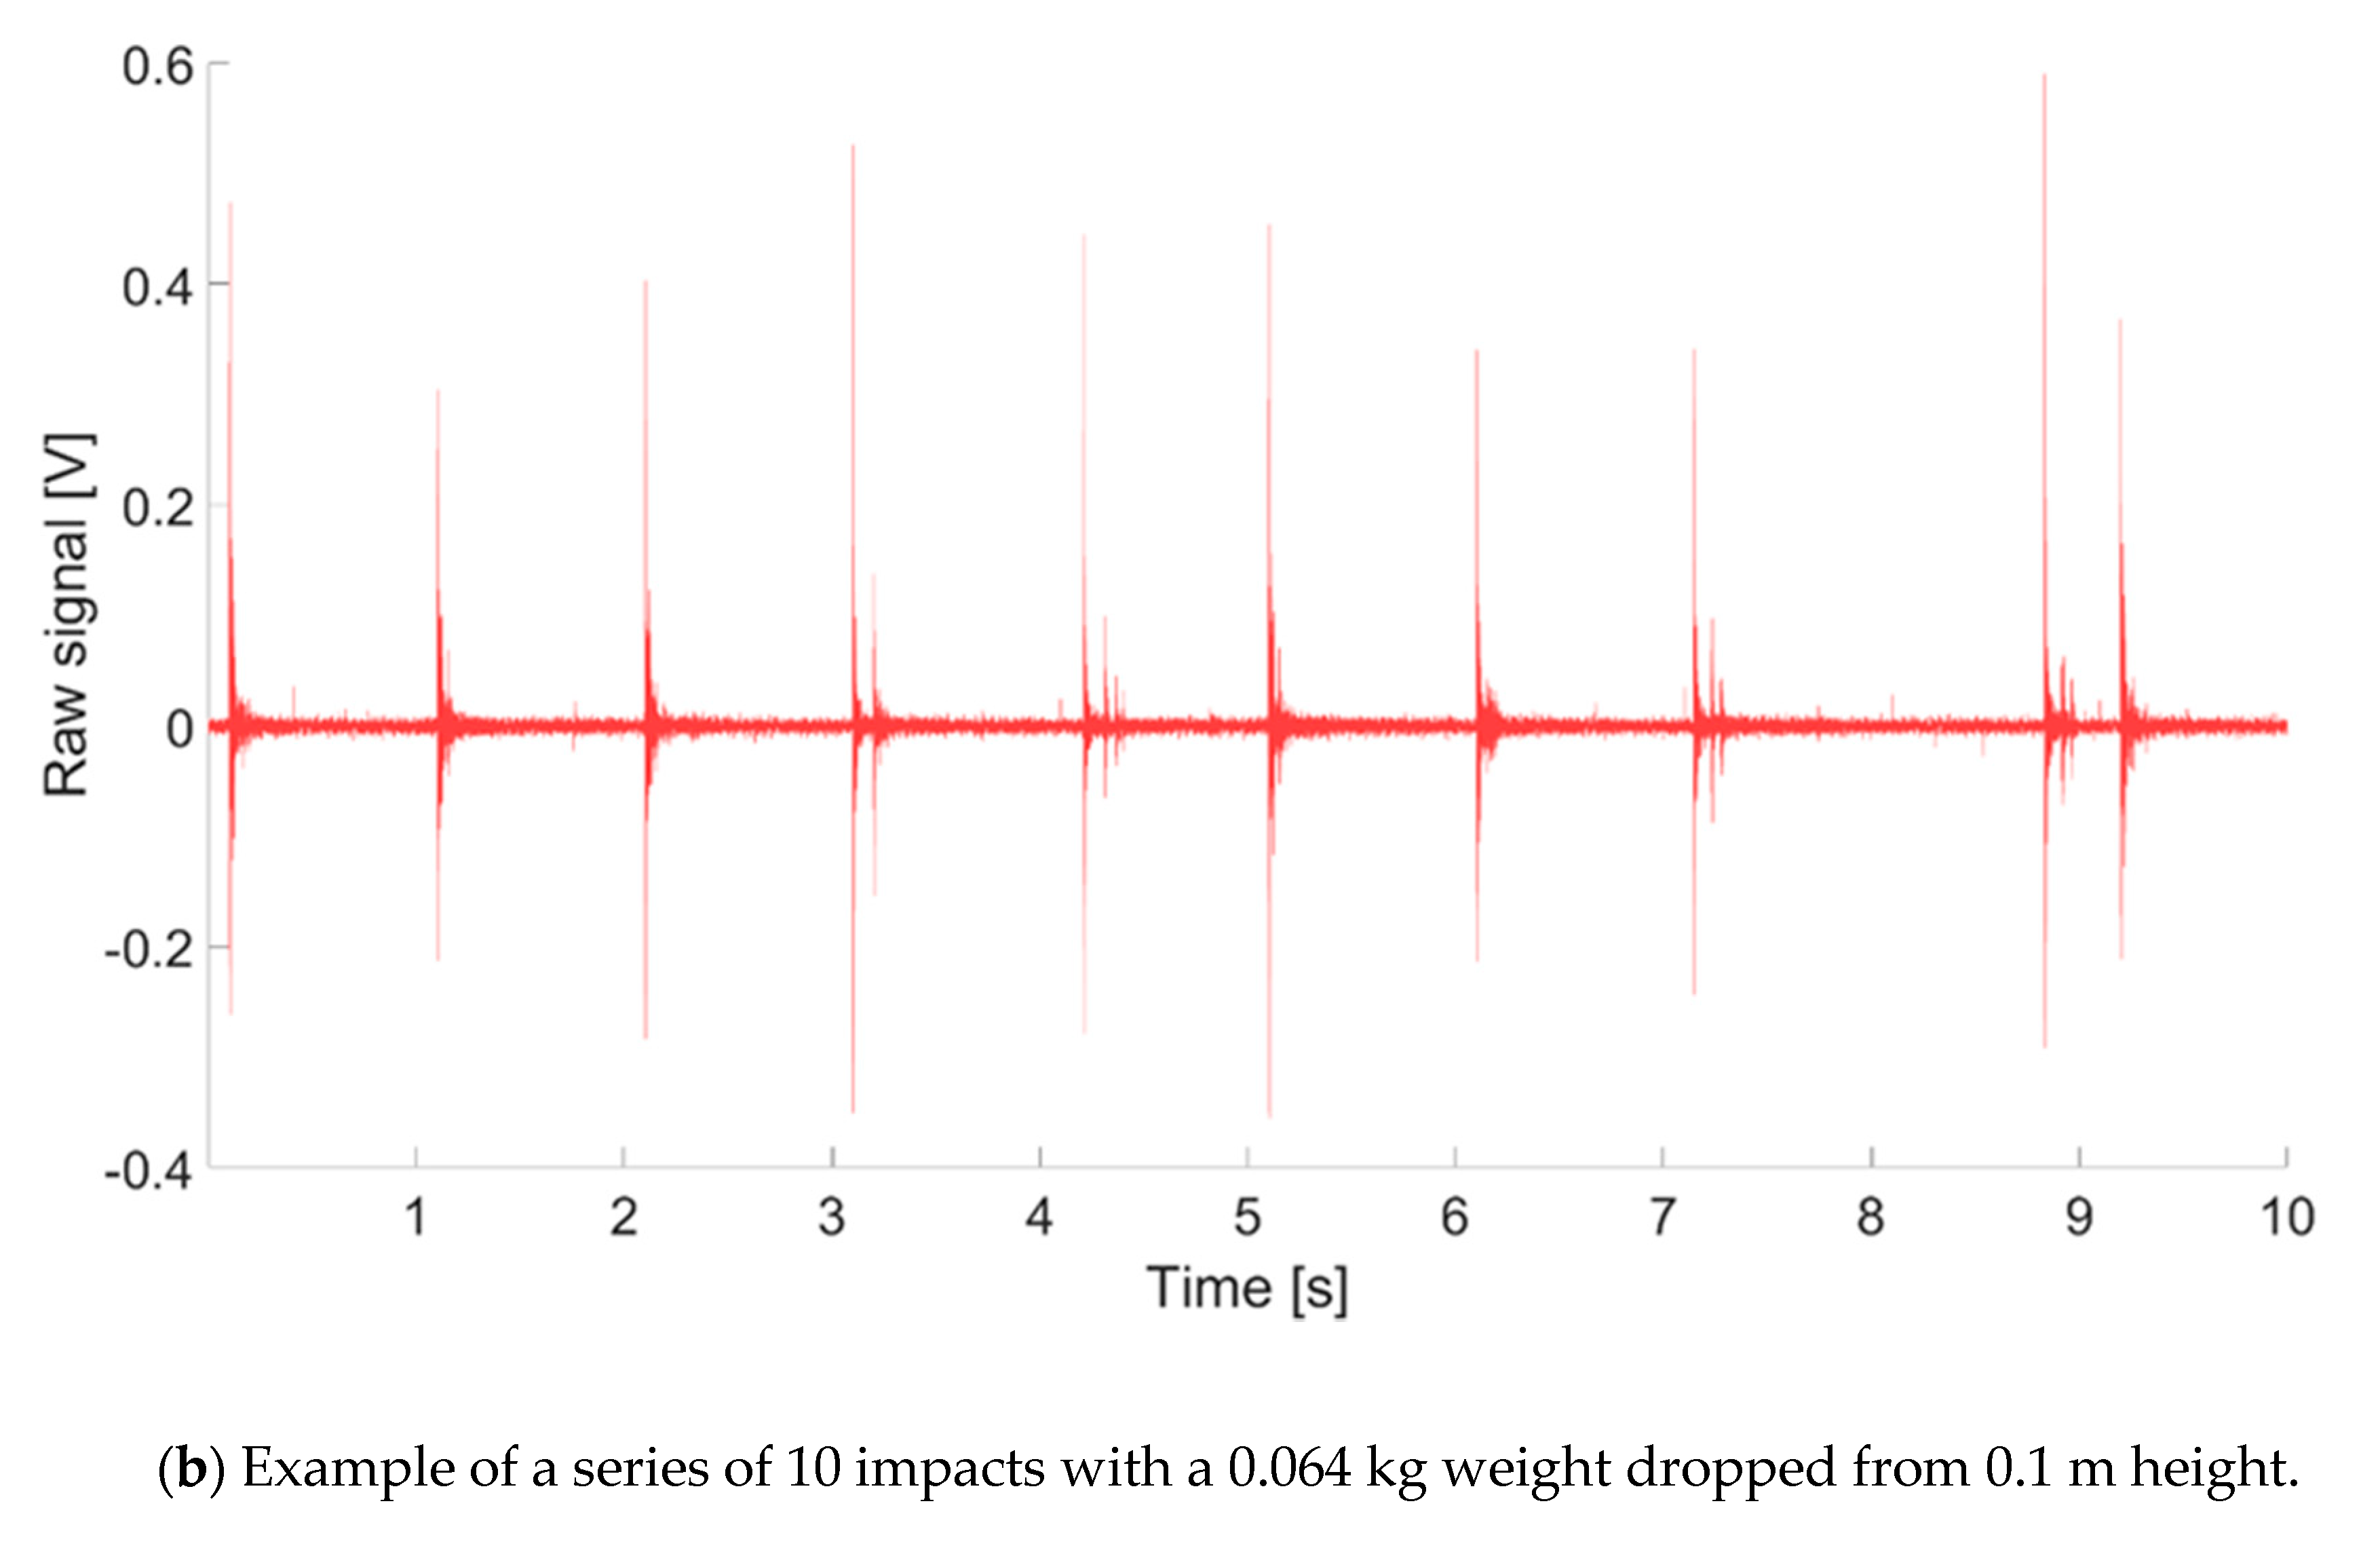
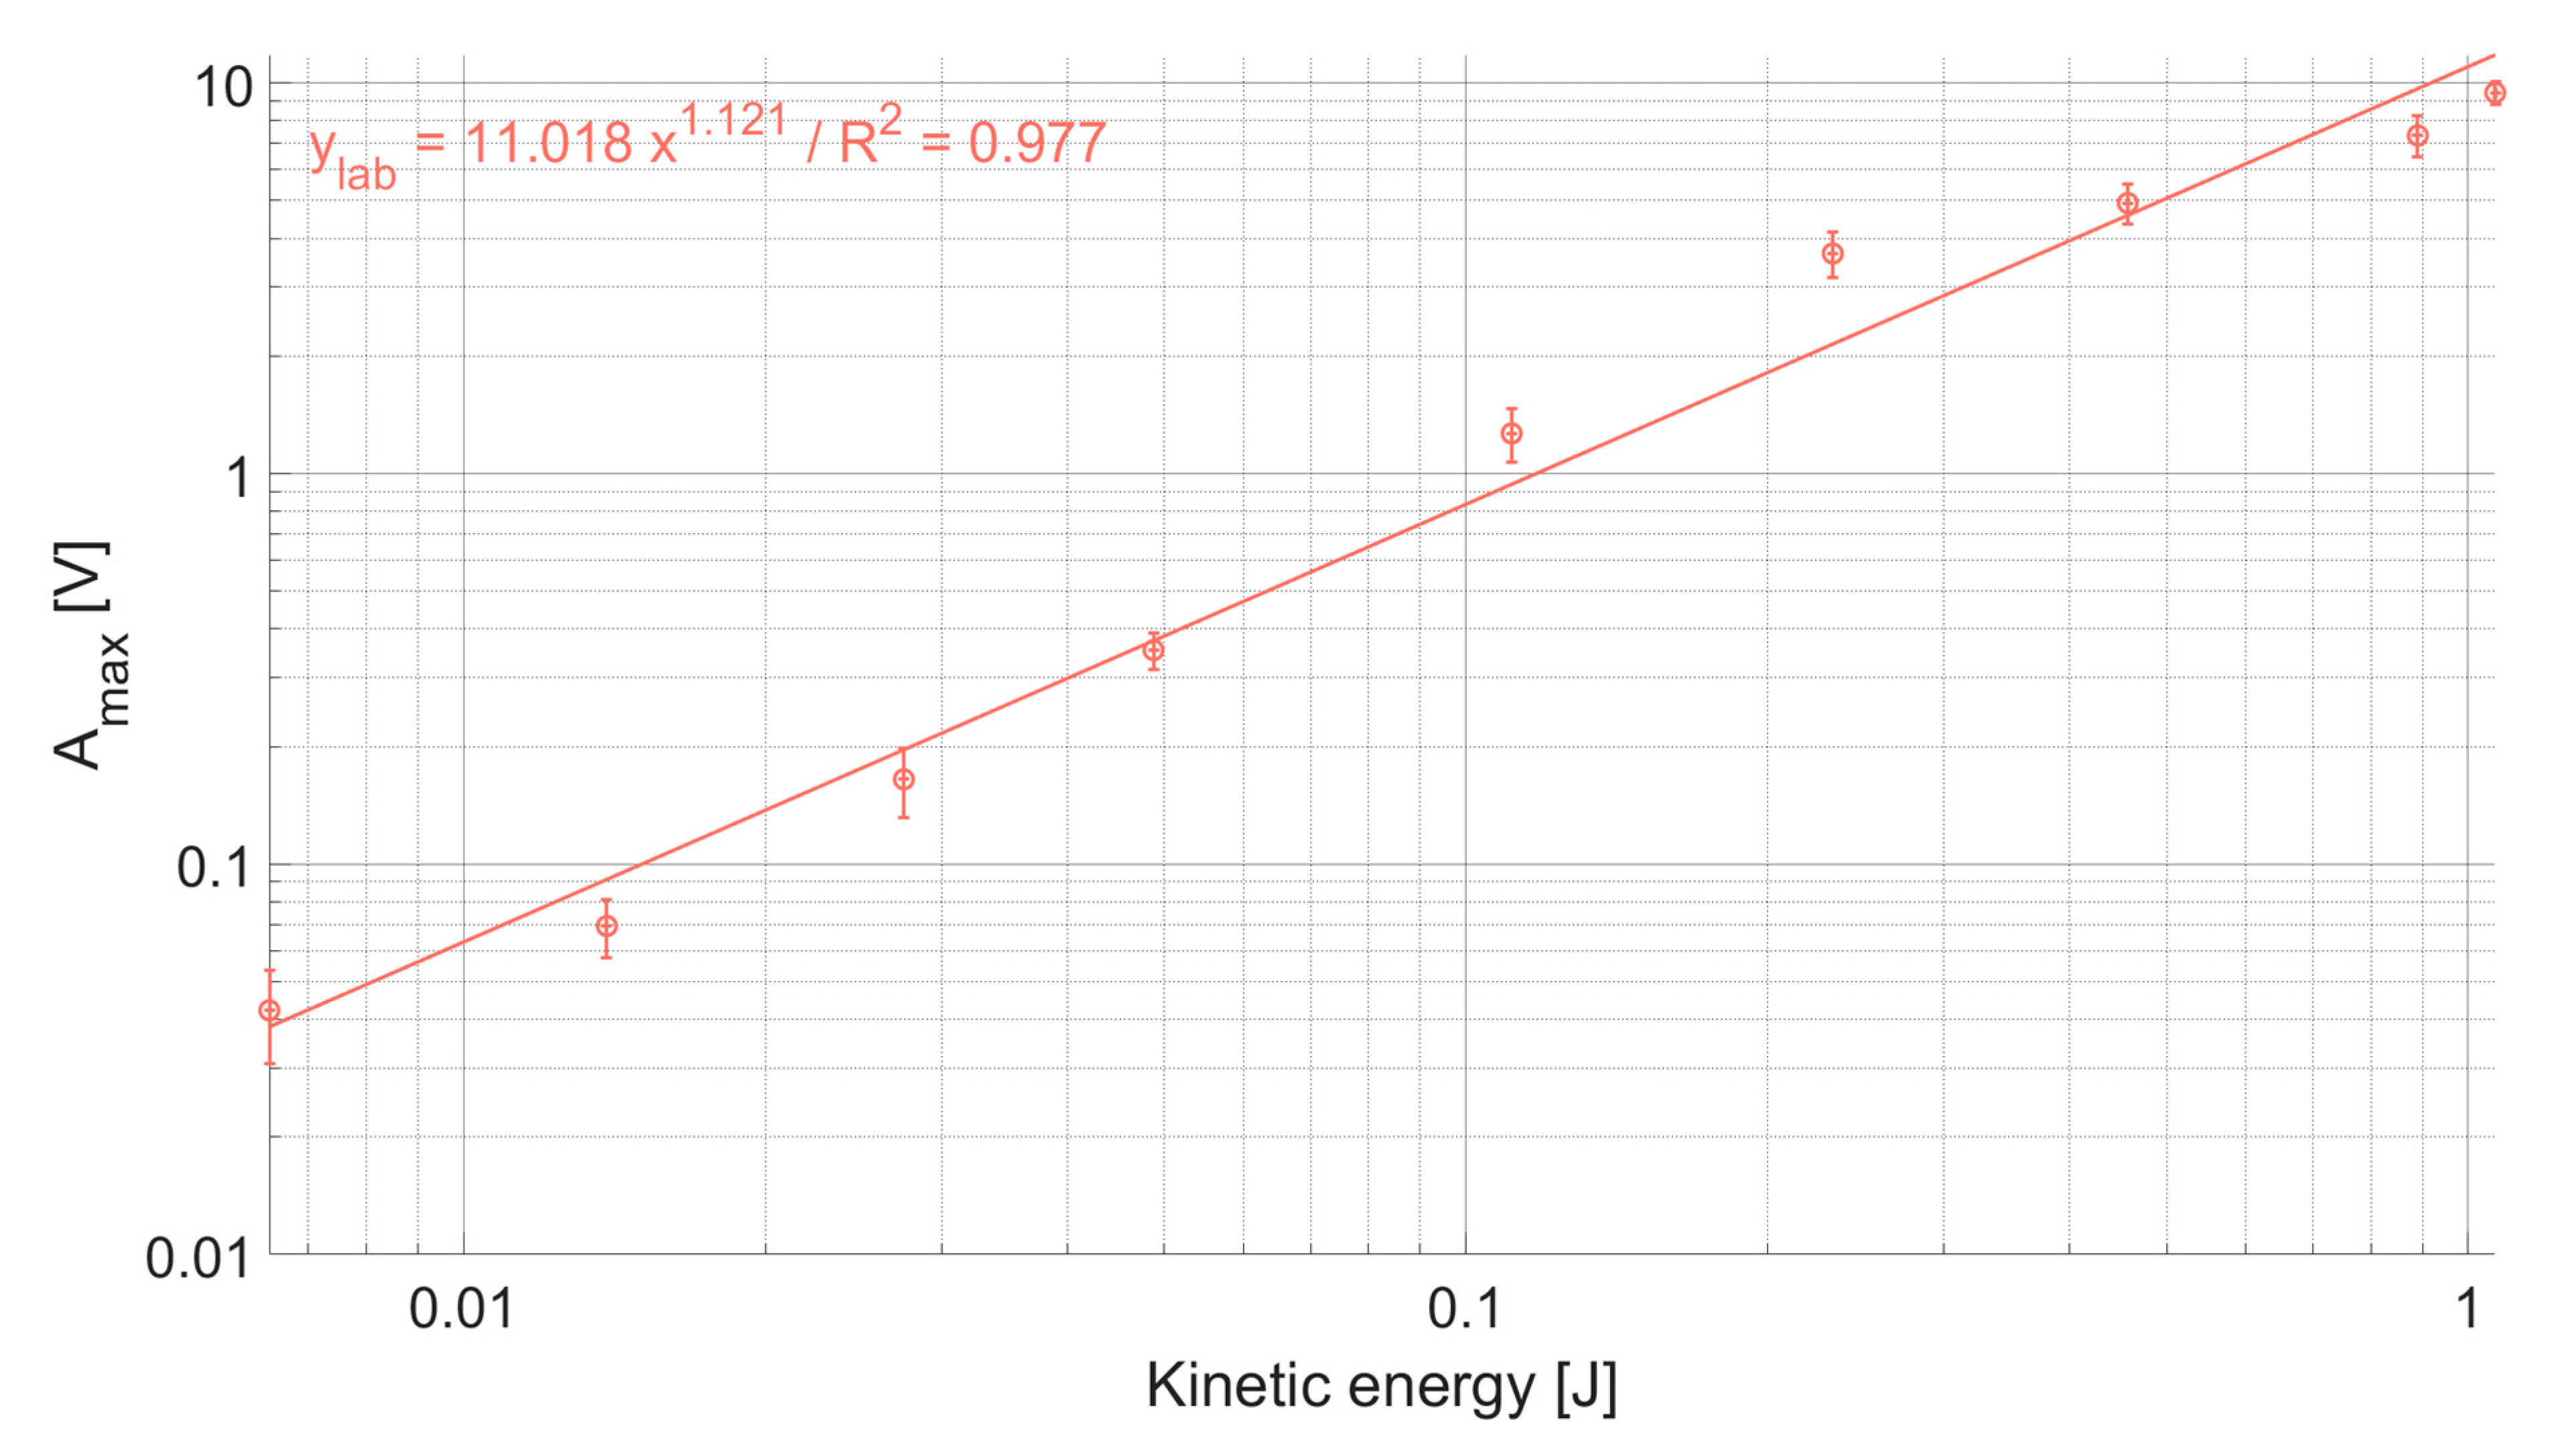
Figure 3.
The maximum amplitude Amax recorded by the laboratory plate is best expressed by a power law function of the kinetic energy released by the impact, with an exponent slightly above 1.
Figure 3.
The maximum amplitude Amax recorded by the laboratory plate is best expressed by a power law function of the kinetic energy released by the impact, with an exponent slightly above 1.
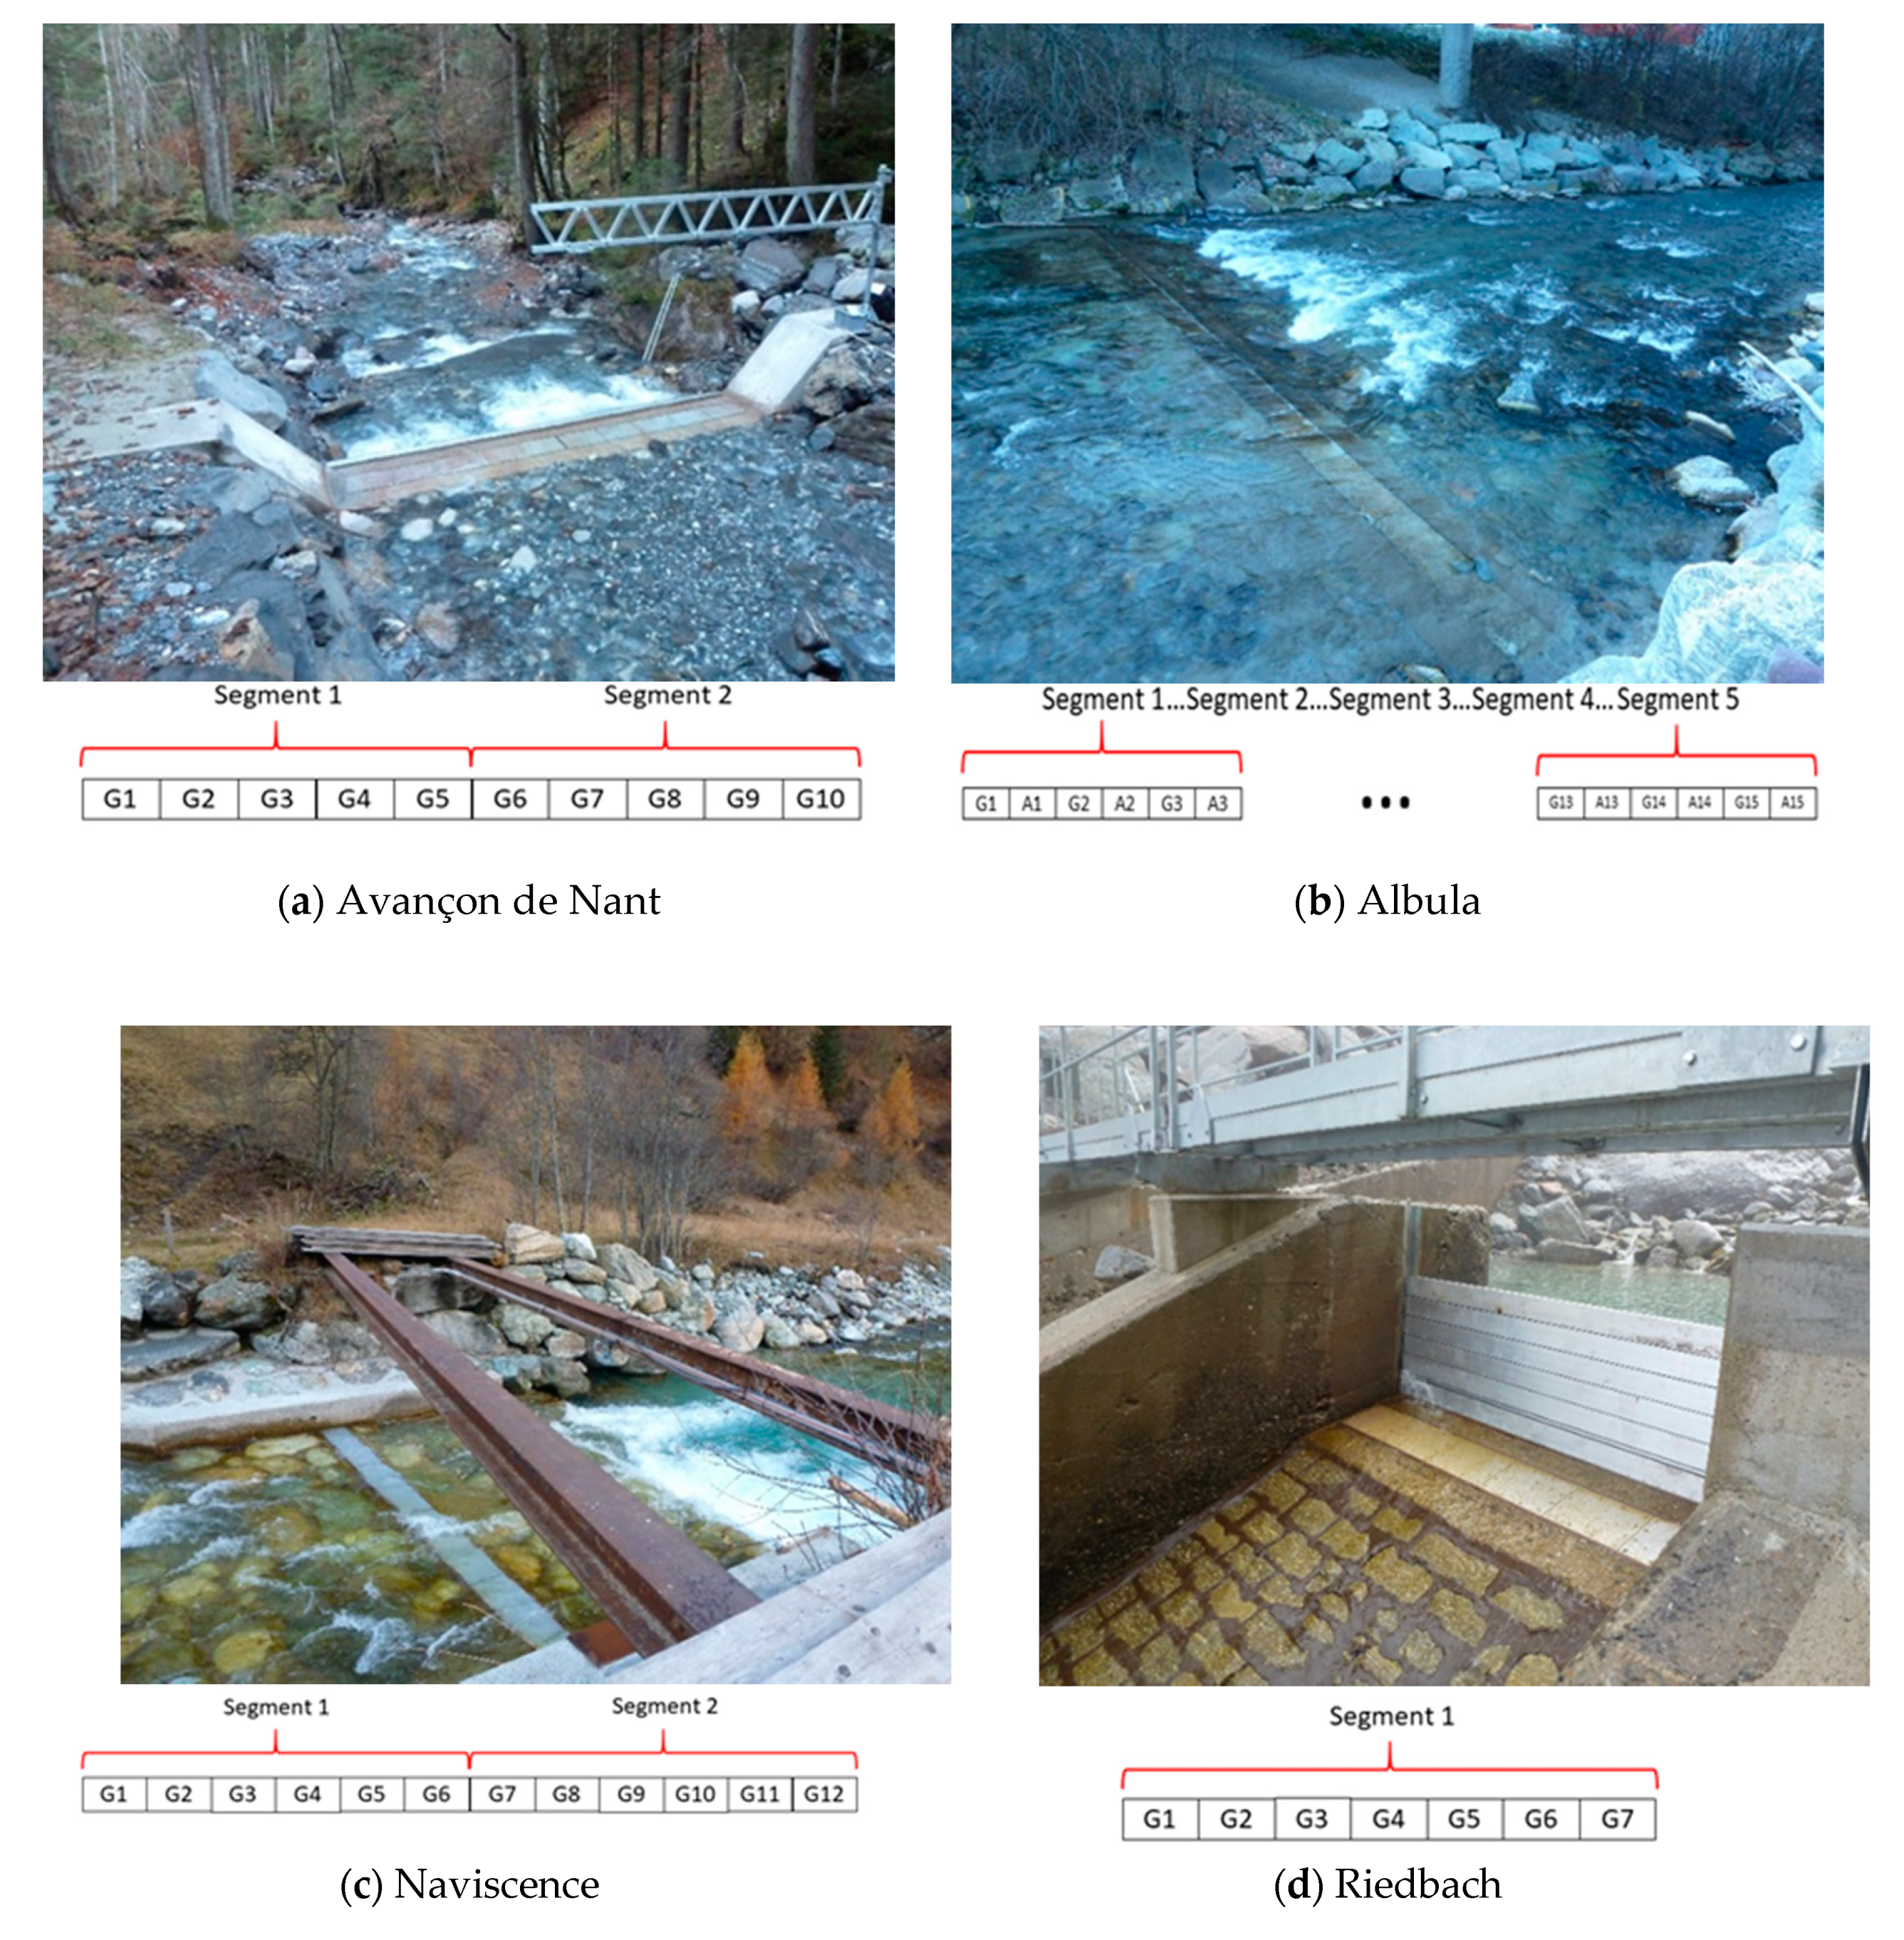
Figure 4.
The four measuring stations where the impact experiment was conducted and the setup of the plates and segments: (a) at the Avançon de Nant (Western Swiss Alps), (b) at the Albula (Eastern Swiss Alps), (c) at the Naviscence (Southern Swiss Alps), and (d) at the Riedbach (Southern Swiss Alps). The numbers on the plates give the Swiss plate geophone (SPG) number. At the Albula, plates ‘A’ are accelerometer sensors, the others labelled G are SPGs. The numbering is made with view in the downstream flow direction at the Avançon de Nant and Riedbach measuring stations, and the upstream flow direction at the Albula and Naviscence measuring stations.
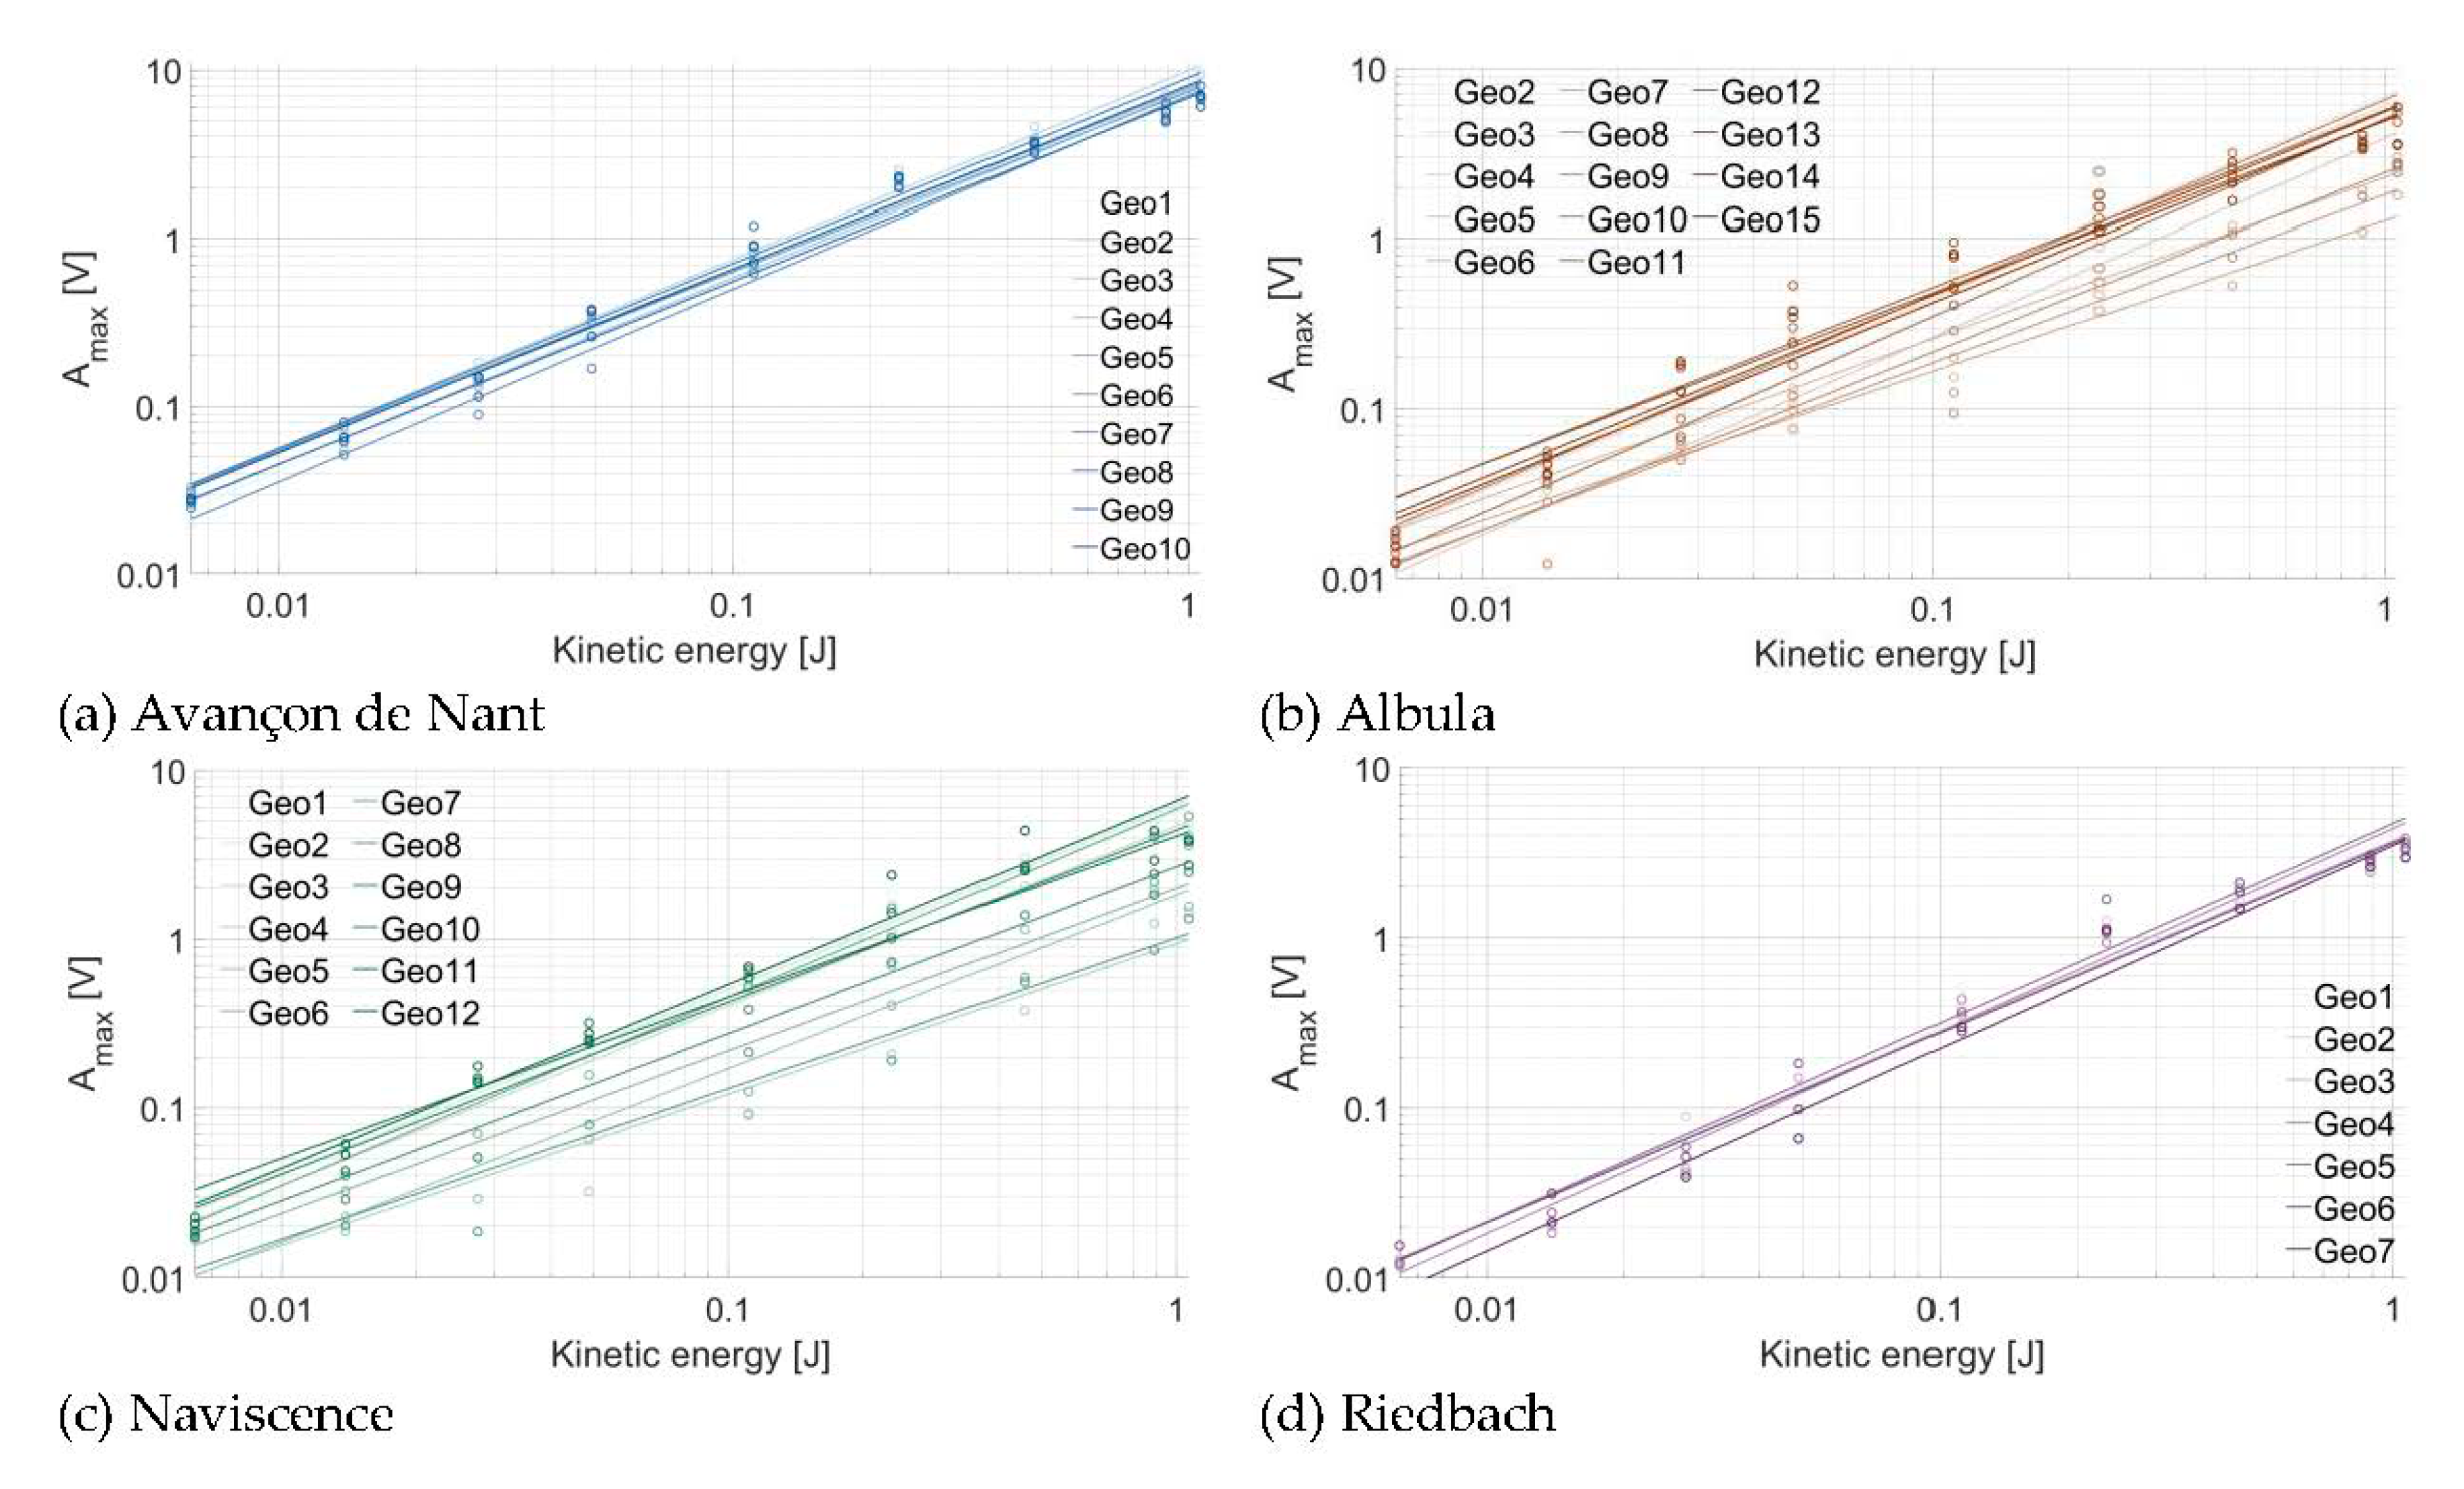
Figure 5.
Relationship between the kinetic energy (J) of the impact and the associated Amax at (a) the Avançon de Nant, (b) the Albula, (c) the Naviscence, and (d) the Riedbach. Each point represents the (V) of the given drop category repeated 10 times.
Figure 5.
Relationship between the kinetic energy (J) of the impact and the associated Amax at (a) the Avançon de Nant, (b) the Albula, (c) the Naviscence, and (d) the Riedbach. Each point represents the (V) of the given drop category repeated 10 times.
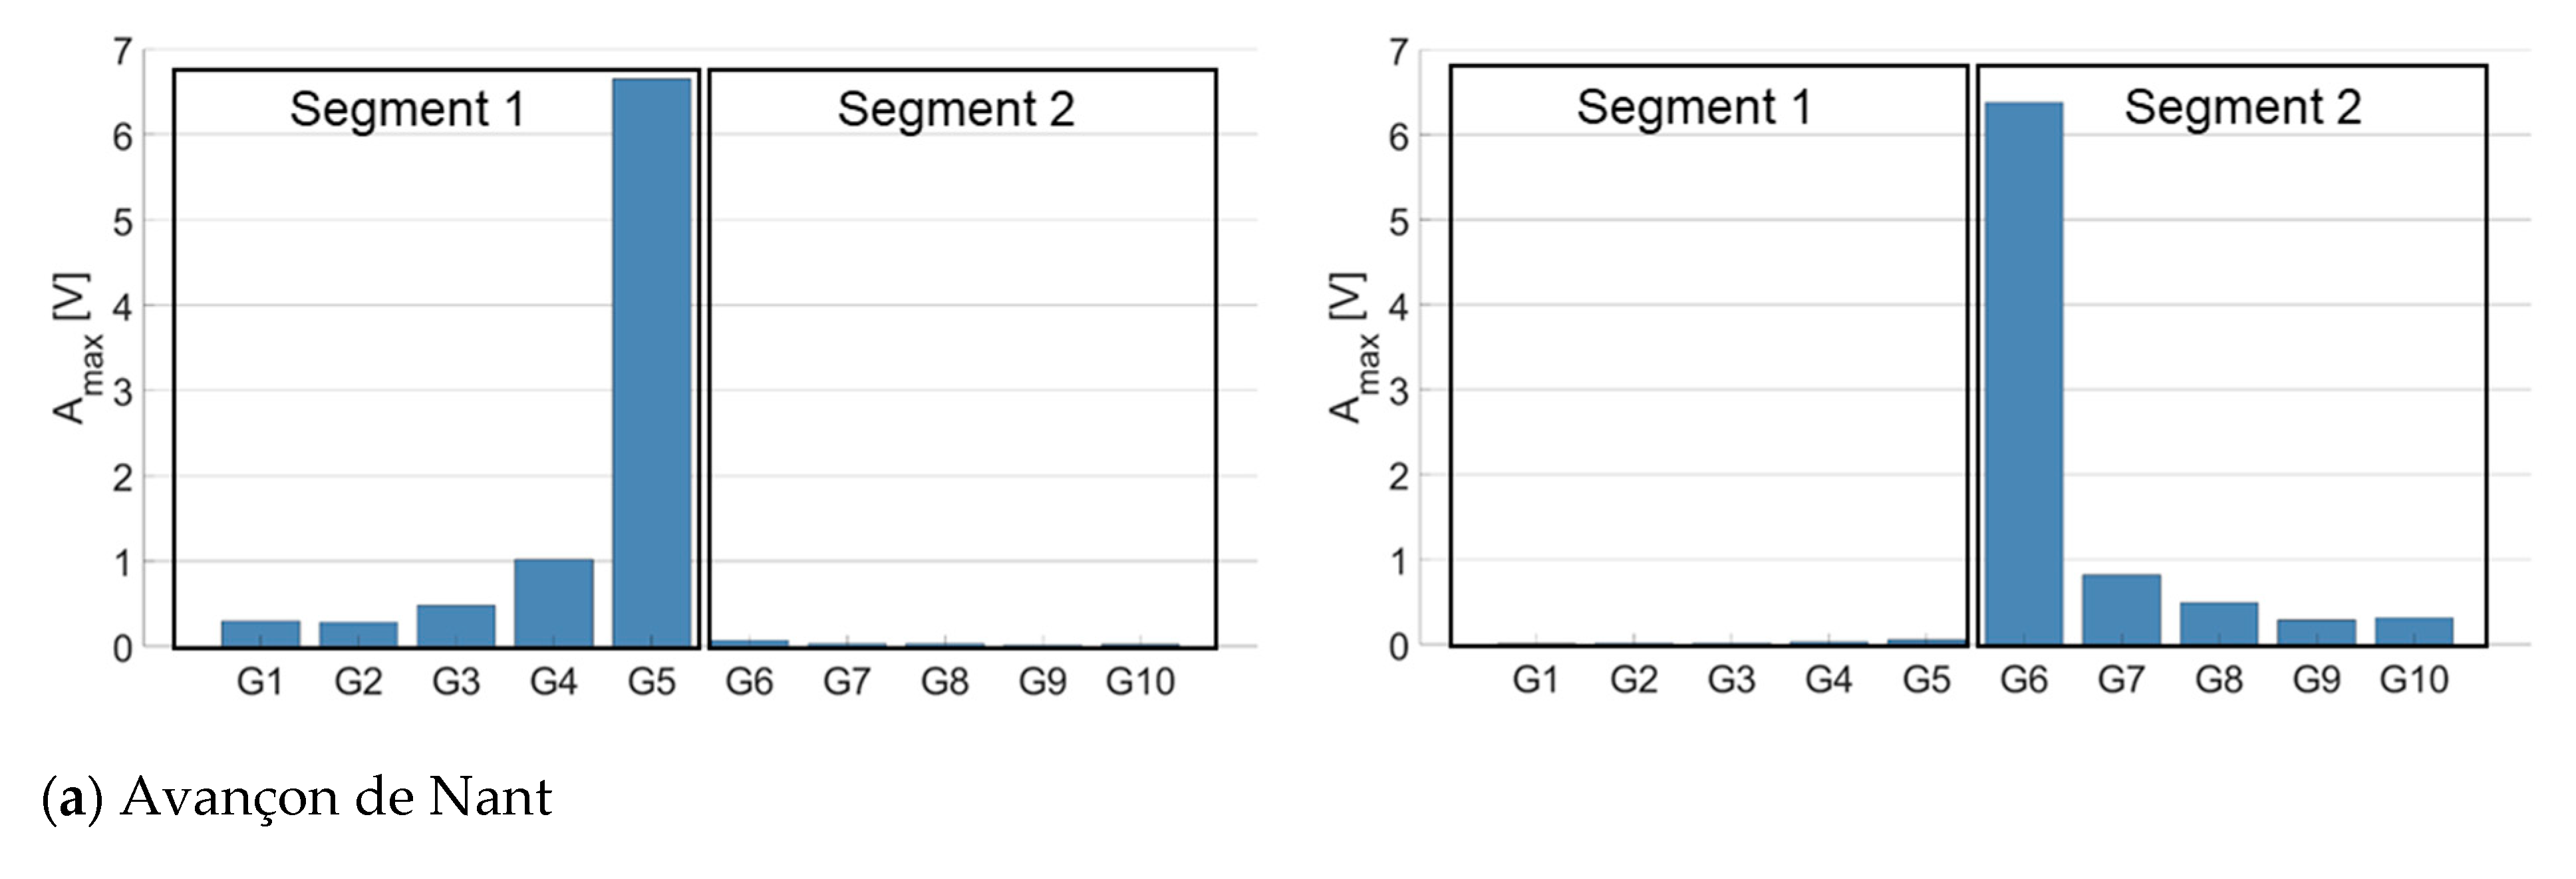
Figure 6.
Energy propagation from impacted plates towards non-impacted plates, and across segment limits, at (a) the Avançon de Nant, (b) the Albula, and (c) the Naviscence. Plates located at the margin of different segments have been impacted in this example to illustrate how the energy propagates at the different measuring sites. In this example, one plate per scheme was impacted 10 times (average value) with a weight of 0.256 kg dropped from 0.6 m height (category 9).
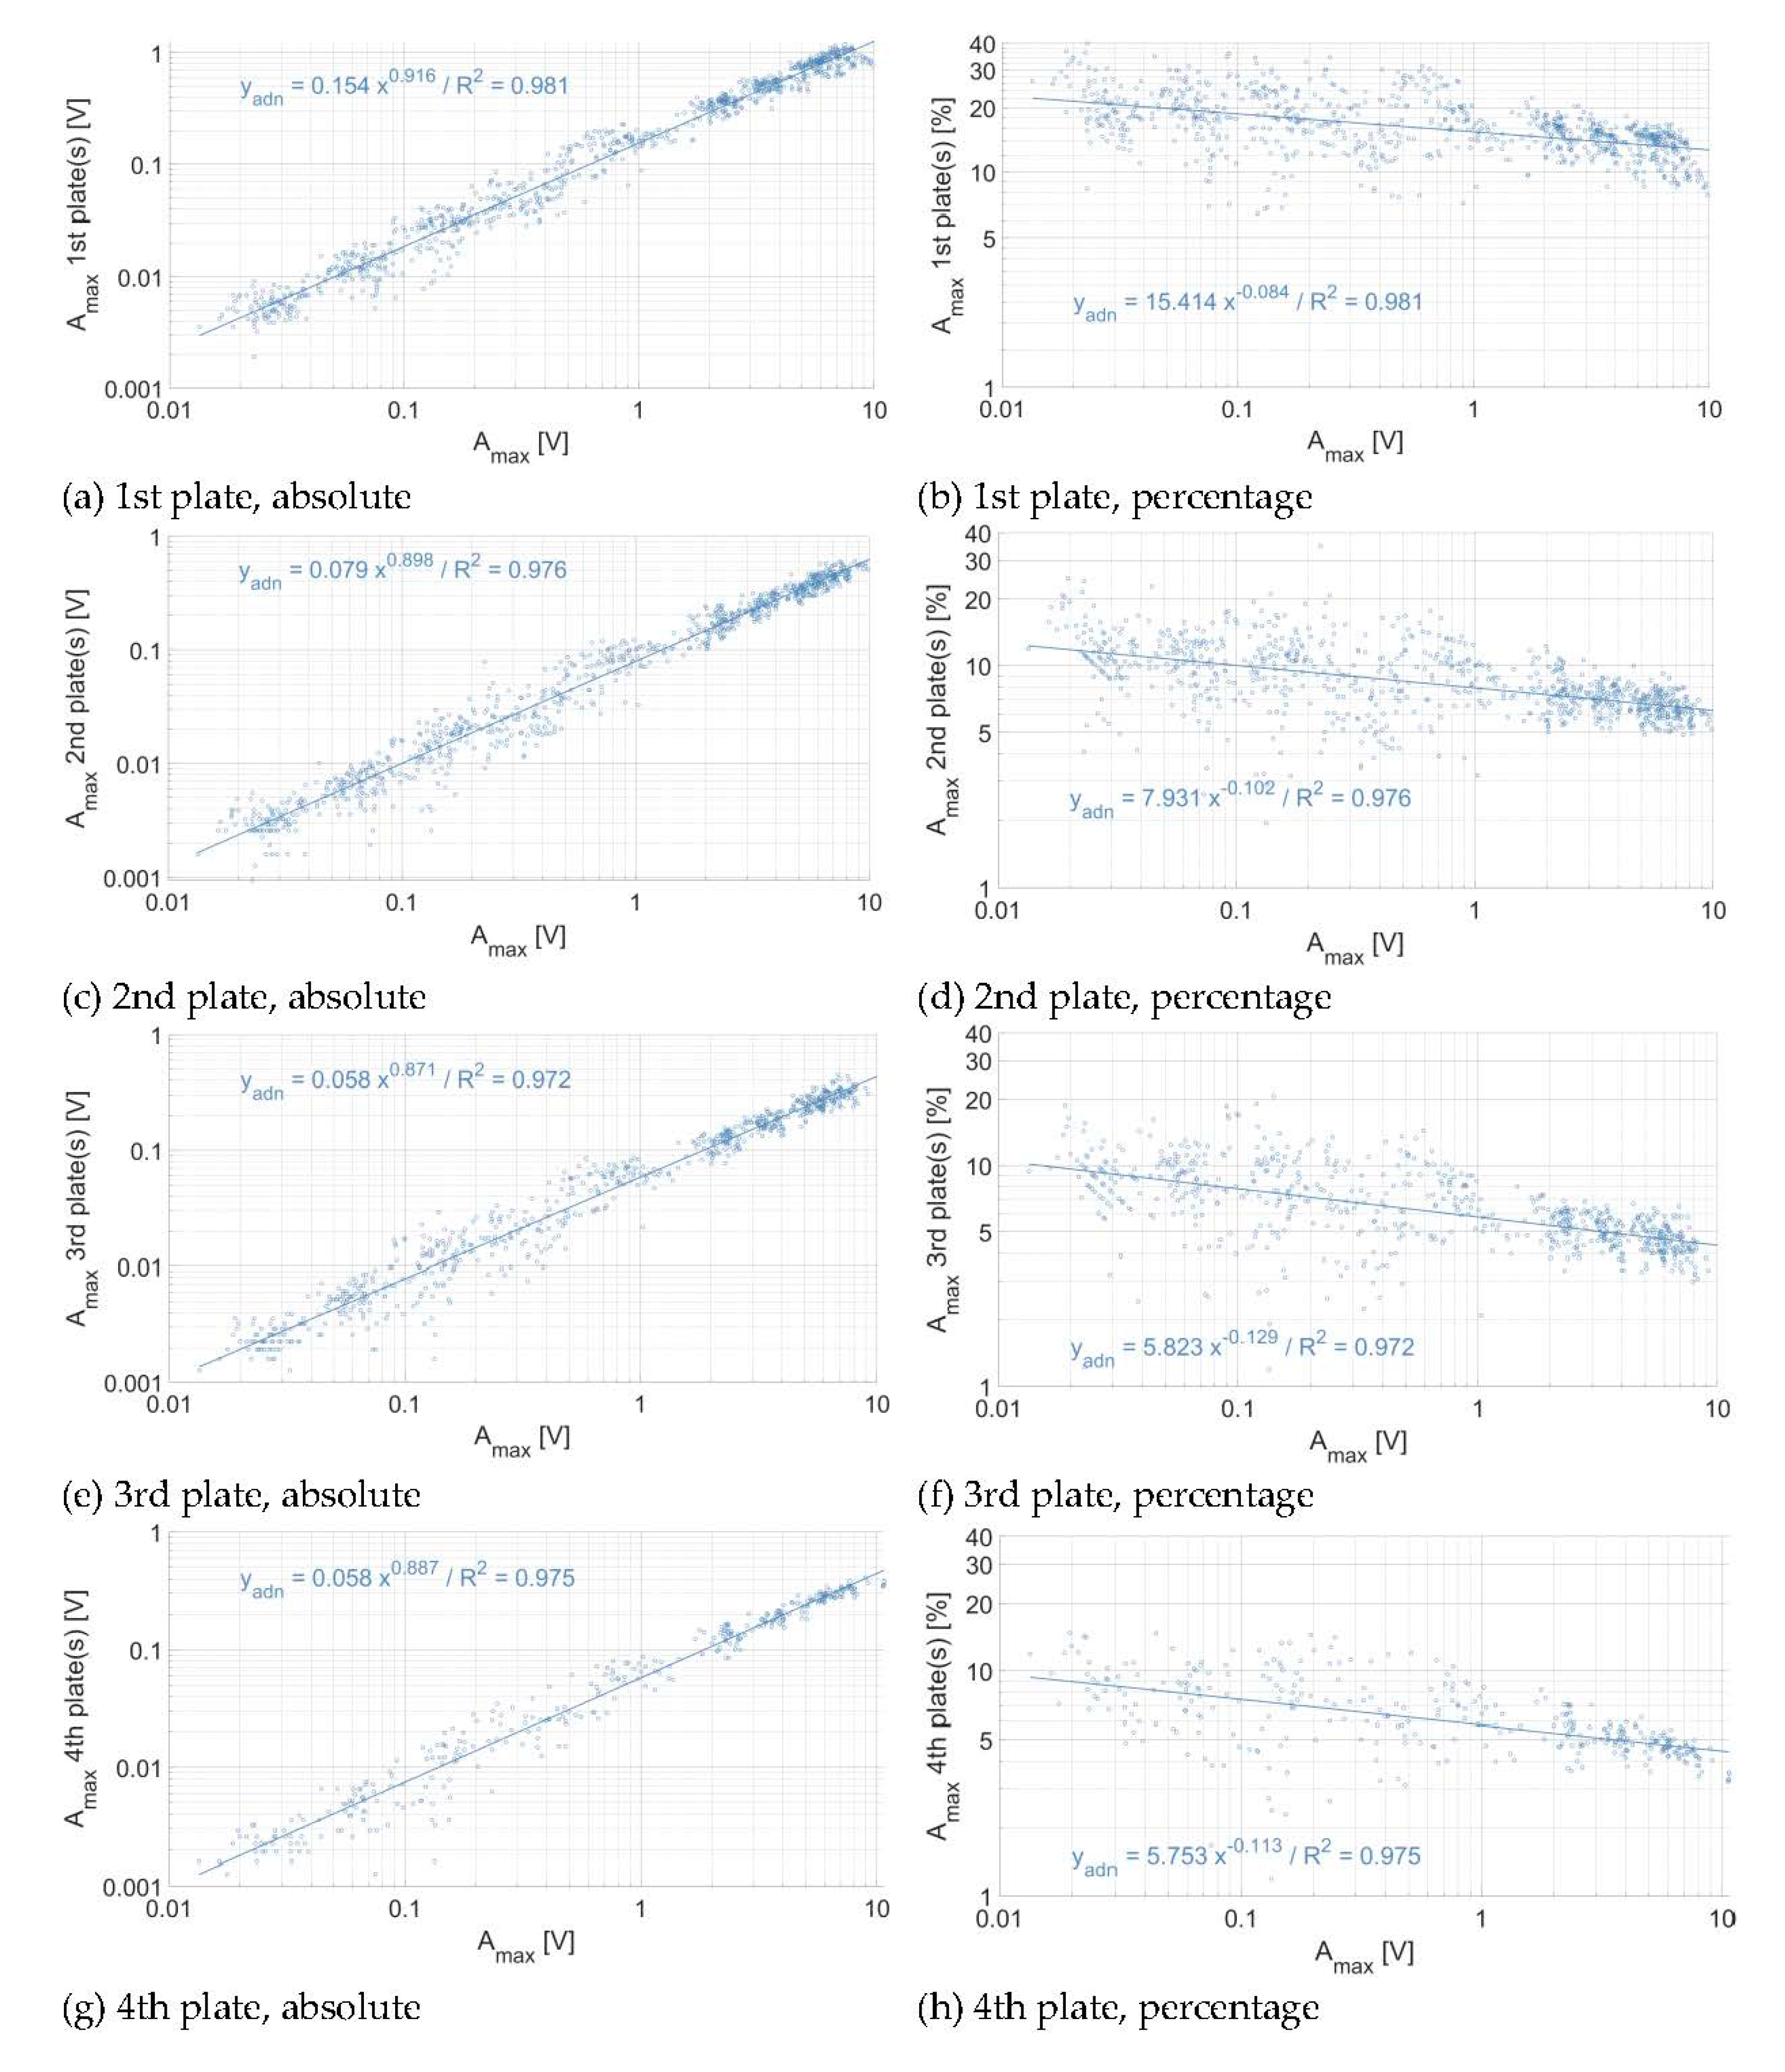
Figure 7.
Energy propagation across plates at the Avançon de Nant measuring station (a,b) at one plate of distance, (c,d) at two plates of distance, (e,f) at three plates of distance, and (g,h) at four plates of distance, in absolute (left column) and relative (right column) numbers. Each dot represents the voltage associated to an individual impact.
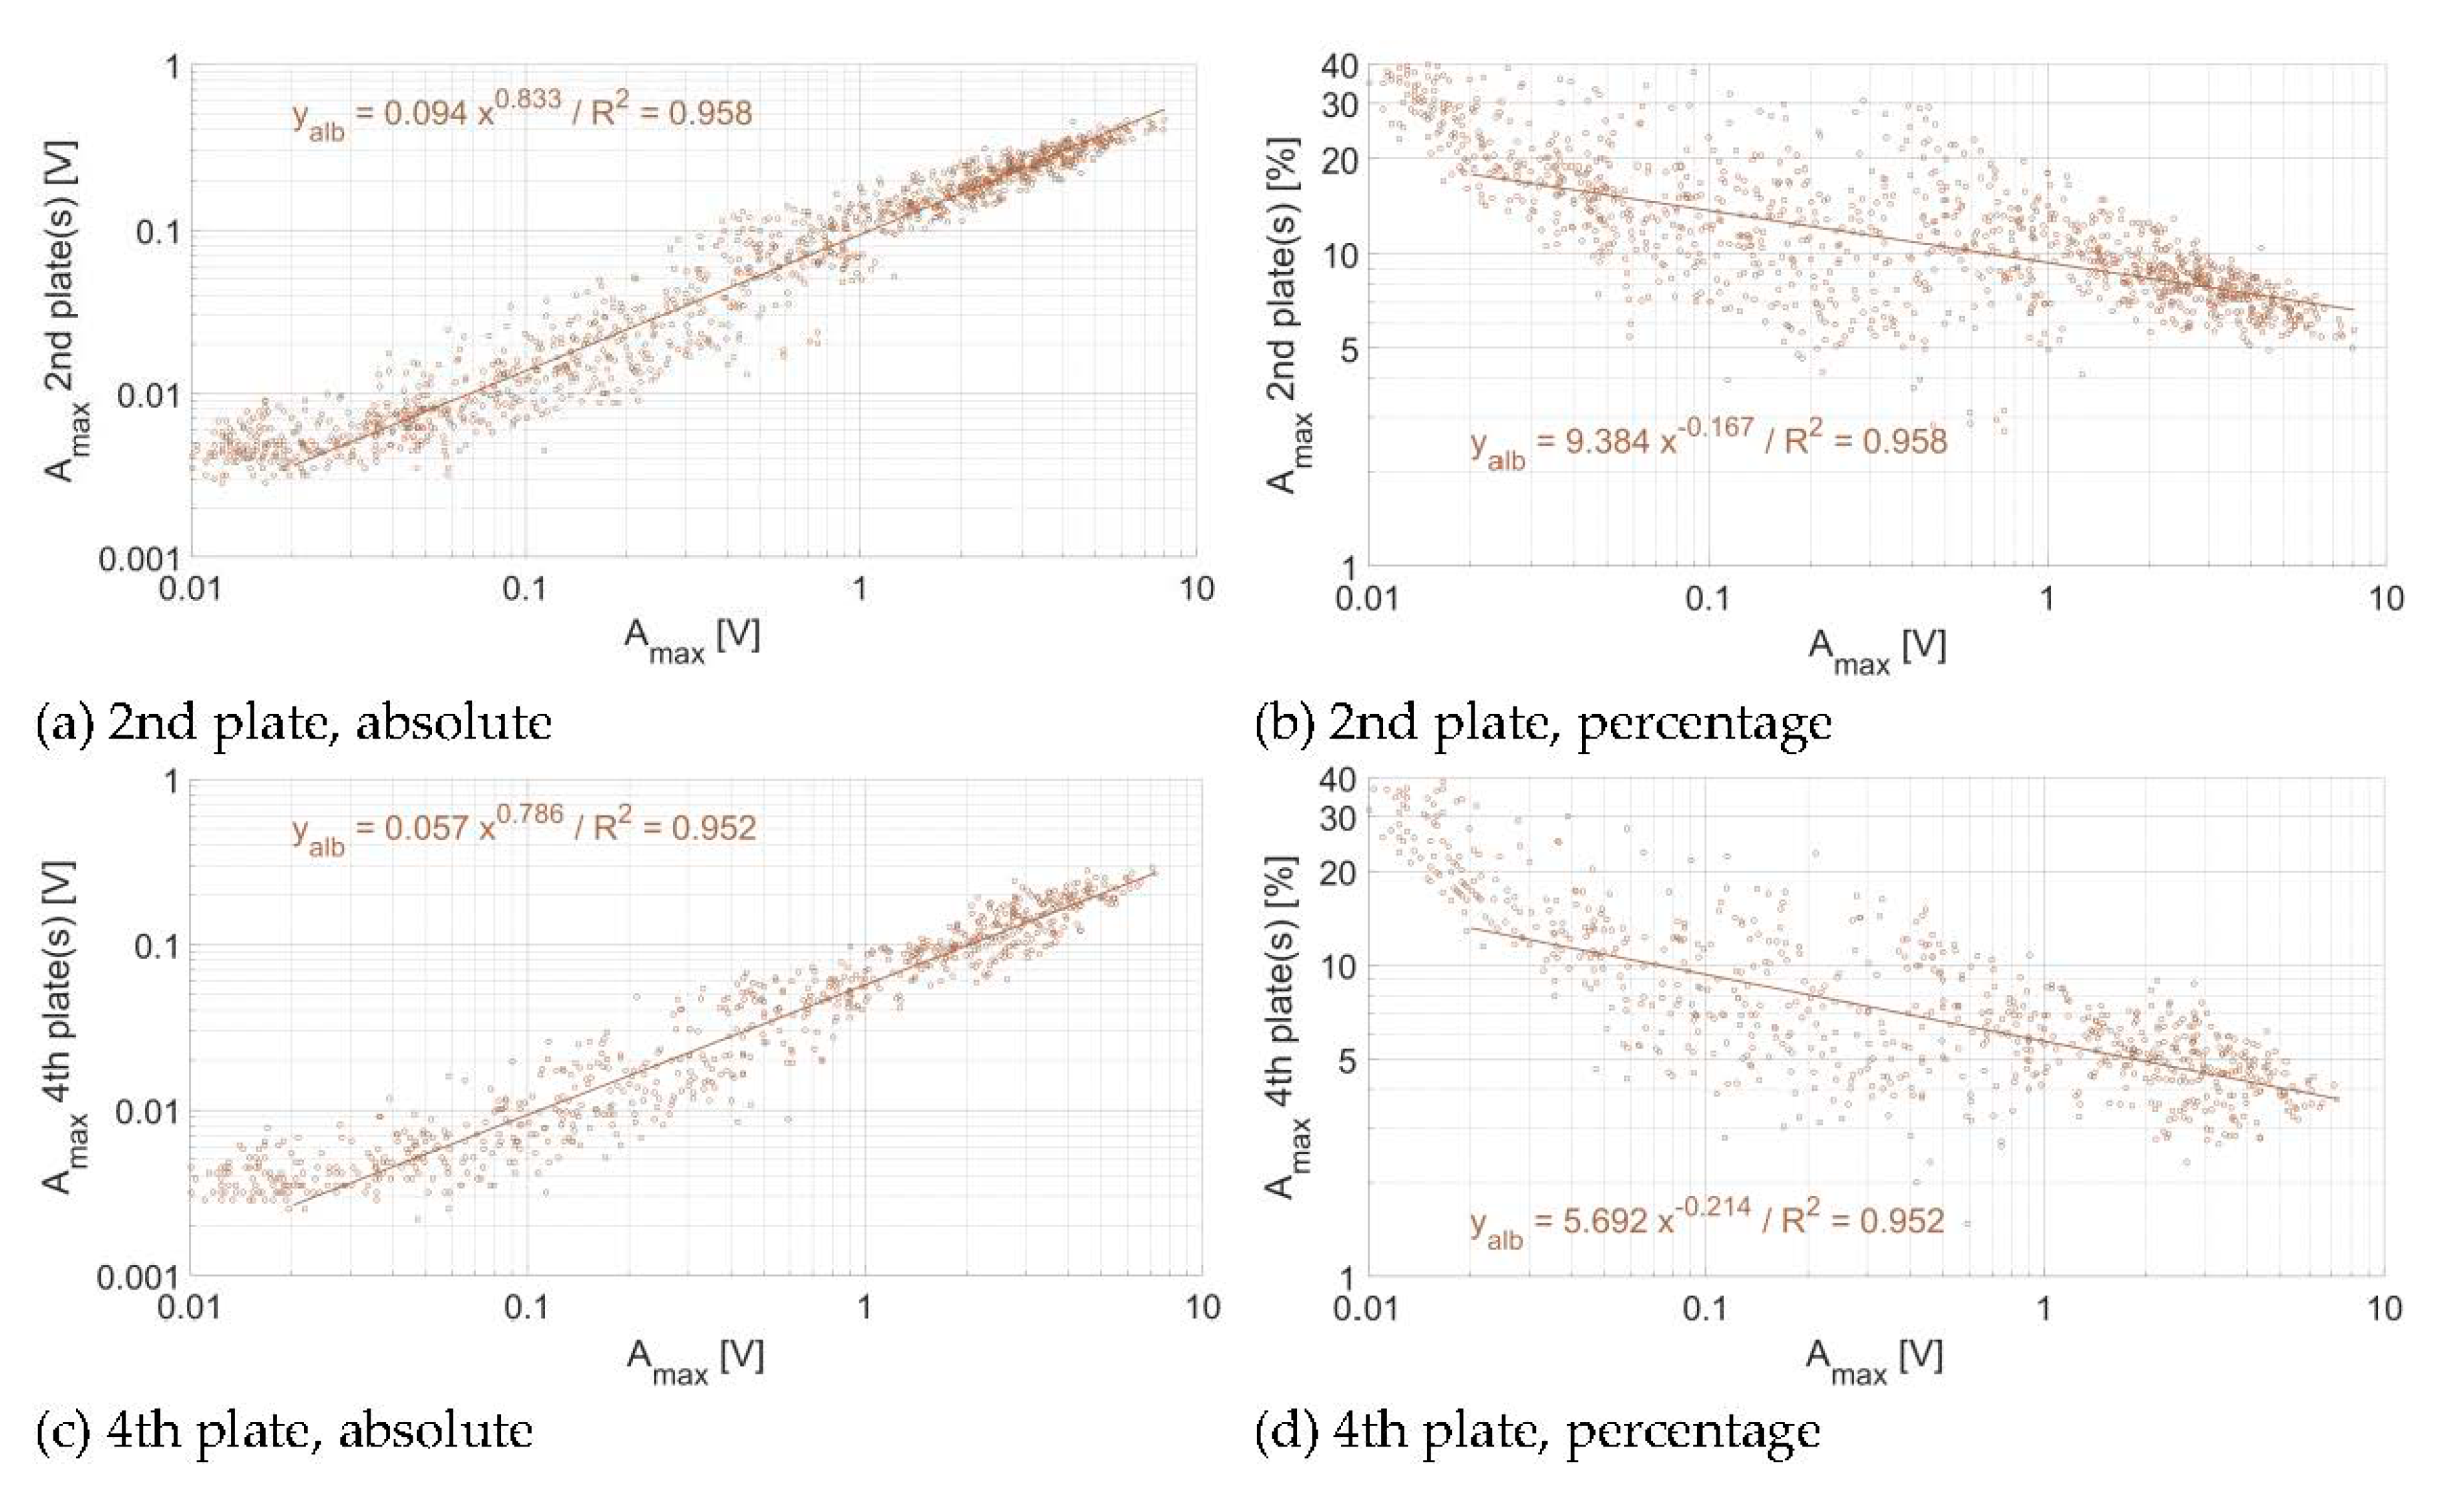
Figure 8.
Energy propagation across plates at the Albula measuring station (a,b) at two plates of distance and (c,d) at four plates of distance, in absolute (left column) and relative (right column) numbers. Each dot represents the voltage associated to a single impact. The regression is fitted only for Amax greater than 0.02 V.
Figure 9.
Energy propagation across plates at the Naviscence measuring station (a,b) at one plate of distance, (c,d) at two plates of distance, (e,f) at three plates of distance, and (g,h) at four plates of distance, in absolute (left column) and relative (right column) numbers. Each dot represents the voltage associated to a single impact. The regression is fitted only for maximum impact amplitudes greater than 0.08, 0.5, 1 V at one, two, three, and four plates of distance, respectively.
Figure 10.
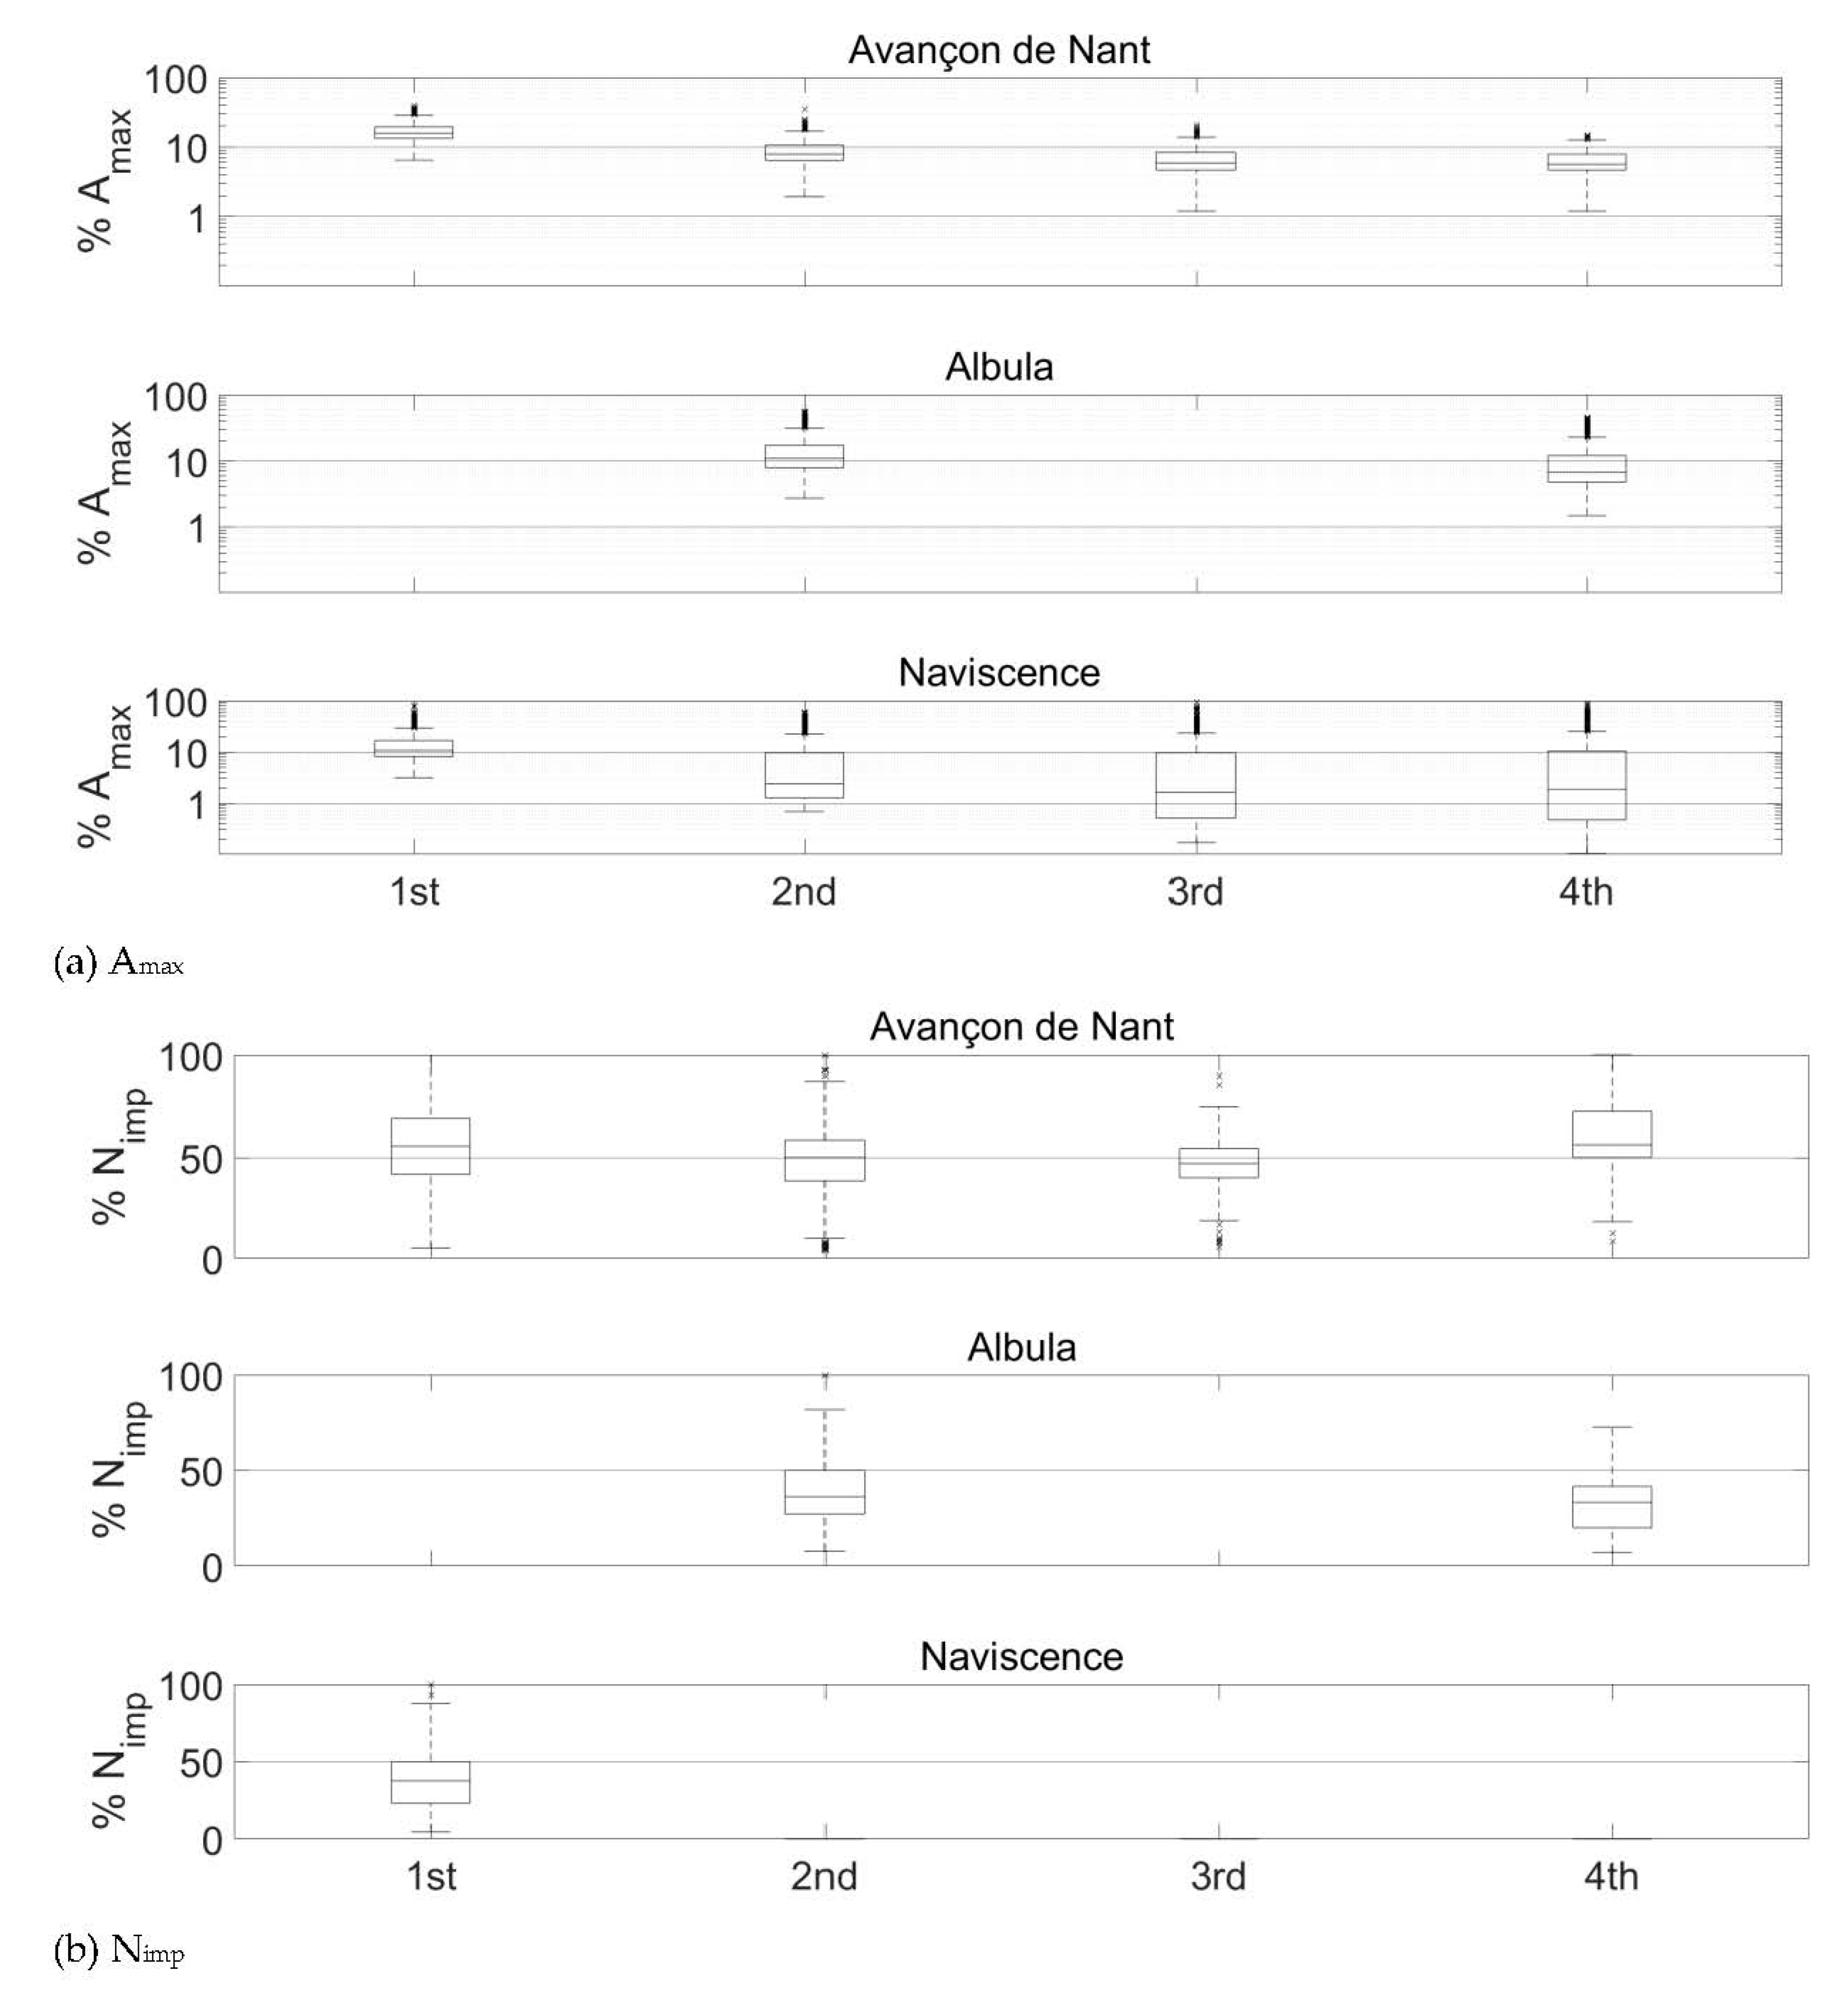
Percentage of (a) the impact Amax (note the logarithmic scale on the y-axis) and (b) Nimp (>0.1 V) recorded at one, two, three, and four plates of distance in all three investigated measuring stations. Boxplots show the 5th, 25th, 50th, 75th, and 95th percentiles of the distribution, outliers are marked with crosses. Note that Amax covers a range of impacts between 0.01 and 10 V, while Nimp (-) only considers the impacts greater than 0.1 V. At the Albula, there is no data available at one and three plates of distance, because there are accelerometers mounted below each second plate. At the Navisence, no impulses are detected further than one plate of distance.
Figure 10.
Percentage of (a) the impact Amax (note the logarithmic scale on the y-axis) and (b) Nimp (>0.1 V) recorded at one, two, three, and four plates of distance in all three investigated measuring stations. Boxplots show the 5th, 25th, 50th, 75th, and 95th percentiles of the distribution, outliers are marked with crosses. Note that Amax covers a range of impacts between 0.01 and 10 V, while Nimp (-) only considers the impacts greater than 0.1 V. At the Albula, there is no data available at one and three plates of distance, because there are accelerometers mounted below each second plate. At the Navisence, no impulses are detected further than one plate of distance.
Figure 11.
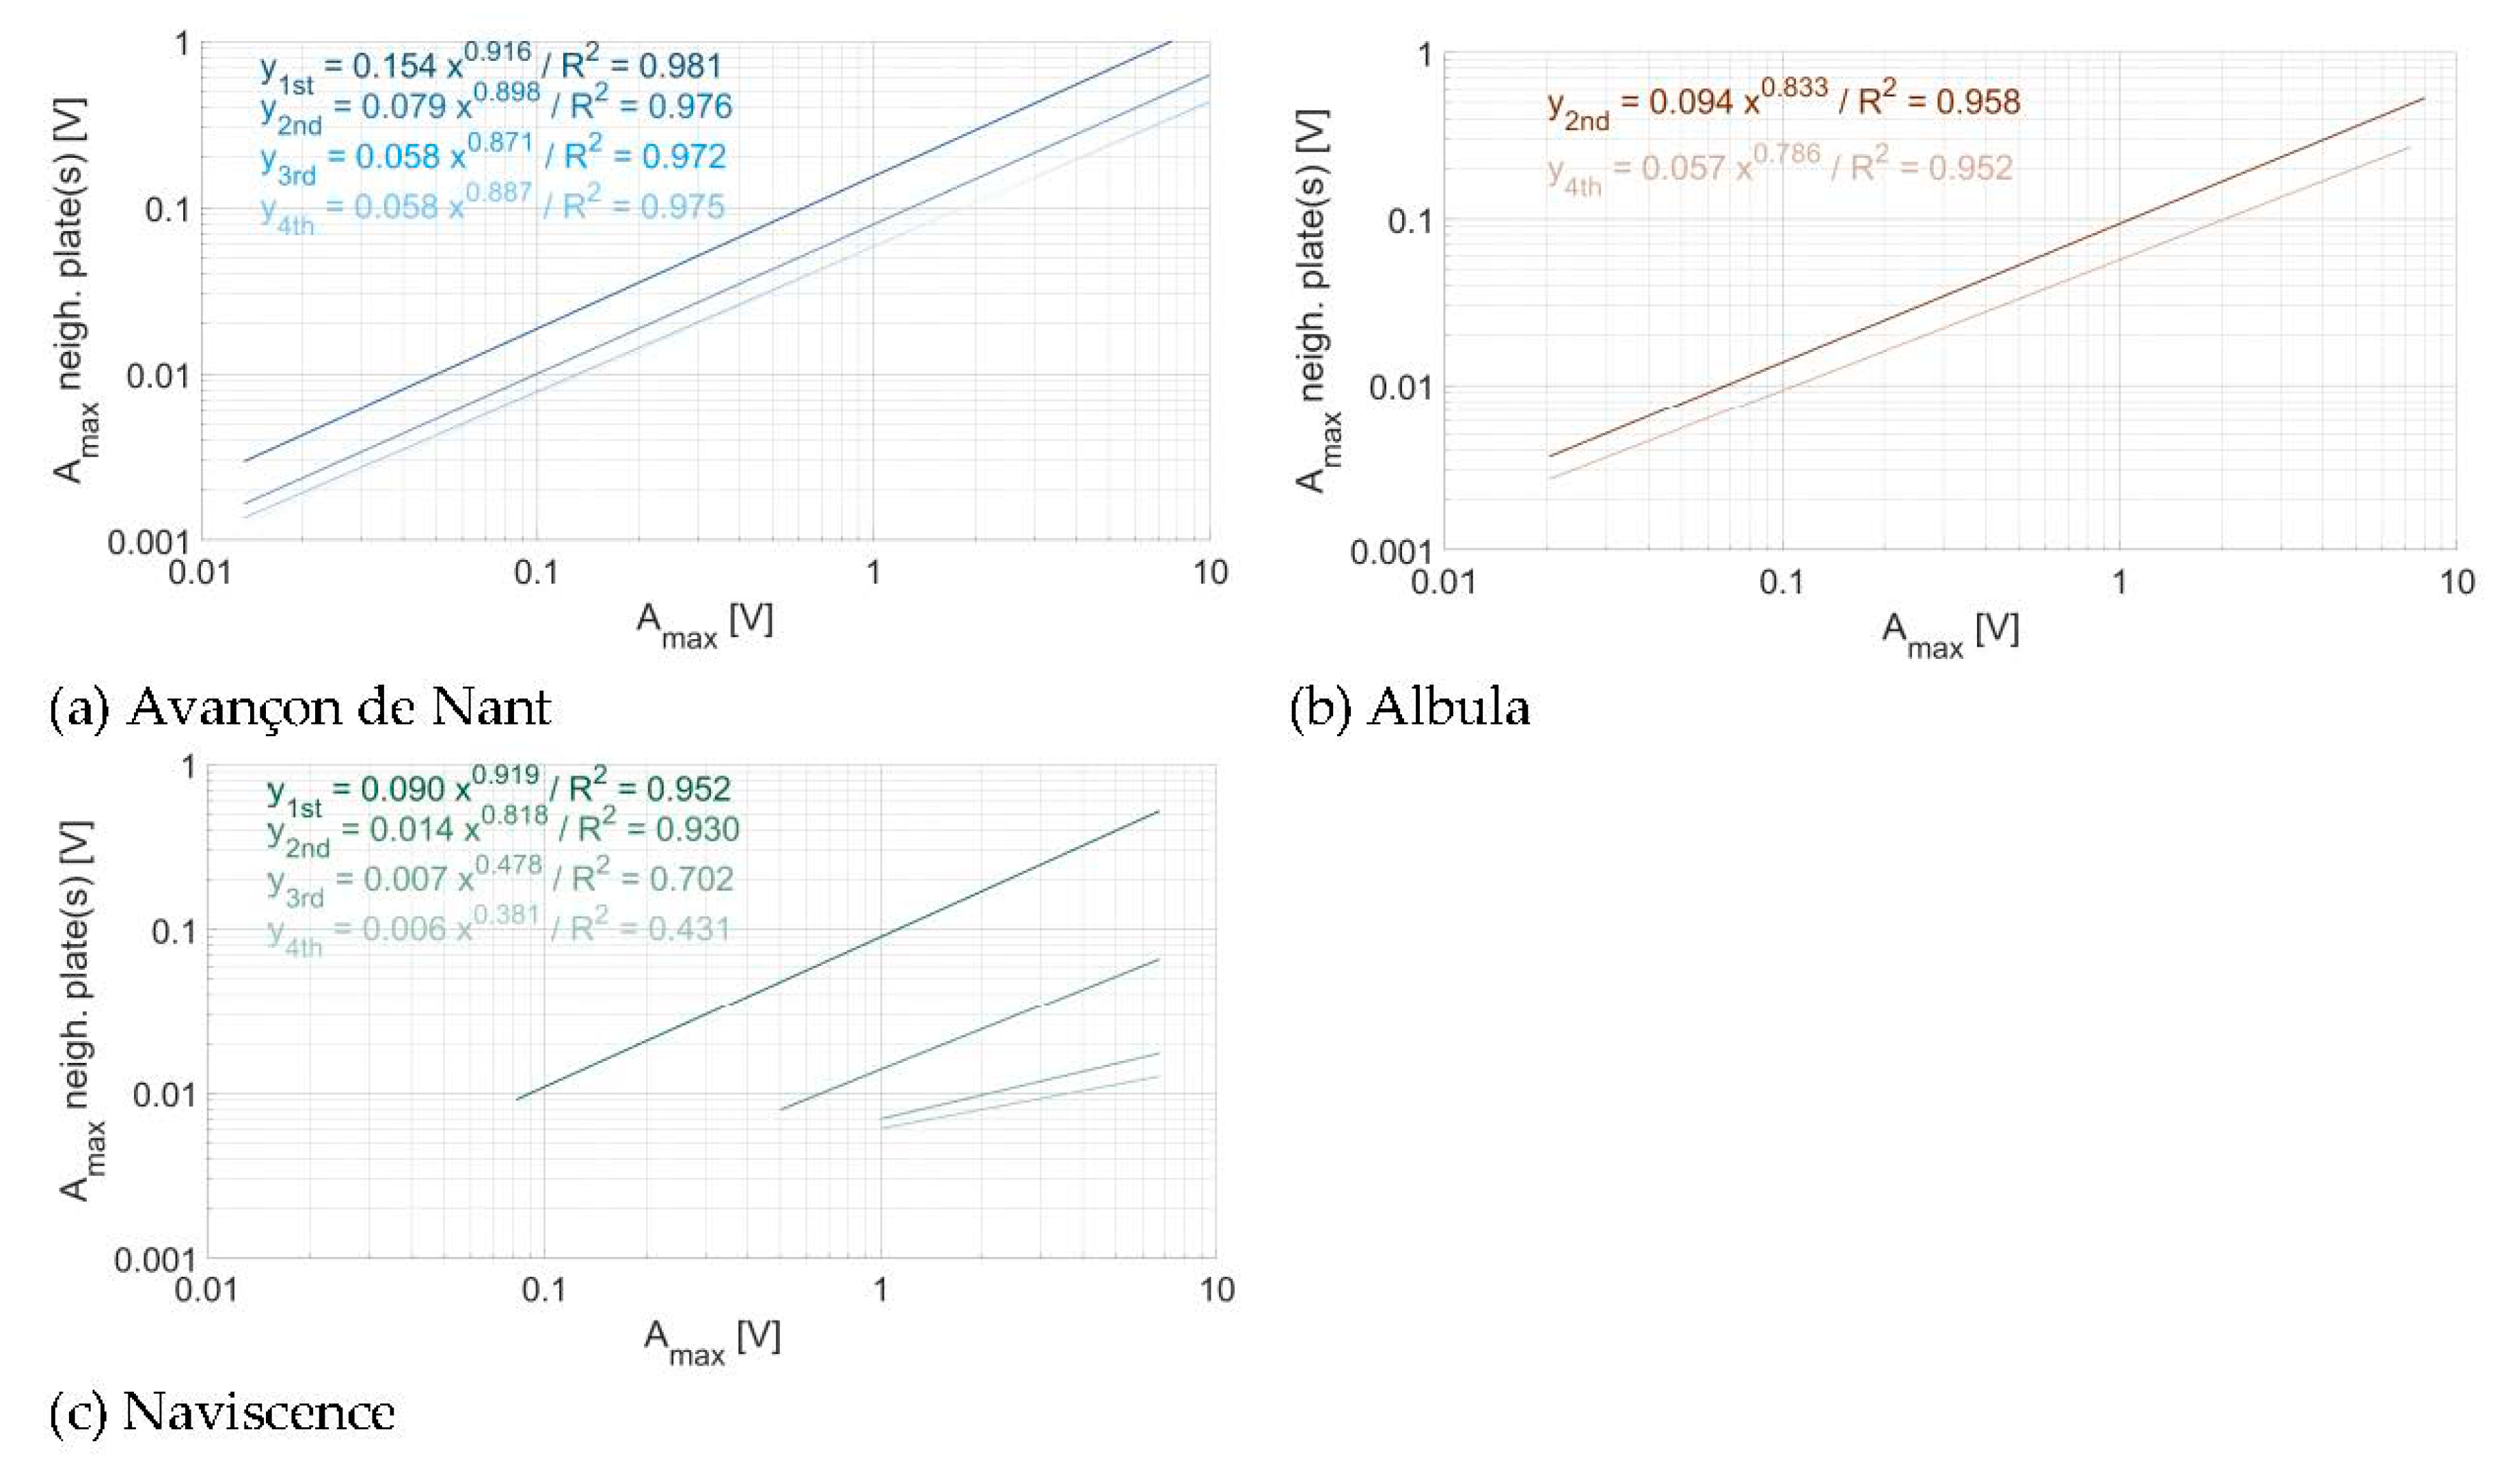
Attenuation of the propagated energy across plates at (a) the Avançon de Nant, (b) the Albula, and (c) the Naviscence measuring stations. Regressions are calculated from all impacts on every plate taken together at each given site.
Figure 11.
Attenuation of the propagated energy across plates at (a) the Avançon de Nant, (b) the Albula, and (c) the Naviscence measuring stations. Regressions are calculated from all impacts on every plate taken together at each given site.
Figure 12.
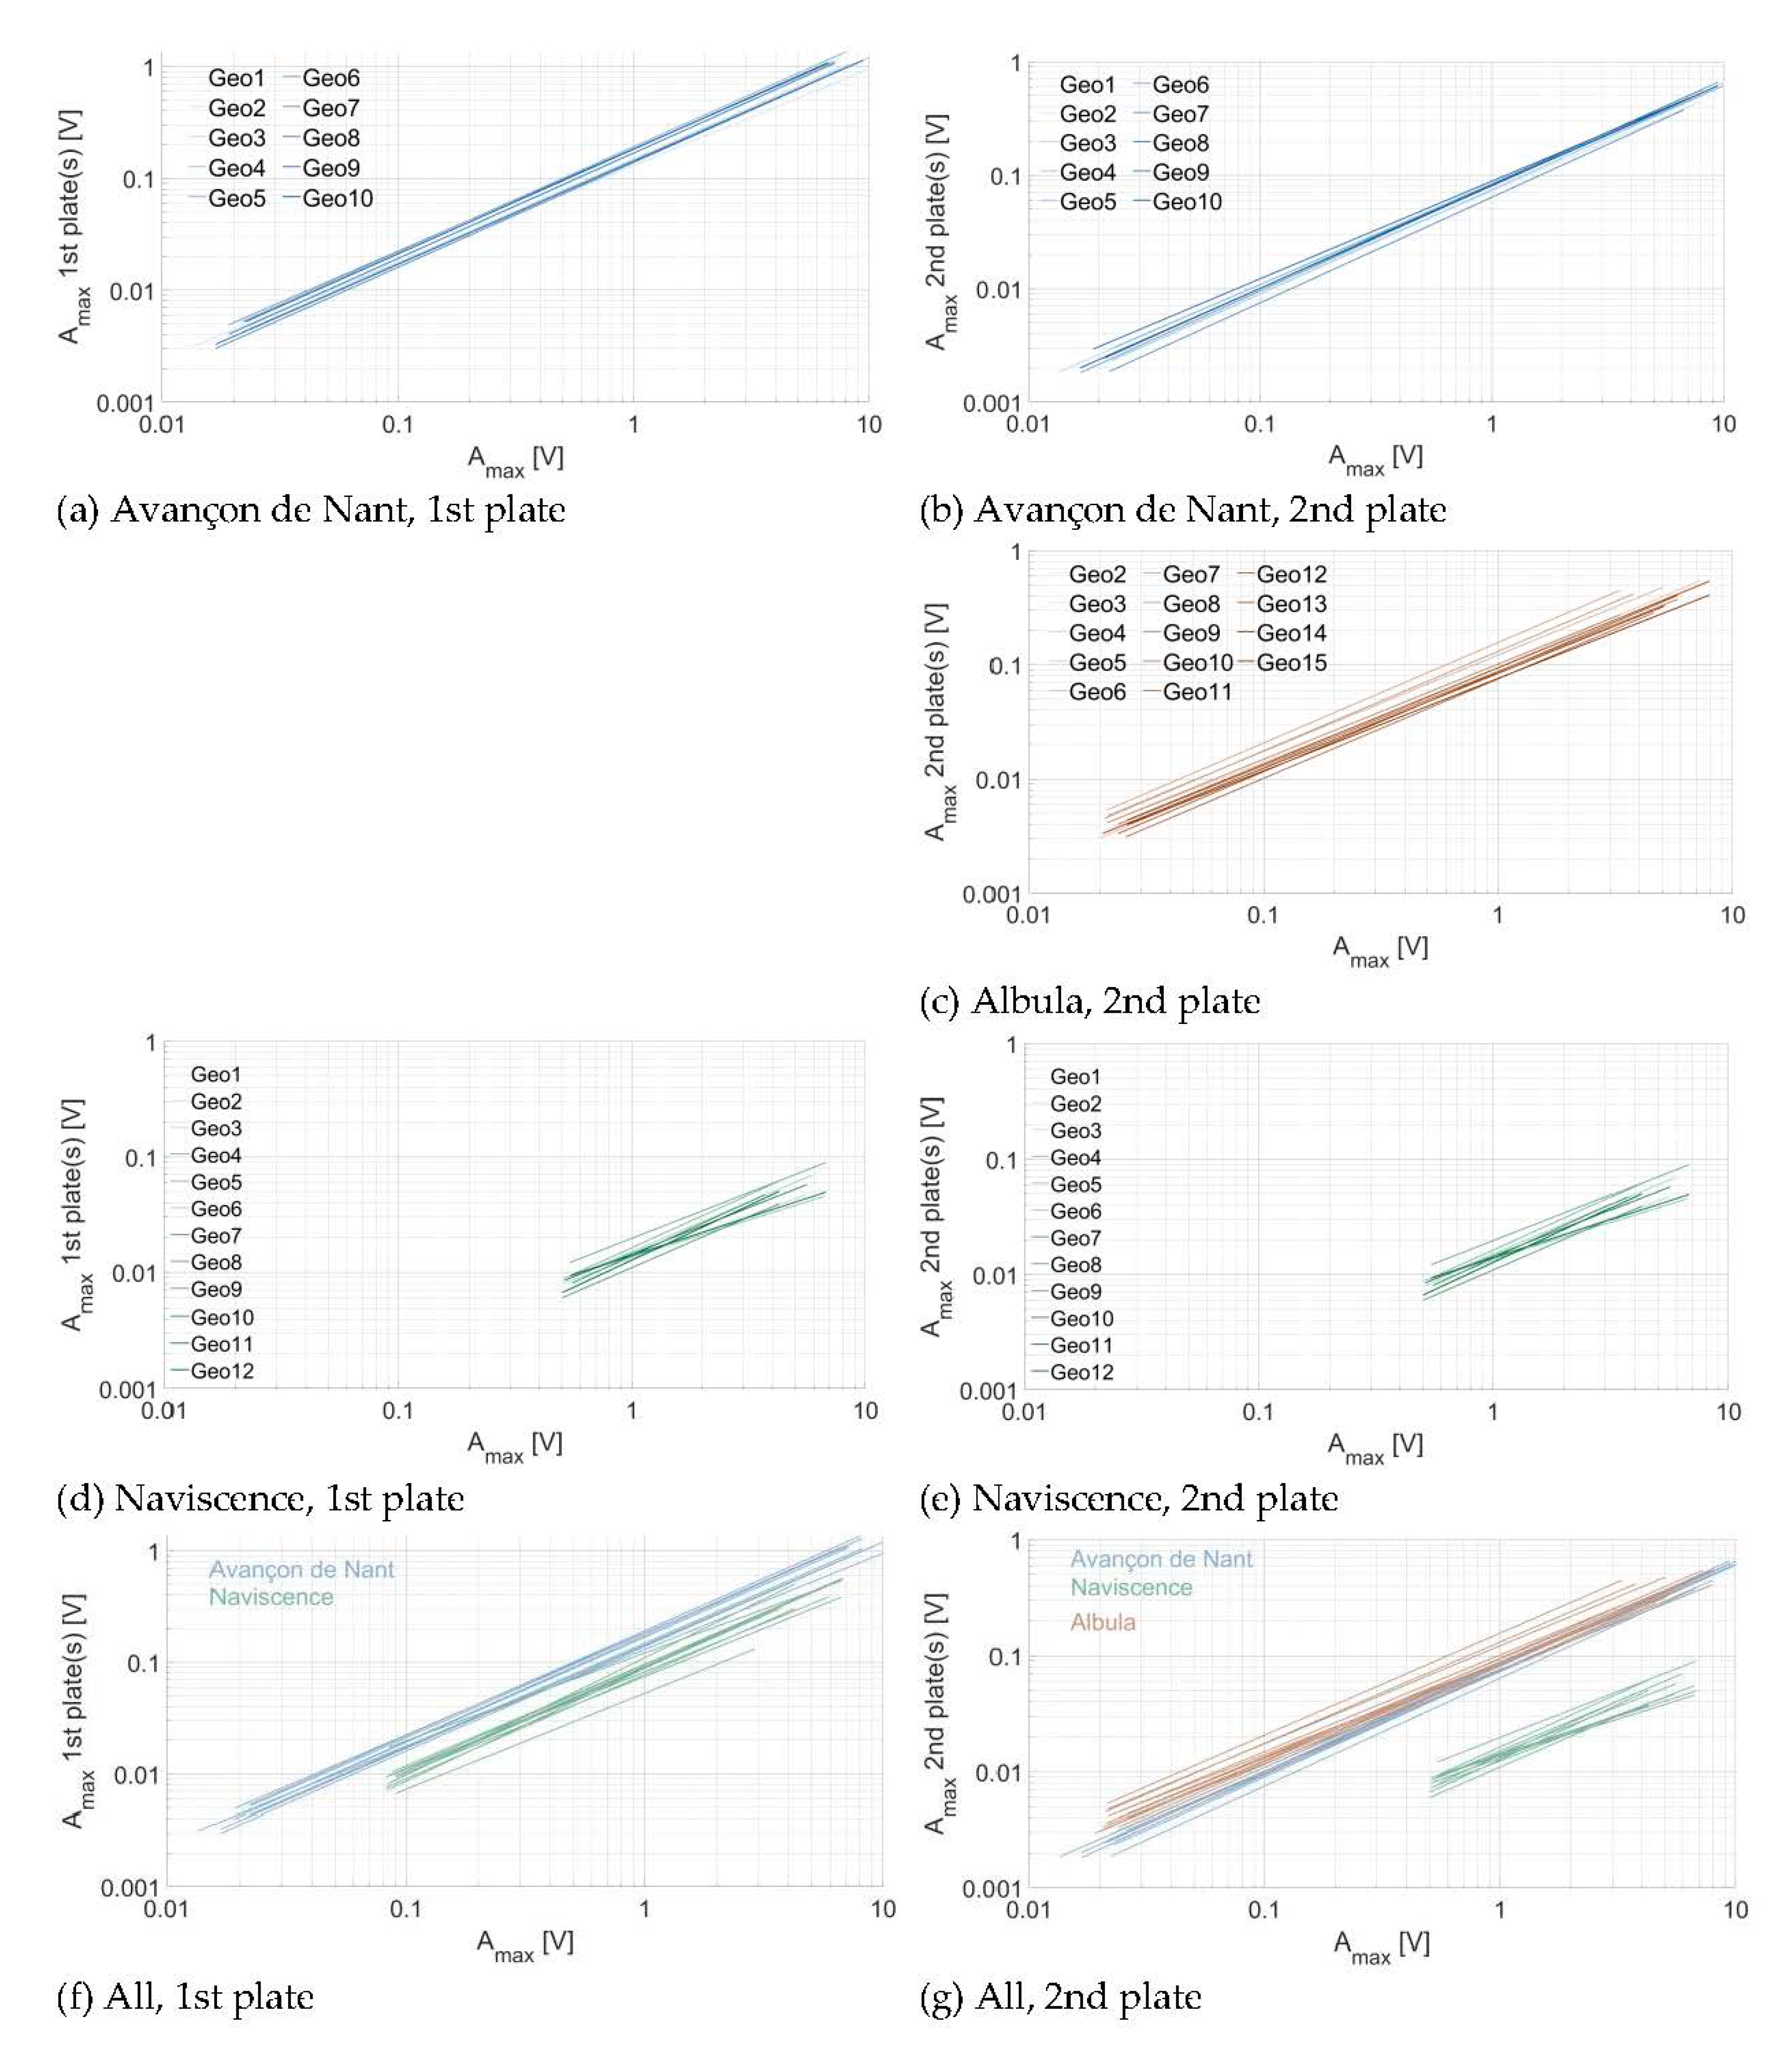
Energy propagation across plates computed for individual plates (a,b) at the Avançon de Nant, (b) at the Albula, (c,d) at the Naviscence, and (f,g) for all three measuring stations together.
Figure 12.
Energy propagation across plates computed for individual plates (a,b) at the Avançon de Nant, (b) at the Albula, (c,d) at the Naviscence, and (f,g) for all three measuring stations together.
Table 1.
Characteristics of the devices used for the experiment.
Table 1.
Characteristics of the devices used for the experiment.
| Element | Mass (kg) | Length (m) | Diameter (m) | Remarks |
|---|
| Hammer (without handle) | 2.386 | 0.89 | 0.05/0.015 | Base/stake |
| Hammer (with handle) | 2.948 | 1.02 | 0.05/0.015 | Base/stake |
| Heightening cylinder | 0.250 | 0.1 | 0.05/0.02 | Cylinder/hole |
Hammer set up for experiments
(without handle + heightening cylinder) | 2.272 | 0.89 | 0.05/0.015/0.05 | Base/stake/height cylinder |
| Weights | 0.256 | 0.104 | 0.05/0.02 | Cylinder/hole |
| | 0.128 | 0.051 | 0.05/0.02 | Cylinder/hole |
| | 0.064 | 0.021 | 0.05/0.02 | Cylinder/hole |
| | 0.032 | 0.013 | 0.05/0.02 | Cylinder/hole |
| | 0.016 | 0.007 | 0.05/0.02 | Cylinder/hole |
| | 0.008 | 0.003 | 0.05/0.02 | Cylinder/hole |
Table 2.
Mean and standard deviation (10 impacts) for each of the nine categories of drop weight-height that were retained from the laboratory experiment to be conducted in the field.
Table 2.
Mean and standard deviation (10 impacts) for each of the nine categories of drop weight-height that were retained from the laboratory experiment to be conducted in the field.
| Category | Mass (kg) | Height (m) | | | |
|---|
| 1 | 0.008 | 0.1 | 0.042 | 0.011 | 26 |
| 2 | 0.016 | 0.1 | 0.069 | 0.012 | 17 |
| 3 | 0.032 | 0.1 | 0.165 | 0.034 | 21 |
| 4 | 0.064 | 0.1 | 0.353 | 0.038 | 11 |
| 5 | 0.128 | 0.1 | 1.267 | 0.201 | 16 |
| 6 | 0.256 | 0.1 | 3.661 | 0.491 | 13 |
| 7 | 0.256 | 0.2 | 4.93 | 0.581 | 12 |
| 8 | 0.256 | 0.4 | 7.341 | 0.877 | 12 |
| 9 | 0.256 | 0.6 | 9.442 | 0.651 | 7 |
Table 3.
Average fall velocity and kinetic energy for each category of weight-height calculated based on high-speed camera video recordings.
Table 3.
Average fall velocity and kinetic energy for each category of weight-height calculated based on high-speed camera video recordings.
| Category | Mass (kg) | Height (m) | | |
|---|
| 1 | 0.008 | 0.1 | 1.27 | 0.006 |
| 2 | 0.016 | 0.1 | 1.32 | 0.014 |
| 3 | 0.032 | 0.1 | 1.311 | 0.027 |
| 4 | 0.064 | 0.1 | 1.234 | 0.049 |
| 5 | 0.128 | 0.1 | 1.317 | 0.111 |
| 6 | 0.256 | 0.1 | 1.347 | 0.232 |
| 7 | 0.256 | 0.2 | 1.89 | 0.457 |
| 8 | 0.256 | 0.4 | 2.636 | 0.891 |
| 9 | 0.256 | 0.6 | 2.883 | 1.064 |
Table 4.
Number of tested plates at four measuring stations where the impact experiment was conducted. The four measuring stations are all located within the Swiss Alps, at Alpine rivers that give their name to the measuring site.
Table 4.
Number of tested plates at four measuring stations where the impact experiment was conducted. The four measuring stations are all located within the Swiss Alps, at Alpine rivers that give their name to the measuring site.
| Measuring Station | Location | Coordinates (WGS 84) | Number of Plates | Total Number of Impacts |
|---|
| Avançon de Nant | Western Swiss Alps | 46°15′12′’ N/7°06′35′’ E | 10 | 90 |
| Ablula | Eastern Swiss Alps | 46°39′41′’ N/9°34′48′’ E | 14 | 1260 |
| Naviscence | Southern Swiss Alps | 46°07′52′’ N/7°37′38′’ E | 12 | 1080 |
| Riedbach | Southern Swiss Alps | 46°15′44′’ N/7°55′17′’ E | 07 | 630 |
| Total | Total | | 43 | 3060 |
Table 5.
Regression coefficients of the relationship between the impact kinetic energy derived from laboratory experiments, and the recorded direct Amax, for all the impact tests over all the plates (taken together) at the Avançon de Nant, Albula, Naviscence, and Riedbach measuring stations, respectively, and the results for the corresponding laboratory experiment.
| | Intercept | Slope | R2 |
|---|
| Avançon de Nant | 8.183 | 1.107 | 0.991 |
| Albula | 4.528 | 1.077 | 0.988 |
| Naviscence | 3.867 | 1.030 | 0.99 |
| Riedbach | 3.963 | 1.144 | 0.984 |
| Laboratory | 11.018 | 1.121 | 0.977 |
Table 6.
Amax required for the 0.1 V threshold to be exceeded at one, two, three, and four plates of distance in all three investigated measuring stations.
Table 6.
Amax required for the 0.1 V threshold to be exceeded at one, two, three, and four plates of distance in all three investigated measuring stations.
| | 1st | 2nd | 3rd | 4th |
|---|
| Avançon de Nant | 0.6 V | 1 V | 2 V | 2 V |
| Albula | | 1 V | | 2 V |
| Naviscence | 1 V | - | - | - |
Table 7.
Regression coefficients between the impact Amax and the associated energy propagation at one and two plates of distance recorded for all the impacts on every plate taken together at a given measuring site.
Table 7.
Regression coefficients between the impact Amax and the associated energy propagation at one and two plates of distance recorded for all the impacts on every plate taken together at a given measuring site.
| | 1st Plate | | | 2nd Plate | | |
|---|
| | Intercept | Slope | R2 | Intercept | Slope | R2 |
|---|
| Avançon de Nant | 0.153 | 0.919 | 0.978 | 0.079 | 0.899 | 0.976 |
| Albula | | | | 0.094 | 0.832 | 0.958 |
| Naviscence | 0.091 | 0.919 | 0.932 | 0.014 | 0.813 | 0.903 |

 ,
, 


