Uncertainty Analysis of Fluorescence-Based Oil-In-Water Monitors for Oil and Gas Produced Water
Abstract
1. Introduction
“Online OiW monitors must be in operation and used for process optimization on the treatment plants for PW at all discharge sites …”“There must be continuous logging of the data, and the data must be stored for at least 5 years …”“Data collected with the online OiW monitors must be made available to the Danish Environmental Protection Agency if this is desired…”
- Continual compliance with discharge legislation.
- Process optimization.
- Data logging of PW quality for optimizing the re-injection process.
- Data logging for continuous revising of environmental legislation [9].
Previous Work Using the OiW Monitor
2. Non-Reference Methods Comparison with Reference Methods
3. Materials and Methods
3.1. Setup and Calibration of the OiW Monitors
3.2. Experiment Setups
4. Experiment Design
- Experiment designs executed on the by-passed pilot-plant setup, see Figure 5a:
- ○
- ’s influence on and .
- ○
- Direct flow through sidestream.
- ○
- Constant with varying .
- ○
- Constant pump speed with varying .
- Experiment designs executed on different standalone systems, see Figure 5b–d:
- ○
- Gas bubbles’ influence on .
- ○
- Repeatability investigation of flow-dependency of .
- ○
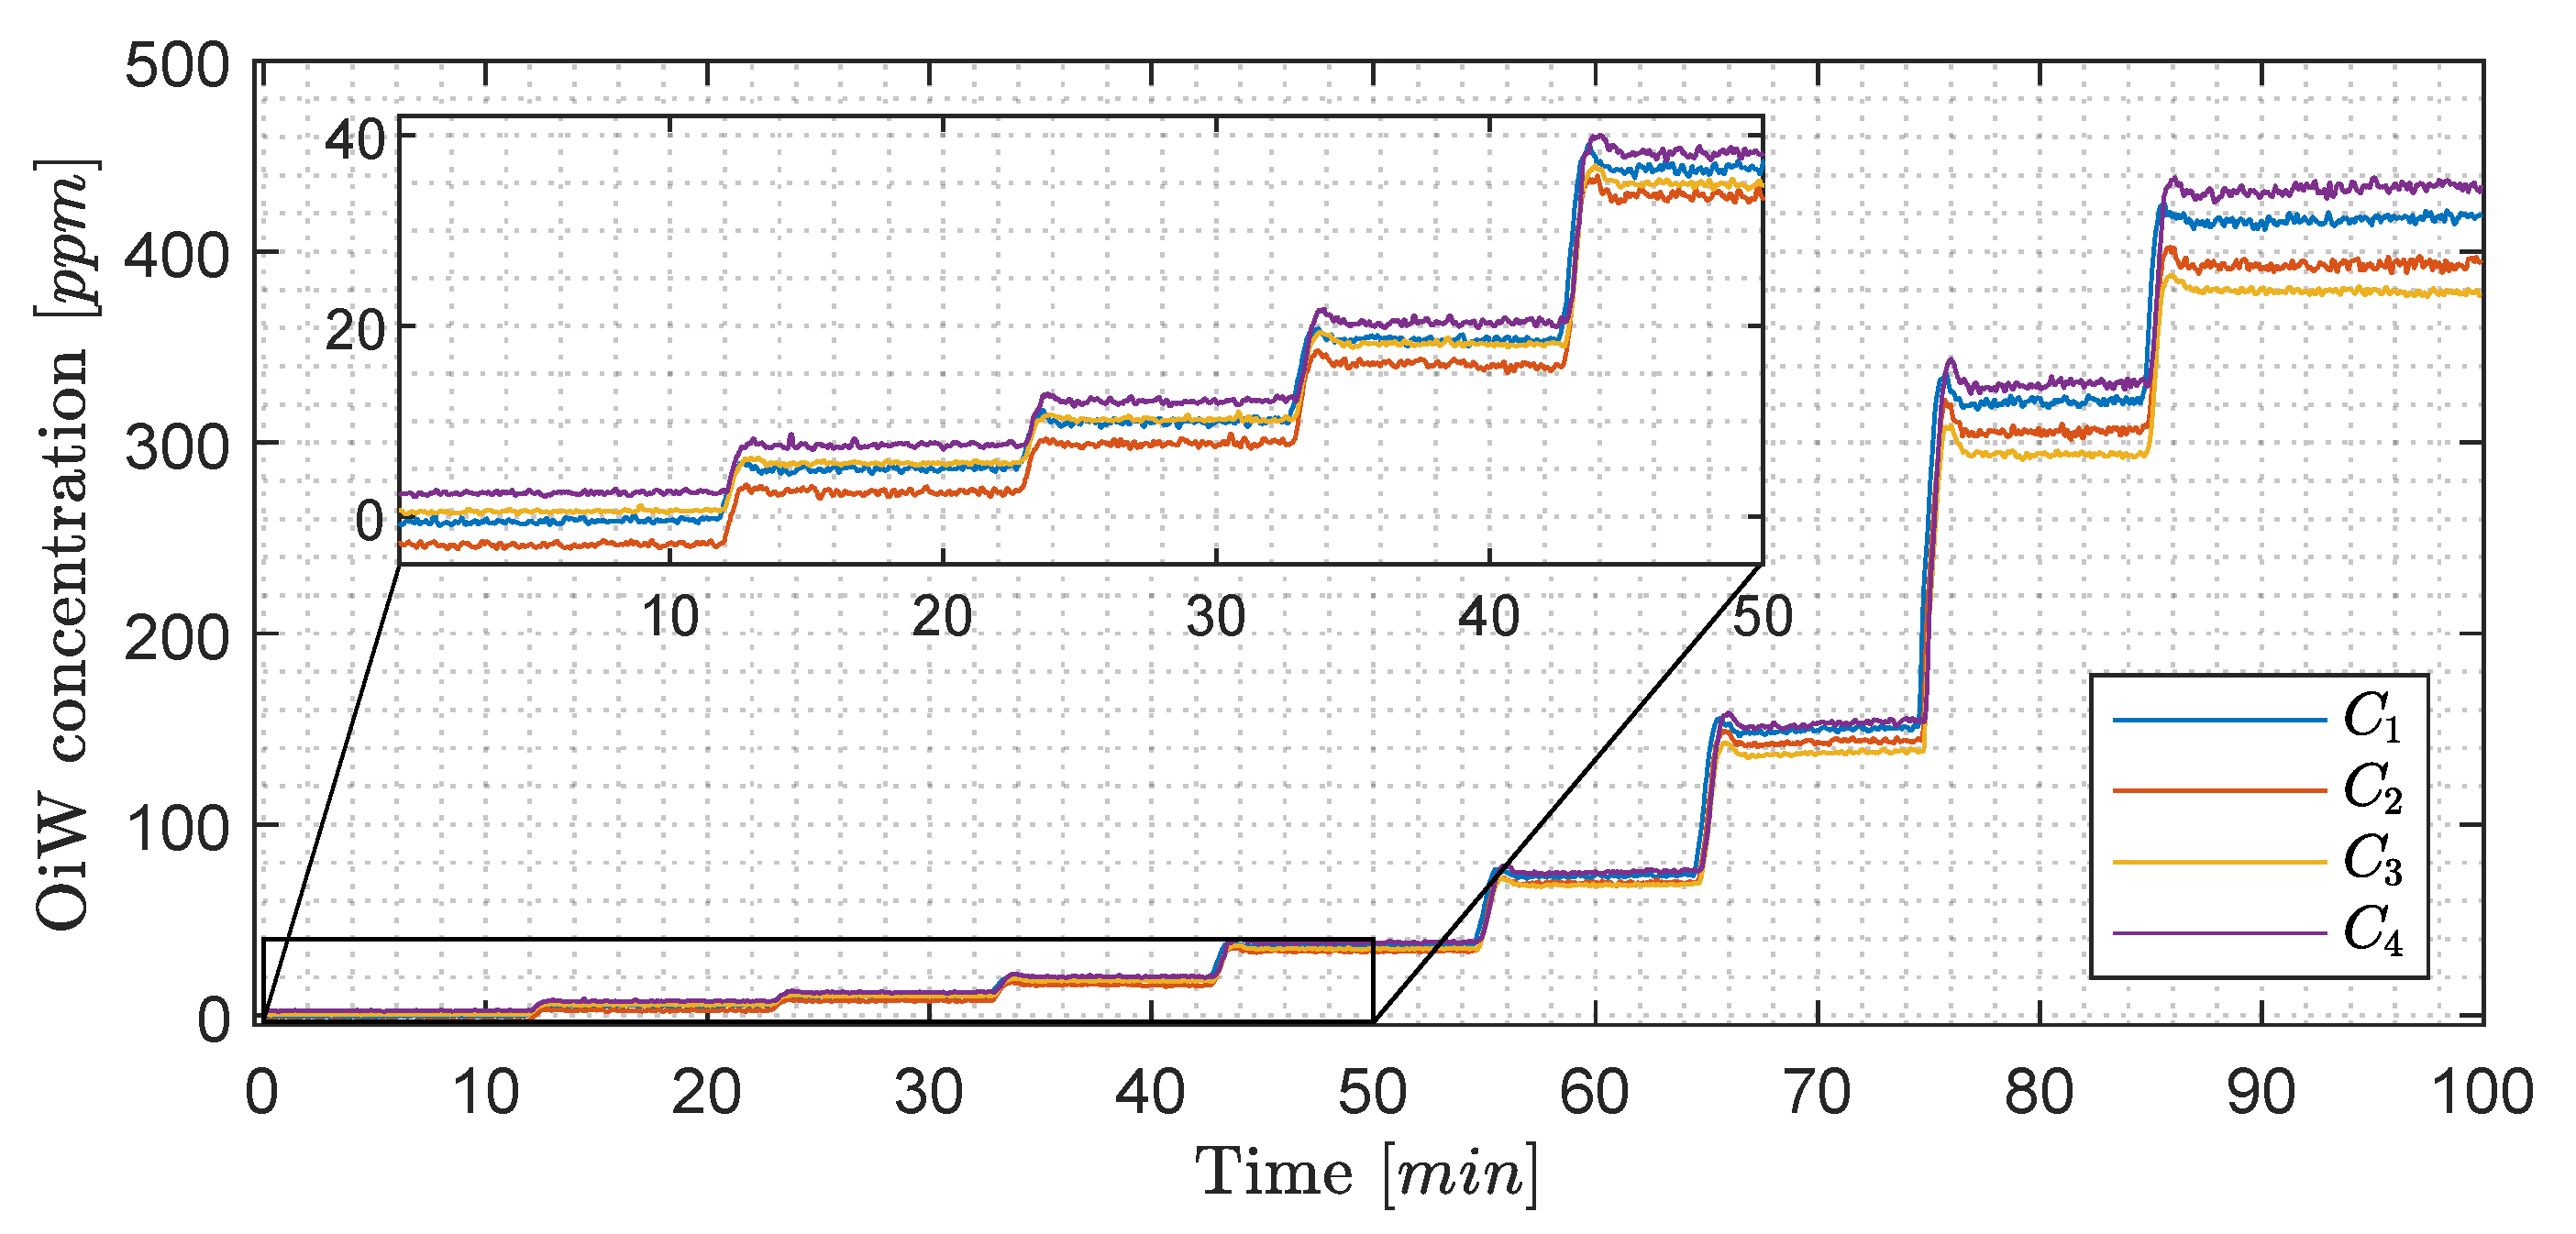
- Performance evaluation of the four OiW monitors’ calibration procedure and the related uncertainties.
4.1. Experiment Designs Executed on the By-Passed Pilot-Plant Setup
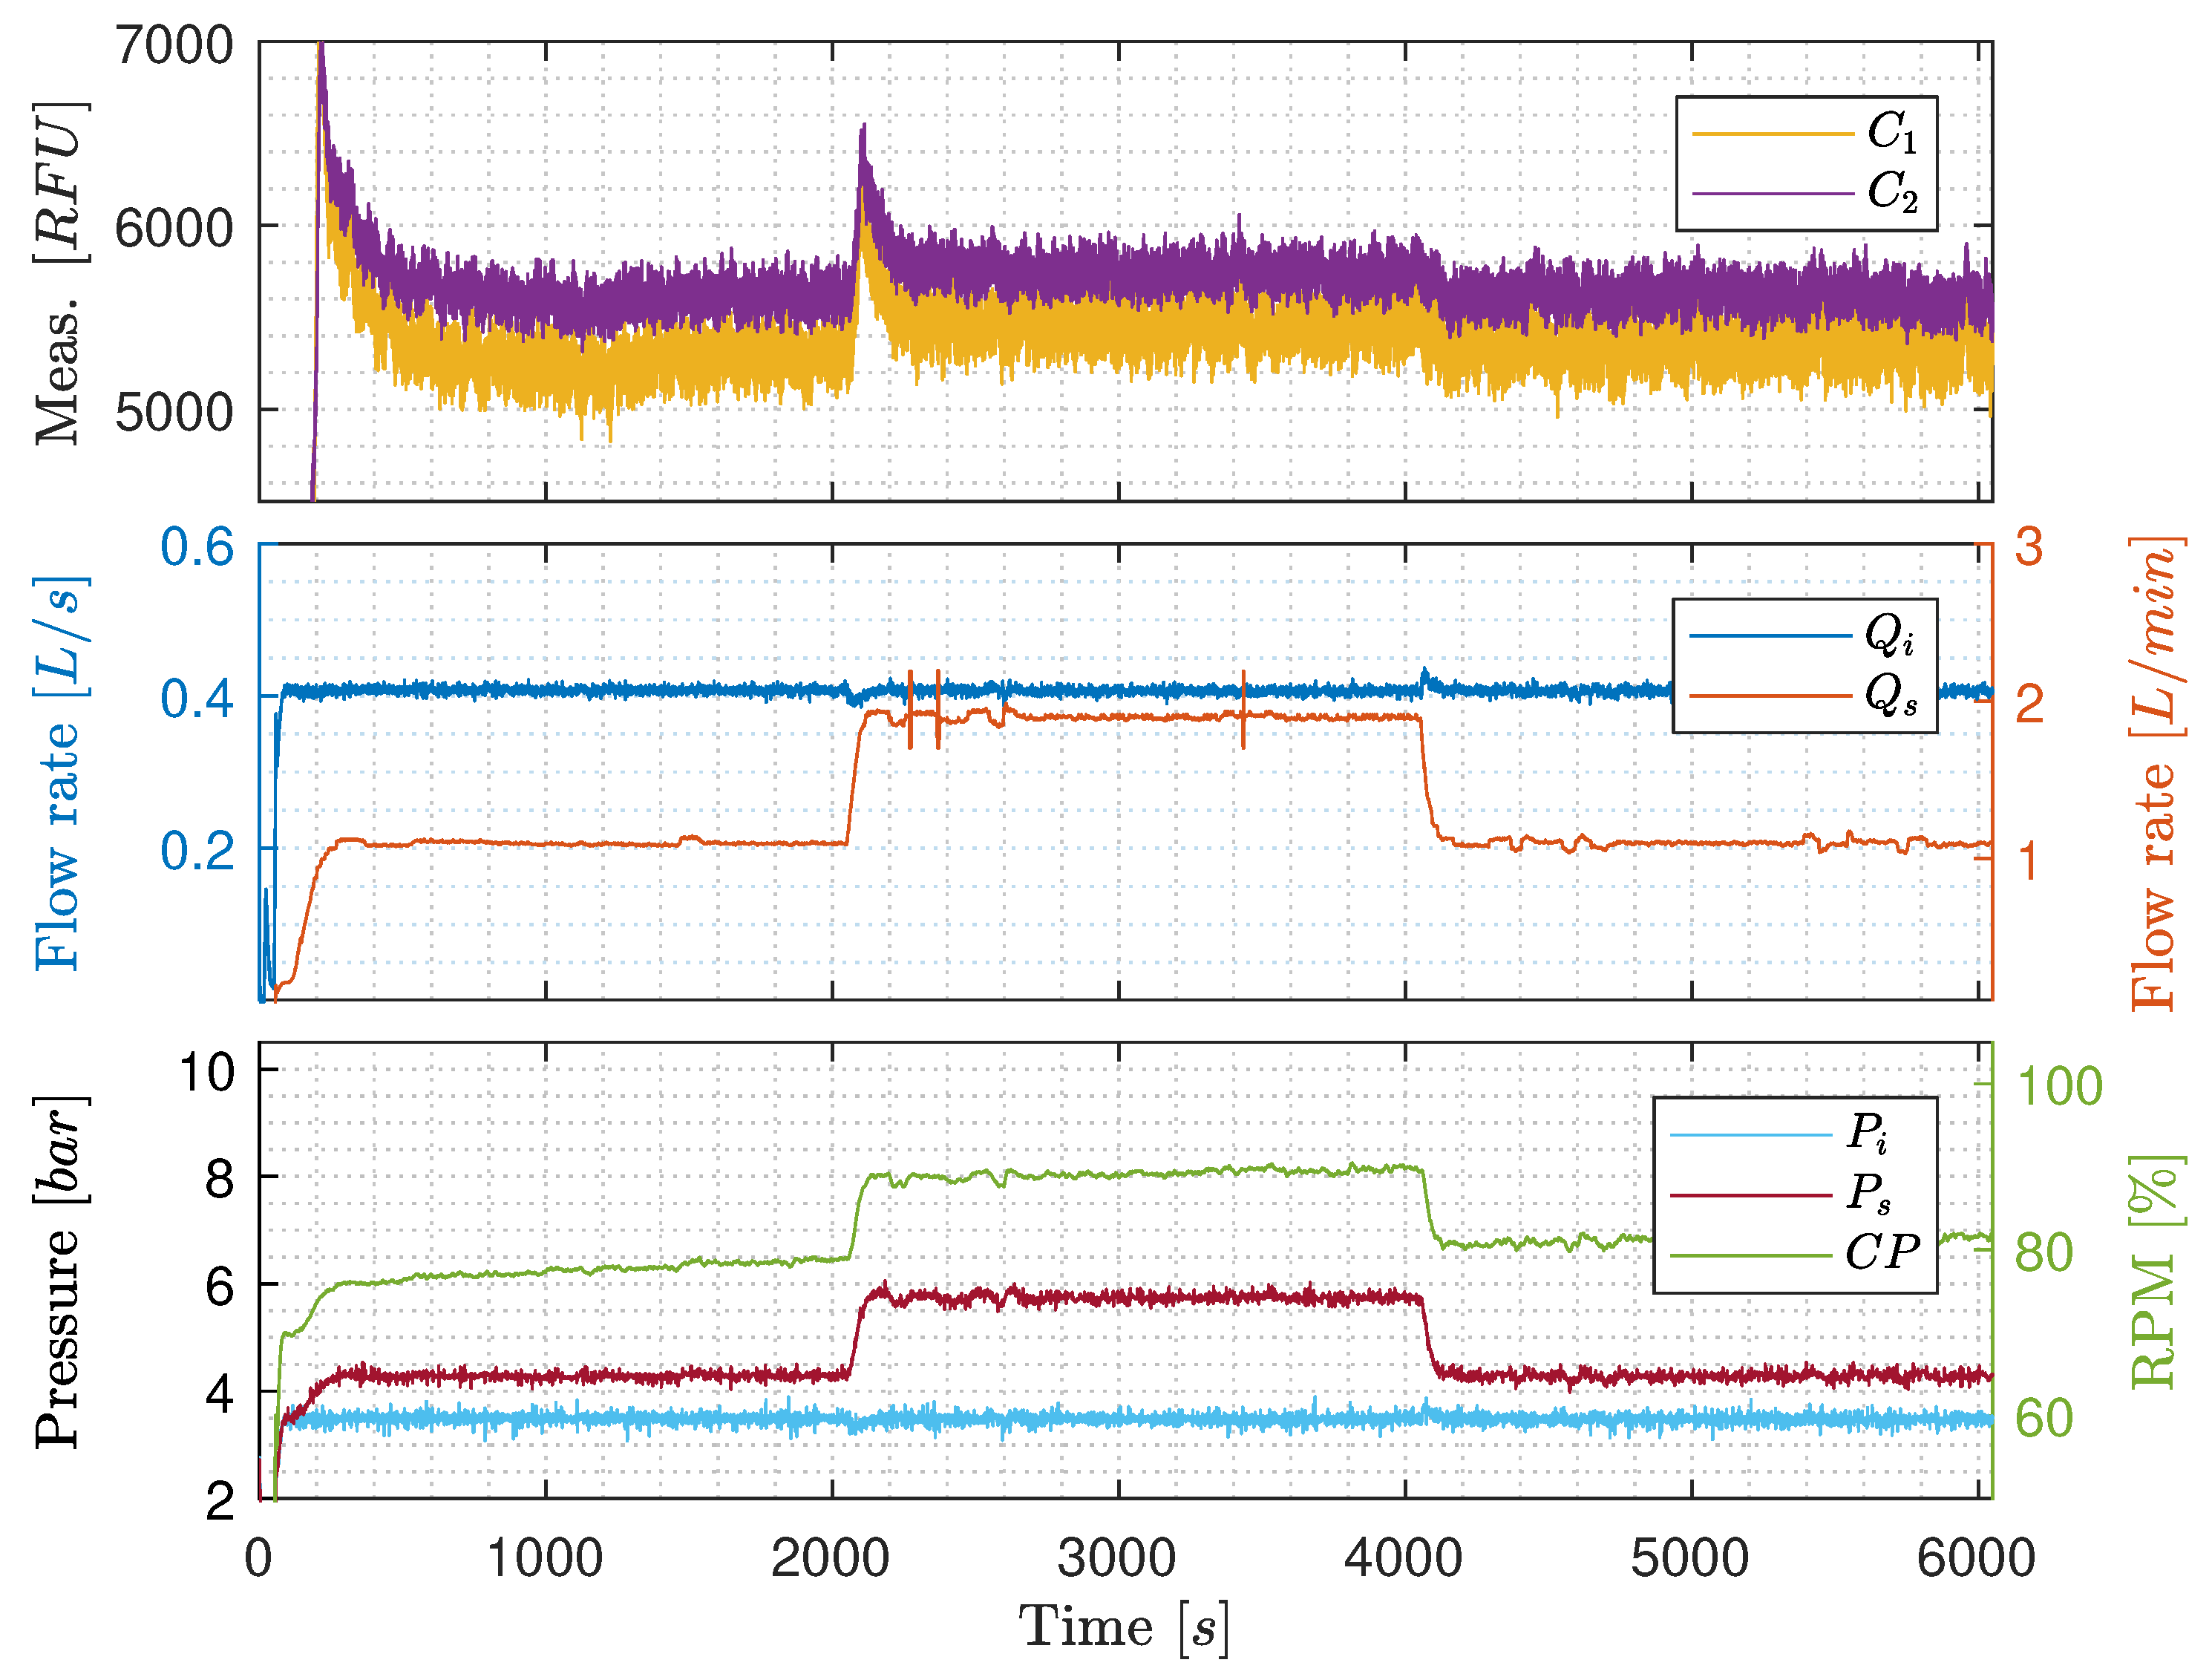
- was stepped two times between 0.1 and 0.4 , and last time between 0.1 and 0.5 . This was accomplished using as feedback to a PI-controller for controlling the rotational speed of .
- is kept constant at 1.1 by using as feedback to a PI-controller for controlling opening degree.
- and were fully open throughout the experiment.
- was kept constant at 0.4 by controlling the rotational speed of .
- was stepped from 1.1 to 1.9 and back again by manipulating the opening degree.
- and was fully open throughout the experiment.
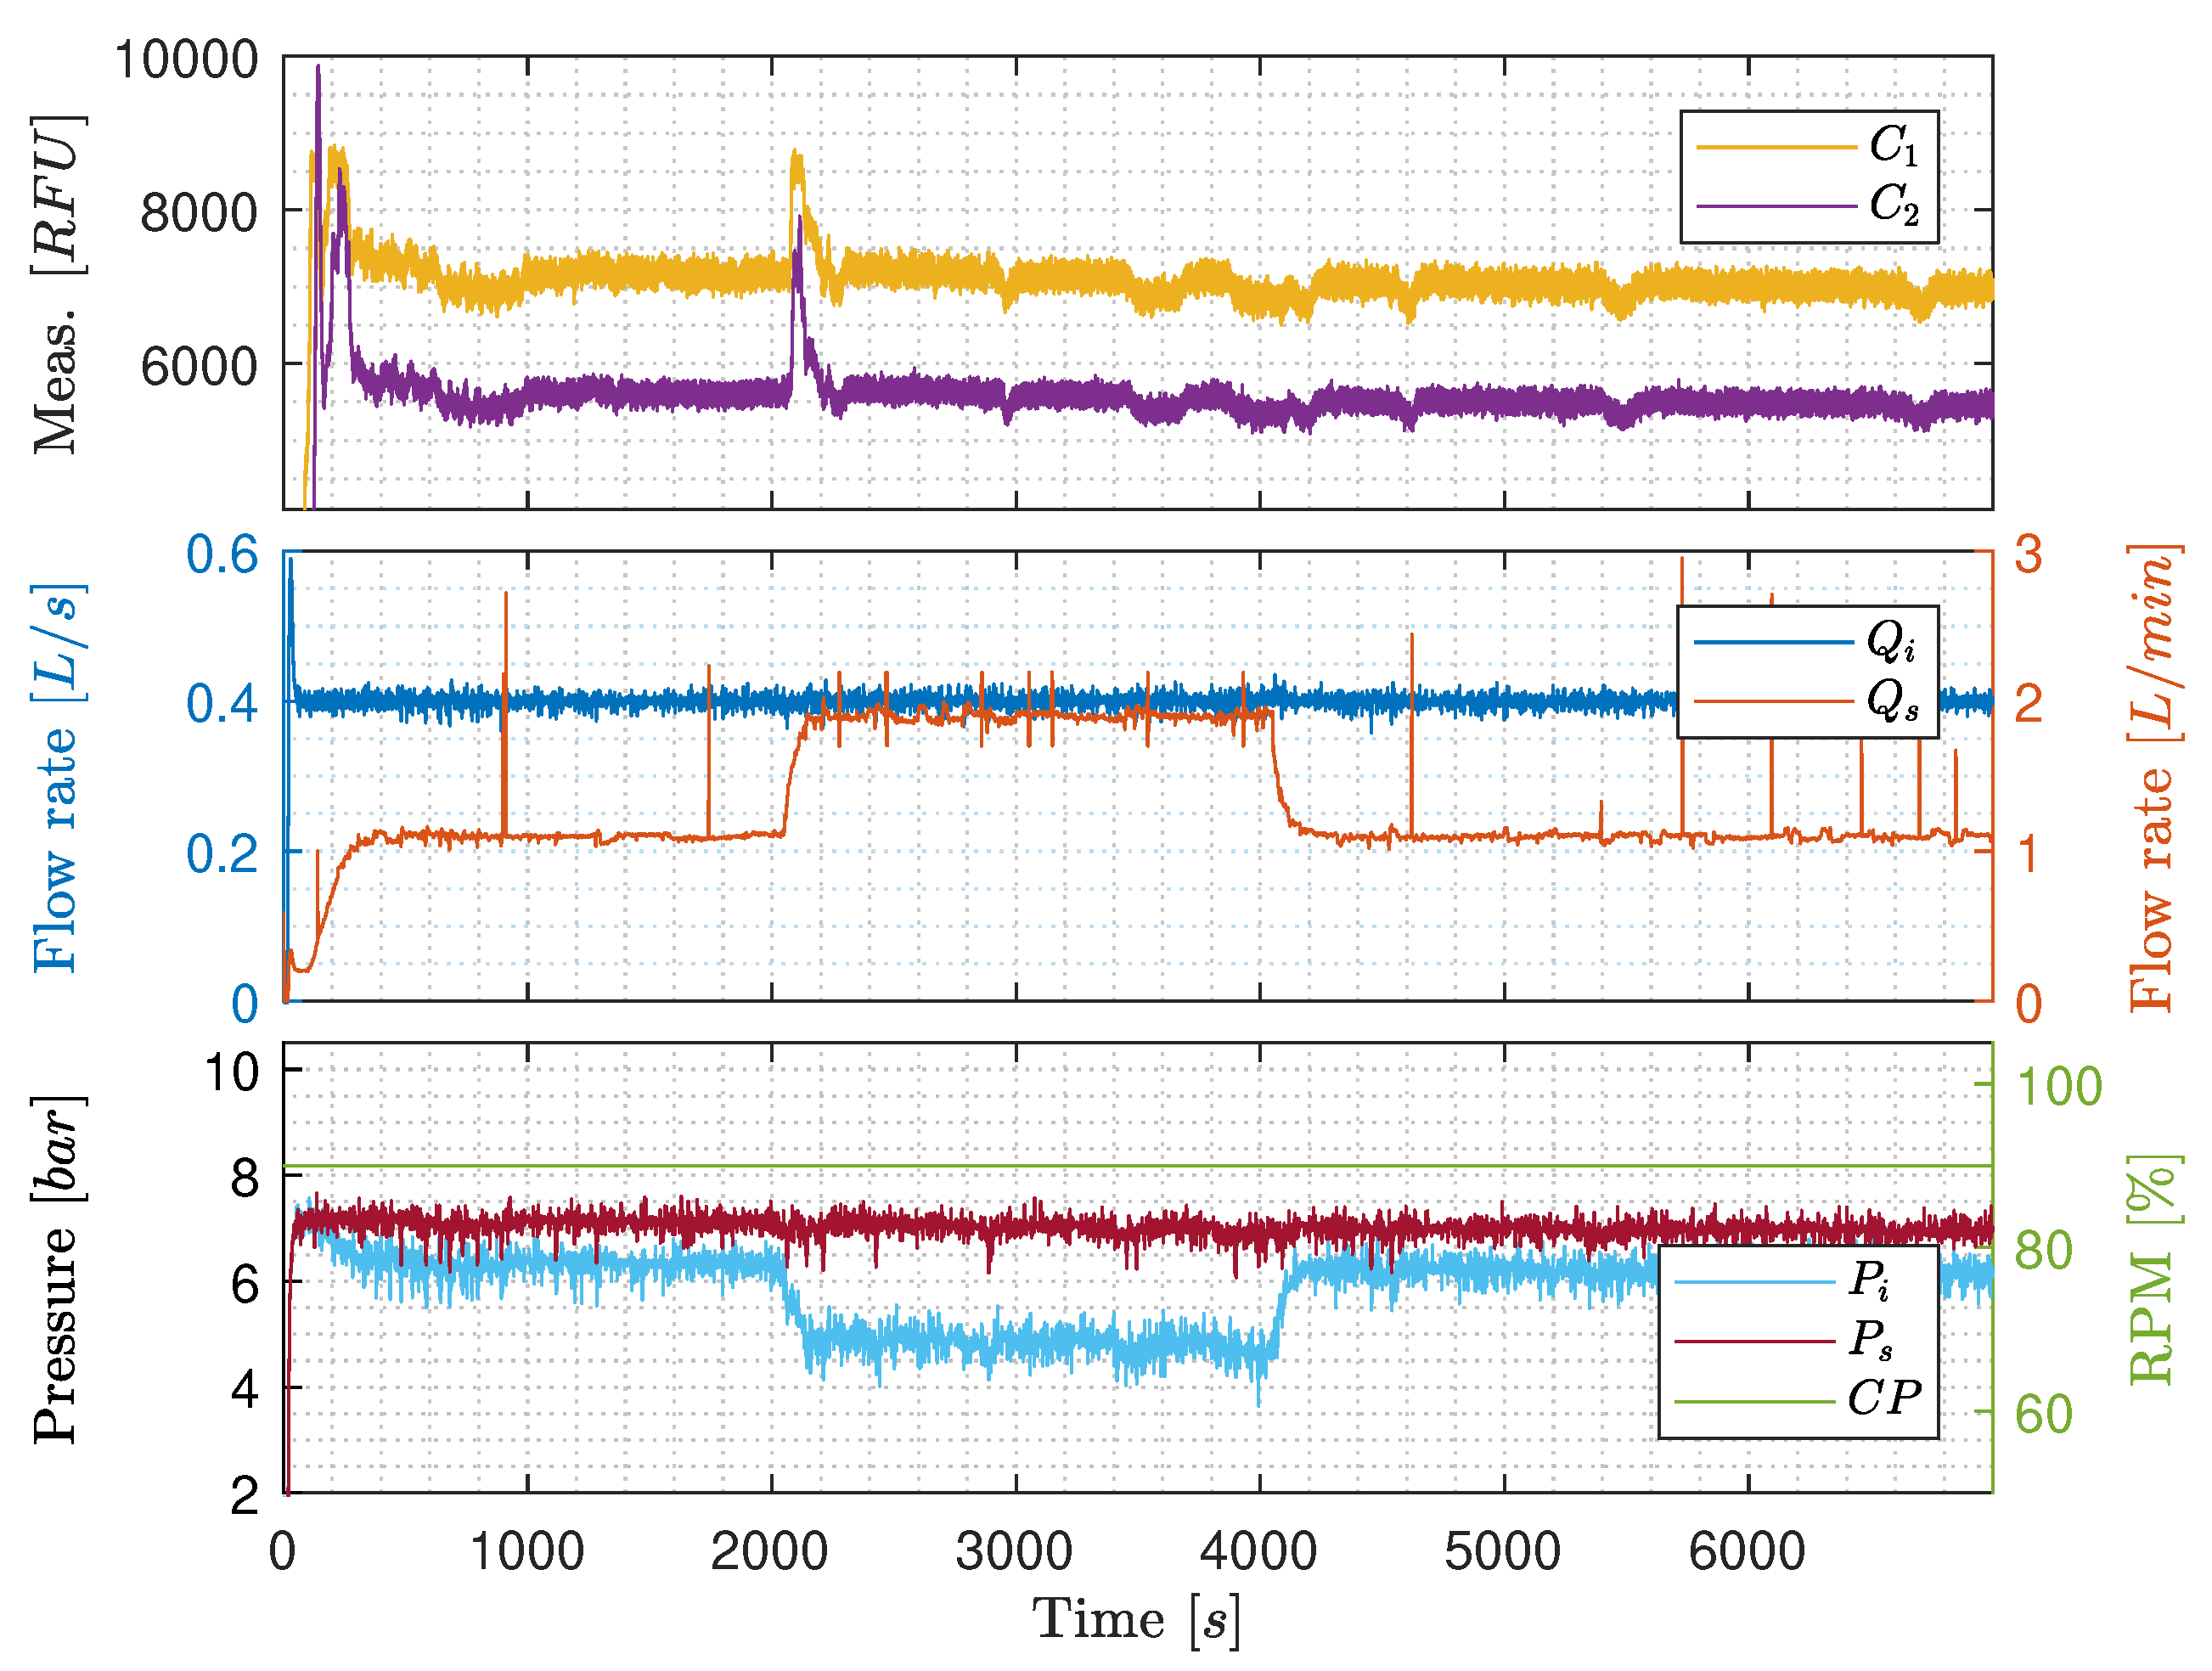
- was kept at a constant 90% pump speed.
- was stepped from 1.1 to 1.9 and back again by manipulating the opening degree of .
- is kept constant at 0.4 by controlling ’s opening degree.
- was fully closed throughout the experiment.
4.2. Experiment Designs Executed on Different Standalone Systems
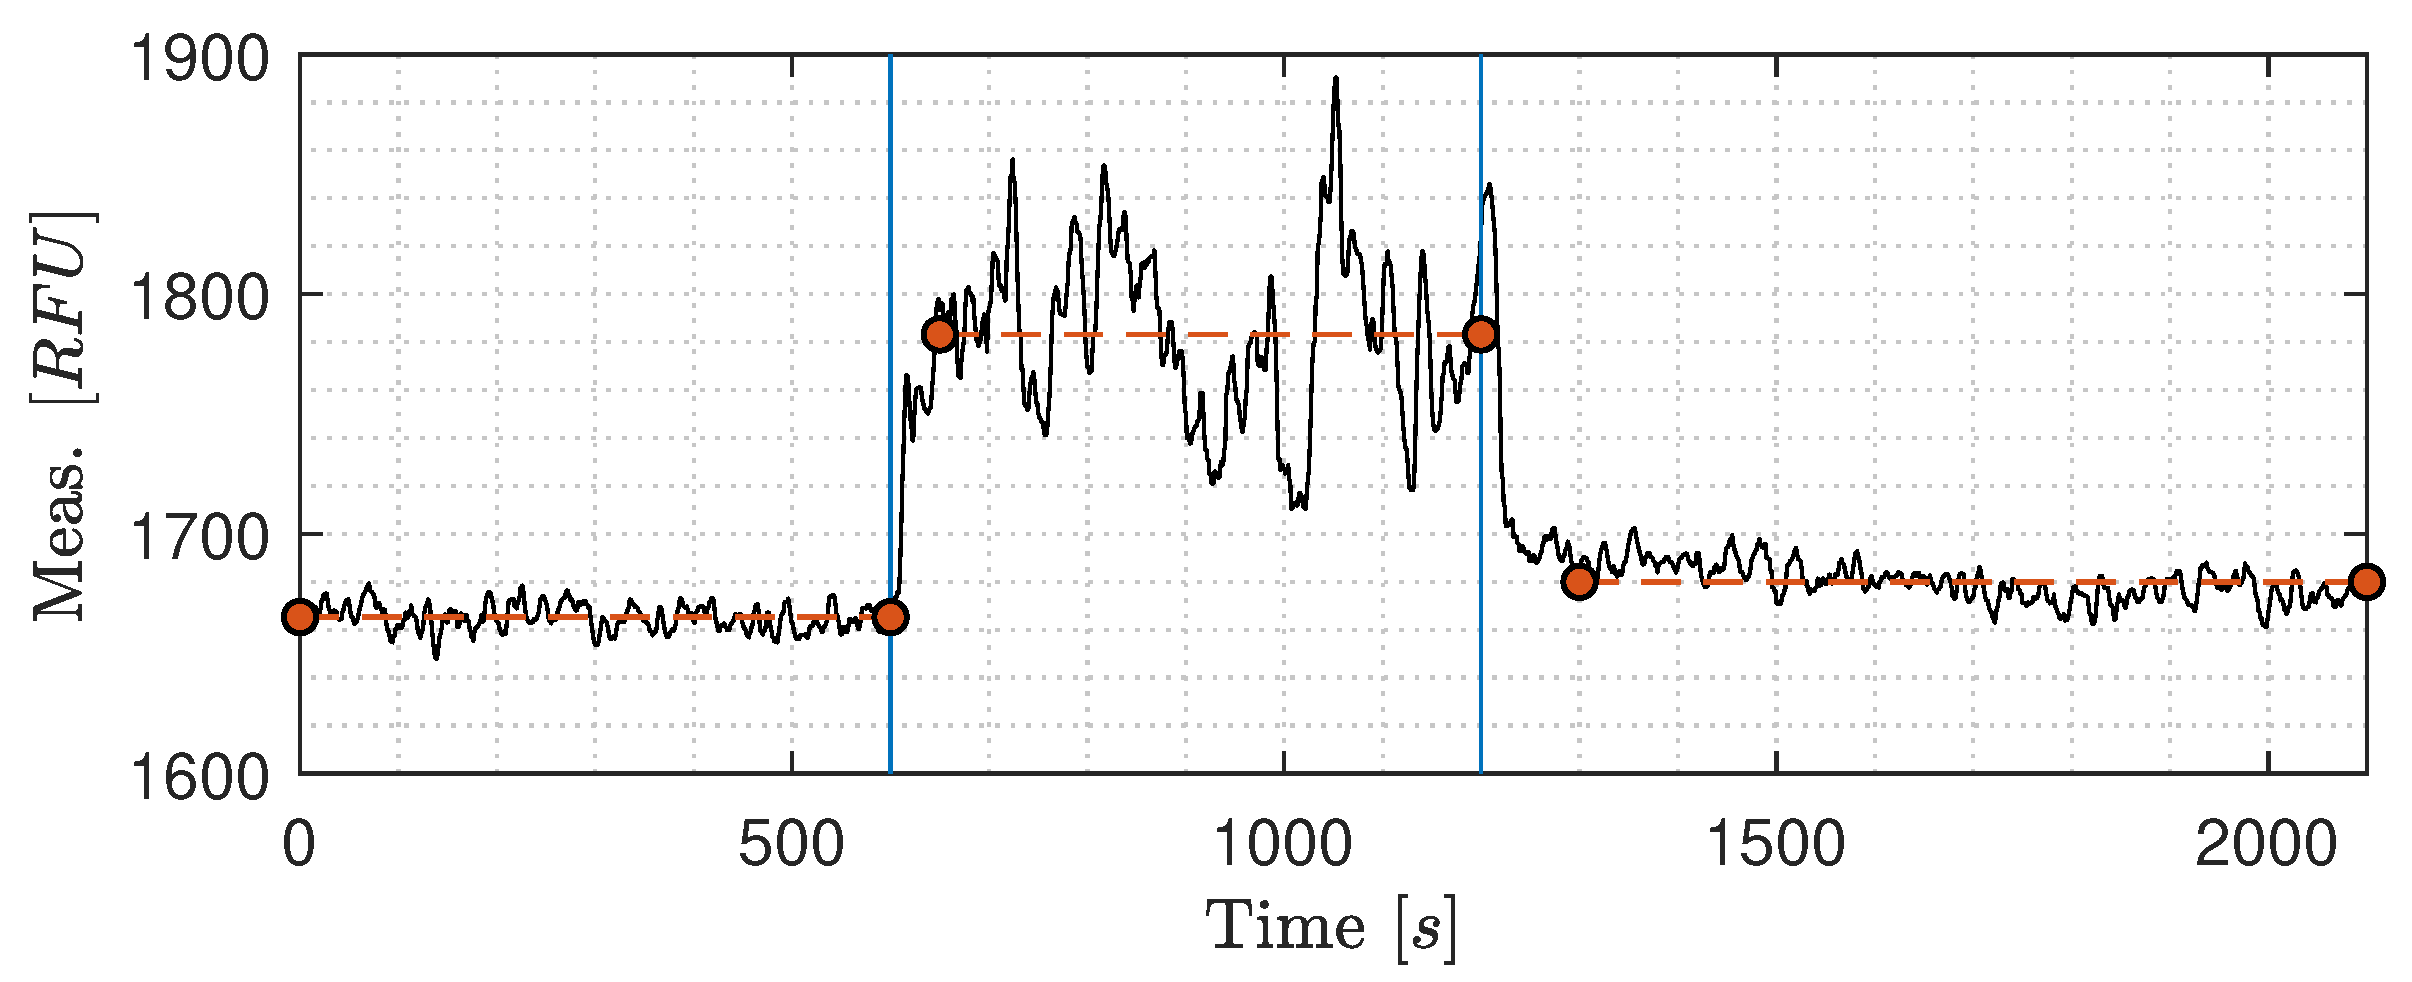
- Fixed speed to have a constant flow rate of ≈1.1 .
- Constant stirring speed of the magnetic stirrer.
- Constant air flow rate introduced down into the buffer tank, creating different sizes of air bubbles, together with the mixing behavior from the magnetic stirrer.
- Flow rate was constant ≈1.1 and ≈1.7 , respectively, by manipulating ’s opening degree.
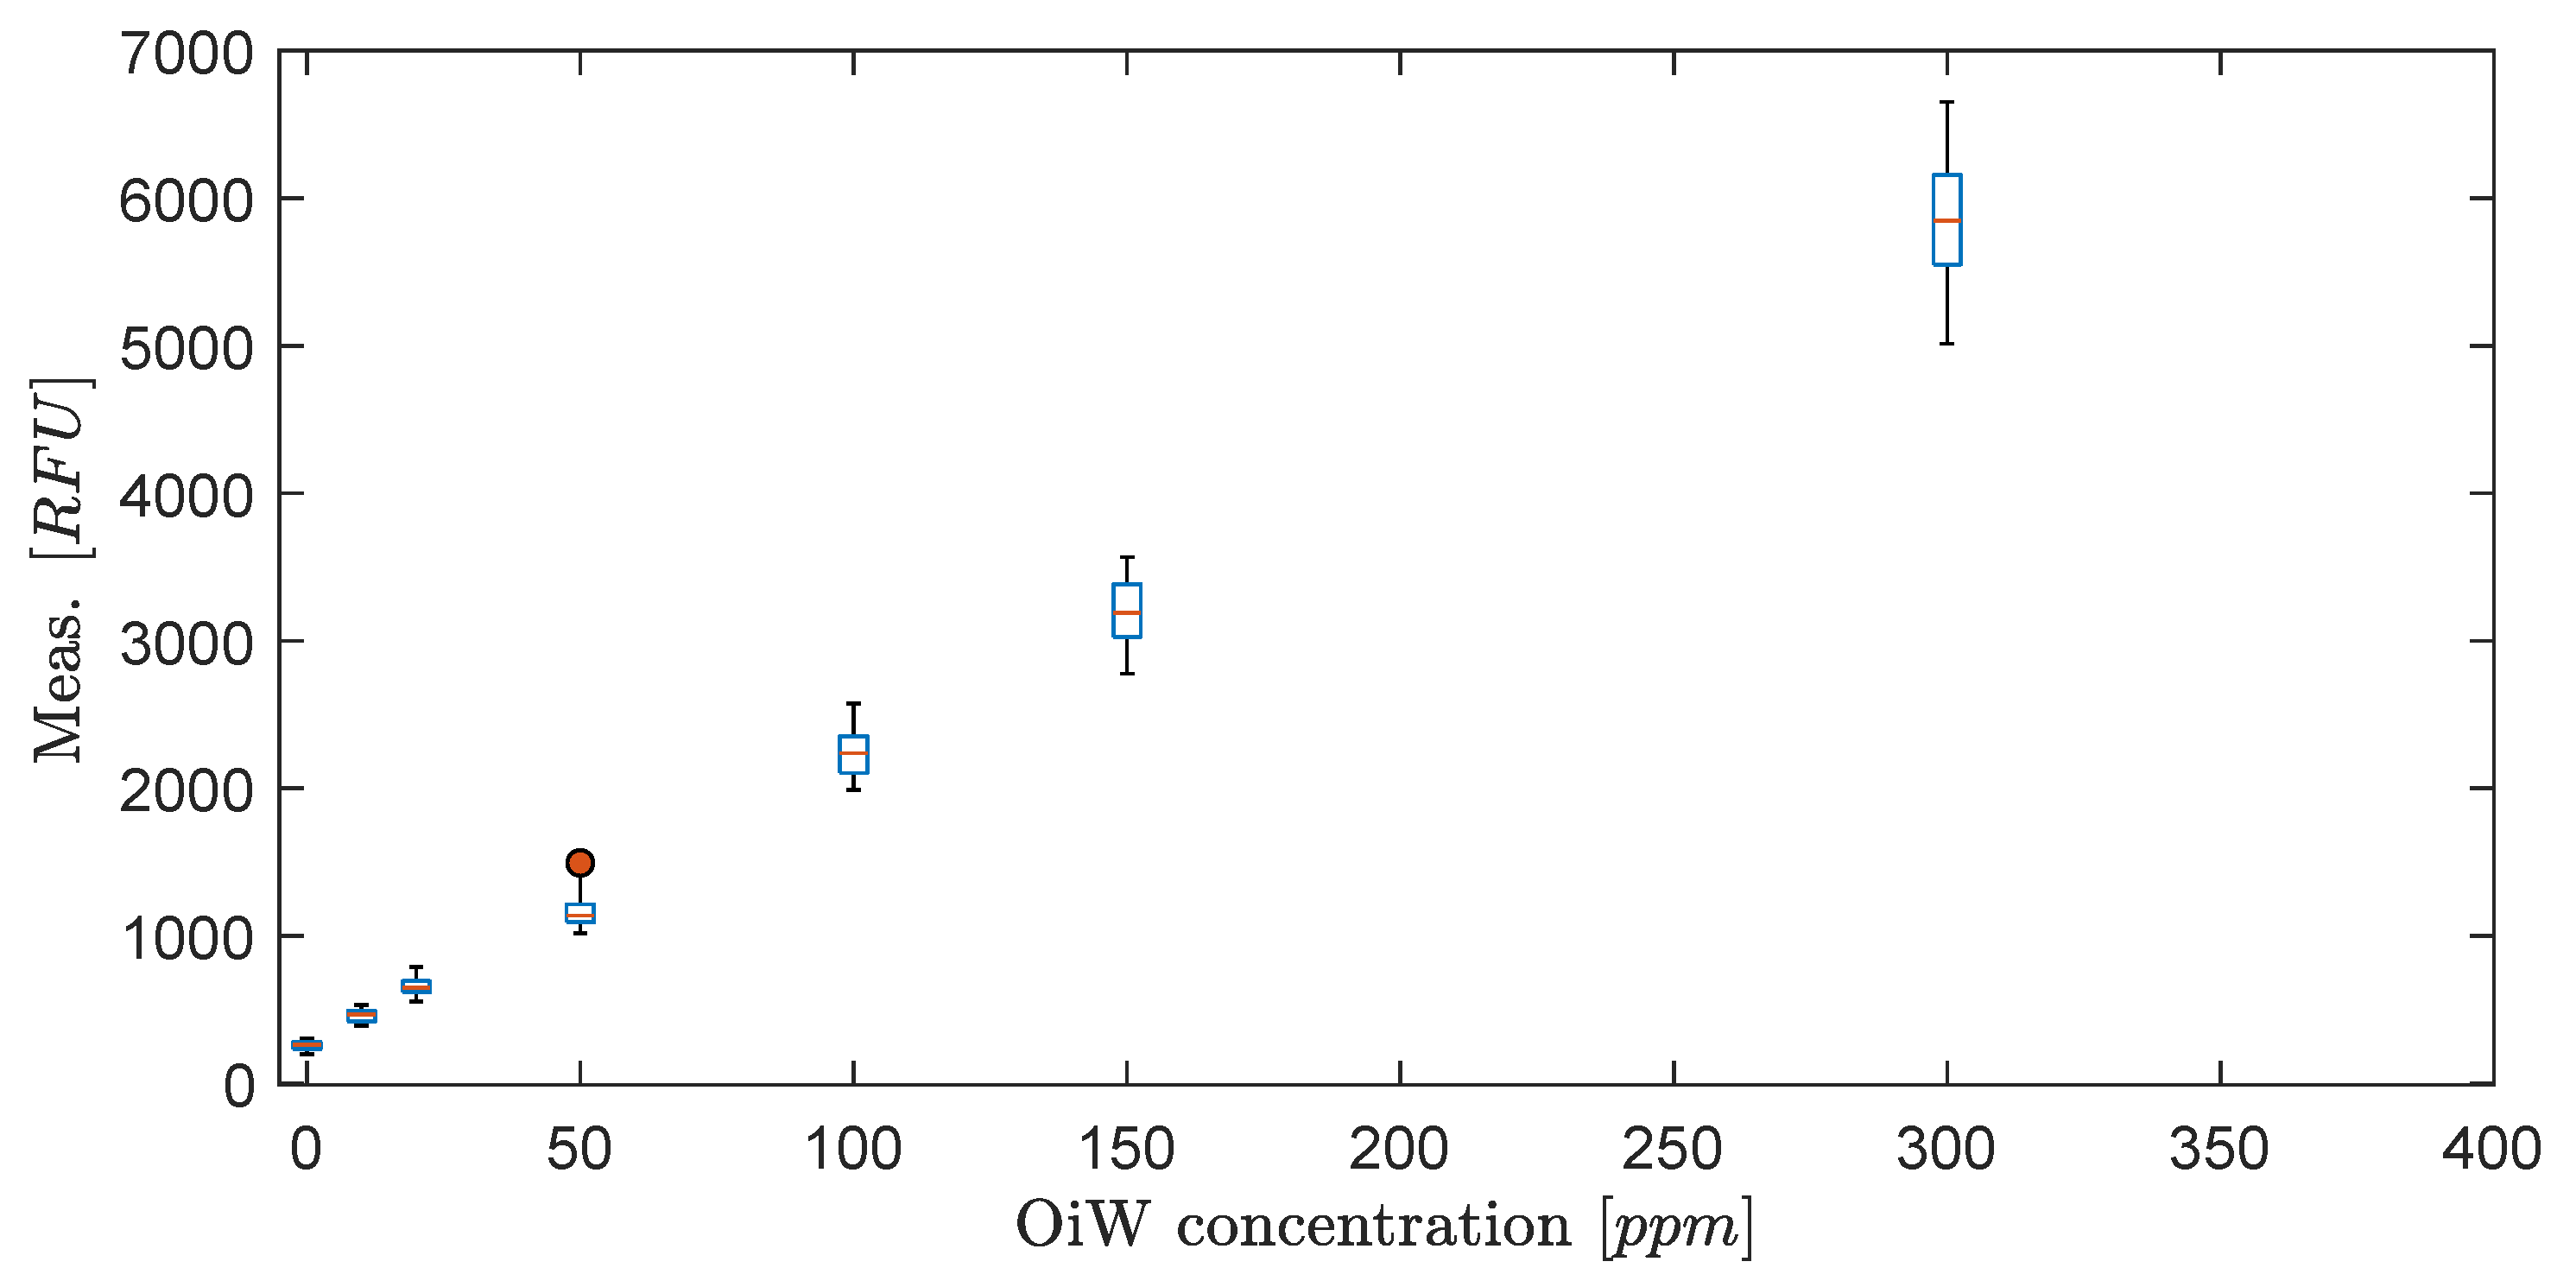
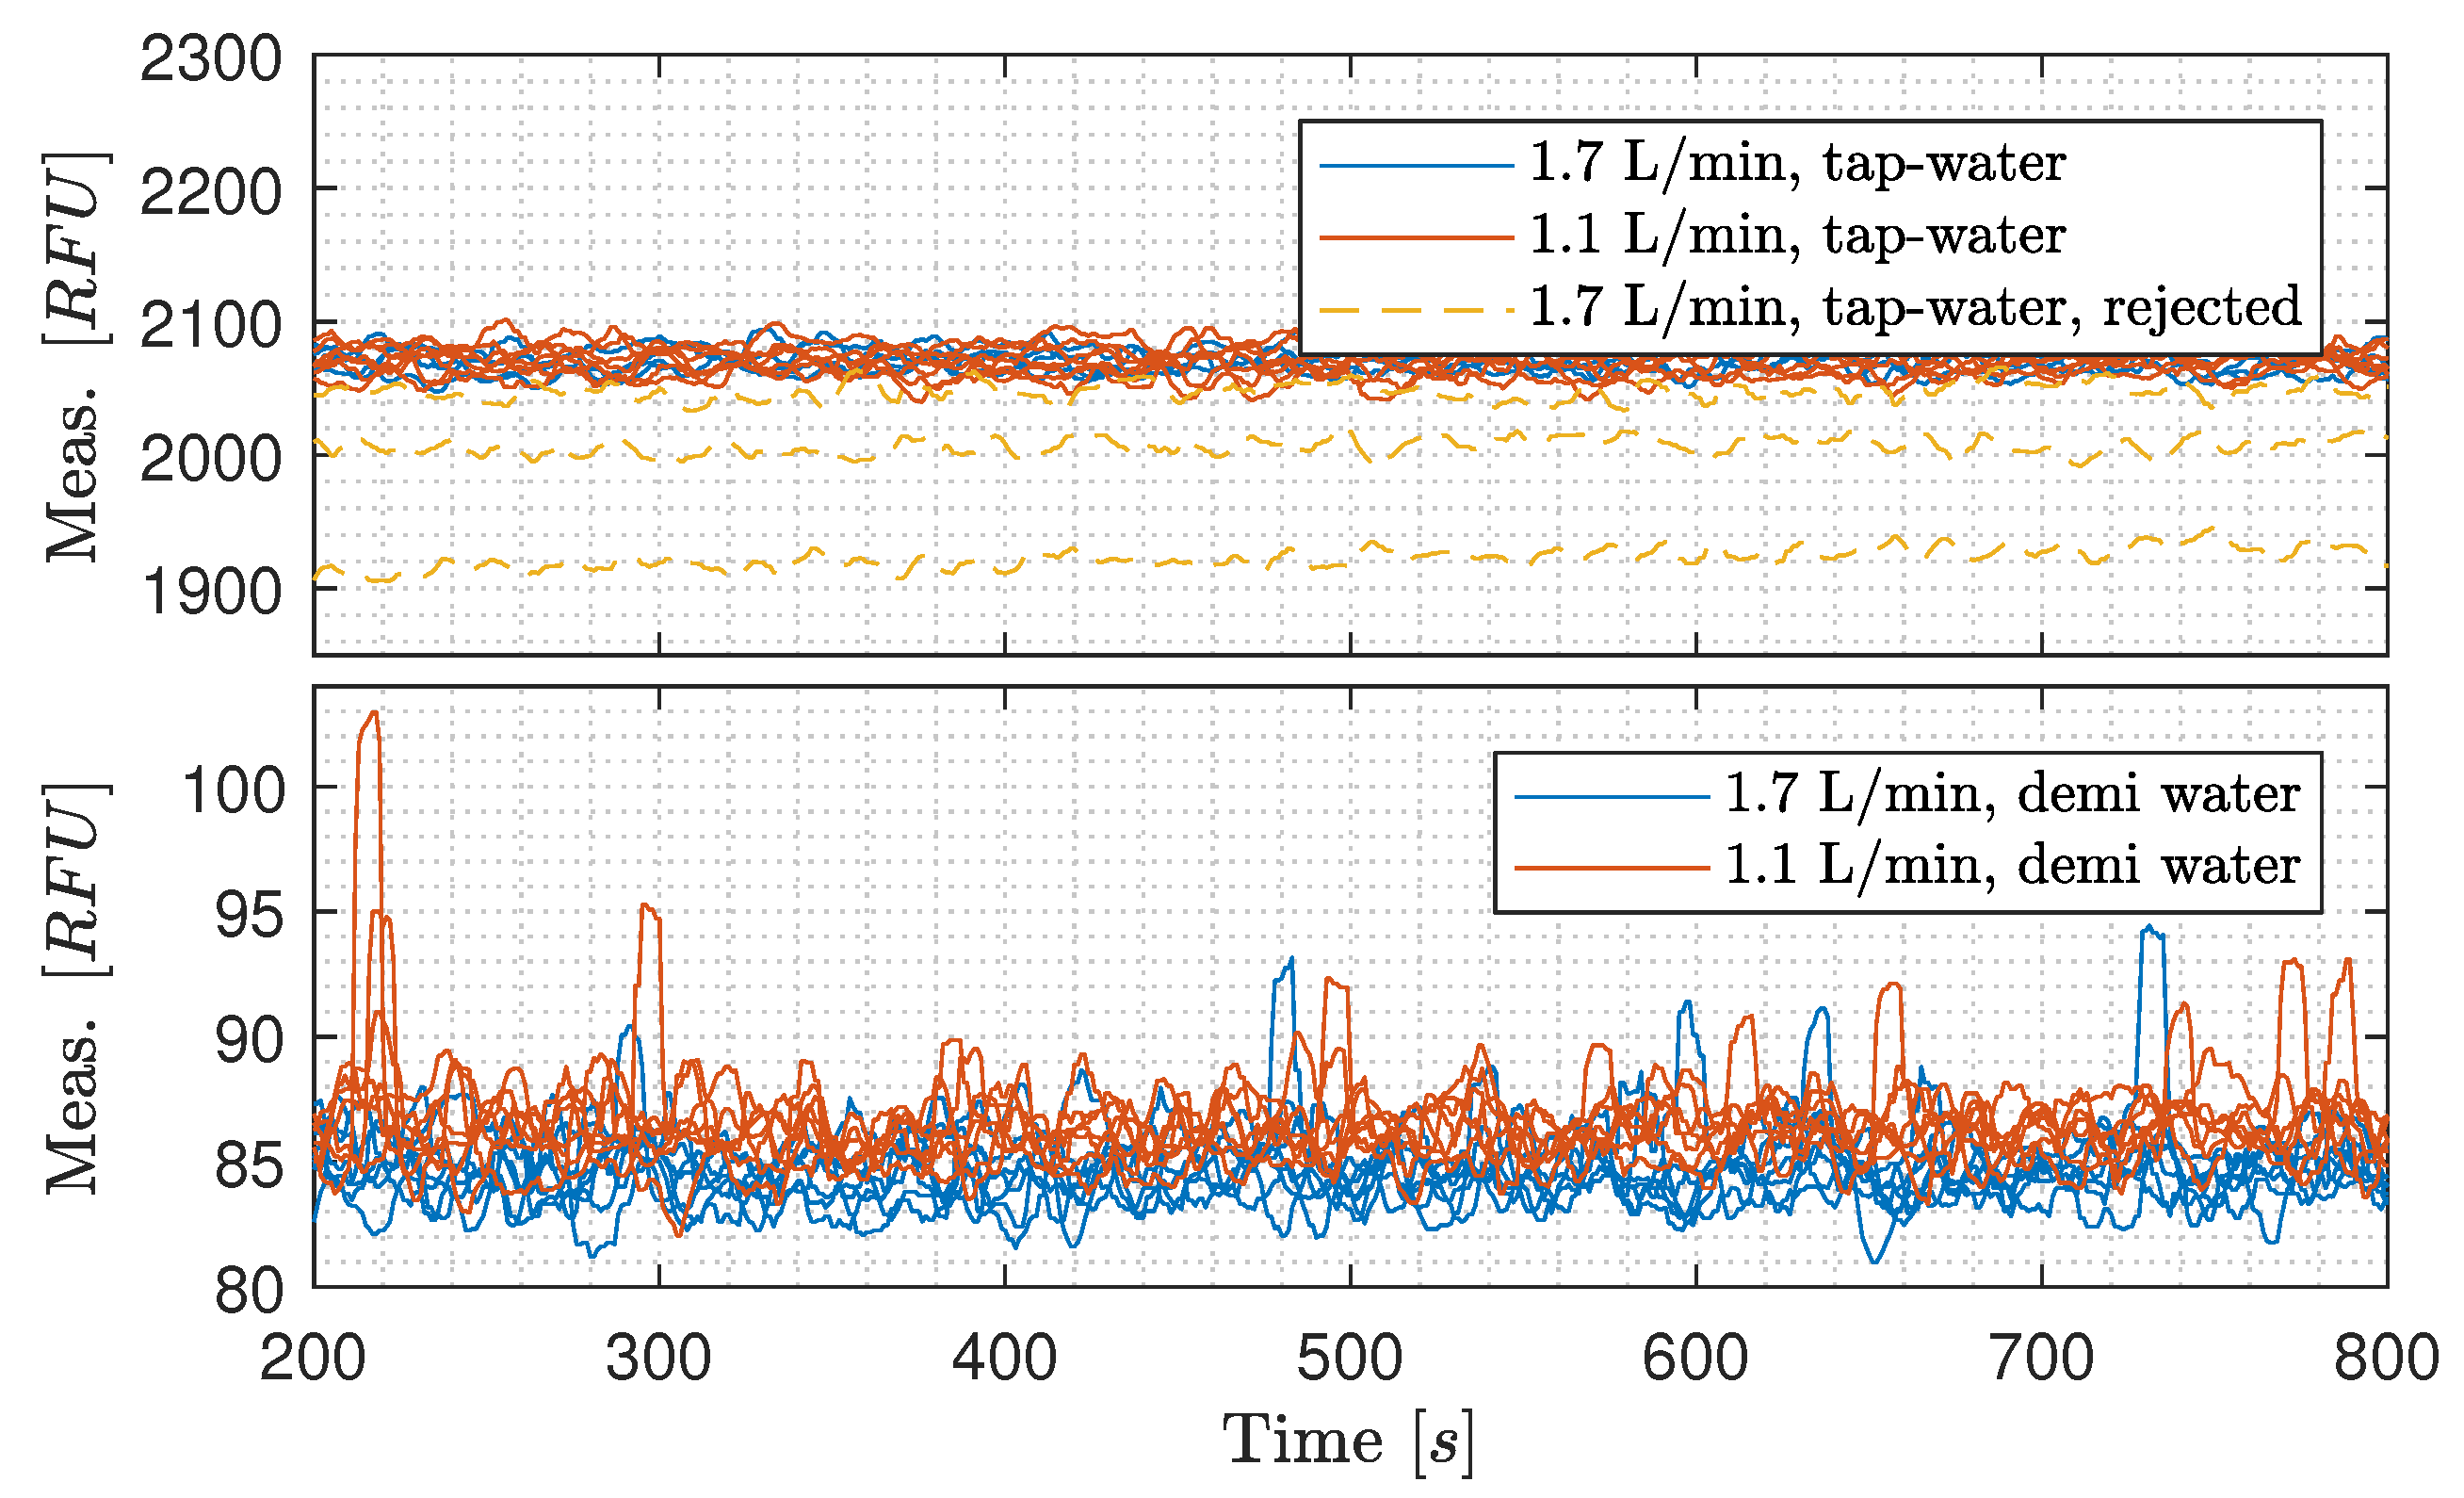
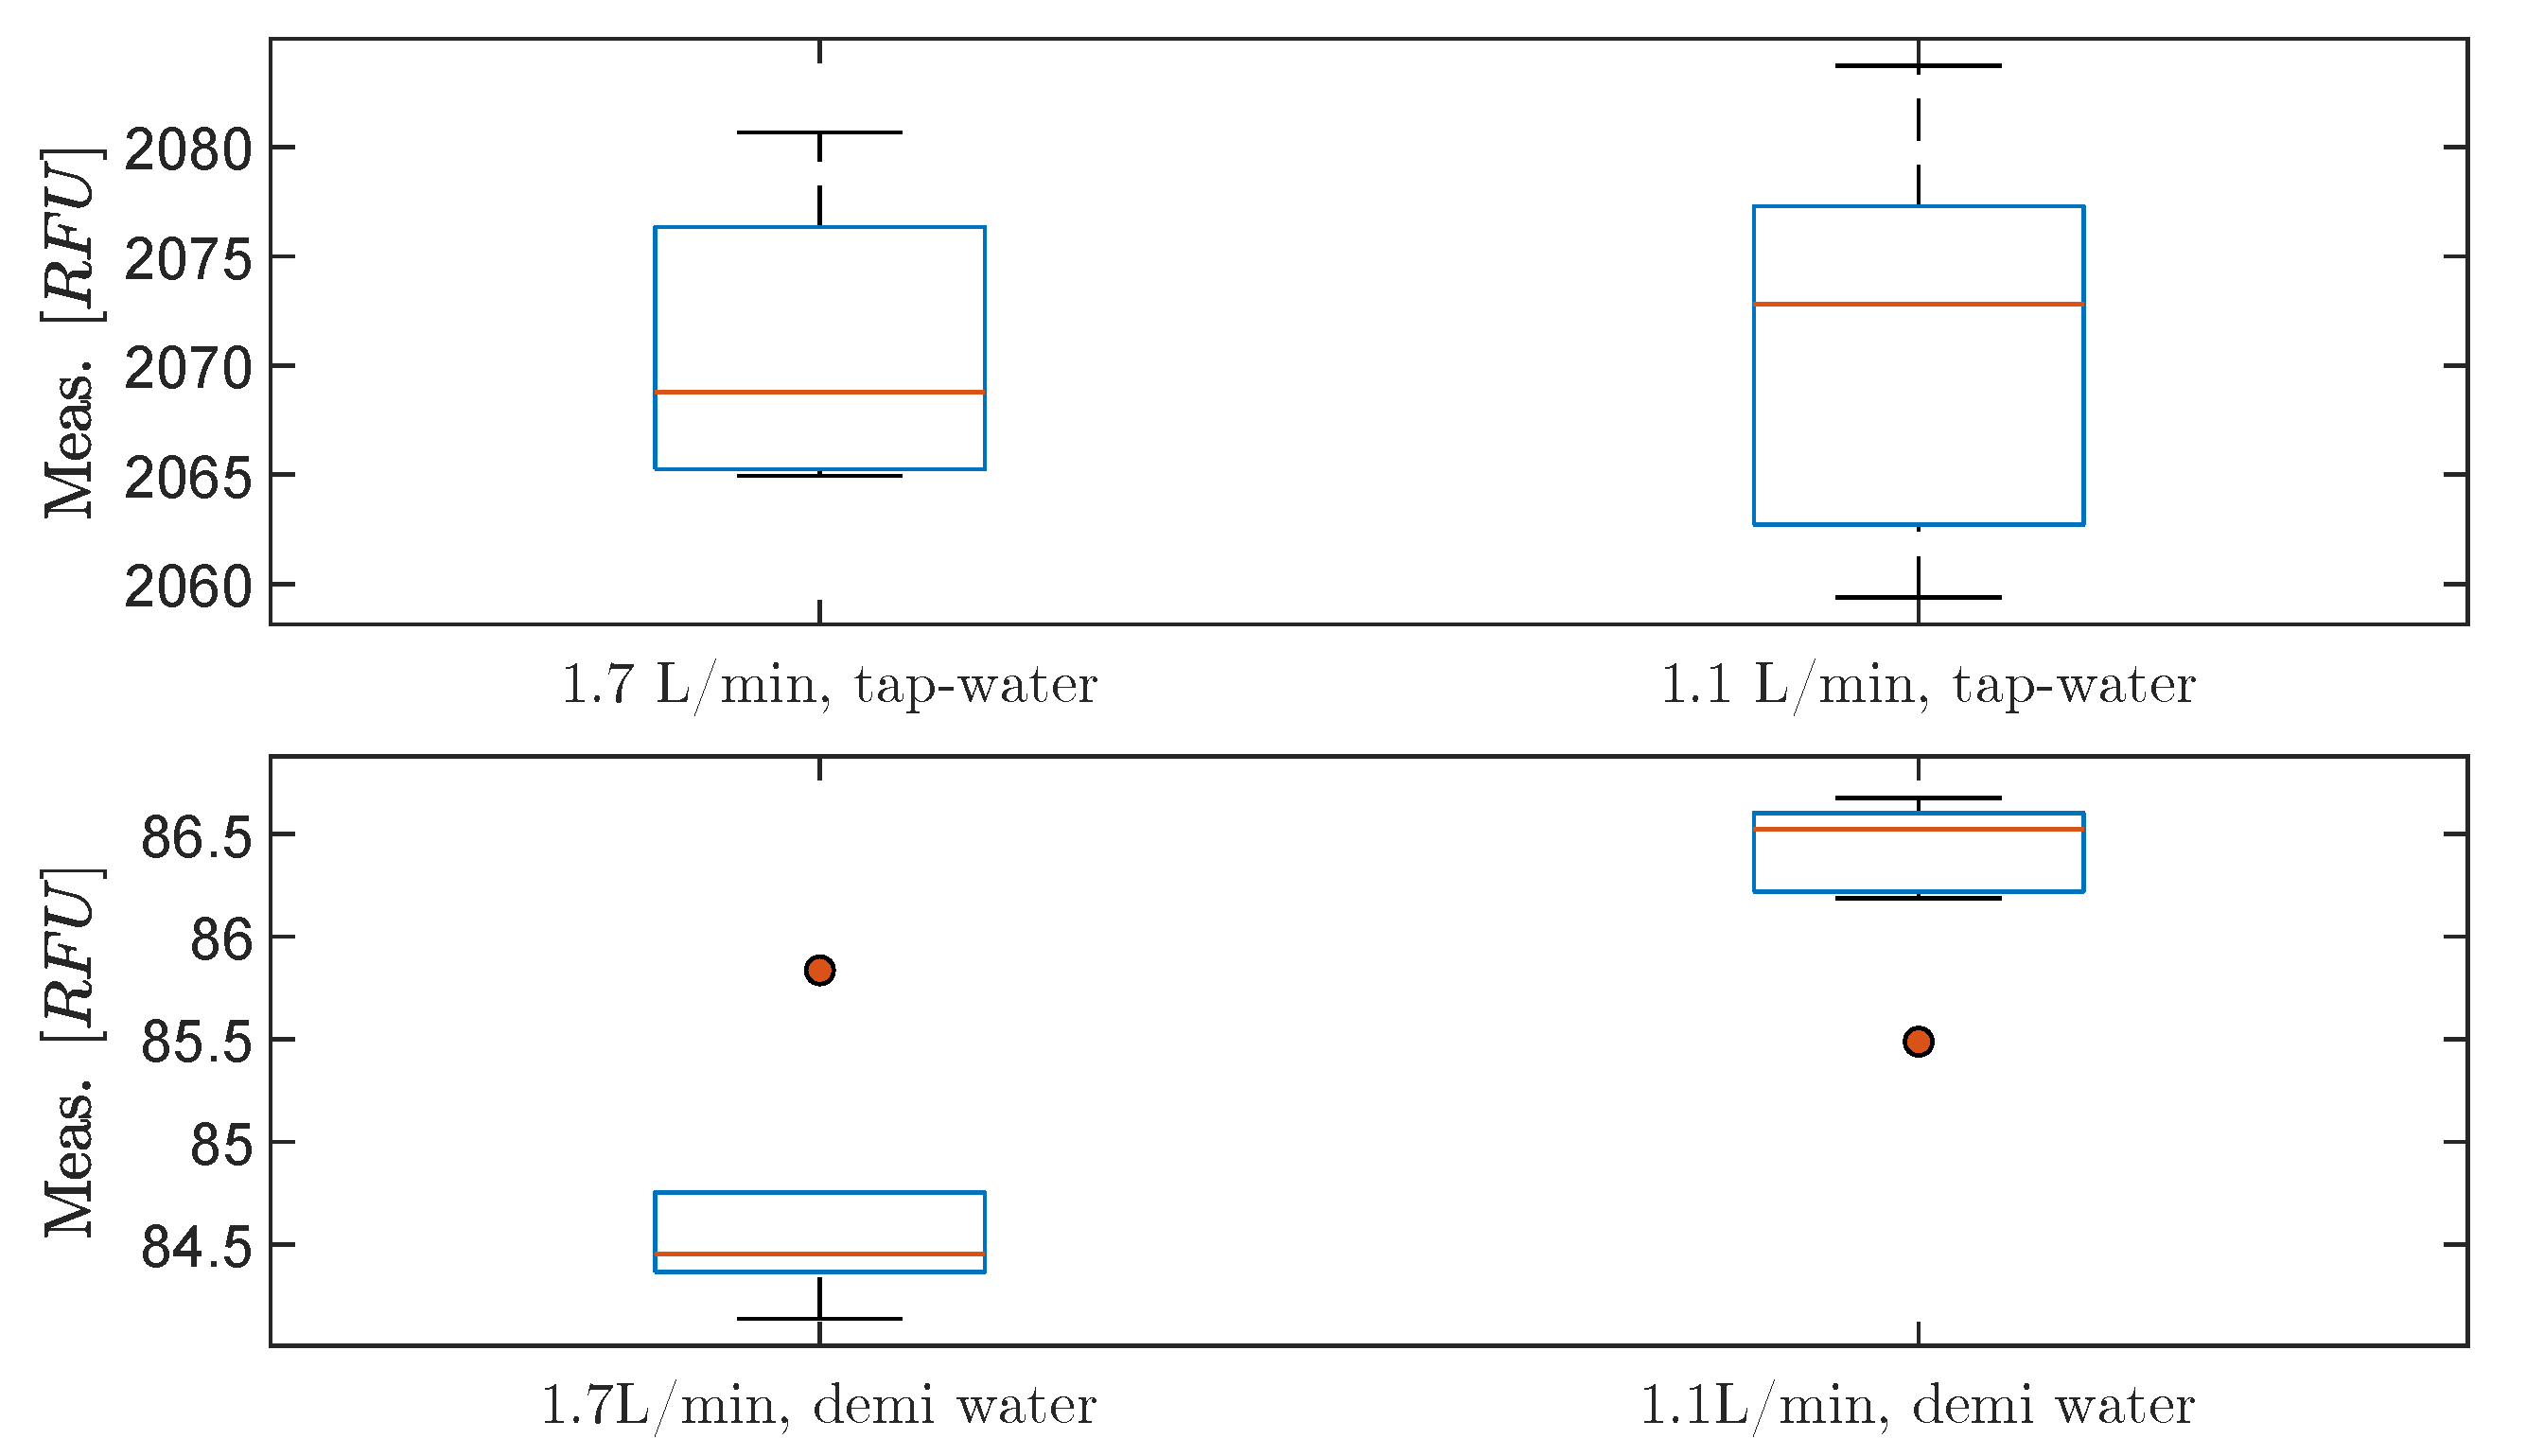
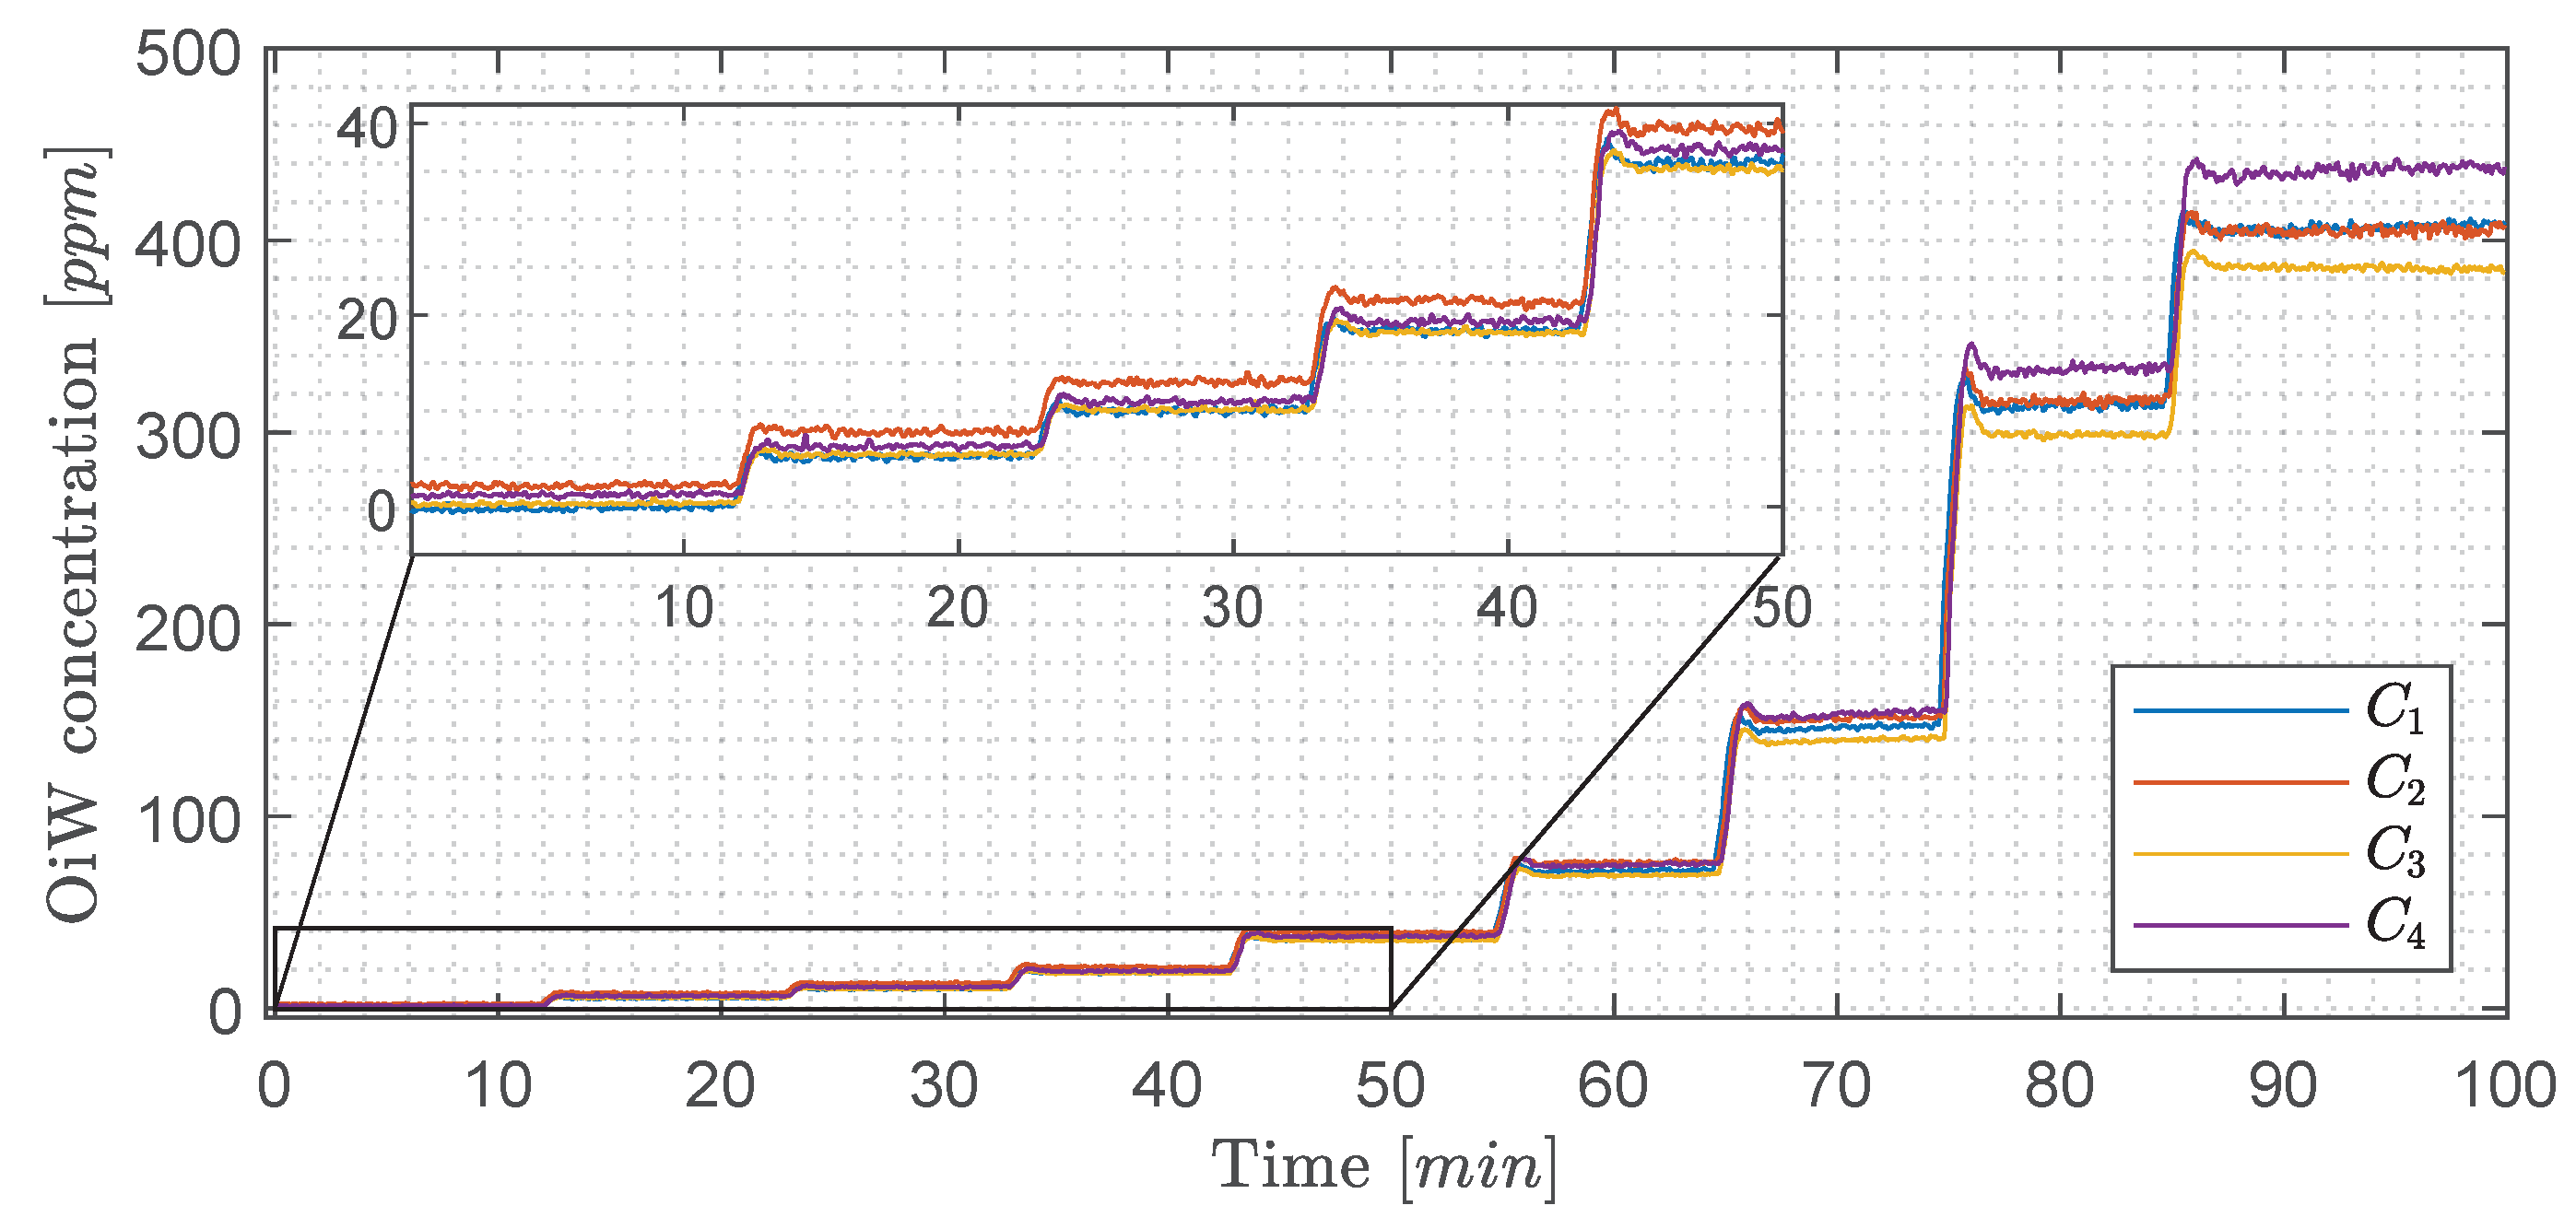
- Nine different concentrations are tested: 0, 5, 10, 20, 40, 80, 160, 320, and 400 . Demineralized water is used with a solution of oil and isopropanol to reduce the uncertainty in the heterogeneous mixture of OiW significantly. Demineralized water was chosen as the laboratory tap water was observed to fluoresce and change on a day-to-day basis.
- 1.9 was kept constant by controlling ’s opening degree.
- Fixed CP speed of 74%.
5. Results
5.1. Experiment Results Executed on the By-Passed Pilot-Plant Setup
5.2. Experiment Results Executed on Standalone Systems
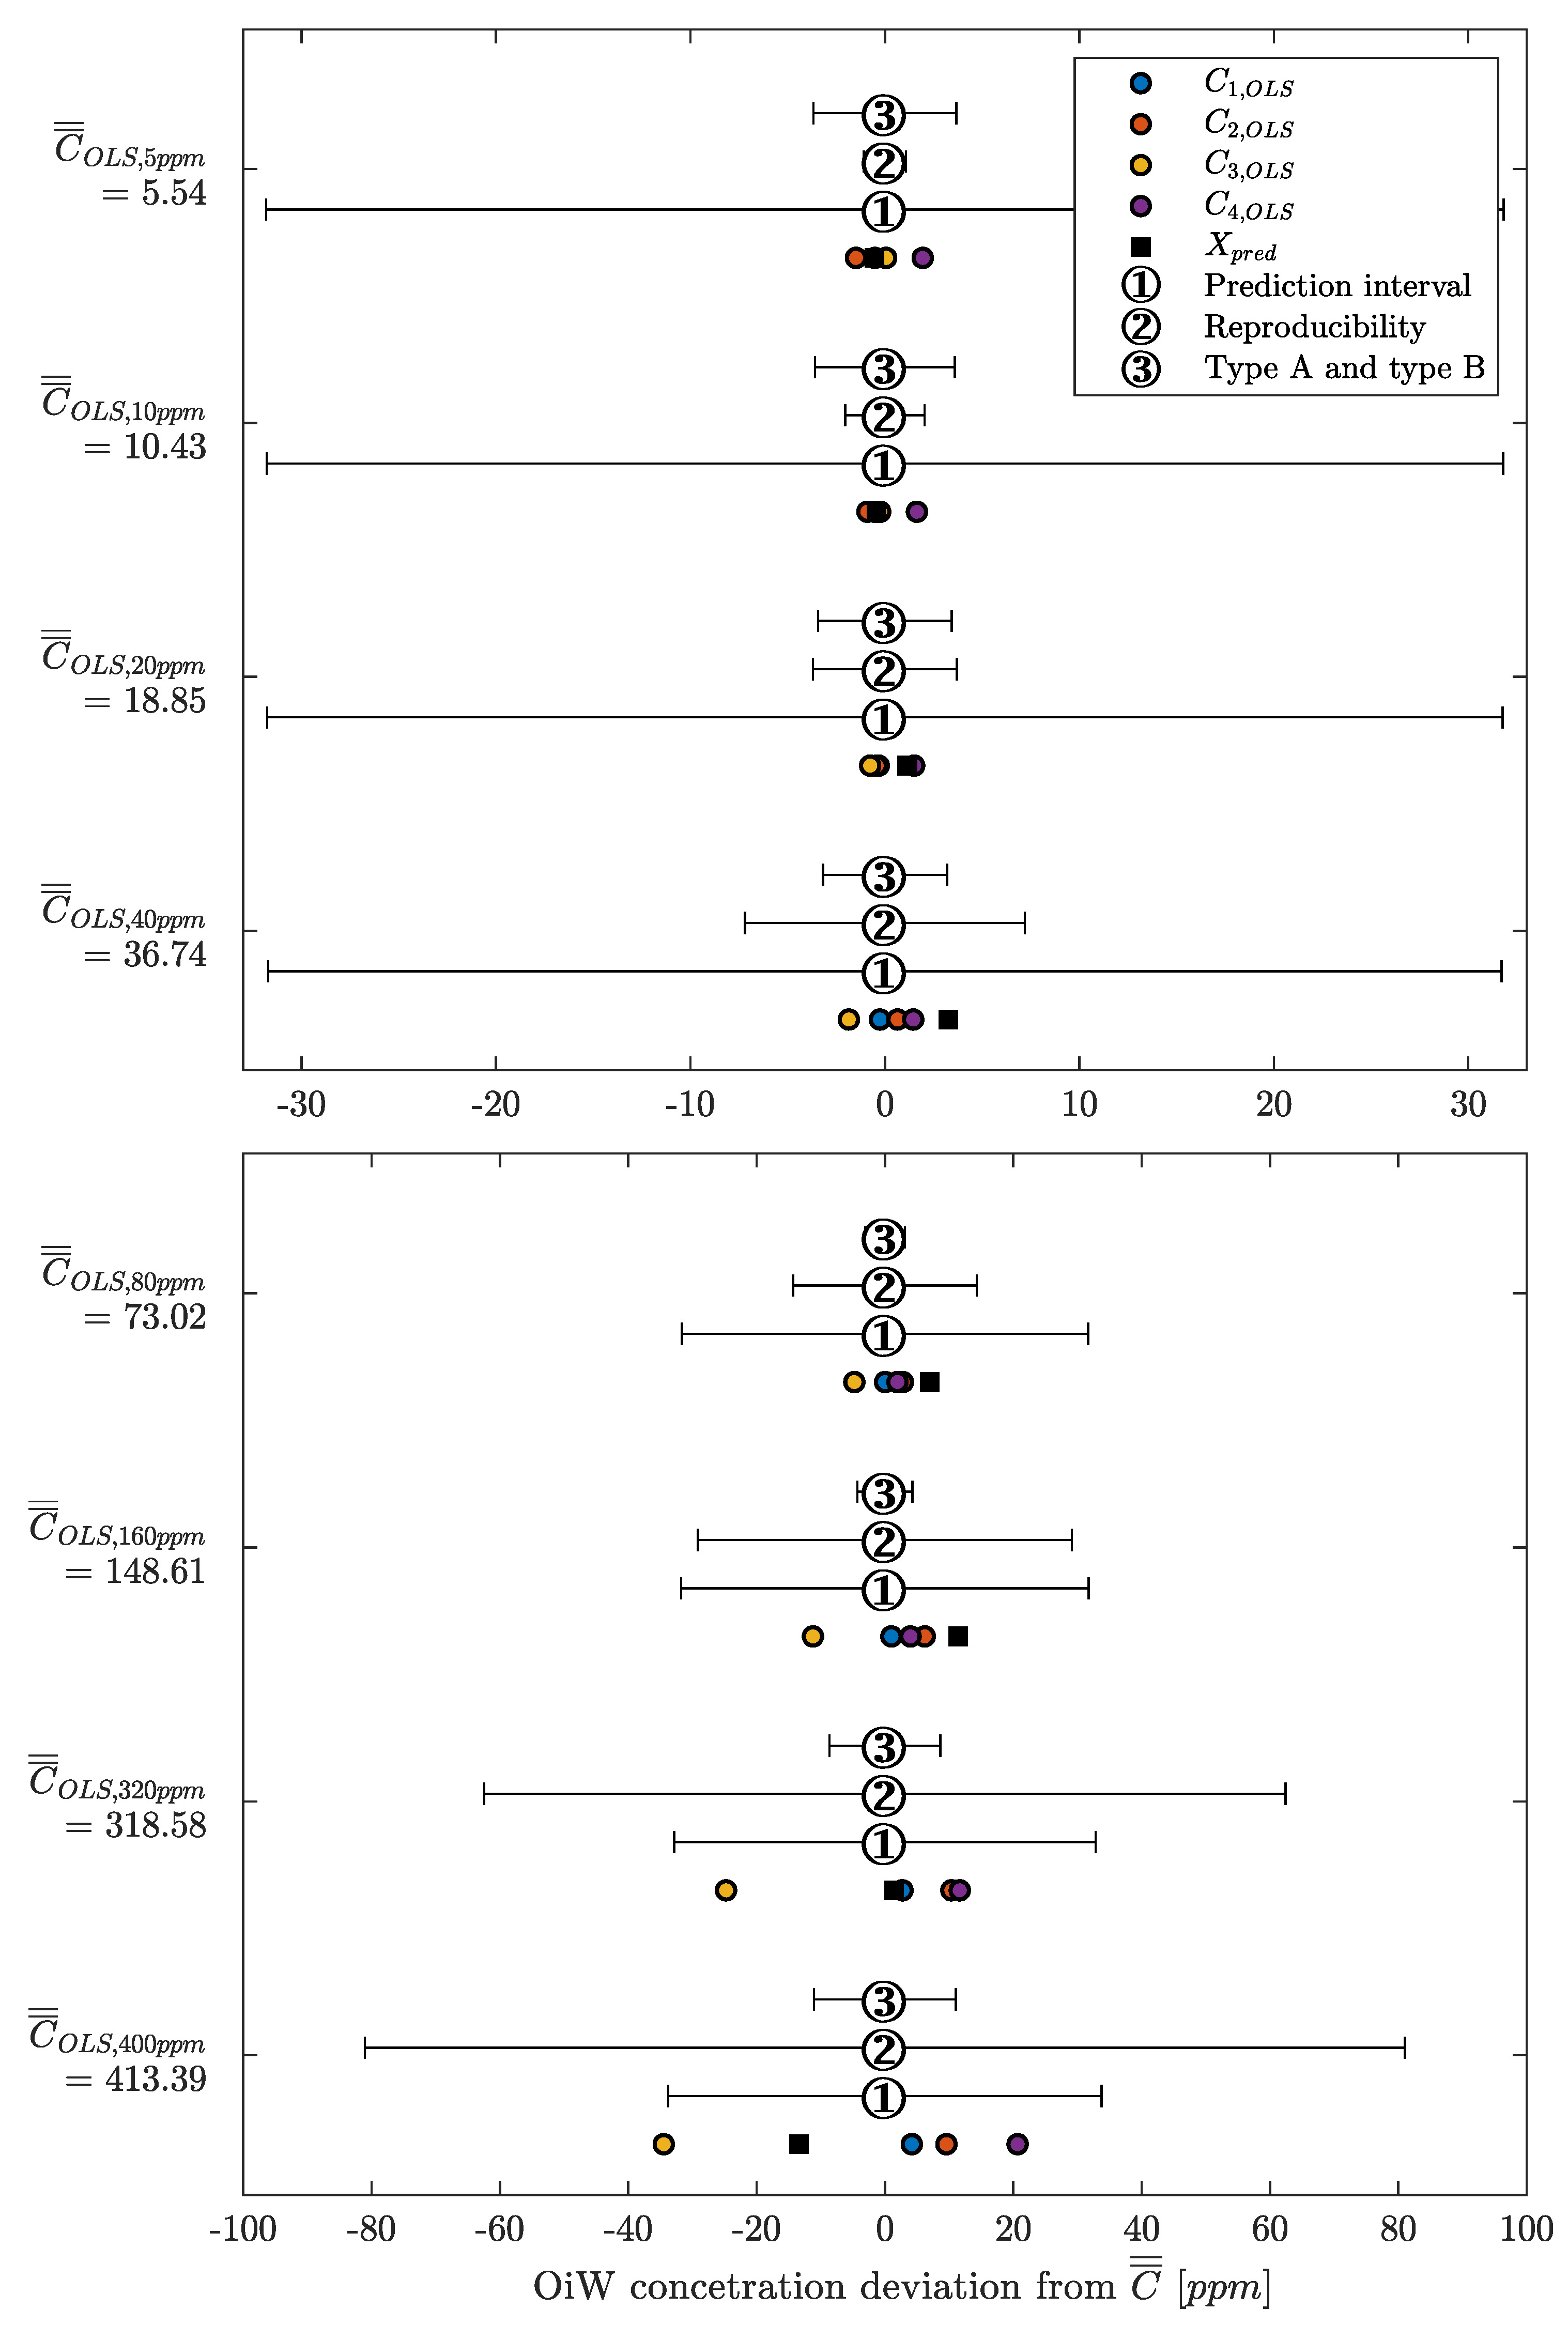
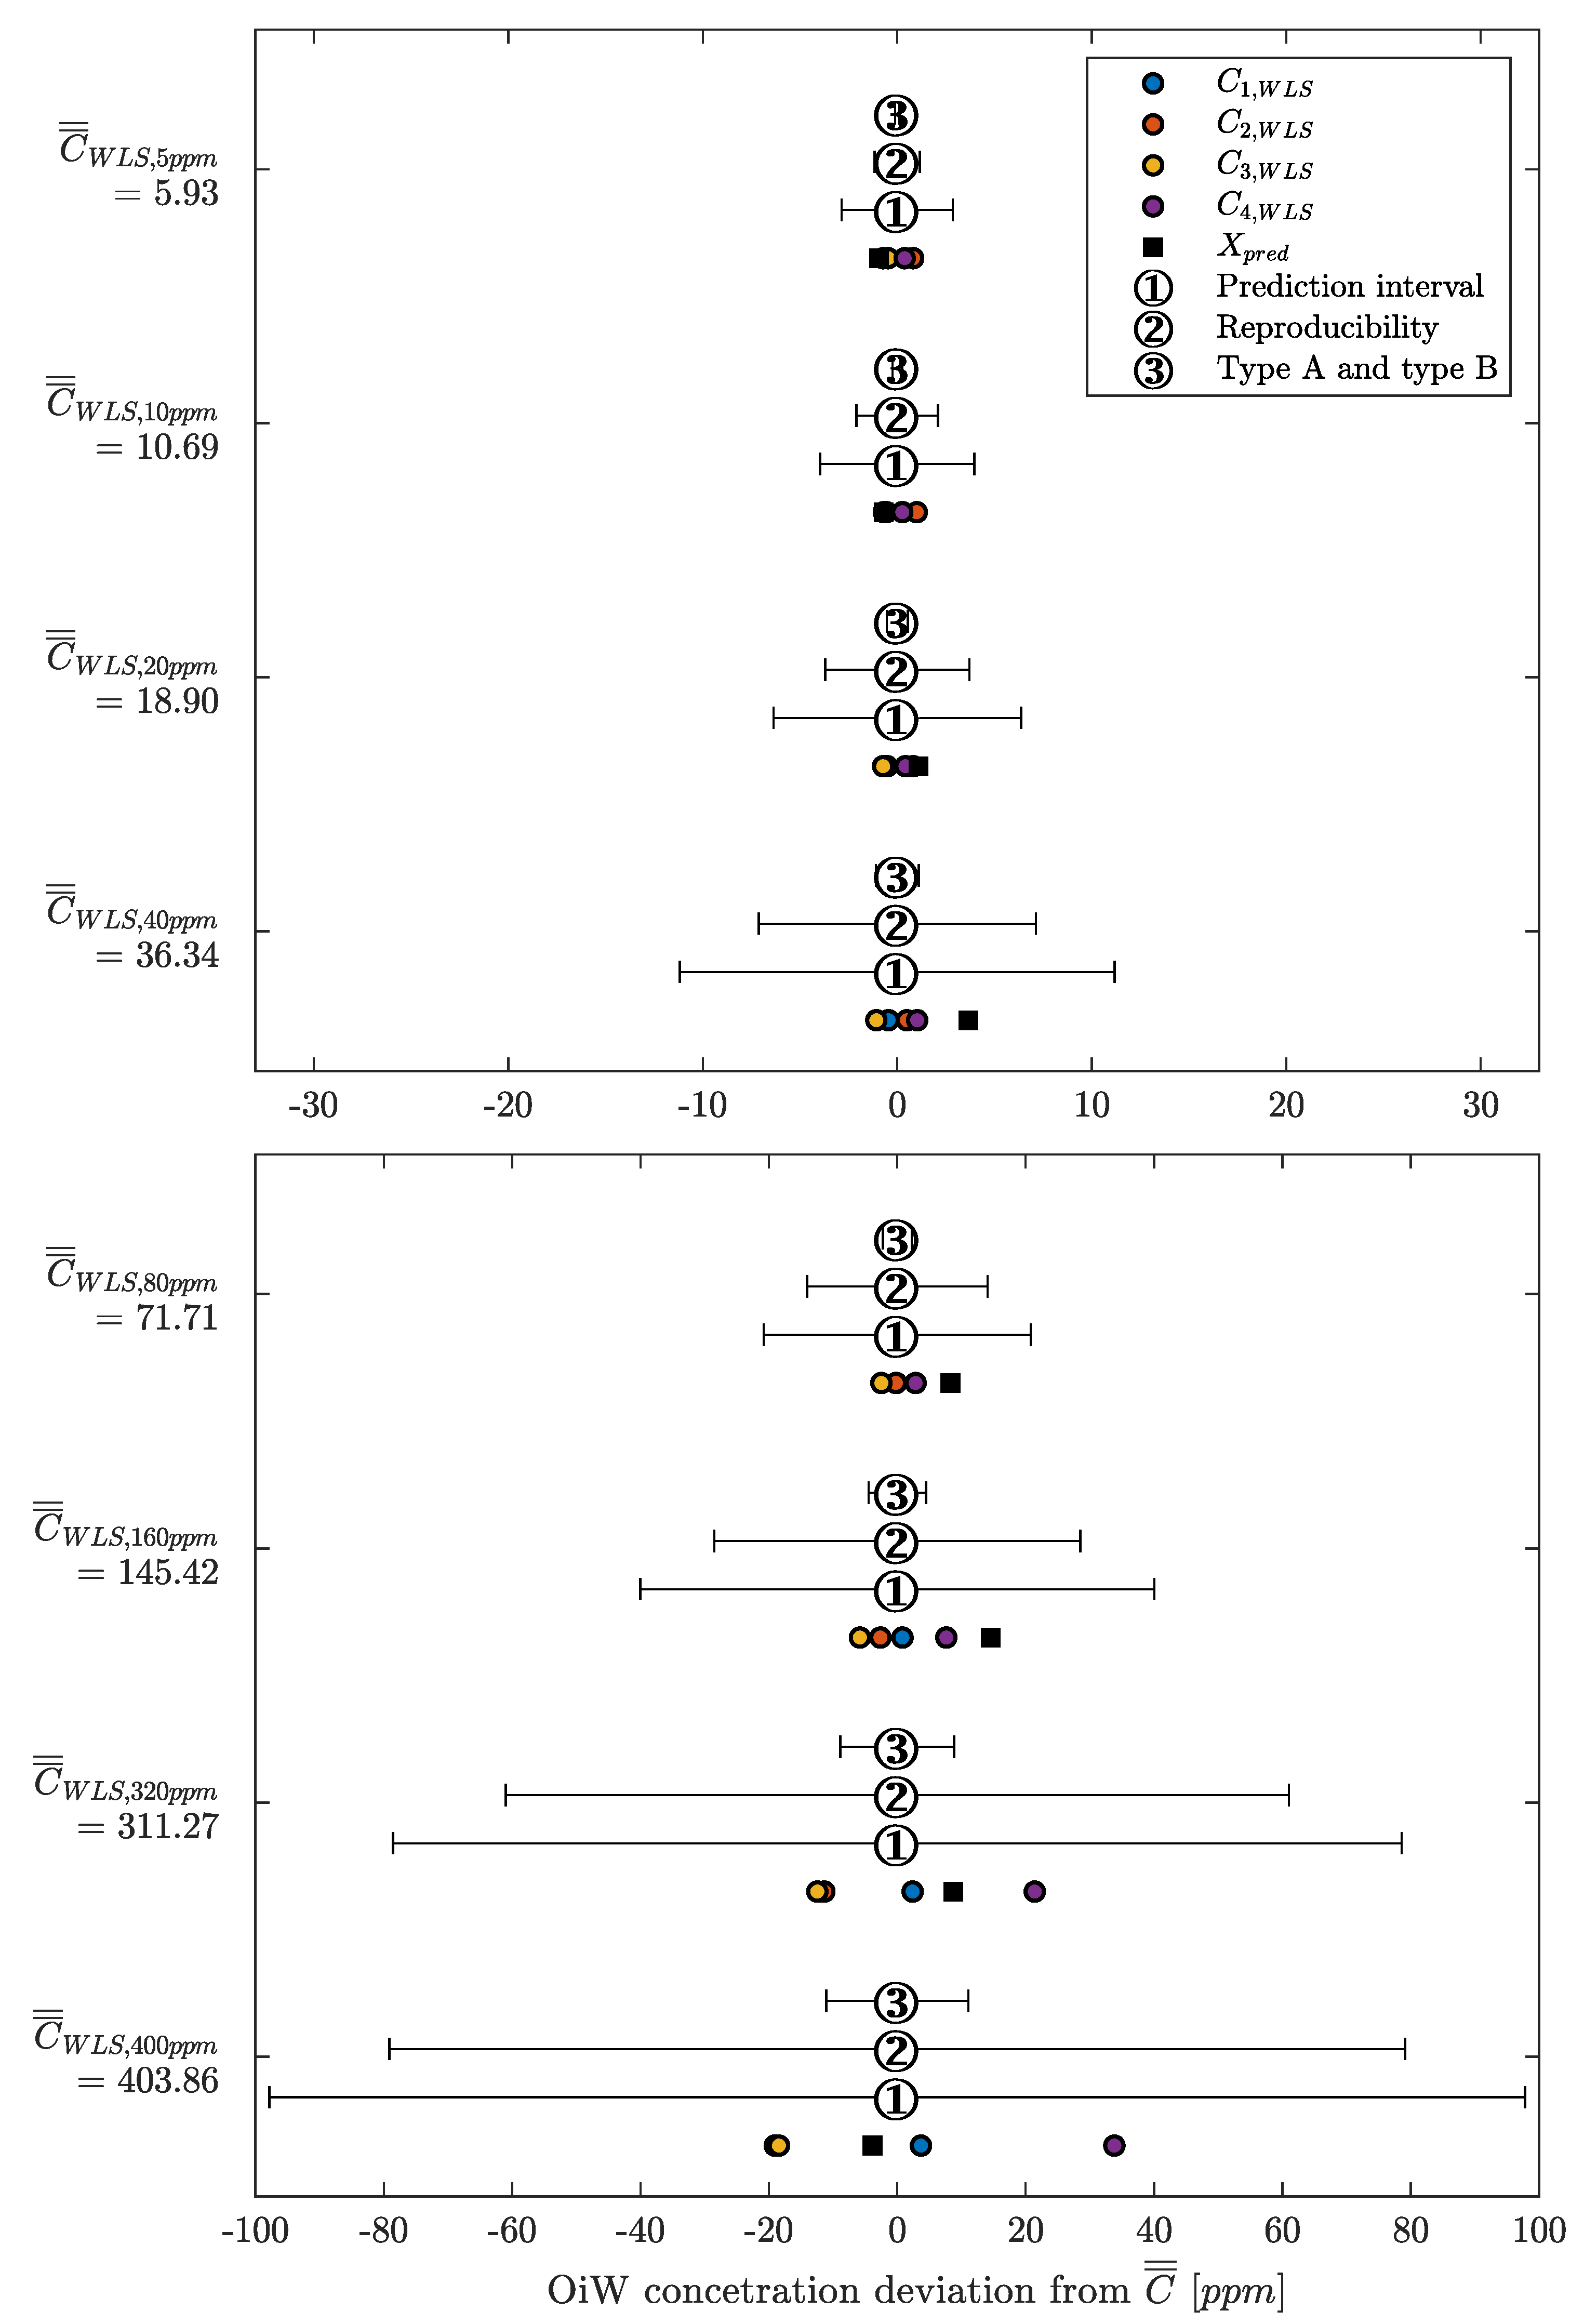
- Using the prediction interval directly from the calibration of the OiW monitors.
- Estimating the reproducibility based on the calibration data.
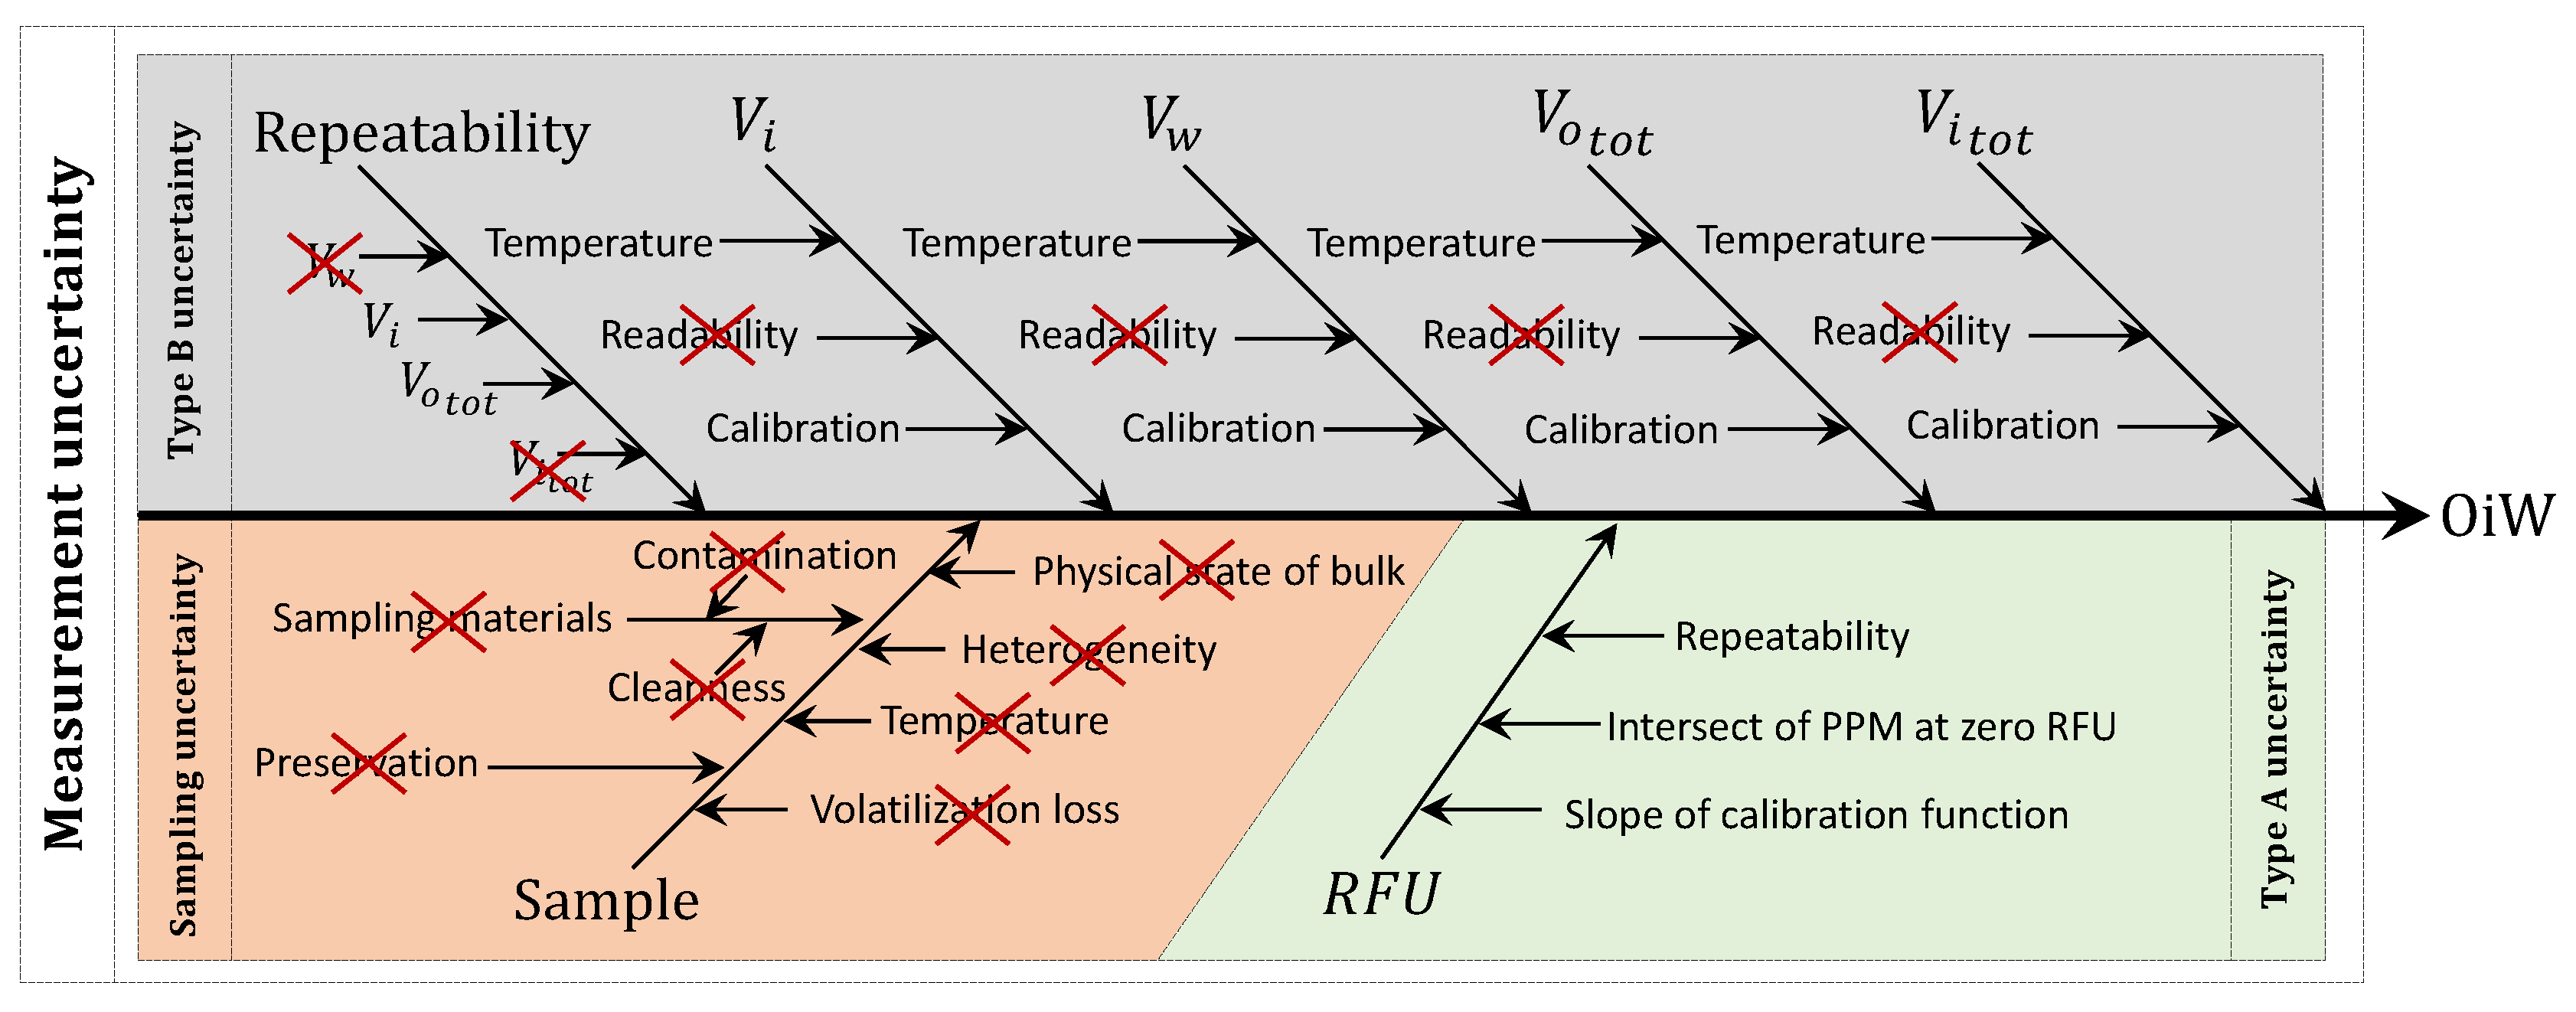
- The estimated combined uncertainty based on type A and type B uncertainties.
- ①
- As the weighting factor within PI of OLS is equal to one, the result of using PI as uncertainty boundary are equal in all OiW concentration. Resulting in overestimation of uncertainty at a lower concentration, and might end in an underestimation at high OiW concentrations.
- ②
- The 10% uncertainty estimation based on the reproducibility is applied, covering almost all OiW steady-state values the entire range except at 5 . It is clearly the best way to represent the uncertainty related to OLS measurement compared to the other two methods.
- ③
- The measurement of type B uncertainty was, as expected, difficult to include all uncertainties, resulted in an underestimation of the uncertainty above 40 . The type A uncertainty from the CI of the OLS calibration is the main reason for the joined type A and type B uncertainty measurement fits within its boundary at the lower OiW concentration.
- ①
- The weighting factor within PI of the WLS method is equal to the sample variance measured at each OiW concentration. The uncertainty estimation covers all OiW steady-state values in all ranges.
- ②
- The same as for OLS, a 10% uncertainty estimation based on the reproducibility calculation is applied. The uncertainty range is lower than the PI but still cover all OiW steady-state values in the entire range.
- ③
- As for OLS, the measurement of type B uncertainty for WLS was, as expected, also underestimated.
6. Discussion
- Change the sample point from horizontal to be vertical.
- Use a sample probe for directing the rising flow through the sidestream.
- Use isokinetic sampling.
- Minimize the transport delay between the sample point and the OiW monitor as the manufacturer recommends a " connection with a maximum flow rate of 2.0 , which relates to transitional flow () and stratification can happen in the transport pipeline.
7. Conclusions
Author Contributions
Funding
Acknowledgments
Conflicts of Interest
Abbreviations
| OiW | Oil-in-Water |
| PWRI | produced water re-injection |
| PW | produced water |
| IW | injection water |
| MIC | microbiologically influenced corrosion |
| OSPAR | Oslo and Paris convention (for the Protection of the Marine Environment of the Northeast Atlantic) |
| GC-FID | gas chromatography-flame ionization detector |
| TEX | toluene, ethylbenzene, and xylene |
| ISO | International Organization for Standardization |
| RFU | relative fluorescence units |
| ppm | parts per million |
| OLS | ordinary least square |
| BLUE | best unbiased estimator |
| WLS | weighted least square |
| CI | confidence interval |
| PI | prediction interval |
| ANOVA | analysis of variance |
| PAH | polynuclear aromatic hydrocarbon |
References
- Ahmed, U. Making the Most of Maturing Fields. Oilfield Rev. 2004, 16, 1. [Google Scholar]
- Blanchard, E. Oil in Water Monitoring is a Key to Production Separation. Offshore 2013, 73, 104–105. [Google Scholar]
- Maxwell, S. Implications of Re-Injection of Produced Water on Microbially Influenced Corrosion (MIC) in Offshore Water Injection Systems; CORROSION 2005; NACE International: Houston, TX, USA, 2005; p. 9. [Google Scholar]
- OSPAR Commission. List of Decisions, Recommendations and Other Agreements Applicable within the Framework of the OSPAR Convention—Update 2018; Technical Report; OSPAR: London, UK, 2018. [Google Scholar]
- Marle, C.M. Oil entrapment and mobilization. In Basic Concepts in Enhanced Oil Recovery Processes, 1st ed.; Bavière, M., Ed.; Critical Reports on Applied Chemistry Volume 33; Elsevier: Paris, France, 1991; Volume 33, Chapter 1; pp. 3–39. [Google Scholar]
- Hartmann, D.J.; Beaumont, E.A. Predicting Reservoir System Quality and Performance. In Handbook of Petroleum Geology: Exploring for Oil and Gas Traps, 1st ed.; Beaumont, E.A., Foster, N.H., Eds.; Handbook of Petroleum Geology; The American Association of Petroleum Geologists: Tulsa, OK, USA, 1999; Volume 3, Chapter 9; p. 154. [Google Scholar] [CrossRef]
- OSPAR Commission. Produced Water Discharges from Offshore Oil and Gas Installations 2007–2012; OSPAR: London, UK, 2014; p. 2. [Google Scholar]
- Larsen, I. Denmark’s Oil and Gas Production—And Subsoil Use 09; Technical Report; Energistyrelsen: Copenhagen, Denmark, 2010. [Google Scholar]
- Yang, M. Analysing Oil Pollution. Awe Int. 2018, 56, 31–37. [Google Scholar]
- Kokal, S.; Al-Dawood, N.; Fontanilla, J.; Al-Ghamdi, A.; Nasr-El-Din, H.; Al-Rufaie, Y. Productivity Decline in Oil Wells Related to Asphaltene Precipitation and Emulsion Blocks. SPE Prod. Facil. 2003, 18, 247–256. [Google Scholar] [CrossRef]
- Bennion, D.; Thomas, F.; Imer, D.; Ma, T.; Schulmeister, B. Water Quality Considerations Resulting in the Impaired Injectivity of Water Injection and Disposal Wells. J. Can. Pet. Technol. 2001, 40, 54–61. [Google Scholar] [CrossRef]
- Hansen, D.S.; Bram, M.V.; Yang, Z. Efficiency investigation of an offshore deoiling hydrocyclone using real-time fluorescence- and microscopy-based monitors. In Proceedings of the 2017 IEEE Conference on Control Technology and Applications (CCTA), Mauna Lani, HI, USA, 27–30 August 2017; pp. 1104–1109. [Google Scholar] [CrossRef]
- Bram, M.V.; Hansen, L.; Hansen, D.S.; Yang, Z. Grey-Box Modeling of an Offshore Deoiling Hydrocyclone System. In Proceedings of the 2017 IEEE Conference on Control Technology and Applications (CCTA), Mauna Lani, HI, USA, 27–30 August 2017; pp. 94–98. [Google Scholar] [CrossRef]
- Yang, M. Measurement of Oil in Produced Water. In Produced Water, 1st ed.; Lee, K., Neff, J., Eds.; Springer: New York, NY, USA, 2011; Chapter 2; pp. 57–88. [Google Scholar] [CrossRef]
- Department for Business Energy & Industrial Strategy. Methodology for the Sampling and Analysis of Produced Water and Other Hydrocarbon Discharges; Technical Report; United Kingdom Government Digital Service: London, UK, 2018. [Google Scholar]
- Miløstyrelsen. Generel Tilladelse for Maersk Olie og Gas A/S (Maersk Olie) til Anvendelse, Udledning og Anden Bortskaffelse af Stoffer og Materialer, Herunder Olie og Kemikalier i Produktions- og Injektionsvand fra Produktionsenhederne Halfdan, Dan, Tyra og Gorm for Per; Technical Report; Mærsk Olie og Gas A/S: Copenhagen, Denmark, 2016. [Google Scholar]
- Danish Energy Agency. Yearly Production, Injection, Flare, Fuel and Export in SI Units 1972–2019. Available online: https://ens.dk/ (accessed on 7 August 2020).
- Gao, C. Factors affecting particle retention in porous media. Emir. J. Eng. Res. 2007, 12, 7. [Google Scholar]
- Danish Energy Agency. Production; Technical Report; Danish Energy Agency: Esbjerg, Denmark, 2016. [Google Scholar]
- Durdevic, P.; Raju, C.; Bram, M.; Hansen, D.; Yang, Z. Dynamic Oil-in-Water Concentration Acquisition on a Pilot-Scaled Offshore Water-Oil Separation Facility. Sensors 2017, 17, 124. [Google Scholar] [CrossRef]
- Henriksen, A. Online Oil-in-Water Monitoring Experience. Available online: http://www.advancedsensors.co.uk/ (accessed on 7 June 2019).
- Zhang, J. RPSEA Subsea Produced Water Discharge Sensor Lab Test Results and Recommendations Final Report; Technical Report 3; Cleariew Subsea LLC: Houston, TX, USA, 2016. [Google Scholar]
- Jepsen, K.L.; Bram, M.V.; Hansen, L.; Yang, Z.; Lauridsen, S.M.Ø. Online Backwash Optimization of Membrane Filtration for Produced Water Treatment. Membranes 2019, 9, 68. [Google Scholar] [CrossRef]
- Bram, M.V.; Hansen, L.; Hansen, D.S.; Yang, Z. Extended Grey-Box Modeling of Real-Time Hydrocyclone Separation Efficiency. In Proceedings of the 2019 18th European Control Conference (ECC), Naples, Italy, 25–28 June 2019; pp. 3625–3631. [Google Scholar] [CrossRef]
- Dansk Standard. Vejledning i Brug af Estimater for Repeterbarhed, Reproducerbarhed og Korrekthed ved Estimering af Måleusikkerhed; Technical Report; DS/ISO: Copehagen, Denmark, 2017. [Google Scholar]
- Howell, M. A Closer Look at Accuracy of Measuring and Test Equipment; Currents; EASA: St. Louis, MO, USA, 2014; pp. 3–5. [Google Scholar]
- JCGM. Evaluation of Measurement Data—Guide to the Expression of Uncertainty in Measurement; Technical Report; BIPM: Saint-Cloud, France, 2008. [Google Scholar]
- Magnusson, B.; Näykki, T.; Hovind, H.; Krysell, M. Handbook for Calculation of Measurement Uncertainty in Environmental Laboratories; Technical Report; Nordtest: Espoo, Finland, 2004. [Google Scholar]
- Dansk Standard. Olieproducter. Automatisk Prøveudtagning fra Rørledninger; Technical Report; DS/ISO: Charlottenlund, Denmark, 1999. [Google Scholar]
- Dansk Standard. Water Quality—Determination of Hydrocarbon Oil Index—Part 2: Method Using Solvent Extraction and Gas Chromatography; Technical Report; DS/ISO: Copenhagen, Denmark, 2001. [Google Scholar]
- Ramsey, M.H.; Thompson, M. Uncertainty from sampling, in the context of fitness for purpose. Accredit. Qual. Assur. 2007, 12, 503–513. [Google Scholar] [CrossRef]
- Eurachem/EUROLAB/CITAC/Nordtest/AMC Guide. Measurement Uncertainty Arising from Sampling: A Guide to Methods and Approaches; Technical Report; Eurachem: Torino, Italy, 2019. [Google Scholar]
- Lava, R.; Zanon, F.; Menegus, L. Issues with Monitoring and Analysis of Hydrocarbons in Italy; NEL Produced Water Workshop; In Proceedings of the Produced Water Workshop 2017, Aberdeen, UK, 13–14 June 2017; p. 41. [Google Scholar]
- Hassan, A.A.; Bram, M.V.; Hansen, D.S. Monitoring and Control of a Deoiling Hydrocyclone Utilizing Oil-in-Water Measurement. Master’s Thesis, Aalborg University, Esbjerg, Denmark, 2016. [Google Scholar]
- Midland. Midland Non Detergent 30; Technical Report; Midland: Hunzenschwil, Switzerland, 2011. [Google Scholar]
- Durdevic, P.; Pedersen, S.; Yang, Z. Evaluation of OiW measurement technologies for deoiling hydrocyclone efficiency estimation and control. In Proceedings of the OCEANS 2016, Shanghai, China, 10–13 April 2016; pp. 1–7. [Google Scholar] [CrossRef]
- Turner Designs Hydrocarbon Instruments. E09 TD-4100XDC Oil in Water Monitor User Manual; Technical Report; Turner Designs: Fresno, CA, USA, 2014. [Google Scholar]
- Coca-Prados, J.; Gutiérrez-Cervelló, G.; Benito, J.M. Treatment of Oily Wastewater. In Water Purification and Management, 1st ed.; Coca-Prados, J., Gutiérrez-Cervelló, G., Eds.; NATO Science for Peace and Security Series C: Environmental Security; Springer: Dordrecht, The Netherlands, 2011; Chapter 1; pp. 1–5. [Google Scholar] [CrossRef]
- Schubert, M.F.; Skilbeck, F.; Walker, H.J. Liquid Hydrocyclone Separation Systems. In Hydrocyclones, 1st ed.; Svarovsky, L., Thew, M.T., Eds.; Fluid Mechanics and its Applications; Springer: Dordrecht, The Netherlands, 1992; Volume 12, pp. 275–293. [Google Scholar] [CrossRef]
- Gonick, L.; Smith, W. The Cartoon Guide to Statistics, 4th ed.; HarperCollins Publishers Inc.: New York, NY, USA, 2005; p. 230. [Google Scholar]
- Noblitt, S.D.; Berg, K.E.; Cate, D.M.; Henry, C.S. Characterizing nonconstant instrumental variance in emerging miniaturized analytical techniques. Anal. Chim. Acta 2016, 915, 64–73. [Google Scholar] [CrossRef]
- Martin, J.; de Adana, D.D.R.; Asuero, A.G. Fitting Models to Data: Residual Analysis, a Primer. In Uncertainty Quantification and Model Calibration; Hessling, J.P., Ed.; InTech: London, UK, 2017; Chapter 7; pp. 133–173. [Google Scholar] [CrossRef]
- Hansen, L.; Durdevic, P.; Jepsen, K.L.; Yang, Z. Plant-wide Optimal Control of an Offshore De-oiling Process Using MPC Technique. IFAC-PapersOnLine 2018, 51, 144–150. [Google Scholar] [CrossRef]
- Jepsen, K.L.; Pedersen, S.; Yang, Z. Control pairings of a deoiling membrane crossflow filtration process based on theoretical and experimental results. J. Process Control 2019, 81, 98–111. [Google Scholar] [CrossRef]
- Pedersen, S.; Durdevic Løhndorf, P.; Yang, Z. Influence of riser-induced slugs on the downstream separation processes. J. Pet. Sci. Eng. 2017, 154, 337–343. [Google Scholar] [CrossRef]
- Durdevic, P.; Yang, Z. Application of H∞ Robust Control on a Scaled Offshore Oil and Gas De-Oiling Facility. Energies 2018, 11, 287. [Google Scholar] [CrossRef]
- Nielsen, E.K.; Bram, M.V.; Frutiger, J.; Sin, G.; Lind, M. A water treatment case study for quantifying model performance with multilevel flow modeling. Nucl. Eng. Technol. 2018, 50, 532–541. [Google Scholar] [CrossRef]
- Scardina, P.; Letterman, R.D.; Edwards, M. Particle count and on-line turbidity interference from bubble formation. J. Am. Water Work. Assoc. 2006, 98, 97–109. [Google Scholar] [CrossRef]
- Edinburgh Instruments. Scattering. Available online: https://www.edinst.com/blog/raman-scattering-blog/ (accessed on 27 July 2020).
- Fridman, A.E. Assurance of Measurement Accuracy in Compliance with ISO 5725 Standards. In The Quality of Measurements: A Metrological Reference, 1st ed.; Springer: New York, NY, USA, 2012; Chapter 8; pp. 179–195. [Google Scholar] [CrossRef]
- EURACHEM/CITAC. Quantifying Uncertainty in Analytical Measurement; Technical Report; EURACHEM: Torino, Italy, 2012. [Google Scholar]
- Wang, L.Y.; Wu, Y.X.; Zheng, Z.C.; Guo, J.; Zhang, J.; Tang, C. Oil-Water two-Phase Flow Inside T-Junction. J. Hydrodyn. 2008, 20, 147–153. [Google Scholar] [CrossRef][Green Version]
- Sam, B.; Pao, W.; Nasif, M.S.; Norpiah, R.B. Simulation of two phase oil-gas flow in T-junction. ARPN J. Eng. Appl. Sci. 2016, 11, 12011–12016. [Google Scholar]
- Young, G.; Wakley, W.; Taggart, D.; Andrews, S.; Worrell, J. Oil-water separation using hydrocyclones: An experimental search for optimum dimensions. J. Pet. Sci. Eng. 1994, 11, 37–50. [Google Scholar] [CrossRef]
- Wang, T.; Zeng, L.H.; Li, D.L. A review on the methods for correcting the fluorescence inner-filter effect of fluorescence spectrum. Appl. Spectrosc. Rev. 2017, 52, 883–908. [Google Scholar] [CrossRef]
- Edinburgh Instruments. What Is the Inner Filter Effect? Available online: https://www.edinst.com/blog/inner-filter-effect/ (accessed on 26 August 2019).
- Ware, W.R. Oxygen Quenching of Fluorescence in Solution: An Experimental Study of the Diffusion Process. J. Phys. Chem. 1962, 66, 455–458. [Google Scholar] [CrossRef]
- Momin, S.A.; Narayanaswamy, R. Quenching of fluorescence of polynuclear aromatic hydrocarbons by chlorine. Analyst 1992, 117, 83. [Google Scholar] [CrossRef]
- Lakowicz, J.R. (Ed.) Quenching of Fluorescence. In Principles of Fluorescence Spectroscopy, 3rd ed.; Springer: Boston, MA, USA, 2006. [Google Scholar] [CrossRef]
- Wilson, D.F. Oxygen Dependent Quenching of Phosphorescence: A Perspective. In Oxygen Transport to Tissue XIV, 1st ed.; Erdmann, W., Bruley, D.E., Eds.; Advances in Experimental Medicine and Biology; Springer: New York, NY, USA, 1992; Volume 317, pp. 195–201. [Google Scholar] [CrossRef]
- Elmenreich, W. An introduction to sensor fusion. Vienna Univ. Technol. Austria 2002, 502, 28. [Google Scholar]
- Shi, L.; Johansson, K.H.; Murray, R.M. Kalman Filtering with Uncertain Process and Measurement Noise Covariances with Application to State Estimation in Sensor Networks. In Proceedings of the 2007 IEEE International Conference on Control Applications, Singapore, 1–3 October 2007; pp. 1031–1036. [Google Scholar] [CrossRef]
- Ma, H.; Yan, L.; Xia, Y.; Fu, M. Kalman Filtering and Information Fusion, 1st ed.; Springer: Singapore, 2020; p. 291. [Google Scholar] [CrossRef]




| Sample No. | L [−] | n [−] | [] | [] | [] | [%] | [] | [%] |
|---|---|---|---|---|---|---|---|---|
| 1 | 35 | 127 | 3.04 | 2.99 | 0.291 | 9.6 | 0.092 | 3.0 |
| 2 | 34 | 134 | 0.57 | 0.70 | 0.192 | 33.5 | 0.037 | 6.5 |
| 3 | 38 | 142 | 3.61 | 4.00 | 0.763 | 21.1 | 0.210 | 5.8 |
| 4 | 41 | 156 | 0.74 | 1.04 | 0.300 | 40.5 | 0.105 | 14.1 |
| Component | Type | Description | Specifications |
|---|---|---|---|
| Water/oil tank | Custom made | Supply and waste tank for the oil and water mixture | 2.48 |
| Mixer | 2 × Milton Roy Mixing VRP3051S90 | Two mixers for mixing the immersible oil in water | = 137 , 3 × 550 blades |
| CP | Grundfos CRNE5-9 A-P-G-V-HQQV | Centrifugal pump feeding the OiW separation system | 6.9 at h = 68 , = 93.3 |
| Air source | - | Addition of air into the system if necessary | (1–7) |
| Hydrocyclone | Vortoil 35 liner | Single industrial cased hydrocyclone liner | - |
| and | Bailey-Fischer-Porter 10DX4311C | Magnetic flowmeters measuring the inlet and underflow outlet of the hydrocyclone, respectively | 0–1.64034 (0–1) |
| Emerson Micro Motion ELITE CMFS010M300N0ANACZZ | Coriolis flowmeter measuring the overflow outlet flowrate from the hydrocyclone | @0.002-97.0 kg/h | |
| , , and | Siemens Sitrans P200 | Pressure transmitters measuring the pressure at their respective locations | (0–16) |
| and | Turner-Design TD-4100XDC | Fluorescence-based OiW monitors measuring the OiW concentration before and after the hydrocyclone | (0–5000) |
| , , and | Bürkert type 8802 | Pneumatic continuous control valves controlling the flow in the system | 1 , Hysteresis 1%, = 16 bar |
| Component | Type | Description | Specifications |
|---|---|---|---|
| Buffer tank | VWR 213-1128 | Supply and waste beaker with/without a magnetic stirrer for mixing the solution | 1000 |
| Supply tank | 3H1/Y1.8/200 | Supply plastic jerrycan gravity-feeding the OiW monitor | 20 |
| Waste tank | 3H1/Y1.8/200 | Plastic jerrycan for capturing the waste of the gravity-feeding system | 20 |
| GP | Greylor PQ-12 | Gear pump supplied by a 0–24 AC/DC power supply, feeding the standalone systems; Figure 5b | 0.132 , 2.4 |
| CP | Grundfos CRNE5-2 A-P-G-V-HQQV | Centrifugal pump feeding the standalone system; Figure 5c | 6.9 at h = 12.9 , 20.6 |
| Air source | - | Addition of air into the system | (1–7) |
| V | Swagelok | Ball valve manipulating the flow in the standalone systems | - |
| , , , and | Turner-Design TD-4100XDC | Fluorescence-based OiW monitor measuring the OiW concentration | (0–5000) |
| Sample No. | n [−] | [] | [] | [] | [%] | [] | [%] |
|---|---|---|---|---|---|---|---|
| 1 | 39 | −0.54 | 0 | 2.11 | − | 0.25 | − |
| 2 | 39 | 10.13 | 10 | 1.68 | 16.58 | 0.94 | 9.27 |
| 3 | 37 | 20.58 | 20 | 1.42 | 6.93 | 1.26 | 6.16 |
| 4 | 38 | 47.27 | 50 | 5.99 | 12.78 | 5.92 | 12.60 |
| 5 | 40 | 103.76 | 100 | 8.97 | 8.64 | 8.89 | 8.57 |
| 6 | 38 | 154.53 | 150 | 9.80 | 6.34 | 9.48 | 6.13 |
| 7 | 40 | 294.26 | 300 | 24.50 | 8.33 | 23.39 | 7.95 |
| Sample No. | n [−] | [] | [] | [] | [%] | [] | [%] |
|---|---|---|---|---|---|---|---|
| 1 | 39 | 0.04 | 0 | 0.26 | − | 0.24 | − |
| 2 | 39 | 10.42 | 10 | 0.96 | 9.23 | 0.91 | 8.77 |
| 3 | 37 | 20.52 | 20 | 1.91 | 9.31 | 1.19 | 5.80 |
| 4 | 38 | 46.20 | 50 | 5.71 | 12.37 | 5.54 | 11.98 |
| 5 | 40 | 101.73 | 100 | 8.66 | 8.51 | 8.62 | 8.47 |
| 6 | 38 | 151.57 | 150 | 10.28 | 6.78 | 9.32 | 6.15 |
| 7 | 40 | 287.92 | 300 | 26.42 | 9.18 | 23.01 | 7.99 |
| Abbreviation | Volumetric Equipment | Volume | Systematic Error | Random Error |
|---|---|---|---|---|
| Graduated cylinder, tall form, BLAUBRAND®, class A, 1000 | 1000 | ±5.00 | − | |
| VWR® Volumetric Flask, Class A, 500 | 500 | ±0.25 | − | |
| Graduated cylinder, tall form, BLAUBRAND®, class A, 250 | 250 | ±1.00 | − | |
| Graduated cylinder, tall form, BLAUBRAND®, class A, 100 | 100 | ±0.50 | − | |
| Finnpipette® F2: (0.5–5) | (0.5–5) | µ | 15.0 µ | |
| Gilson™ F148504: (10–100) µ | (10–100) µ | ±1.5 µ | 0.6 µ |
| [] | Used Equipment | ||
|---|---|---|---|
| 10,000 | 10 × | ||
| Wanted [] | [] | [] | Used Equipment |
| 10,000 * | 500 | − | 1 × , 1 × |
| 0 | 0 | 0 | − |
| 5 | 5.00 | 5.00 | 1 × |
| 10 | 10.01 | 5.01 | 1 × , 1 × |
| 20 | 20.04 | 10.03 | 2 × , 1 × |
| 40 | 40.16 | 20.12 | 4 × , 2 × |
| 80 | 80.65 | 40.48 | 8 × , 5 × |
| 160 | 162.60 | 81.96 | 1 × |
| 320 | 330.58 | 167.96 | 1 × |
| 400 | 416.67 | 86.09 | 1 × |
| Volume Unit | Equipment | No. of Times | Volume [] | [] | [] | [ |
|---|---|---|---|---|---|---|
| 1 | 5.00 | 59.38 | − | − | ||
| 1 | 500 | |||||
| 10 | 10,000 | - | 1.92 | 0.03 | ||
| 1 | 5.00 | 0.04 | 1.87 | 0.04 | ||
| 1 | 5.00 | 0.09 | 1.83 | 0.09 | ||
| 1 | 0.01 | |||||
| 2 | 10.00 | 0.18 | 1.74 | 0.21 | ||
| 1 | 0.03 | |||||
| 4 | 20.00 | 0.35 | 1.59 | 0.44 | ||
| 2 | 0.12 | |||||
| 8 | 40.00 | 0.70 | 1.42 | 0.91 | ||
| 5 | 0.48 | |||||
| 1 | 81.96 | 1.31 | 1.74 | 1.86 | ||
| 1 | 167.98 | 2.54 | 3.60 | 3.74 | ||
| 1 | 86.09 | 3.15 | 4.68 | 4.68 |
| Volume Unit | [] | [] | [] | [] |
|---|---|---|---|---|
| 1.92 | 0.03 | 3.76 | 0.06 | |
| 1.87 | 0.06 | 3.67 | 0.11 | |
| 1.83 | 0.13 | 3.59 | 0.25 | |
| 1.75 | 0.28 | 3.43 | 0.54 | |
| 1.63 | 0.56 | 3.19 | 1.10 | |
| 1.58 | 1.15 | 3.10 | 2.25 | |
| 2.18 | 2.28 | 4.28 | 4.47 | |
| 4.41 | 4.52 | 8.64 | 8.86 | |
| 5.65 | 5.65 | 11.07 | 11.07 |
| [] | [] | [] | [] | [] | [] |
|---|---|---|---|---|---|
| 0 | −0.45 | −1.83 | 0.57 | 2.49 | 0.19 |
| 5 | 5.02 | 4.05 | 5.60 | 7.48 | 5.54 |
| 10 | 9.93 | 9.53 | 10.19 | 12.08 | 10.43 |
| 20 | 18.54 | 18.43 | 18.10 | 20.36 | 18.85 |
| 40 | 36.48 | 37.39 | 34.88 | 38.19 | 36.74 |
| 80 | 73.04 | 75.81 | 68.26 | 74.98 | 73.02 |
| 160 | 149.62 | 154.81 | 137.39 | 152.60 | 148.61 |
| 320 | 321.31 | 328.94 | 293.83 | 330.24 | 318.58 |
| 400 | 417.58 | 422.98 | 378.92 | 434.06 | 413.39 |
| [] | [] | [] | [] | [] | [] |
|---|---|---|---|---|---|
| 0 | −0.13 | 1.43 | 0.34 | 1.26 | 0.72 |
| 5 | 5.21 | 6.75 | 5.46 | 6.31 | 5.93 |
| 10 | 10.00 | 11.69 | 10.13 | 10.95 | 10.69 |
| 20 | 18.39 | 19.72 | 18.18 | 19.33 | 18.90 |
| 40 | 35.89 | 36.83 | 35.26 | 37.36 | 36.34 |
| 80 | 71.55 | 71.50 | 69.24 | 74.56 | 71.71 |
| 160 | 146.23 | 142.79 | 139.60 | 153.06 | 145.42 |
| 320 | 313.67 | 299.91 | 298.81 | 332.69 | 311.27 |
| 400 | 407.55 | 384.78 | 385.42 | 437.68 | 403.86 |
| [] | Biggest div. between , , , with OLS [] | Biggest div. between , , , with WLS [] | Biggest div. from [] | Biggest div. from [%] | Biggest div. from [] | Biggest div. from [%] |
|---|---|---|---|---|---|---|
| 0 | 4.34 | 1.56 | 2.30 | − | 0.86 | − |
| 5 | 3.43 | 1.54 | 1.95 | 35.1 | 0.82 | 13.8 |
| 10 | 2.55 | 1.70 | 1.64 | 15.8 | 1.00 | 9.4 |
| 20 | 2.26 | 1.54 | 1.50 | 8.0 | 0.82 | 4.4 |
| 40 | 3.31 | 2.10 | 1.86 | 5.0 | 1.08 | 3.0 |
| 80 | 7.55 | 5.33 | 4.76 | 6.5 | 2.85 | 4.0 |
| 160 | 17.42 | 13.46 | 11.21 | 7.5 | 7.64 | 5.3 |
| 320 | 36.41 | 33.88 | 24.75 | 7.8 | 21.42 | 6.9 |
| 400 | 55.14 | 52.91 | 34.46 | 8.3 | 33.83 | 8.4 |
© 2020 by the authors. Licensee MDPI, Basel, Switzerland. This article is an open access article distributed under the terms and conditions of the Creative Commons Attribution (CC BY) license (http://creativecommons.org/licenses/by/4.0/).
Share and Cite
Severin Hansen, D.; Jespersen, S.; Bram, M.V.; Yang, Z. Uncertainty Analysis of Fluorescence-Based Oil-In-Water Monitors for Oil and Gas Produced Water. Sensors 2020, 20, 4435. https://doi.org/10.3390/s20164435
Severin Hansen D, Jespersen S, Bram MV, Yang Z. Uncertainty Analysis of Fluorescence-Based Oil-In-Water Monitors for Oil and Gas Produced Water. Sensors. 2020; 20(16):4435. https://doi.org/10.3390/s20164435
Chicago/Turabian StyleSeverin Hansen, Dennis, Stefan Jespersen, Mads Valentin Bram, and Zhenyu Yang. 2020. "Uncertainty Analysis of Fluorescence-Based Oil-In-Water Monitors for Oil and Gas Produced Water" Sensors 20, no. 16: 4435. https://doi.org/10.3390/s20164435
APA StyleSeverin Hansen, D., Jespersen, S., Bram, M. V., & Yang, Z. (2020). Uncertainty Analysis of Fluorescence-Based Oil-In-Water Monitors for Oil and Gas Produced Water. Sensors, 20(16), 4435. https://doi.org/10.3390/s20164435


