An Ultra-Sensitive Modular Hybrid EMG–FMG Sensor with Floating Electrodes


Abstract
:1. Introduction
2. Materials and Methods
2.1. The Hybrid Sensor Design
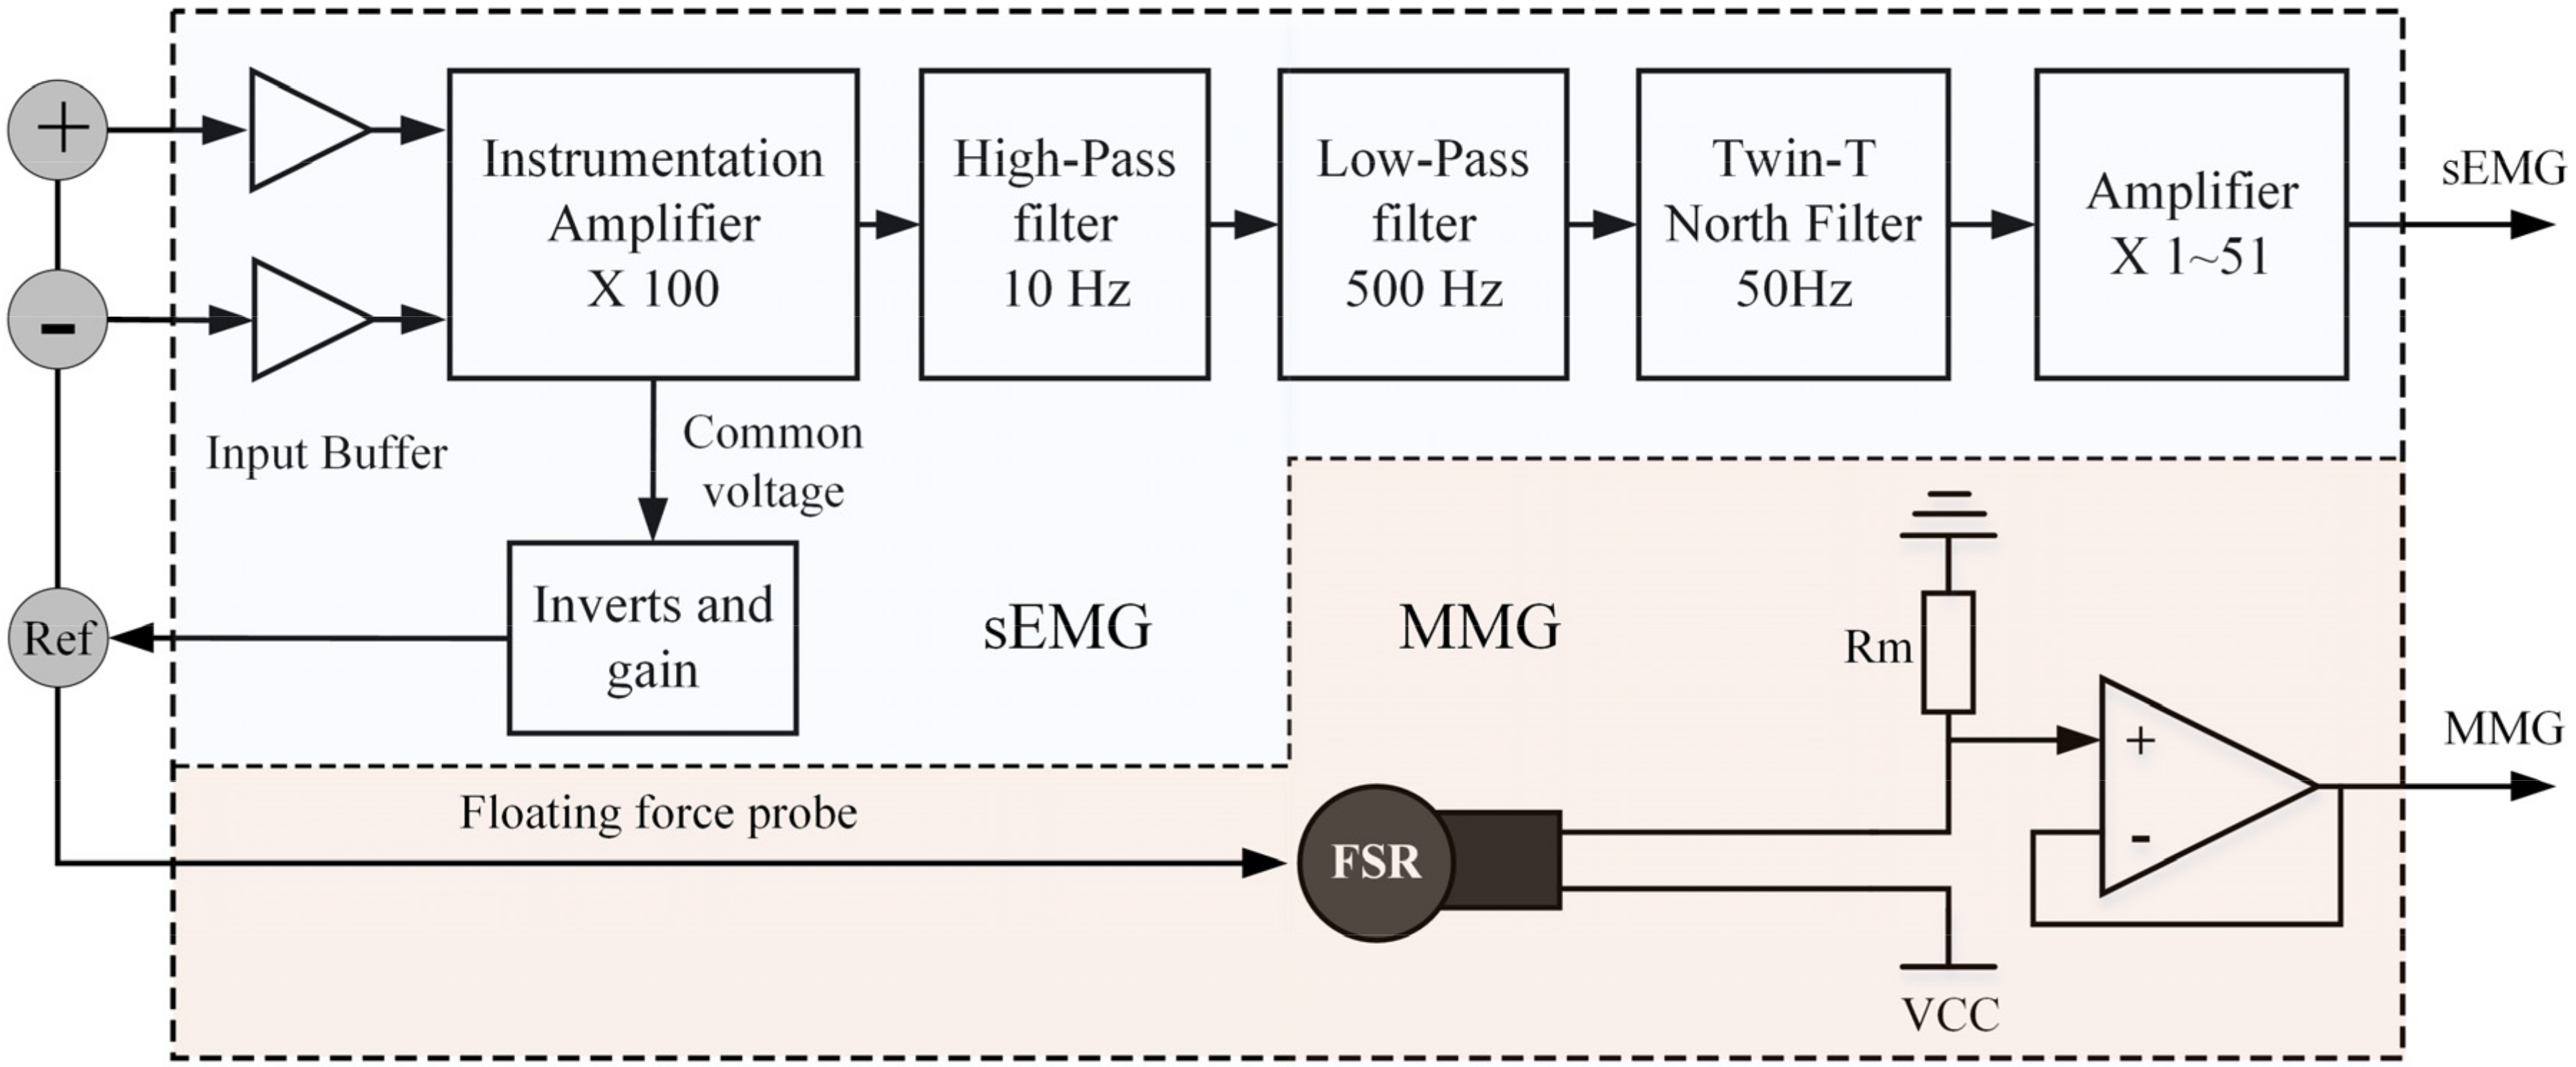
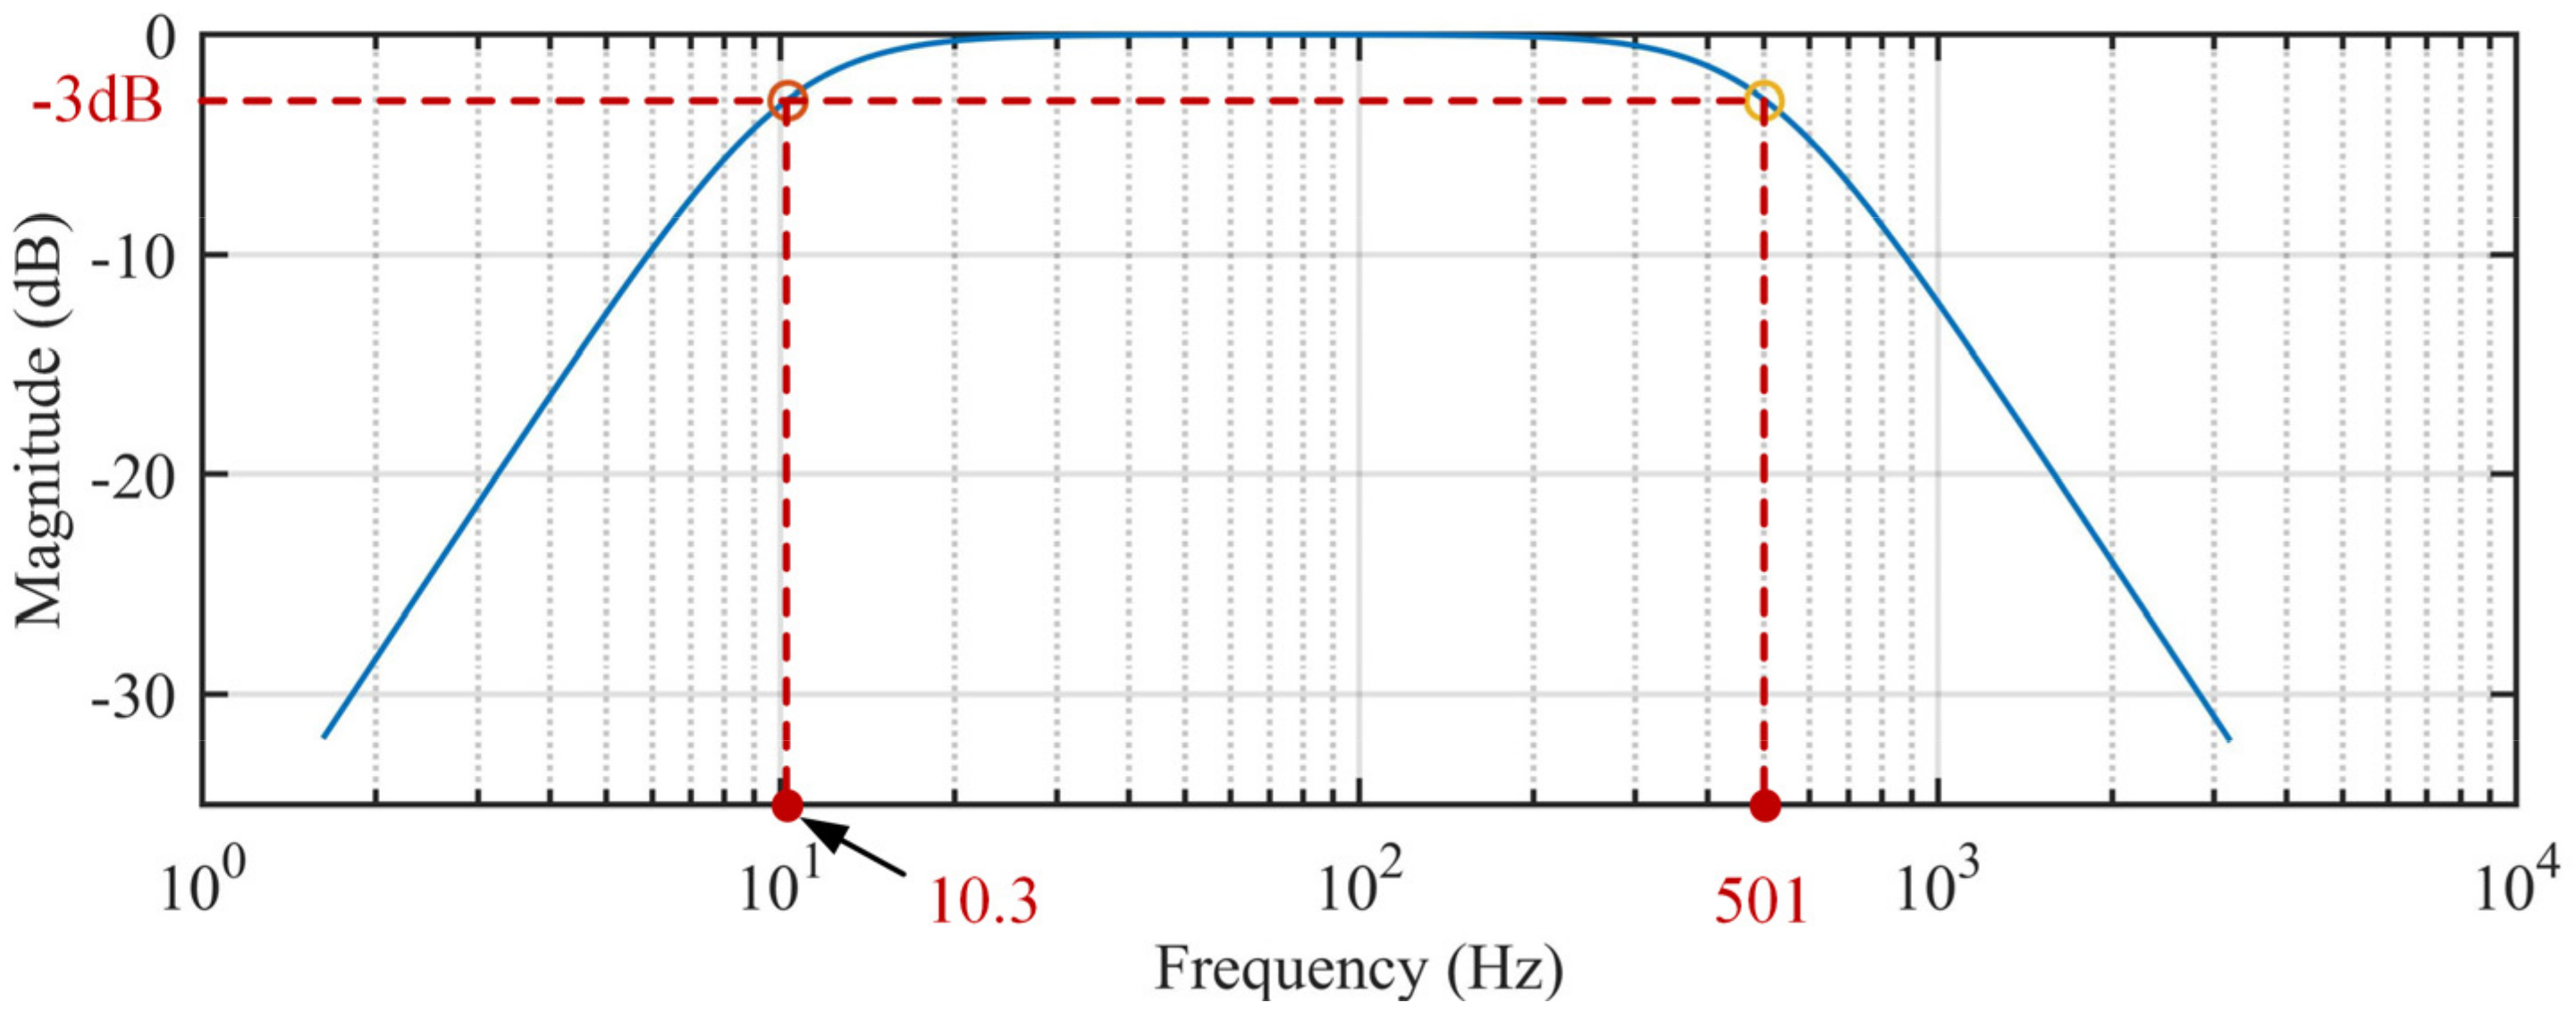
2.1.1. Circuit Design
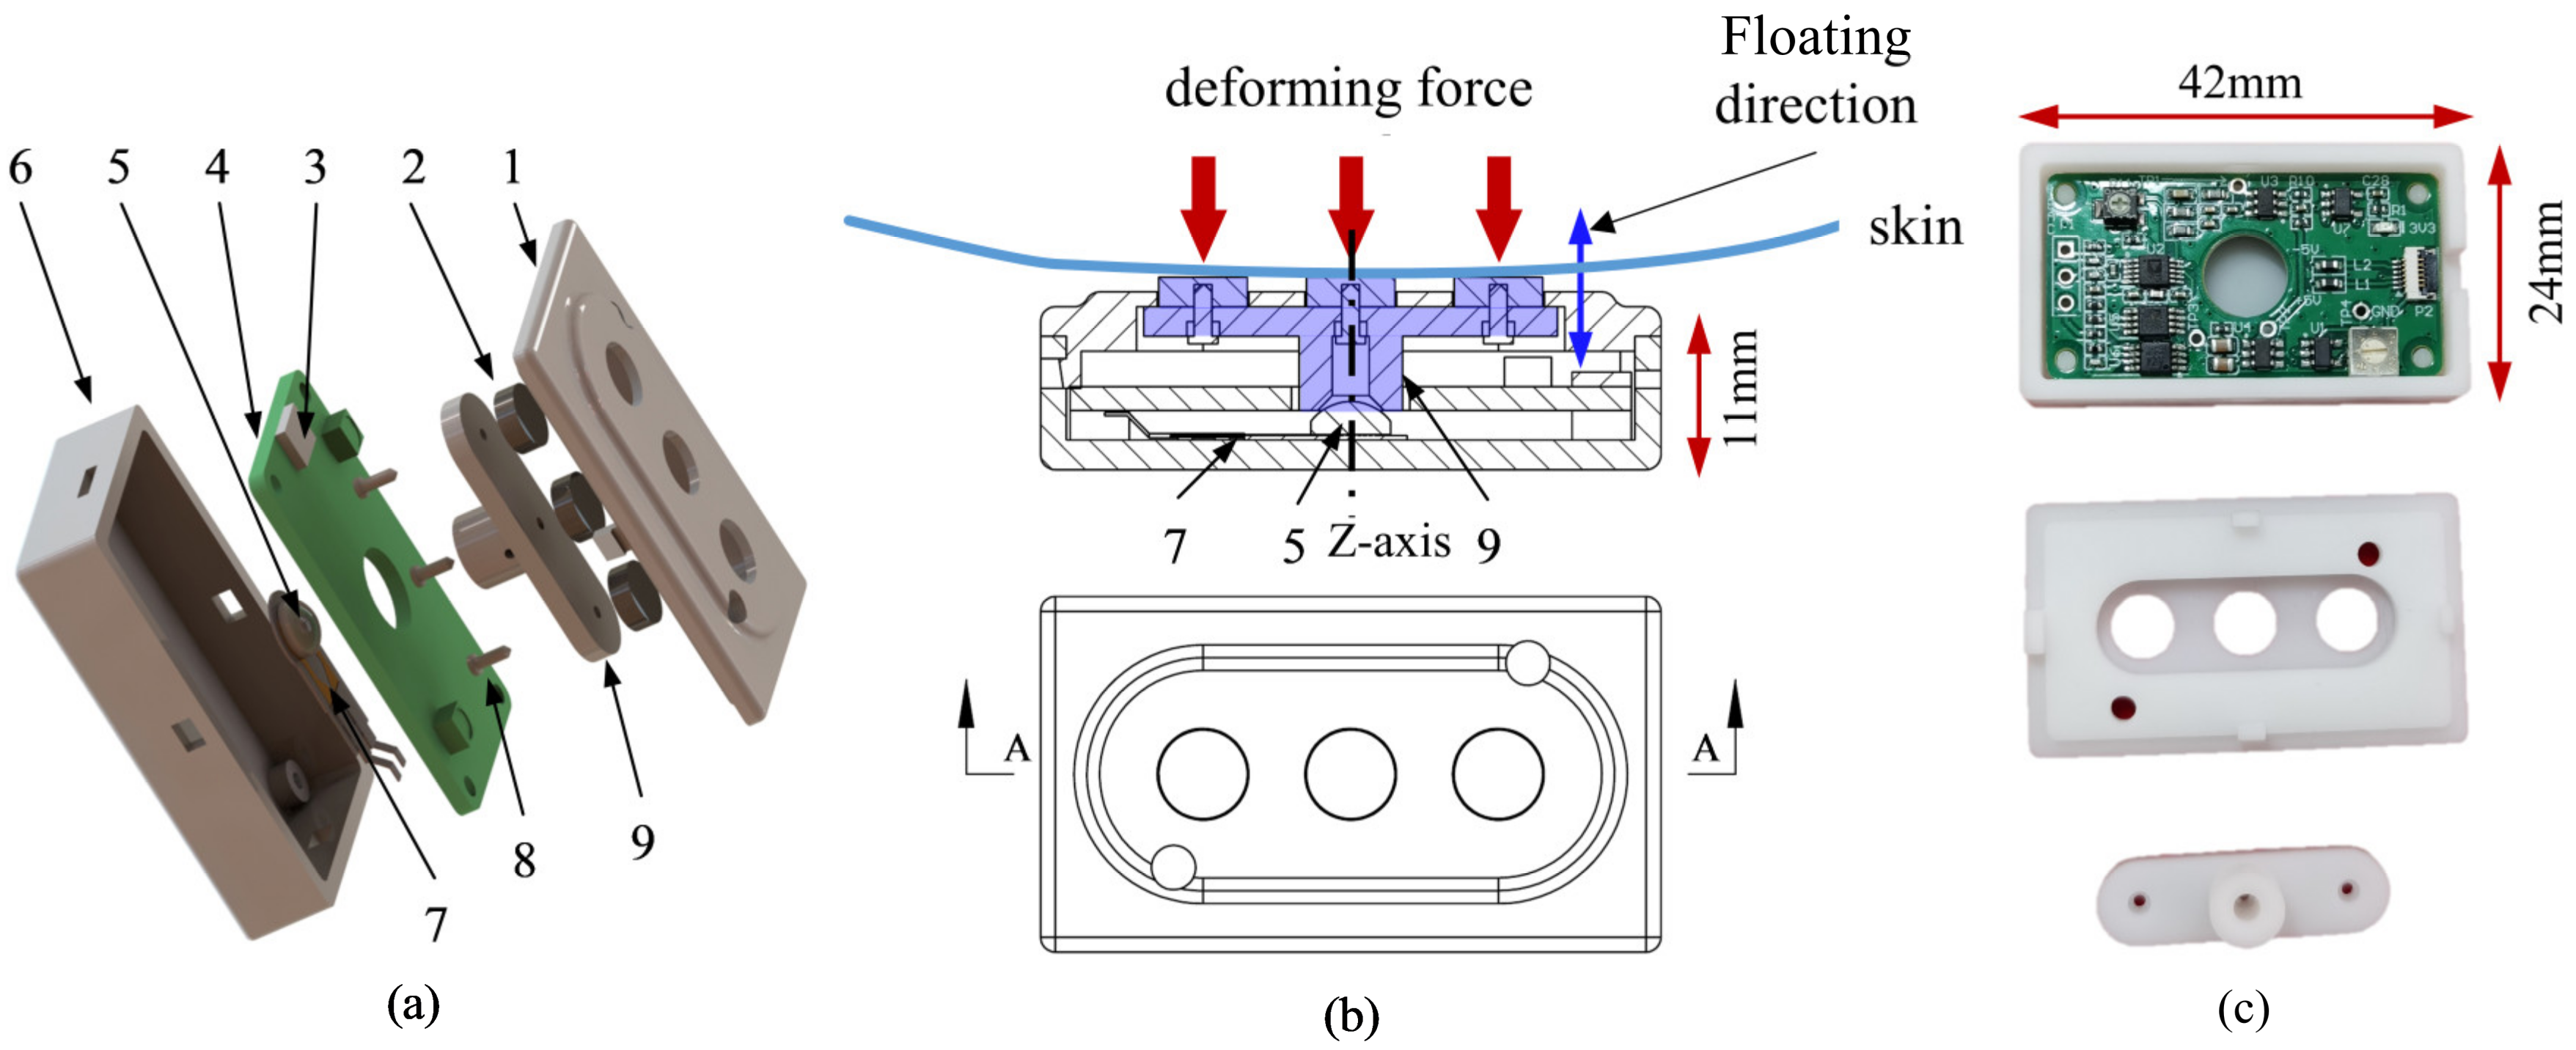
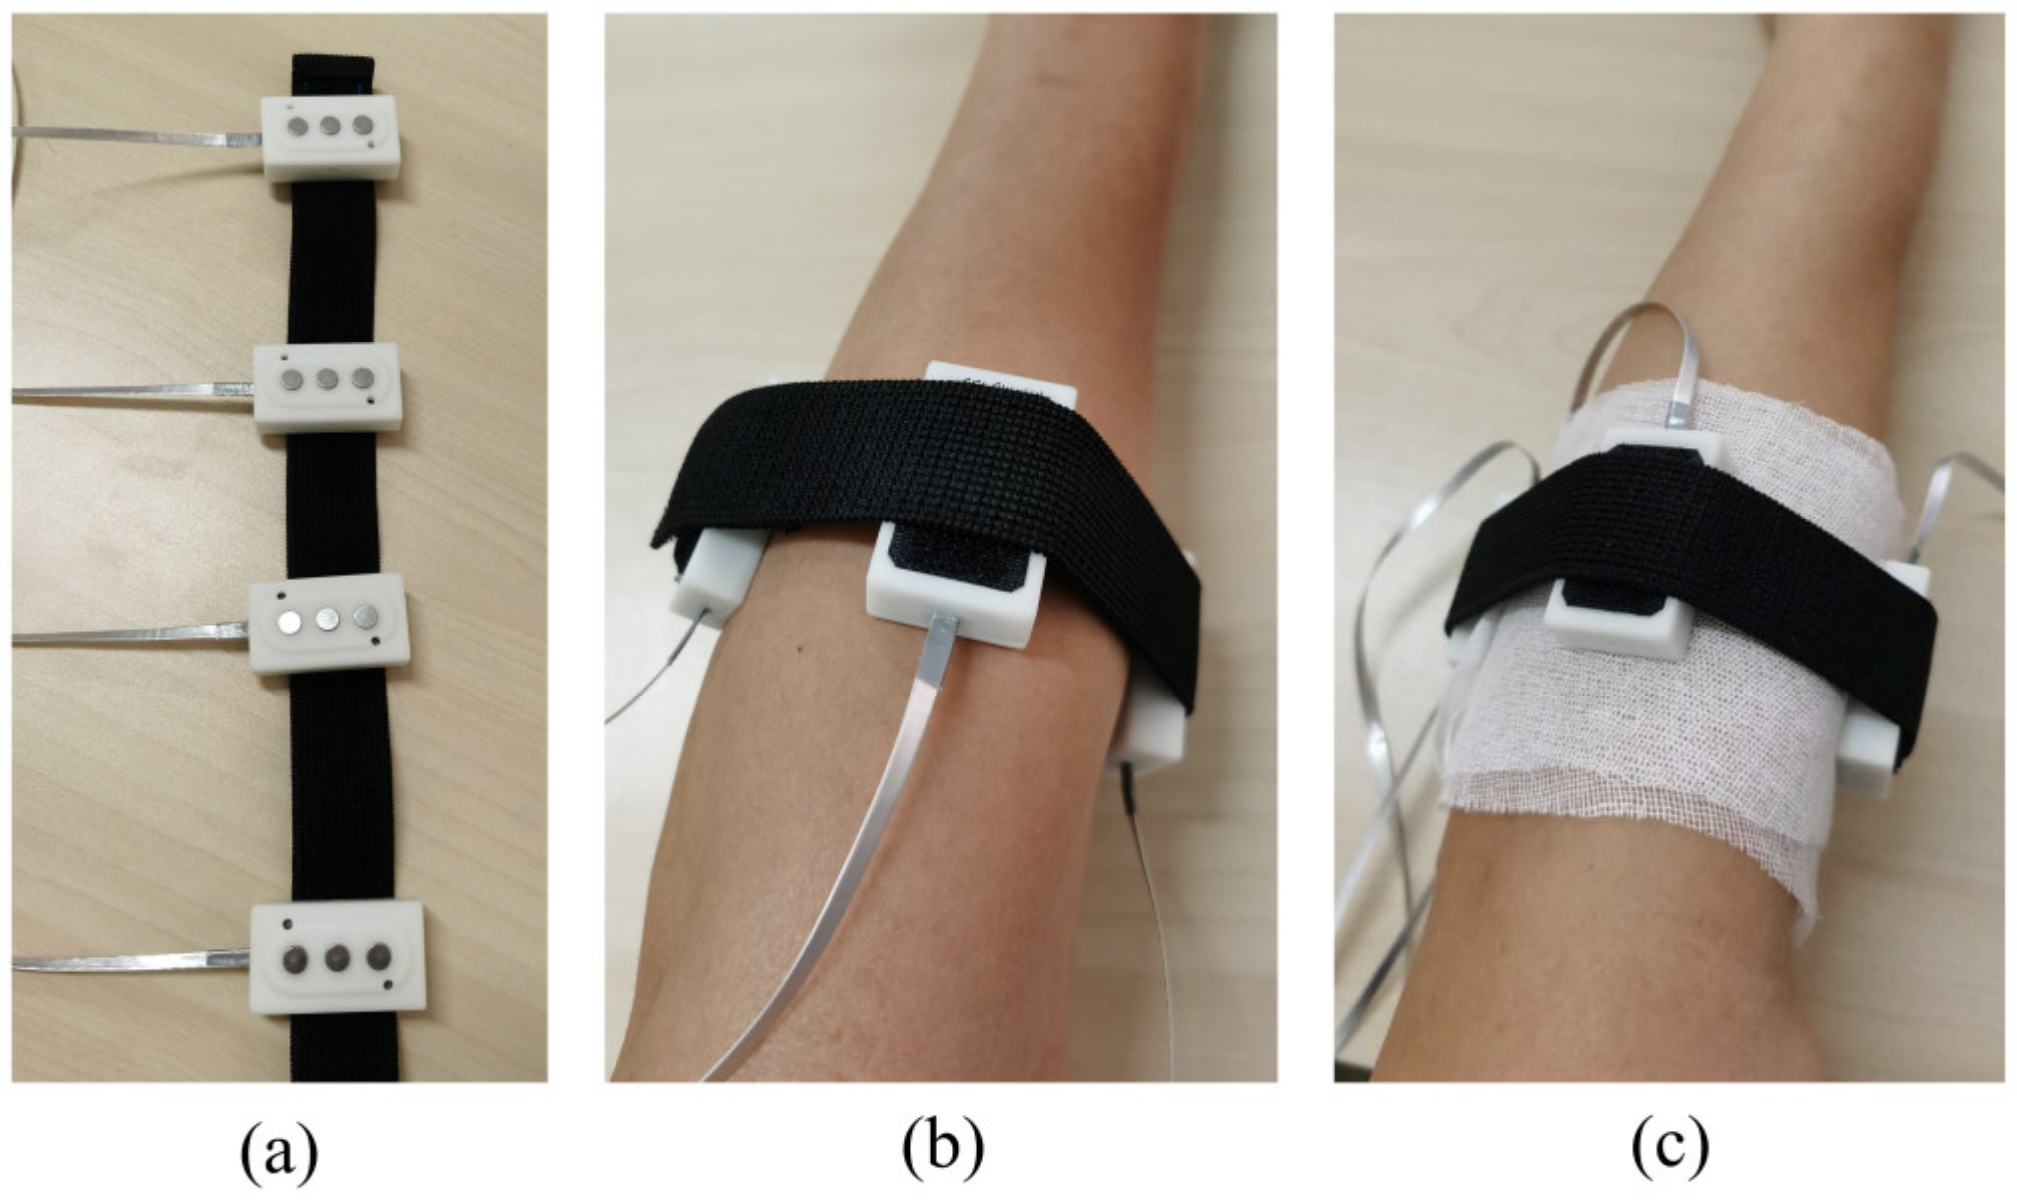
2.1.2. Mechanical Structure Design
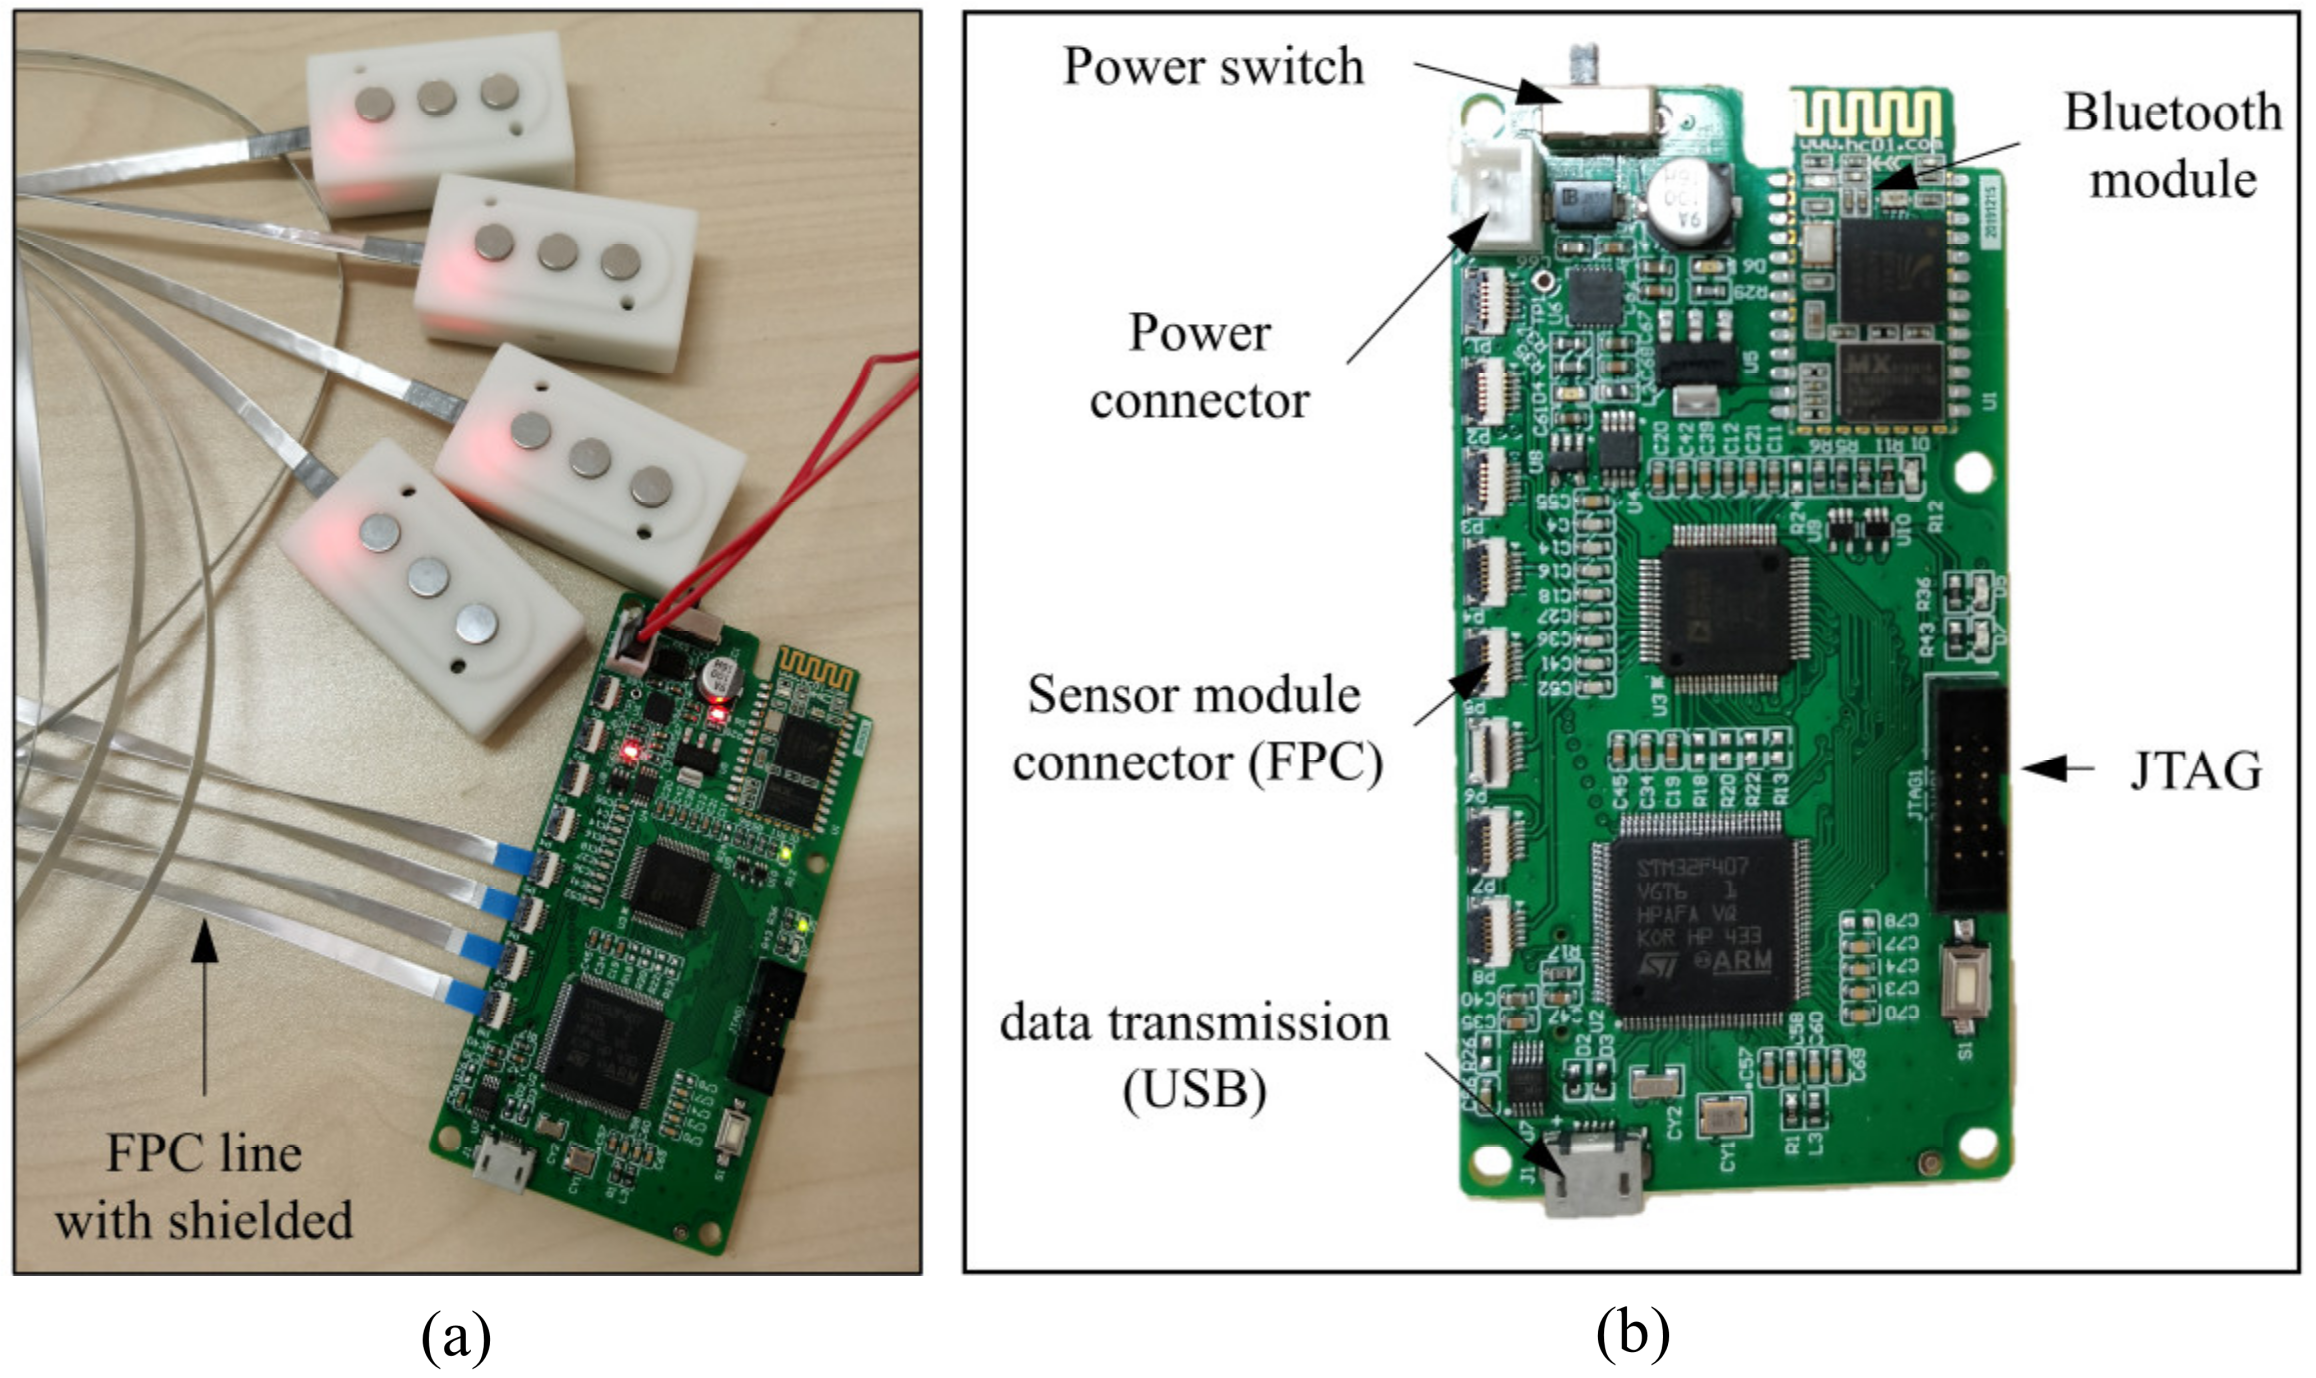
2.1.3. Control Board
2.2. Experiment and Performance
2.2.1. EMG vs. FMG Signal Comparison
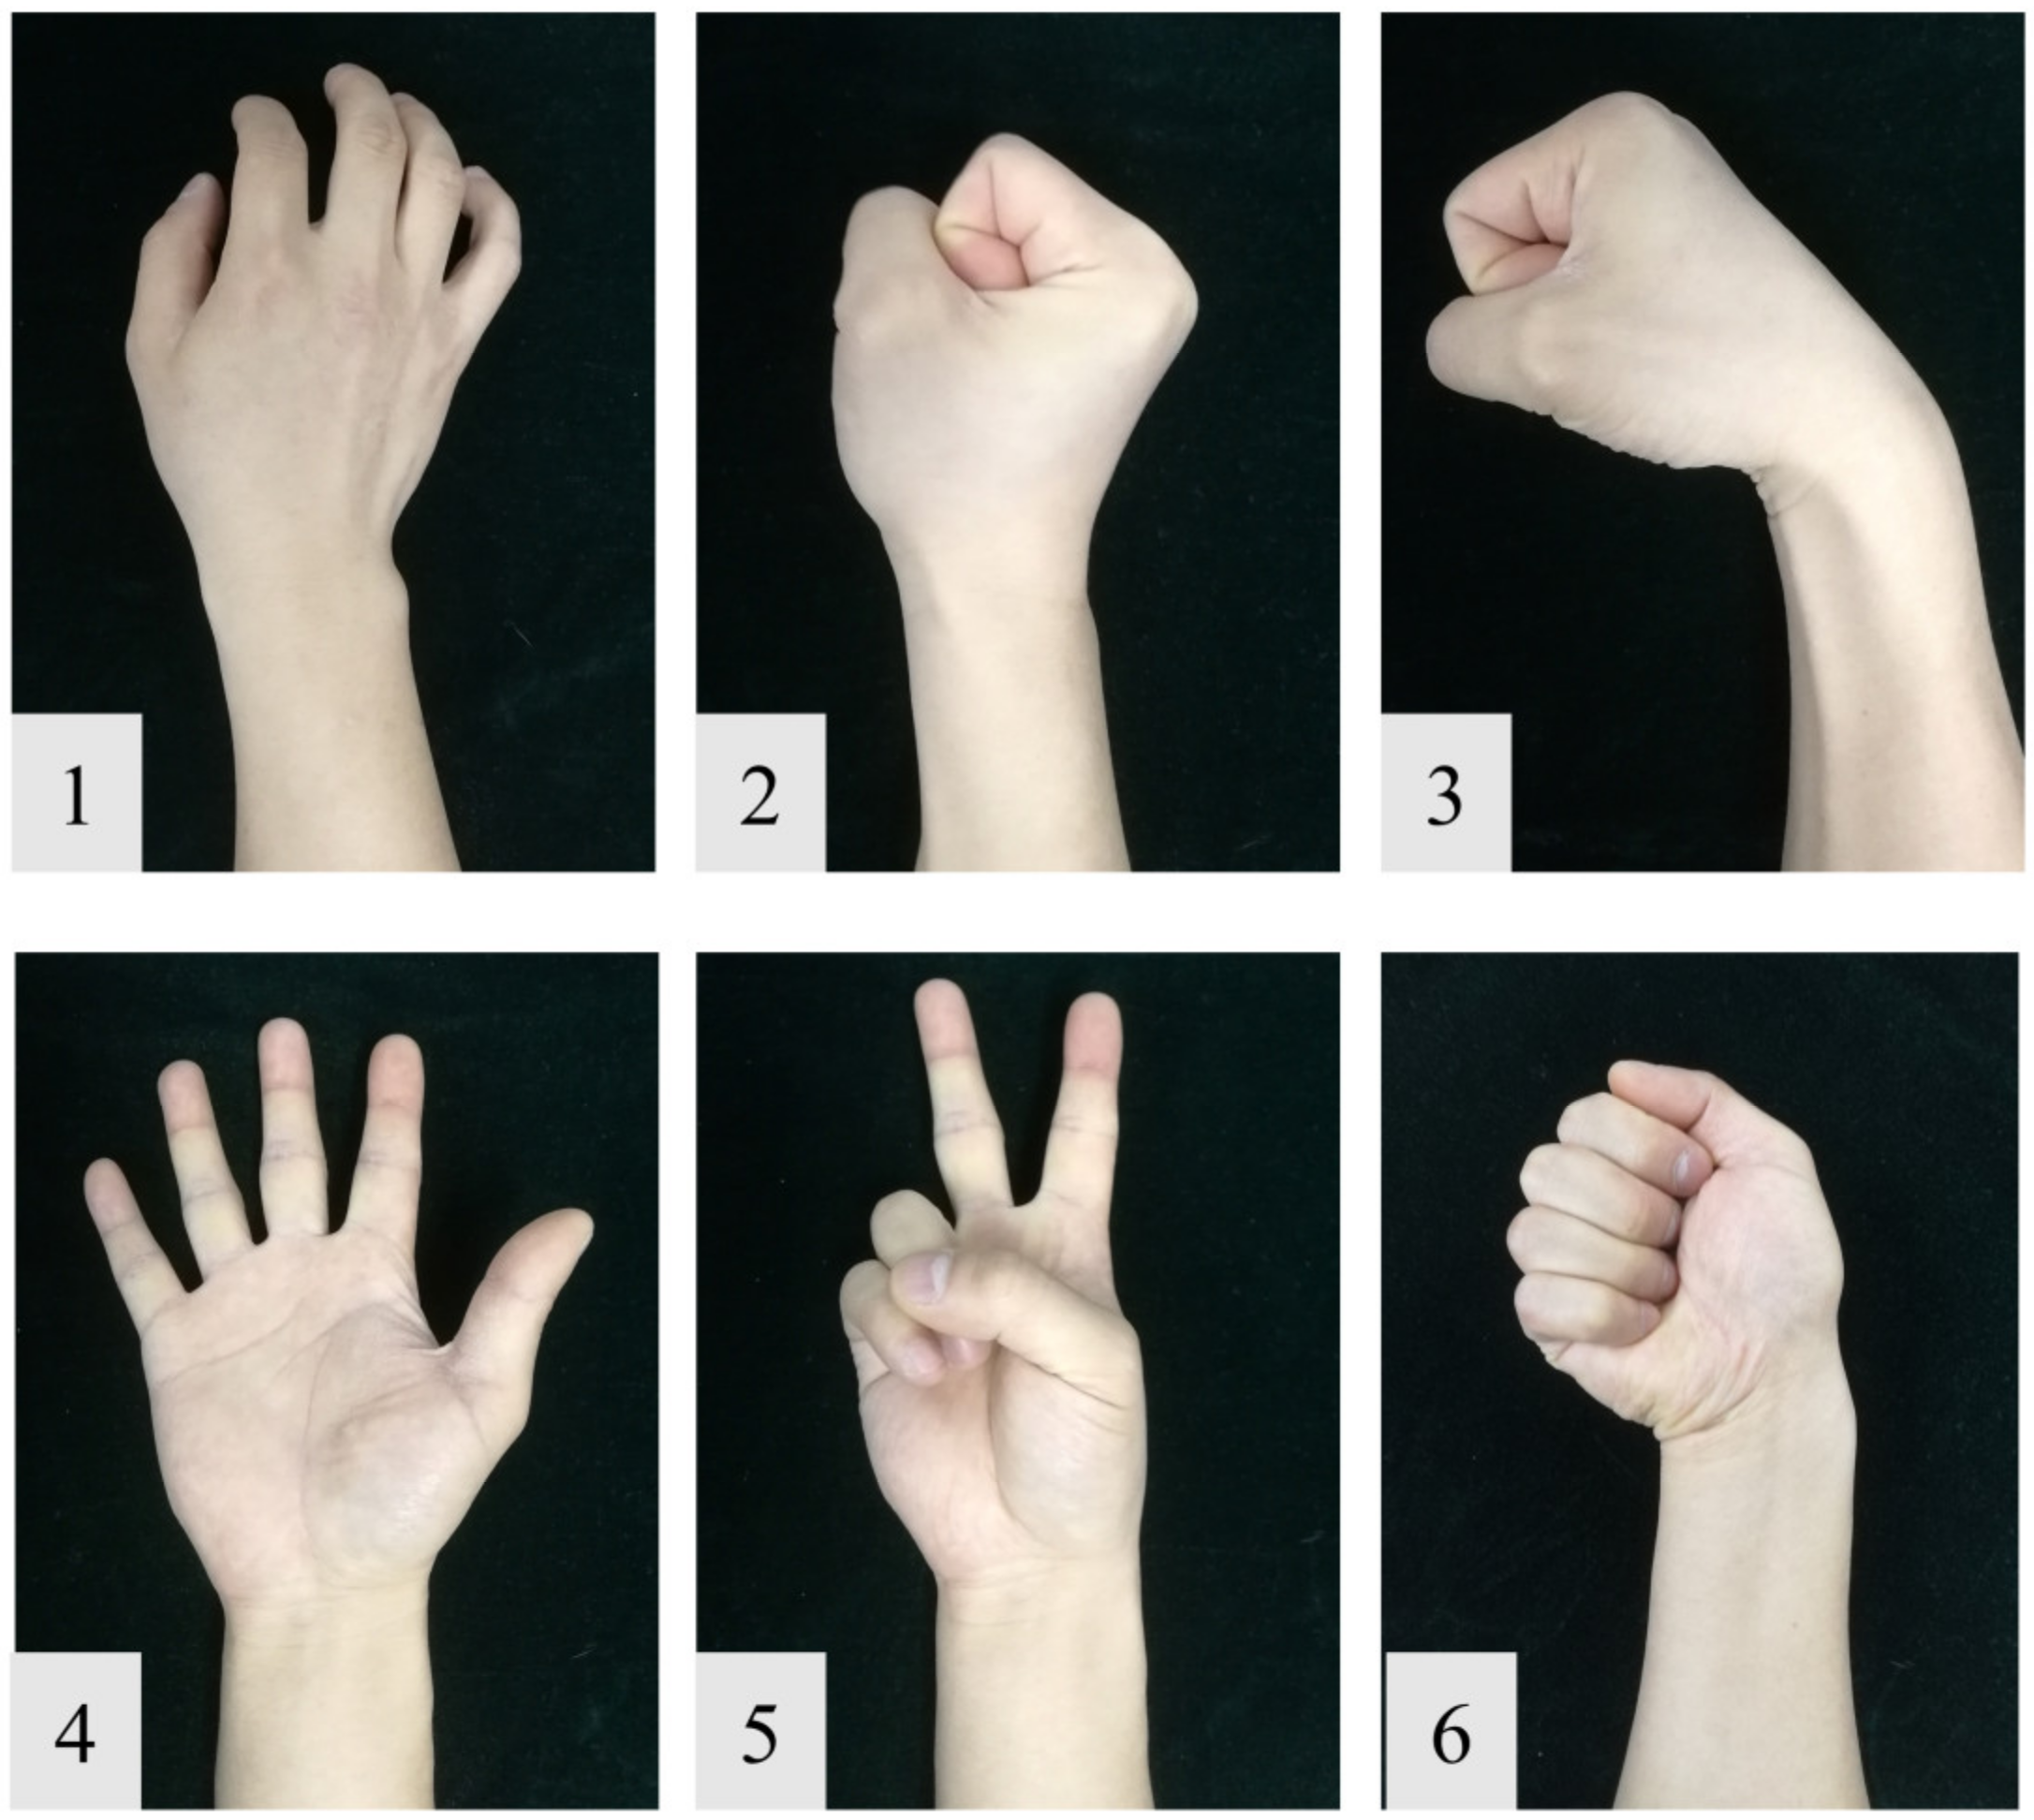
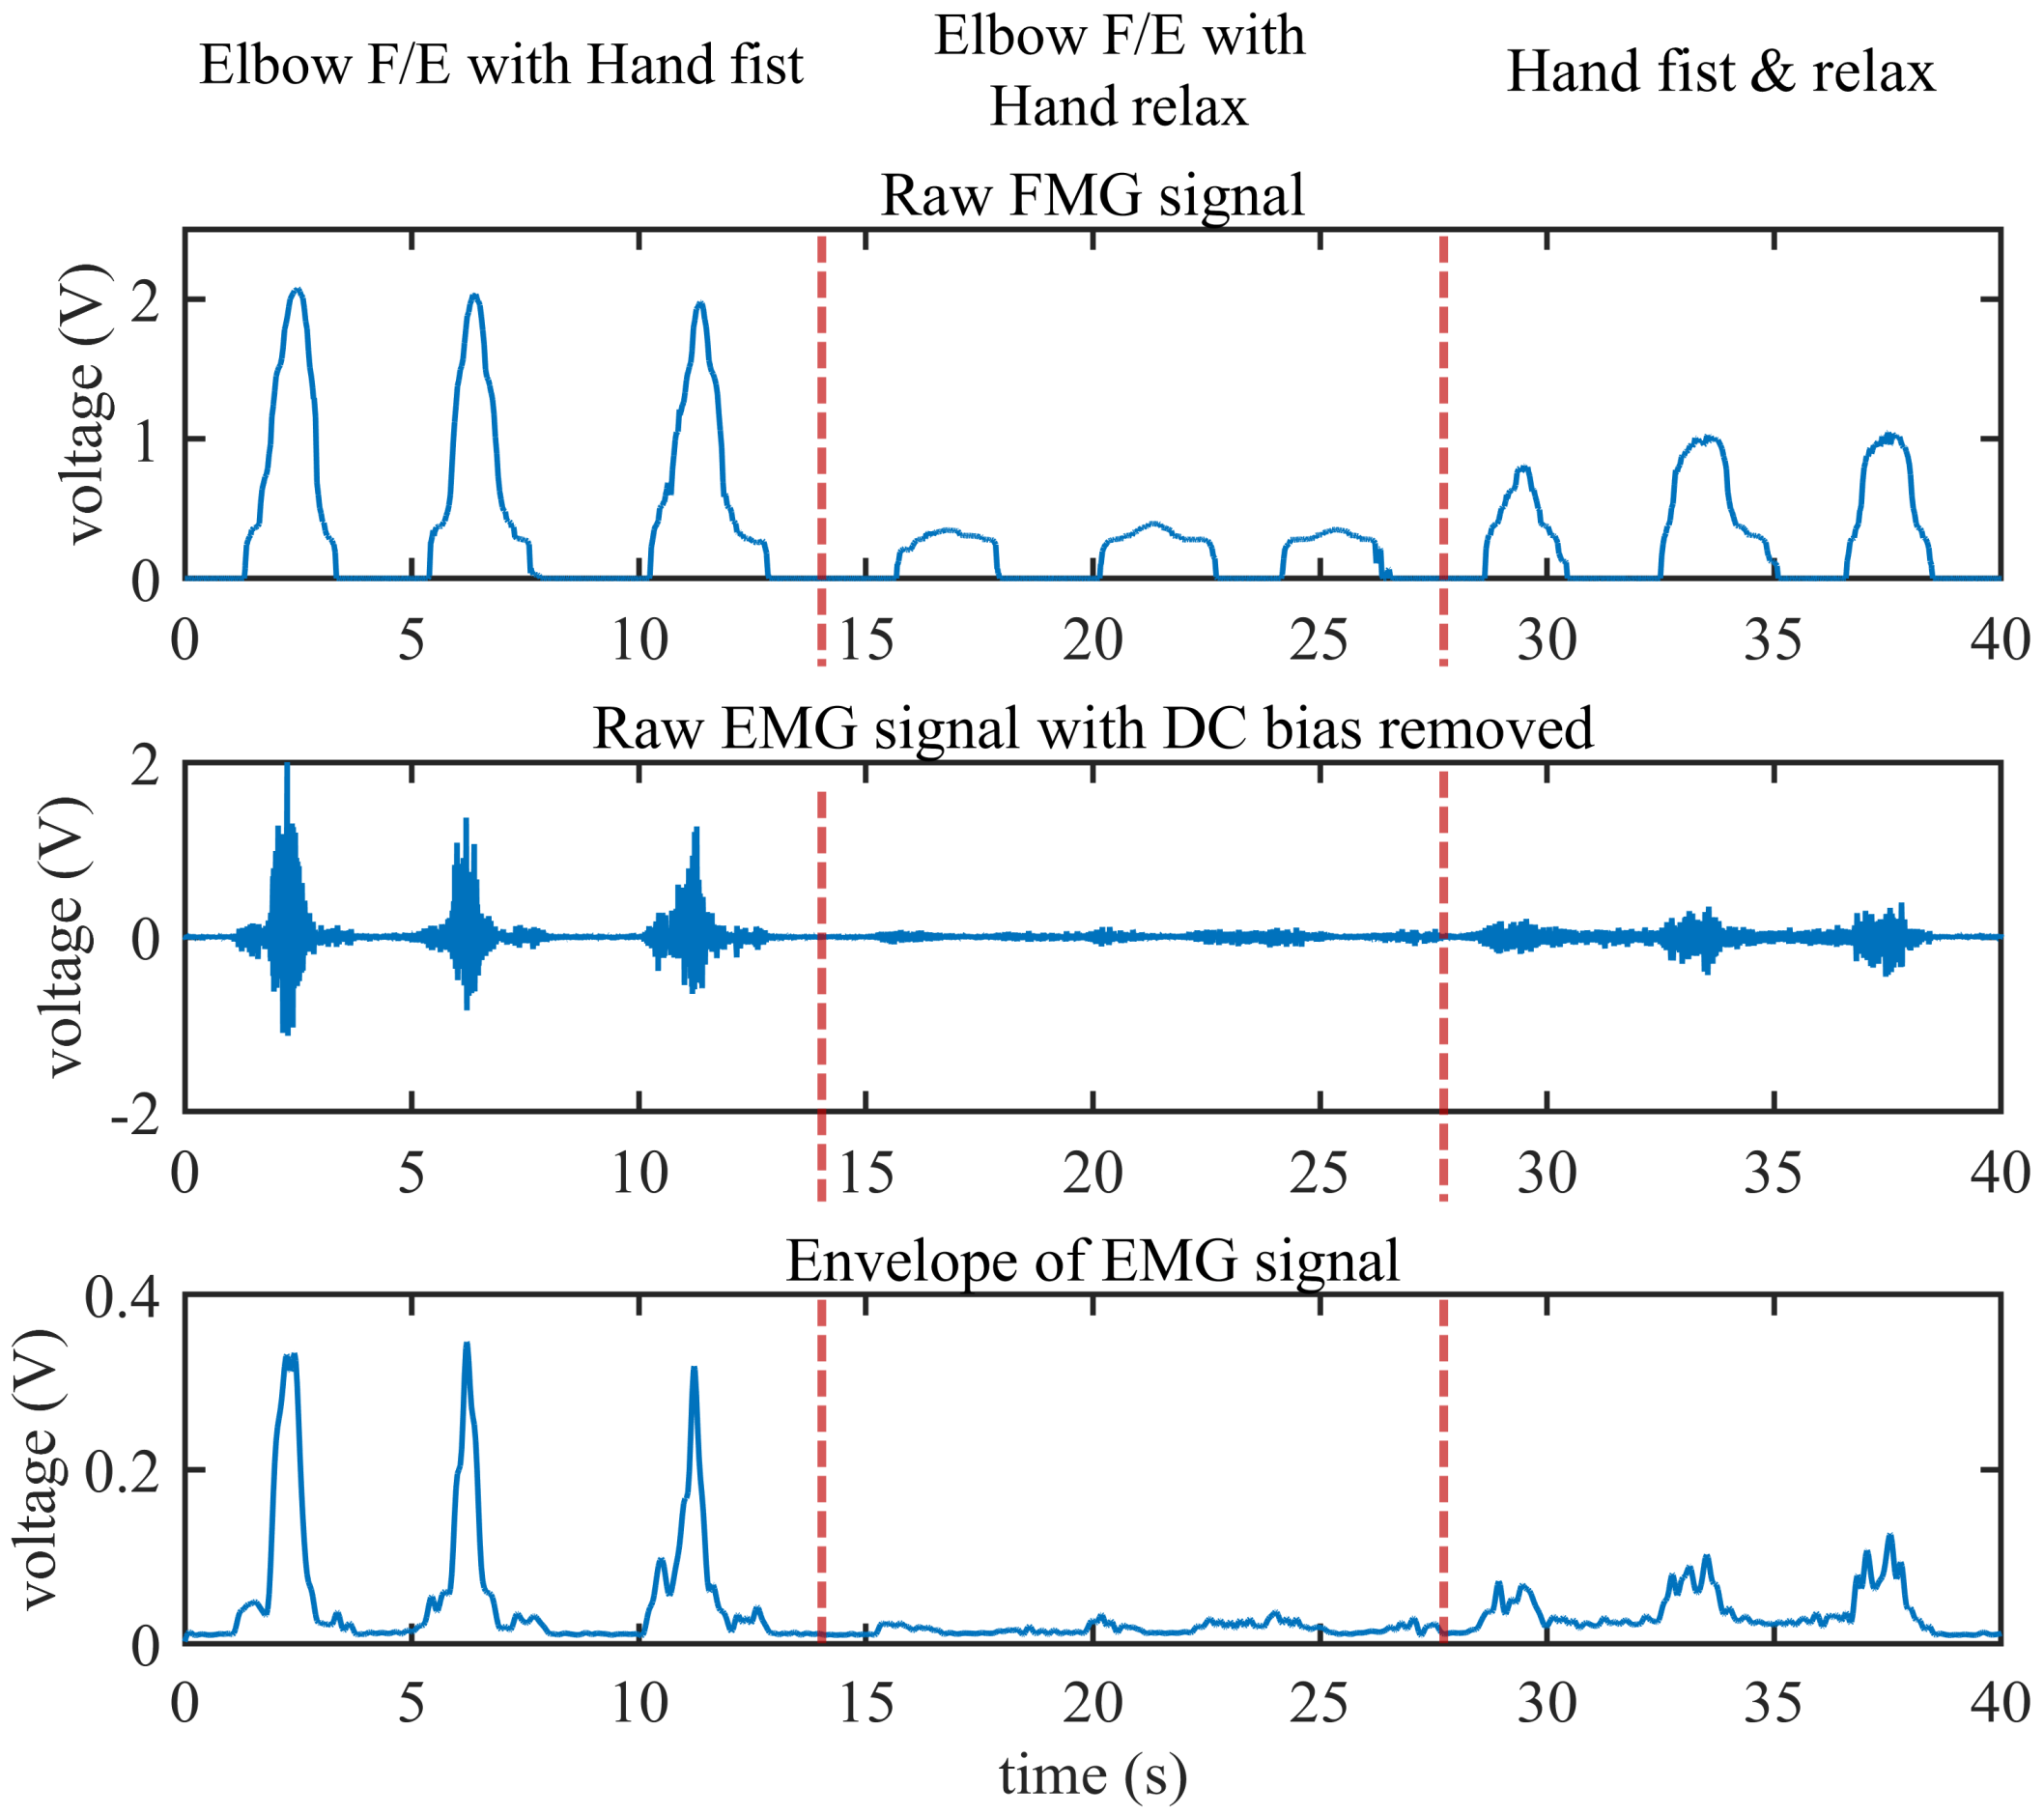
- Elbow flexion and extension with the hand in a fist and relaxed. As illustrated in Figure 6b, the subject keeps the hand in a tight fist during elbow flexion but relaxes it while performing elbow extension.
- Elbow flexion and extension with the hand relaxed. As illustrated in Figure 6c, the subject keeps the hand relaxed during elbow flexion and extension.
- Hand relaxes and is then placed in a fist. As illustrated in Figure 6d, the subject keeps the elbow extension fully in a natural position, then places the hand in a fist and relaxes periodically.
2.2.2. Gesture Recognition
2.2.3. Data Acquisition
2.2.4. Data Analysis
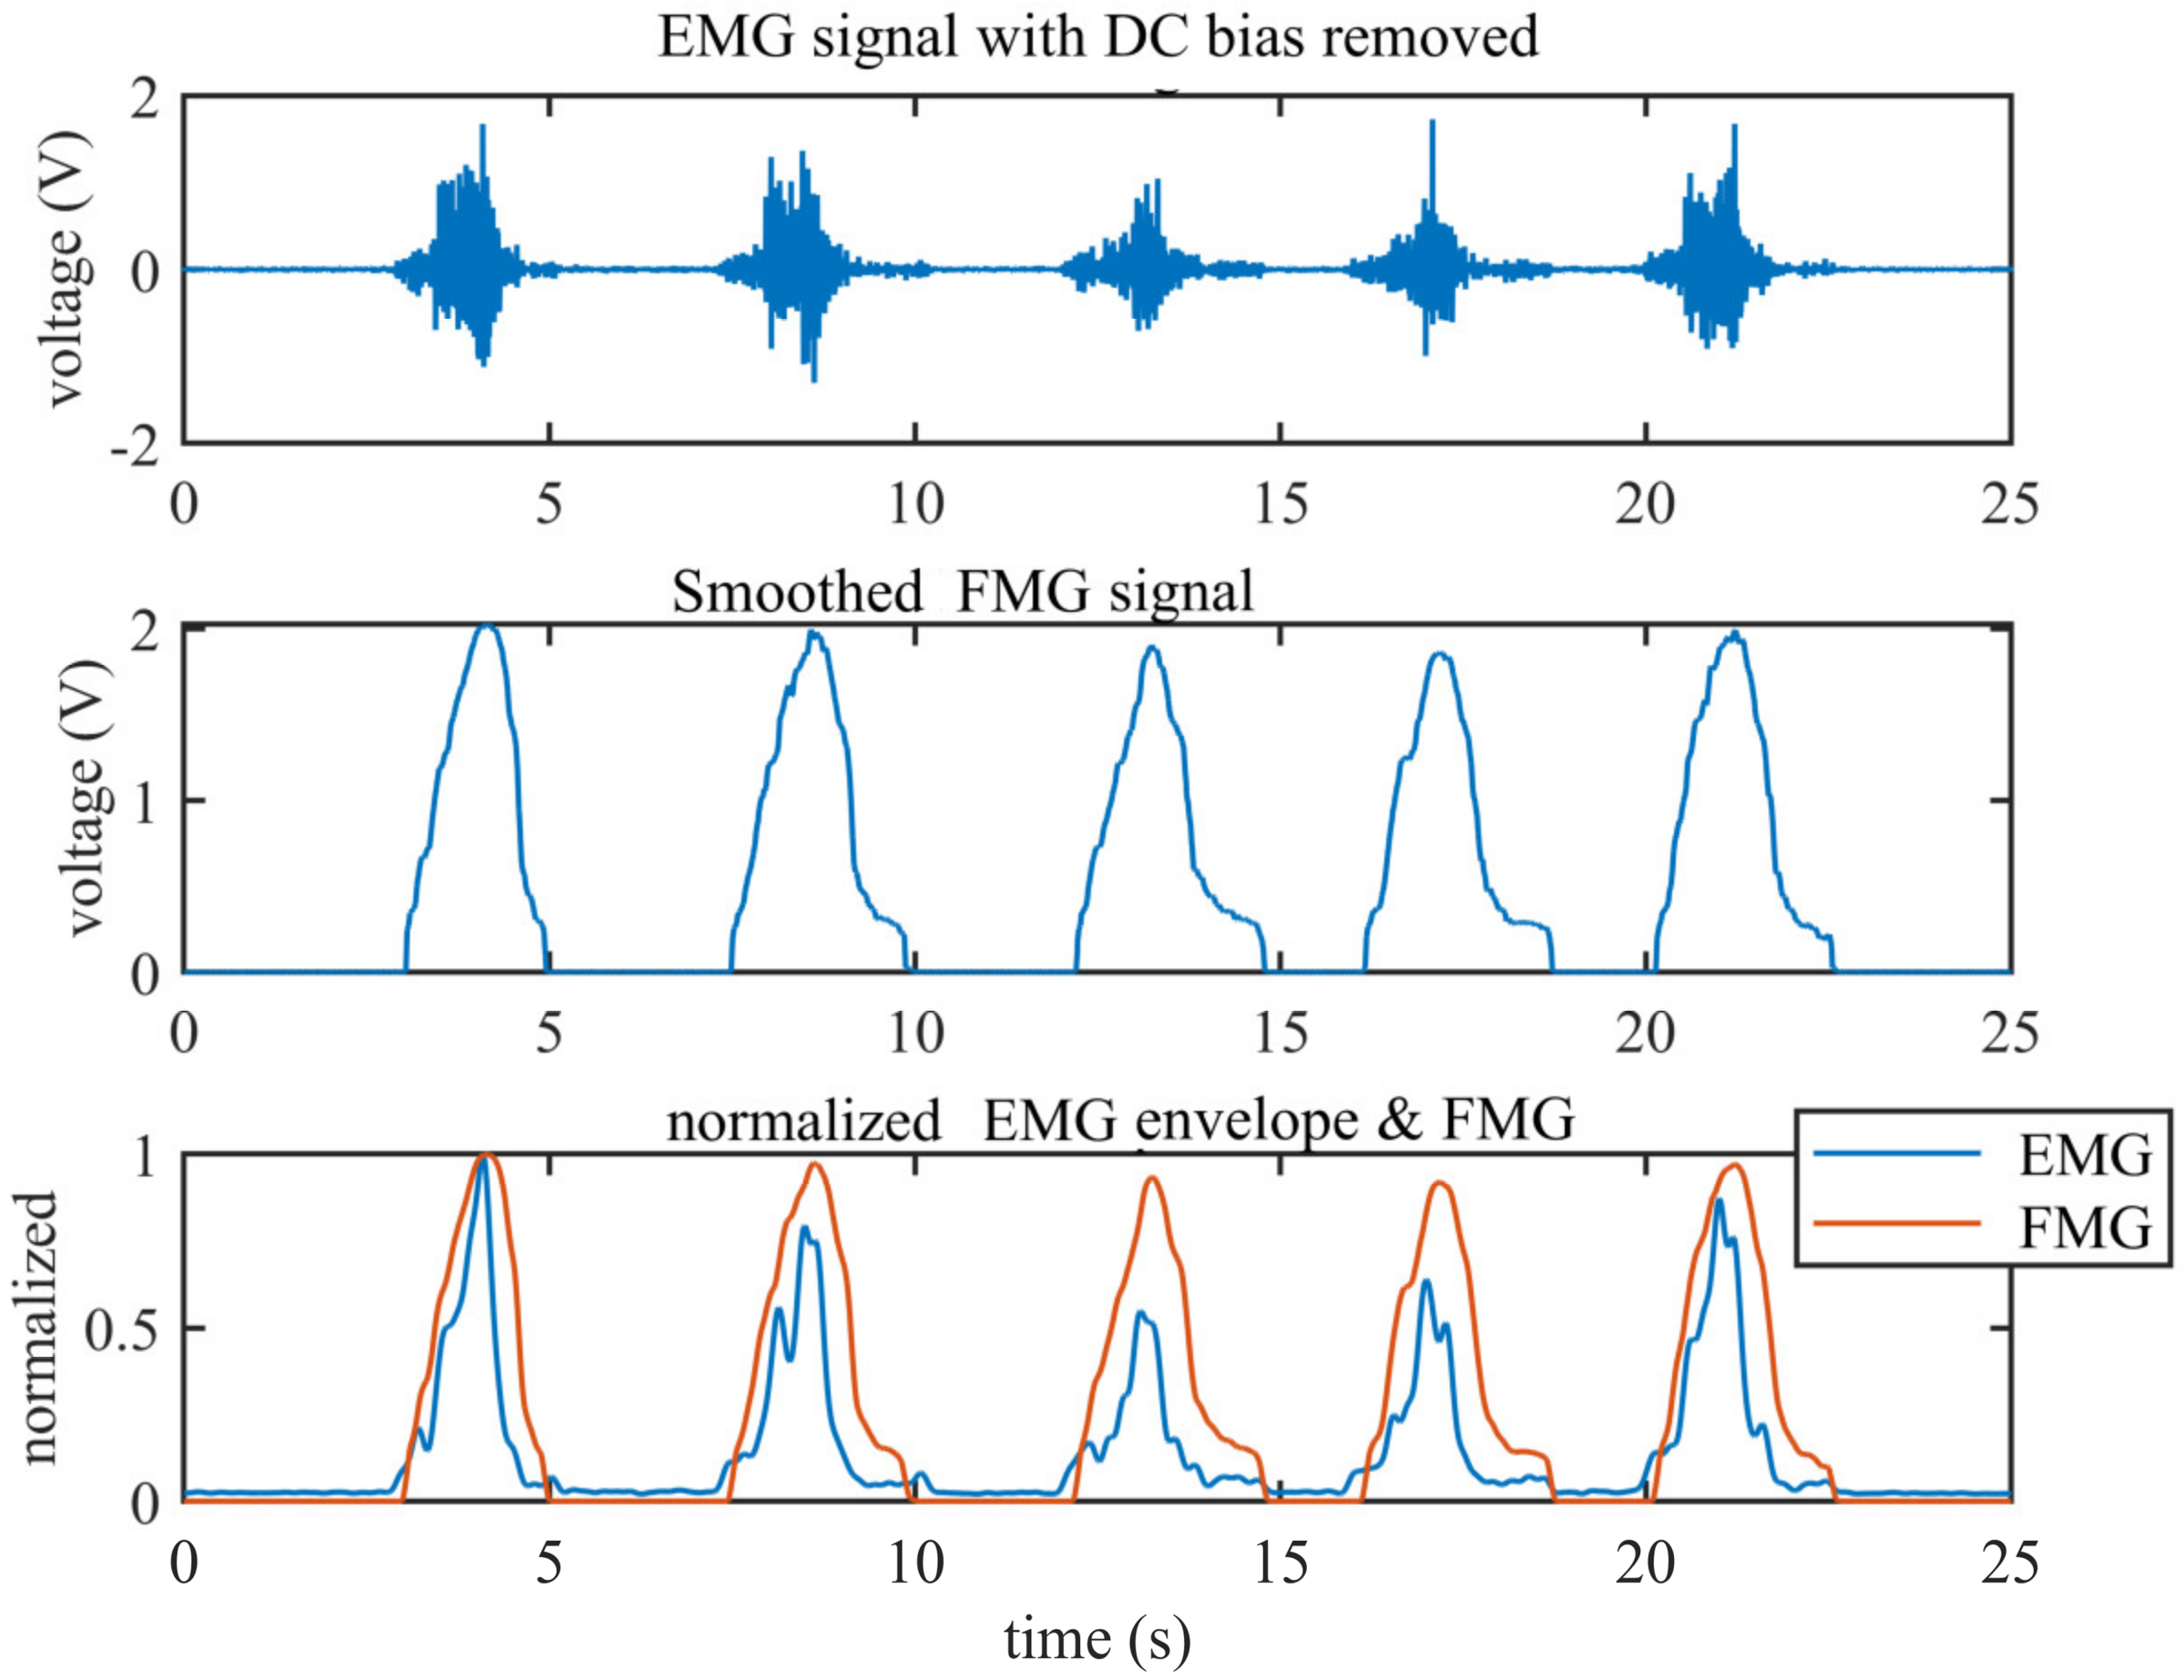
Comparison of EMG and FMG Envelopes
Feature Extraction
Classifier
3. Results
3.1. Comparison of EMG and FMG Envelopes
3.2. Comparison of EMG and FMG Signals under Different Muscle Loads
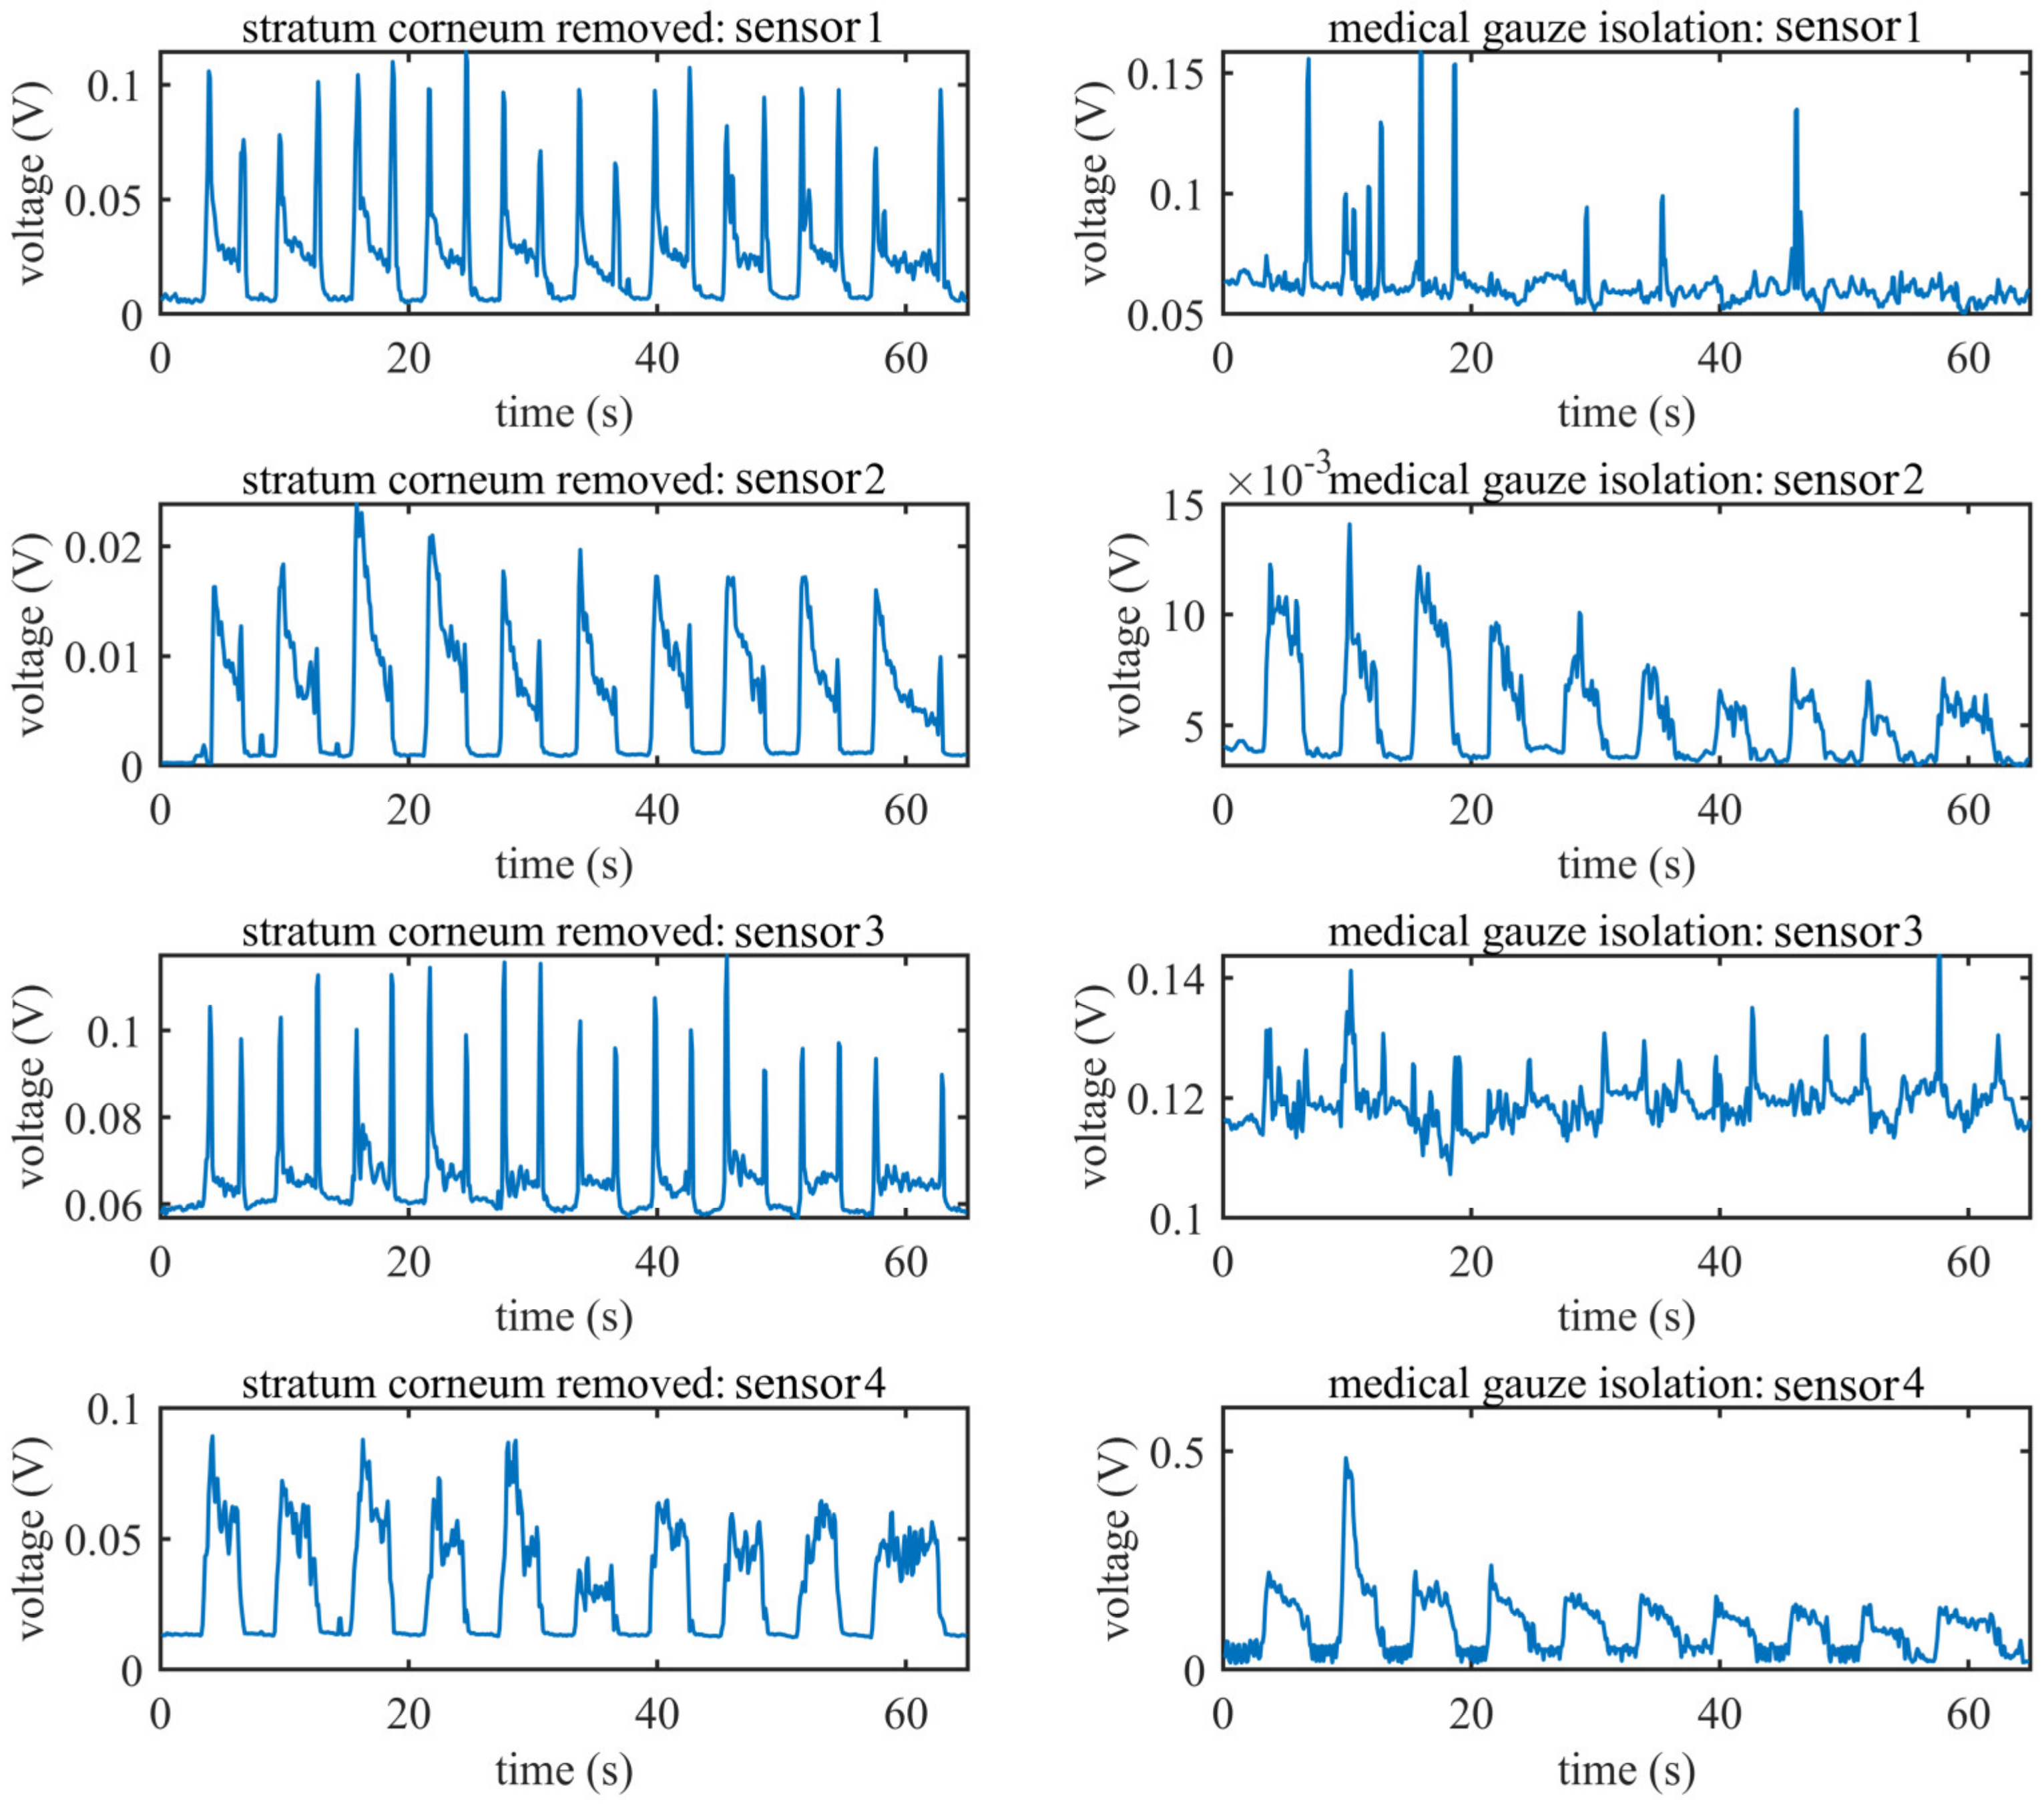
3.3. EMG Signal under Limiting Conditions
3.4. Gesture Recognition Performance
4. Discussion
5. Conclusions
Author Contributions
Funding
Acknowledgments
Conflicts of Interest
References
- Simão, M.; Mendes, N.; Gibaru, O.; Neto, P. A Review on Electromyography Decoding and Pattern Recognition for Human-Machine Interaction. IEEE Access 2019, 7, 39564–39582. [Google Scholar] [CrossRef]
- Carey, S.L.; Lura, D.J.; Highsmith, M.J. Differences in myoelectric and body-powered upper-limb prostheses. Systematic literature review. J. Rehabil. Res. Dev. 2015, 52, 247–262. [Google Scholar] [CrossRef] [PubMed]
- Jian, H.; Ri, S.; Fukuda, T.; Wang, Y.A. A Disturbance Observer Based Sliding Mode Control for a Class of Underactuated Robotic System With Mismatched Uncertainties. IEEE Trans. Automat. Contr. 2019, 64, 2480–2487. [Google Scholar] [CrossRef]
- Jian, H.; MyongHyok, R.; DongRui, W.; Songhyok, R. Interval Type-2 Fuzzy Logic Modeling and Control of a Mobile Two-Wheeled Inverted Pendulum. IEEE Trans. Fuzzy Syst. 2018, 26, 2030–2038. [Google Scholar] [CrossRef]
- Parajuli, N.; Sreenivasan, N.; Bifulco, P.; Cesarelli, M.; Savino, S.; Niola, V.; Esposito, D.; Hamilton, T.J.; Naik, G.R.; Gunawardana, U.; et al. Real-Time EMG Based Pattern Recognition Control for Hand Prostheses: A Review on Existing Methods, Challenges and Future Implementation. Sensors 2019, 19, 4596. [Google Scholar] [CrossRef] [PubMed] [Green Version]
- Farina, D.; Jiang, N.; Rehbaum, H.; Holobar, A.; Graimann, B.; Dietl, H.; Aszmann, O.C. The extraction of neural information from the surface EMG for the control of upper-limb prostheses: Emerging avenues and challenges. IEEE Trans. Neural Syst. Rehabil. Eng. 2014, 22, 797–809. [Google Scholar] [CrossRef]
- Pasquina, P.F.; Evangelista, M.; Carvalho, A.J.; Lockhart, J.; Griffin, S.; Nanos, G.; McKay, P.; Hansen, M.; Ipsen, D.; Vandersea, J.; et al. First-in-man demonstration of a fully implanted myoelectric sensors system to control an advanced electromechanical prosthetic hand. J. Neurosci. Methods 2015, 244, 85–93. [Google Scholar] [CrossRef] [PubMed] [Green Version]
- Esposito, D.; Andreozzi, E.; Fratini, A.; Gargiulo, G.D.; Savino, S.; Niola, V.; Bifulco, P. A piezoresistive sensor to measure muscle contraction and mechanomyography. Sensors 2018, 18, 2553. [Google Scholar] [CrossRef] [Green Version]
- Xiao, Z.G.; Menon, C. A Review of Force Myography Research and Development. Sensors 2019, 19, 4557. [Google Scholar] [CrossRef] [Green Version]
- Ahmadizadeh, C.; Merhi, L.-K.; Pousett, B.; Sangha, S.; Menon, C. Toward Intuitive Prosthetic Control: Solving Common Issues Using Force Myography, Surface Electromyography, and Pattern Recognition in a Pilot Case Study. IEEE Robot. Autom. Mag. 2017, 24, 102–111. [Google Scholar] [CrossRef]
- Ferigo, D.; Merhi, L.-K.; Pousett, B.; Xiao, Z.G.; Menon, C. A Case Study of a Force-myography Controlled Bionic Hand Mitigating Limb Position Effect. J. Bionic Eng. 2017, 14, 692–705. [Google Scholar] [CrossRef]
- Ang, K.; Jian, H.; Luyao, C.; Zhaolong, G.; Jiuqi, H.; Changyong, W.; Jin, Z.; Jiping, H. Fingertip Tactile Sensor with Single Sensing Element Based on FSR and PVDF. IEEE Sens. J. 2019, 19, 11100–11112. [Google Scholar] [CrossRef]
- Abboudi, R.L.; Glass, C.A.; Newby, N.A.; Flint, J.A.; Craelius, W. A biomimetic controller for a multifinger prosthesis. IEEE Trans. Rehabil. Eng. 1999, 7, 121–129. [Google Scholar] [CrossRef] [PubMed]
- Fang, P.; Ma, X.; Li, X.; Qiu, X.; Gerhard, R.; Zhang, X.; Li, G. Fabrication, structure characterization, and performance testing of piezoelectret-film sensors for recording body motion. IEEE Sens. J. 2018, 18, 401–412. [Google Scholar] [CrossRef]
- Booth, R.; Goldsmith, P. A Wrist-Worn Piezoelectric Sensor Array for Gesture Input. J. Med. Biol. Eng. 2018, 38, 284–295. [Google Scholar] [CrossRef]
- Fujiwara, E.; Suzuki, C.K. Optical fiber force myography sensor for identification of hand postures. J. Sens. 2018, 2018. [Google Scholar] [CrossRef] [Green Version]
- Wu, Y.T.; Fujiwara, E.; Suzuki, C.K. Evaluation of Optical Myography Sensor as Predictor of Hand Postures. IEEE Sens. J. 2019, 19, 5299–5306. [Google Scholar] [CrossRef]
- Esposito, D.; Andreozzi, E.; Gargiulo, G.D.; Fratini, A.; D’Addio, G.; Naik, G.R.; Bifulco, P. A Piezoresistive Array Armband with Reduced Number of Sensors for Hand Gesture Recognition. Front. Neurorobotics 2020, 13. [Google Scholar] [CrossRef] [Green Version]
- Connan, M.; Ruiz, R.E.; Vodermayer, B.; Castellini, C. Assessment of a Wearable Force- and Electromyography Device and Comparison of the Related Signals for Myocontrol. Front. Neurorobotics 2016, 10, 17. [Google Scholar] [CrossRef] [Green Version]
- Belbasis, A.; Fuss F, K. Muscle performance investigated with a novel smart compression garment based on pressure sensor force myography and its validation against EMG. Front. Physiol. 2018, 9, 408. [Google Scholar] [CrossRef] [PubMed] [Green Version]
- Herrera-Luna, I.; Rechy-Ramirez, E.J.; Rios-Figueroa, H.V.; Marin-Hernandez, A. Sensor Fusion Used in Applications for Hand Rehabilitation: A Systematic Review. IEEE Sens. J. 2019, 19, 3581–3592. [Google Scholar] [CrossRef]
- Nowak, M.; Eiband, T.; Castellini, C. Multi-modal myocontrol: Testing combined force-and electromyography. In Proceedings of the International Conference on Rehabilitation Robotics, London, UK, 17–20 July 2017; Volume 2017, pp. 1364–1368. [Google Scholar] [CrossRef] [Green Version]
- Jiang, S.; Gao, Q.; Liu, H.; Shull, P.B. A novel, co-located EMG-FMG-sensing wearable armband for hand gesture recognition. Sens. Actuators A Phys. 2020, 301, 111738. [Google Scholar] [CrossRef]
- Gargiulo, G.D.; Bifulco, P.; Cesarelli, M.; Fratini, A.; Romano, M. Problems in Assessment of Novel Biopotential Front-End with Dry Electrode: A Brief Review. Machines 2014, 2, 87–98. [Google Scholar] [CrossRef]
- AD8220 Date Sheet. Available online: https://www.analog.com/media/en/technical-documentation/data-sheets/AD8220.pdf (accessed on 21 August 2020).
- Paredes-Madrid, L.; Matute, A.; Bareño, J.O.; Parra Vargas, C.A. Gutierrez Velásquez, E.I. Underlying Physics of Conductive Polymer Composites and Force Sensing Resistors (FSRs). A Study on Creep Response and Dynamic Loading. Materials 2017, 10, 1334. [Google Scholar] [CrossRef] [Green Version]
- Paredes-Madrid, L.; Palacio, C.; Matute, A.; Parra Vargas, C. Underlying physics of conductive polymer composites and force sensing resistors (FSRs) under static loading conditions. Sensors 2017, 17, 2108. [Google Scholar] [CrossRef] [Green Version]
- AD8244 Date Sheet. Available online: https://www.analog.com/media/en/technical-documentation/data-sheets/AD8244.pdf (accessed on 21 August 2020).
- Trigno EMG & Additional Sensors. Available online: https://delsys.com/trigno/sensors/ (accessed on 19 July 2020).
- Ding, X.; Wang, M.; Guo, W.; Sheng, X.; Zhu, X. Hybrid sEMG, NIRS and MMG Sensor System. In Proceedings of the 2018 25th International Conference on Mechatronics and Machine Vision in Practice (M2VIP), Baden Wuerttemberg, Germany, 20–22 November 2018; pp. 1–6. [Google Scholar]
- Smith, C.M.; Housh, T.J.; Hill, E.C.; Keller, J.L.; Johnson, G.O.; Schmidt, R.J. A biosignal analysis for reducing prosthetic control durations: A proposed method using electromyographic and mechanomyographic control theory. J. Musculoskelet. Neuronal Interact. 2019, 19, 142. [Google Scholar]
- Smith, L.H.; Hargrove, L.J.; Lock, B.A.; Kuiken, T.A. Determining the optimal window length for pattern recognition-based myoelectric control: Balancing the competing effects of classification error and controller delay. IEEE Trans. Neural Syst. Rehabil. Eng. 2010, 19, 186–192. [Google Scholar] [CrossRef] [Green Version]


| Classifier | LDA | kNN | Linear SVM | Cubic SVM | |||||
|---|---|---|---|---|---|---|---|---|---|
| Accuracy | Mean | Std | Mean | Std | Mean | Std | Mean | std | |
| normal | EMG | 0.8701 | 0.0708 | 0.9218 | 0.0515 | 0.9583 | 0.0350 | 0.9551 | 0.0301 |
| FMG | 0.9420 | 0.0490 | 0.9667 | 0.0192 | 0.9601 | 0.0286 | 0.9739 | 0.0187 | |
| EMG + FMG | 0.9783 | 0.0162 | 0.9811 | 0.0124 | 0.9891 | 0.0071 | 0.9907 | 0.0050 | |
| gauze isolation | EMG | 0.7187 | 0.1834 | 0.8201 | 0.0956 | 0.7856 | 0.1720 | 0.9090 | 0.0513 |
| FMG | 0.9523 | 0.0365 | 0.9821 | 0.0113 | 0.9681 | 0.0188 | 0.9876 | 0.0075 | |
| EMG + FMG | 0.9763 | 0.0253 | 0.9757 | 0.0122 | 0.9850 | 0.0150 | 0.9942 | 0.0041 | |
| Conditions | Skin Prepared | Gauze Isolation | |||||
|---|---|---|---|---|---|---|---|
| Features | EMG | FMG | EMG + FMG | EMG | FMG | EMG + FMG | |
| Subject A | mean | 0.9572 | 0.9915 | 0.9872 | 0.9010 | 0.9937 | 0.9973 |
| std | 0.0140 | 0.0052 | 0.0072 | 0.0206 | 0.0075 | 0.0037 | |
| Subject B | mean | 0.9399 | 0.9850 | 0.9926 | 0.8728 | 0.9955 | 0.9987 |
| std | 0.0141 | 0.0069 | 0.0060 | 0.0198 | 0.0047 | 0.0024 | |
| Subject C | mean | 0.9573 | 0.9423 | 0.9959 | 0.8427 | 0.9902 | 0.9915 |
| std | 0.0127 | 0.0331 | 0.0046 | 0.0307 | 0.0084 | 0.0073 | |
| Subject D | mean | 0.9912 | 0.9863 | 0.9948 | 0.9343 | 0.9803 | 0.9946 |
| std | 0.0047 | 0.0087 | 0.0052 | 0.0173 | 0.0092 | 0.0058 | |
| Subject E | mean | 0.9811 | 0.9689 | 0.9938 | 0.9815 | 0.9911 | 0.9973 |
| std | 0.0089 | 0.0131 | 0.0061 | 0.0076 | 0.0072 | 0.0031 | |
| Subject F | mean | 0.8919 | 0.9872 | 0.9861 | 0.9797 | 0.9754 | 0.9895 |
| std | 0.0306 | 0.0081 | 0.0080 | 0.0092 | 0.0141 | 0.0071 | |
| Subject G | mean | 0.9657 | 0.9808 | 0.9934 | 0.8724 | 0.9809 | 0.9879 |
| std | 0.0146 | 0.0106 | 0.0050 | 0.0253 | 0.0092 | 0.0078 | |
| Subject H | mean | 0.9568 | 0.9491 | 0.9821 | 0.8880 | 0.9934 | 0.9967 |
| std | 0.0107 | 0.0144 | 0.0079 | 0.0195 | 0.0057 | 0.0042 | |
© 2020 by the authors. Licensee MDPI, Basel, Switzerland. This article is an open access article distributed under the terms and conditions of the Creative Commons Attribution (CC BY) license (http://creativecommons.org/licenses/by/4.0/).
Share and Cite
Ke, A.; Huang, J.; Chen, L.; Gao, Z.; He, J. An Ultra-Sensitive Modular Hybrid EMG–FMG Sensor with Floating Electrodes. Sensors 2020, 20, 4775. https://doi.org/10.3390/s20174775
Ke A, Huang J, Chen L, Gao Z, He J. An Ultra-Sensitive Modular Hybrid EMG–FMG Sensor with Floating Electrodes. Sensors. 2020; 20(17):4775. https://doi.org/10.3390/s20174775
Chicago/Turabian StyleKe, Ang, Jian Huang, Luyao Chen, Zhaolong Gao, and Jiping He. 2020. "An Ultra-Sensitive Modular Hybrid EMG–FMG Sensor with Floating Electrodes" Sensors 20, no. 17: 4775. https://doi.org/10.3390/s20174775