Quarantining Malicious IoT Devices in Intelligent Sliced Mobile Networks

 ,
,  , and
, and
Abstract
:1. Introduction
- A two-step SDN-based architecture for detecting and mitigating DDoS attacks in IoT cellular networks.
- The analysis of the detection capabilities of the proposed solution through simulations.
- The evaluation of the reassignment of IoT devices to quarantine slices in a real-world testbed.
2. Related Work
3. Proposed Solution
3.1. Detection of Potential Malicious Devices
3.2. Dynamic Reassignment of Devices to Slices
4. Results
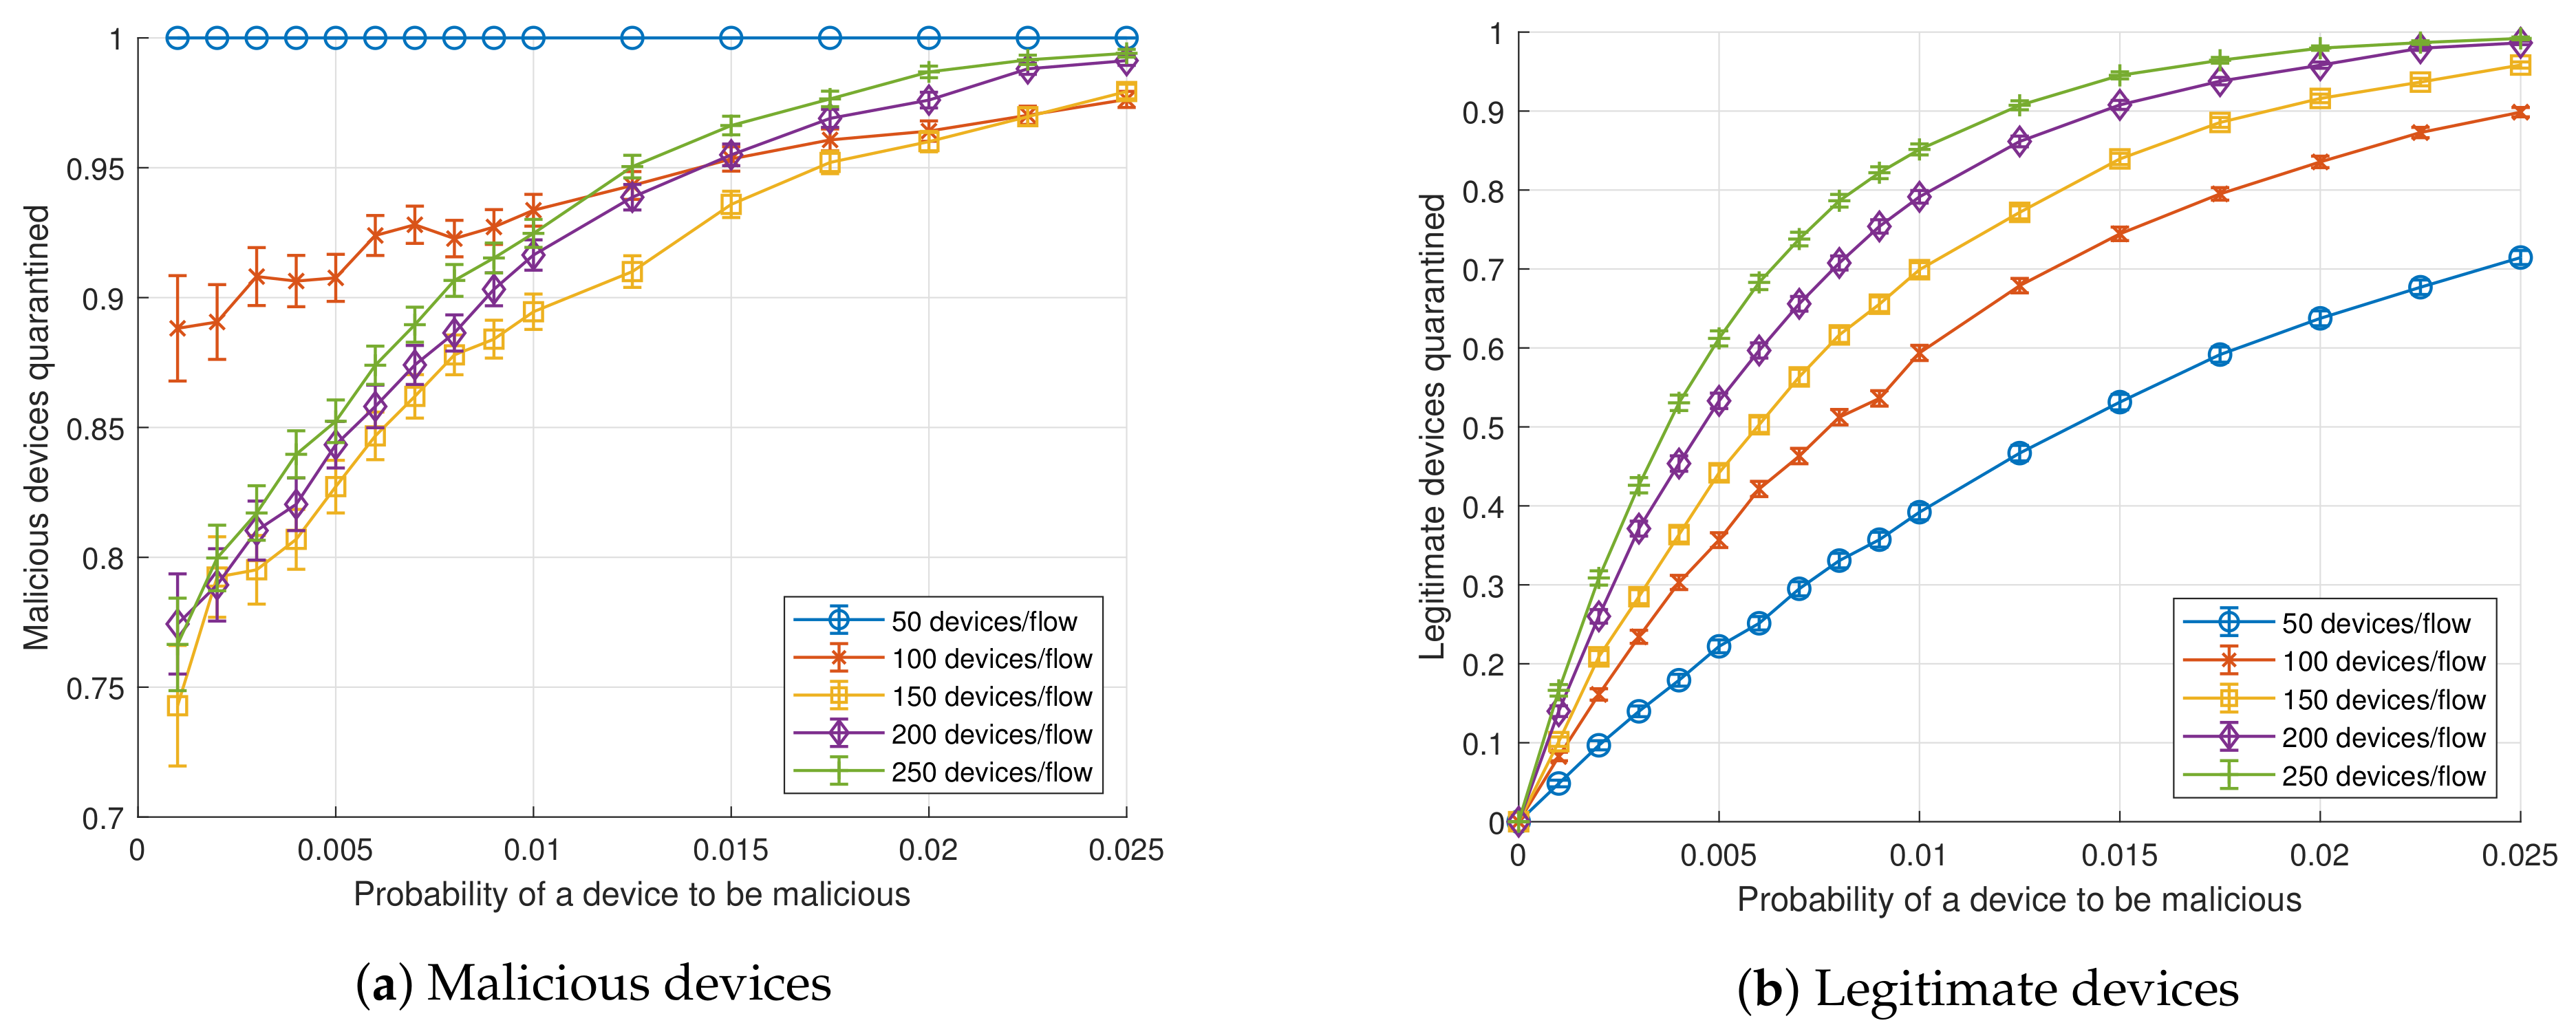
4.1. Detection
- n: Number of devices per flow.
- : Probability of a device to be malicious (independent of other devices).
- : Ratio between the transmission frequency of a malicious device and a legitimate device.
- : Ratio between the threshold throughput, from which flows are detected as suspicious, and the volume of throughput expected for the current scenario.
- : Probability of a device to be of type i (independent of other devices).
- : Data rate of type i legitimate devices.
- : Sampling period of the SDN application.
- : Transmission period of a type i legitimate device.
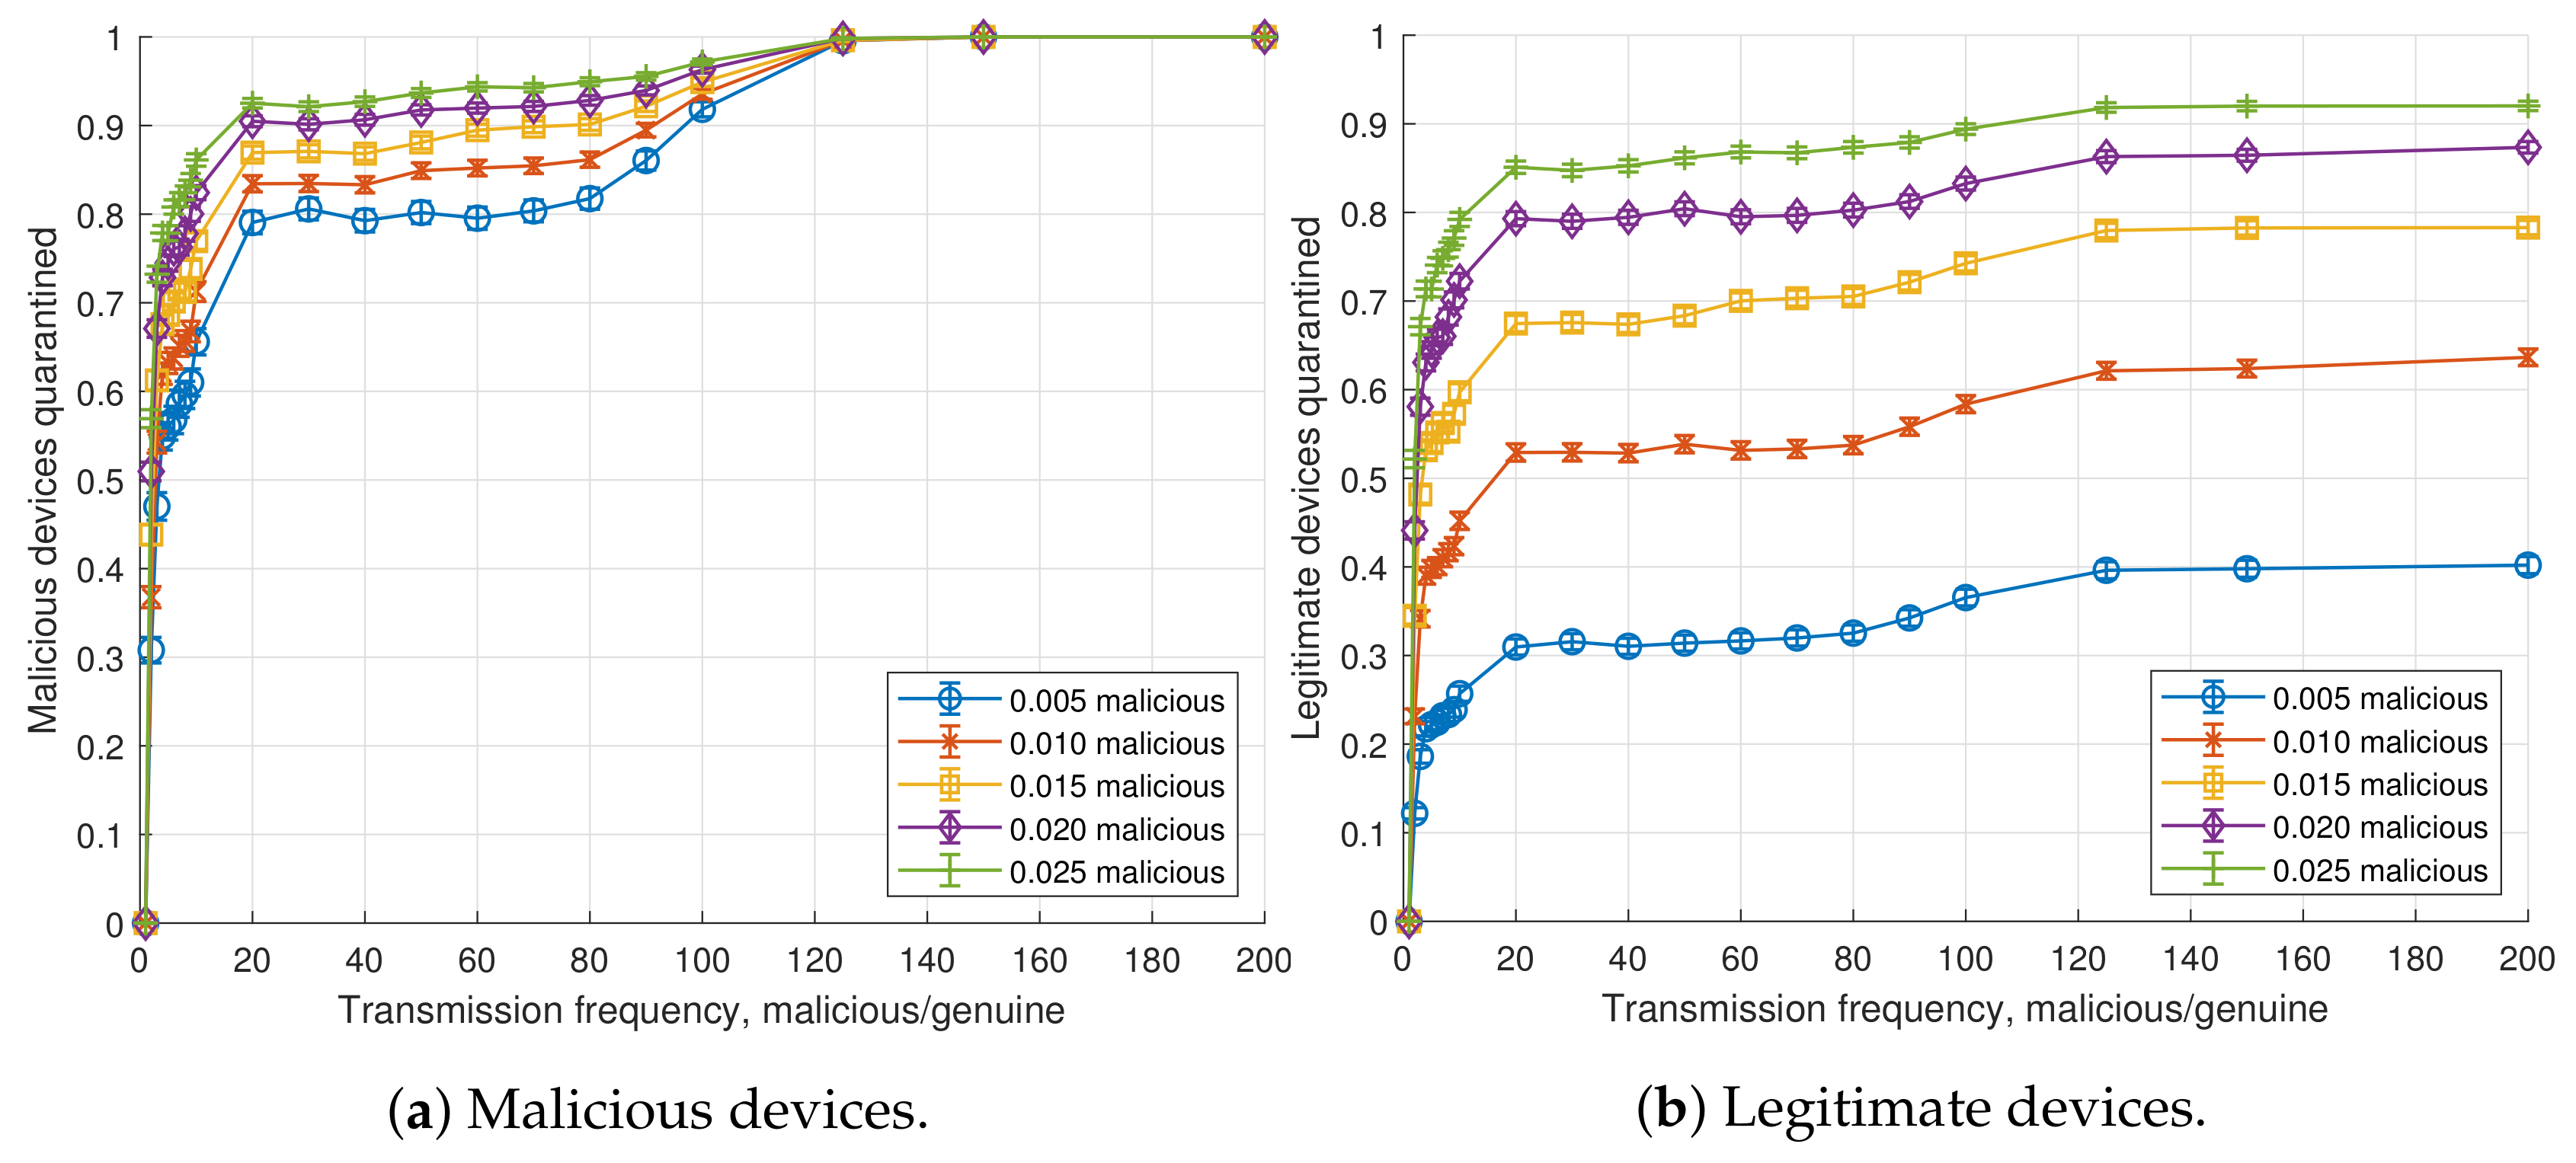
4.2. Dynamic Reassignment
- UE: Huawei E3372h-153 Long Term Evolution (LTE) modem connected to a laptop (Intel®Core™i7 4510U CPU @ 2.0 GHz).
- Radio Access Network: eNodeB software implementation provided by OpenAirInterface running on a commodity PC (Intel®Core™i7-6700 CPU @ 3.40GHz) connected through USB-3 to an Ettus USRP B210 SDR board.
- Core Network: The network slices of the Core Network were deployed as Docker containers on top of an Intel®Xeon®CPU E5-2603 v3 @ 1.60GHz.
- -
- IoT NS: Three Docker containers implementing the main Evolved Packet Core (EPC) entities using OpenAirInterface software, Home Subscriber Server (HSS), Mobility Management Entity (MME) and Serving/Packet Data Network (PDN) Gateway (S/P-GW).
- -
- Quarantine NS: One Docker container implementing an OpenAirInterface S/P-GW.
- SDN switch: Open vSwitch bridge with extended General Packet Radio Service (GPRS) Tunneling Protocol (GTP) encapsulating and decapsulating capabilities ( [43,44]) created on top of an Accelerated Processing Unit (APU) from PC engines(https://www.pcengines.ch/apu.htm).
- SDN controller: ONOS SDN controller deployed as a Docker container in an Intel®Xeon®CPU E5-2603 v3 @ 1.60GHz. The SDN applications for moving the devices/UEs were implemented on top of ONOS as described in [36]. These SDN applications allow for replicating the state of a S/P-GW into another one and diverting the traffic of specific users to the desired S/P-GW.
- Dynamic creation of the Quarantine NS: Deployment of the S/P-GW Docker container in the Core Network ().
- S/P-GW application initialization ().
- State replication of the UE context in the S/P-GW of the IoT NS to the S/P-GW in the Quarantine NS ().
- Data-plane reconfiguration of flow rules in the SDN switch for forwarding the traffic of the device/UE to the Quarantine NS ().
5. Conclusions
Author Contributions
Funding
Conflicts of Interest
Abbreviations
| 3GPP | 3rd Generation Partnership Project |
| APU | Accelerated Processing Unit |
| CN | Core Network |
| DDoS | Distributed Denial of Service |
| DPI | Deep Packet Inspection |
| eMBB | enhanced Mobile Broadband |
| EPC | Evolved Packet Core |
| GPRS | General Packet Radio Service |
| GTP | GPRS Tunneling Protocol |
| HSS | Home Subscriber Server |
| IoT | Internet of Things |
| LTE | Long Term Evolution |
| MEC | Multi-Access Edge Computing |
| MME | Mobility Management Entity |
| NFV | Network Function Virtualization |
| NS | Network Slice |
| ONOS | Open Network Operating System |
| PDN | Packet Data Network |
| QoS | Quality of Service |
| RAN | Radio Access Network |
| SDN | Software-Defined Networking |
| SLA | Service Level Agreement |
| S/P-GW | Serving/PDN Gateway |
| UE | User Equipment |
Appendix A. Analytical Model
Appendix A.1. Probability of a Flow with Malicious Devices to Be Detected in Specific Scenarios
- , , and .
- A: A flow is detected as malicious.
- B: A flow contains malicious devices.
- C: A flow contains some malicious device of type different than 0 (manufacturing cell).
- : A flow contains exactly i malicious devices of type 0 and no other malicious device.where denotes the complementary event of C and equality holds due to the law of total probability.where the first step holds due to Bayes’ theorem and the second step holds because since flows detected as malicious always contain malicious devices (i.e., flows without malicious devices are never detected as malicious).where the first step holds due to Bayes’ theorem and the second step holds because since flows detected as malicious always contain malicious devices (i.e., flows without malicious devices are never detected as malicious).where the first step holds because and thus (i.e., a flow which contains some malicious device of type different than 0 always contains malicious devices).where this holds from the fact that a throughput excess of always exceeds the threshold ratio for our input parameters of , , , , , , and .where the first step holds for the law of total probability and the second one holds because and 0 for .where notation refers to Iverson brackets (i.e., is 1 if expression is true and 0 otherwise).
Appendix A.2. Probability of a Flow with Malicious Devices to Be Correctly Detected (General Formula)
- A: A flow is detected as malicious.
- B: A flow contains malicious devices.
- : A flow generates x excess throughput due to malicious devices.where this holds for the law of total probability.where the first step holds due to Bayes’ theorem, the second step holds because since flows detected as malicious always contain malicious devices (i.e., flows without malicious devices are never detected as malicious).where notation refers to Iverson brackets.
References
- Gozalvez, J. New 3GPP Standard for IoT [Mobile Radio]. IEEE Veh. Technol. Mag. 2016, 11, 14–20. [Google Scholar] [CrossRef]
- Liyanage, M.; Ahmad, I.; Abro, A.B.; Gurtov, A.; Ylianttila, M. Comprehensive Guide to 5G Security; Wiley Online Library: Hoboken, NJ, USA, 2018. [Google Scholar] [CrossRef]
- Cisco. Annual Cybersecurity Report; White Paper; Cisco: San Jose, CA, USA, 2018. [Google Scholar]
- Khan, M.A.; Salah, K. IoT security: Review, blockchain solutions, and open challenges. Future Gener. Comput. Syst. 2018, 82, 395–411. [Google Scholar] [CrossRef]
- Benzekki, K.; El Fergougui, A.; Elbelrhiti Elalaoui, A. Software-defined networking (SDN): A survey. Secur. Commun. Netw. 2016, 9, 5803–5833. [Google Scholar] [CrossRef]
- Nunes, B.A.A.; Mendonca, M.; Nguyen, X.; Obraczka, K.; Turletti, T. A Survey of Software-Defined Networking: Past, Present, and Future of Programmable Networks. IEEE Commun. Surv. Tutor. 2014, 16, 1617–1634. [Google Scholar] [CrossRef] [Green Version]
- Kreutz, D.; Ramos, F.M.V.; Veríssimo, P.E.; Rothenberg, C.E.; Azodolmolky, S.; Uhlig, S. Software-Defined Networking: A Comprehensive Survey. Proc. IEEE 2015, 103, 14–76. [Google Scholar] [CrossRef] [Green Version]
- Mijumbi, R.; Serrat, J.; Gorricho, J.; Bouten, N.; De Turck, F.; Boutaba, R. Network Function Virtualization: State-of-the-Art and Research Challenges. IEEE Commun. Surv. Tutor. 2016, 18, 236–262. [Google Scholar] [CrossRef] [Green Version]
- Hawilo, H.; Shami, A.; Mirahmadi, M.; Asal, R. NFV: State of the art, challenges, and implementation in next generation mobile networks (vEPC). IEEE Netw. 2014, 28, 18–26. [Google Scholar] [CrossRef] [Green Version]
- Nguyen, V.; Brunstrom, A.; Grinnemo, K.; Taheri, J. SDN/NFV-Based Mobile Packet Core Network Architectures: A Survey. IEEE Commun. Surv. Tutor. 2017, 19, 1567–1602. [Google Scholar] [CrossRef] [Green Version]
- Taleb, T.; Mada, B.; Corici, M.; Nakao, A.; Flinck, H. PERMIT: Network Slicing for Personalized 5G Mobile Telecommunications. IEEE Commun. Mag. 2017, 55, 88–93. [Google Scholar] [CrossRef] [Green Version]
- Ordonez-Lucena, J.; Ameigeiras, P.; Lopez, D.; Ramos-Munoz, J.J.; Lorca, J.; Folgueira, J. Network Slicing for 5G with SDN/NFV: Concepts, Architectures, and Challenges. IEEE Commun. Mag. 2017, 55, 80–87. [Google Scholar] [CrossRef] [Green Version]
- Chatras, B.; Tsang Kwong, U.S.; Bihannic, N. NFV enabling network slicing for 5G. In Proceedings of the 2017 20th Conference on Innovations in Clouds, Internet and Networks (ICIN), Paris, France, 7–9 March 2017; pp. 219–225. [Google Scholar] [CrossRef]
- Katsalis, K.; Nikaein, N.; Schiller, E.; Ksentini, A.; Braun, T. Network Slices toward 5G Communications: Slicing the LTE Network. IEEE Commun. Mag. 2017, 55, 146–154. [Google Scholar] [CrossRef] [Green Version]
- Sama, M.R.; An, X.; Wei, Q.; Beker, S. Reshaping the mobile core network via function decomposition and network slicing for the 5G Era. In Proceedings of the 2016 IEEE Wireless Communications and Networking Conference, Doha, Qatar, 3–6 April 2016; pp. 1–7. [Google Scholar] [CrossRef]
- Singh, J.; Behal, S. Detection and mitigation of DDoS attacks in SDN: A comprehensive review, research challenges and future directions. Comput. Sci. Rev. 2020, 37, 100279. [Google Scholar] [CrossRef]
- Ahmad, I.; Kumar, T.; Liyanage, M.; Okwuibe, J.; Ylianttila, M.; Gurtov, A. Overview of 5G Security Challenges and Solutions. IEEE Commun. Stand. Mag. 2018, 2, 36–43. [Google Scholar] [CrossRef] [Green Version]
- Serrano Mamolar, A.; Salvá-García, P.; Chirivella-Perez, E.; Pervez, Z.; Alcaraz Calero, J.M.; Wang, Q. Autonomic protection of multi-tenant 5G mobile networks against UDP flooding DDoS attacks. J. Netw. Comput. Appl. 2019, 145, 102416. [Google Scholar] [CrossRef]
- Wang, B.; Zheng, Y.; Lou, W.; Hou, Y.T. DDoS attack protection in the era of cloud computing and Software-Defined Networking. Comput. Netw. 2015, 81, 308–319. [Google Scholar] [CrossRef]
- Sotelo Monge, M.A.; Herranz González, A.; Lorenzo Fernández, B.; Maestre Vidal, D.; Rius García, G.; Maestre Vidal, J. Traffic-flow analysis for source-side DDoS recognition on 5G environments. J. Netw. Comput. Appl. 2019, 136, 114–131. [Google Scholar] [CrossRef]
- Kalkan, K.; Altay, L.; Gür, G.; Alagöz, F. JESS: Joint Entropy-Based DDoS Defense Scheme in SDN. IEEE J. Sel. Areas Commun. 2018, 36, 2358–2372. [Google Scholar] [CrossRef]
- Bhardwaj, K.; Miranda, J.C.; Gavrilovska, A. Towards IoT-DDoS Prevention Using Edge Computing. In USENIX Workshop on Hot Topics in Edge Computing (HotEdge 18); USENIX Association: Boston, MA, USA, 2018. [Google Scholar]
- Bonfim, M.; Santos, M.; Dias, K.; Fernandes, S. A real-time attack defense framework for 5G network slicing. Softw. Pract. Exp. 2020, 50, 1228–1257. [Google Scholar] [CrossRef]
- Geller, M.; Nair, P. 5G Security Innovation with Cisco; White Paper; Cisco: San Jose, CA, USA, 2018. [Google Scholar]
- Thantharate, A.; Paropkari, R.; Walunj, V.; Beard, C.; Kankariya, P. Secure5G: A Deep Learning Framework Towards a Secure Network Slicing in 5G and Beyond. In Proceedings of the 2020 10th Annual Computing and Communication Workshop and Conference (CCWC), Las Vegas, NV, USA, 6–8 January 2020; pp. 852–857. [Google Scholar] [CrossRef]
- Bagaa, M.; Boukhalfa, M.; Rivera, D.; Marín Pérez, R.; Bernal, J.; Molina, A.; Belabed, D.; Mady, A.; Vuppala, S.; Mehta, D.; et al. ANASTACIA Project. D6.5 Final Use Cases Implementation and Tests; Technical Report; ANASTACIA Consortium 2020: Brussels, Belgium, 2019. [Google Scholar]
- Haugen, T.; Hassan, A.A.; Menezes, P.F. Device Quarantine in a Wireless Network. U.S. Patent 2020/0037163 A1, 30 January 2020. [Google Scholar]
- Osseiran, A.; Boccardi, F.; Braun, V.; Kusume, K.; Marsch, P.; Maternia, M.; Queseth, O.; Schellmann, M.; Schotten, H.; Taoka, H.; et al. Scenarios for 5G Mobile and Wireless Communications: The Vision of the METIS Project. IEEE Commun. Mag. 2014, 52, 26–35. [Google Scholar] [CrossRef]
- Rifai, M.; Huin, N.; Caillouet, C.; Giroire, F.; Lopez-Pacheco, D.; Moulierac, J.; Urvoy-Keller, G. Too many SDN rules? Compress them with MINNIE. In Proceedings of the 2015 IEEE Global Communications Conference (GLOBECOM), San Diego, CA, USA, 6–10 December 2015; pp. 1–7. [Google Scholar] [CrossRef]
- Schulz, P.; Matthe, M.; Klessig, H.; Simsek, M.; Fettweis, G.; Ansari, J.; Ashraf, S.A.; Almeroth, B.; Voigt, J.; Riedel, I.; et al. Latency Critical IoT Applications in 5G: Perspective on the Design of Radio Interface and Network Architecture. IEEE Commun. Mag. 2017, 55, 70–78. [Google Scholar] [CrossRef]
- Metzger, F.; Hoßfeld, T.; Bauer, A.; Kounev, S.; Heegaard, P.E. Modeling of Aggregated IoT Traffic and Its Application to an IoT Cloud. Proc. IEEE 2019, 107, 679–694. [Google Scholar] [CrossRef] [Green Version]
- Apthorpe, N.; Reisman, D.; Sundaresan, S.; Narayanan, A.; Feamster, N. Spying on the smart home: Privacy attacks and defenses on encrypted iot traffic. arXiv 2017, arXiv:1708.05044. [Google Scholar]
- Tang, F.; Mao, B.; Fadlullah, Z.M.; Kato, N. On a Novel Deep-Learning-Based Intelligent Partially Overlapping Channel Assignment in SDN-IoT. IEEE Commun. Mag. 2018, 56, 80–86. [Google Scholar] [CrossRef]
- Doshi, R.; Apthorpe, N.; Feamster, N. Machine Learning DDoS Detection for Consumer Internet of Things Devices. In Proceedings of the 2018 IEEE Security and Privacy Workshops (SPW), San Francisco, CA, USA, 24 May 2018; pp. 29–35. [Google Scholar] [CrossRef] [Green Version]
- Van der Elzen, I.; van Heugten, J. Techniques for Detecting Compromised IoT Devices; University of Amsterdam: Amsterdam, The Netherlands, 2017. [Google Scholar]
- Fondo-Ferreiro, P.; Gil-Castiñeira, F.; González-Castaño, F.J.; Candal-Ventureira, D. A Software-Defined Networking Solution for Transparent Session and Service Continuity in Dynamic Multi-Access Edge Computing. arXiv 2009, arXiv:2009.01716. Available online: https://arxiv.org/abs/2009.01716 (accessed on 4 September 2020).
- Tahaei, H.; Afifi, F.; Asemi, A.; Zaki, F.; Anuar, N.B. The rise of traffic classification in IoT networks: A survey. J. Netw. Comput. Appl. 2020, 154, 102538. [Google Scholar] [CrossRef]
- Candal-Ventureira, D. IoT DDoS Detection with SDN Simulator. Available online: https://dcandal-gti.github.io/IoT-DDoS-detection-with-SDN-simulator (accessed on 2 September 2020).
- Nguyen-An, H.; Silverston, T.; Yamazaki, T.; Miyoshi, T. Generating IoT traffic: A Case Study on Anomaly Detection. In Proceedings of the 2020 IEEE International Symposium on Local and Metropolitan Area Networks (LANMAN), Orlando, FL, USA, 13–15 July 2020; pp. 1–6. [Google Scholar] [CrossRef]
- Nikaein, N.; Knopp, R.; Kaltenberger, F.; Gauthier, L.; Bonnet, C.; Nussbaum, D.; Ghaddab, R. OpenAirInterface: An open LTE network in a PC. In Proceedings of the 20th Annual International Conference on Mobile Computing and Networking, Maui, HI, USA, 7–11 September 2014; pp. 305–308. [Google Scholar] [CrossRef]
- Open vSwitch. Available online: https://www.openvswitch.org/ (accessed on 2 September 2020).
- ONOS—A New Carrier-Grade SDN Network Operating System Designed for High Availability, Performance, Scale-out. Available online: https://onosproject.org/ (accessed on 2 September 2020).
- Ouyang, J. Flow Based GTP Tunneling: Datapath. Available online: https://patchwork.ozlabs.org/patch/787468/ (accessed on 2 September 2020).
- Ouyang, J. Flow Based GTP Tunneling: Userspace. Available online: https://patchwork.ozlabs.org/patch/787467/ (accessed on 2 September 2020).
- Khalili, R.; Despotovic, Z.; Hecker, A. Flow setup latency in SDN networks. IEEE J. Sel. Areas Commun. 2018, 36, 2631–2639. [Google Scholar] [CrossRef]


| Use Case | Latency (ms) | Reliability (PLR) | Transmission Frequency (ms) | Frame Data Size (bytes) | Device Density (Devices/m3) | Communication Range (m) | Mobility (km/h) |
|---|---|---|---|---|---|---|---|
| Manufacturing cell | 5 | 109 | 50 | 15 | 0.33 to 3 | 50 to 100 | <30 |
| Machine tools | 0.25 | 109 | 0.5 | 50 | 0.33 to 3 | 50 to 100 | <30 |
| Printing machines | 1 | 109 | 2 | 30 | 0.33 to 3 | 50 to 100 | <30 |
| Packaging machines | 25 | 109 | 5 | 15 | 0.33 to 3 | 50 to 100 | <30 |
| Malicious Devices (%) | Expected Number of Malicious Flows (%) |
|---|---|
| 0.5 | 39.4 |
| 1.0 | 63.4 |
| 1.5 | 77.9 |
| 2.0 | 86.7 |
| 2.5 | 92.0 |
| Mean | Median | Minimum | Maximum | 95-th Percentile | |
|---|---|---|---|---|---|
| Δ | 989.69 | 992.20 | 918.32 | 1057.86 | 1027.05 |
| Δ1 (ms) | 570.11 | 571.48 | 505.27 | 630.98 | 606.04 |
| Δ2 (ms) | 381.68 | 381.46 | 361.89 | 397.13 | 392.32 |
| Δ3 (ms) | 33.92 | 33.71 | 32.91 | 37.67 | 35.38 |
| Δ4 (ms) | 3.98 | 3.84 | 0.61 | 9.98 | 6.03 |
© 2020 by the authors. Licensee MDPI, Basel, Switzerland. This article is an open access article distributed under the terms and conditions of the Creative Commons Attribution (CC BY) license (http://creativecommons.org/licenses/by/4.0/).
Share and Cite
Candal-Ventureira, D.; Fondo-Ferreiro, P.; Gil-Castiñeira, F.; González-Castaño, F.J. Quarantining Malicious IoT Devices in Intelligent Sliced Mobile Networks. Sensors 2020, 20, 5054. https://doi.org/10.3390/s20185054
Candal-Ventureira D, Fondo-Ferreiro P, Gil-Castiñeira F, González-Castaño FJ. Quarantining Malicious IoT Devices in Intelligent Sliced Mobile Networks. Sensors. 2020; 20(18):5054. https://doi.org/10.3390/s20185054
Chicago/Turabian StyleCandal-Ventureira, David, Pablo Fondo-Ferreiro, Felipe Gil-Castiñeira, and Francisco Javier González-Castaño. 2020. "Quarantining Malicious IoT Devices in Intelligent Sliced Mobile Networks" Sensors 20, no. 18: 5054. https://doi.org/10.3390/s20185054