1. Introduction
Multiple bio-signals can be detected using different sensing modalities during the contraction of a skeletal muscle (
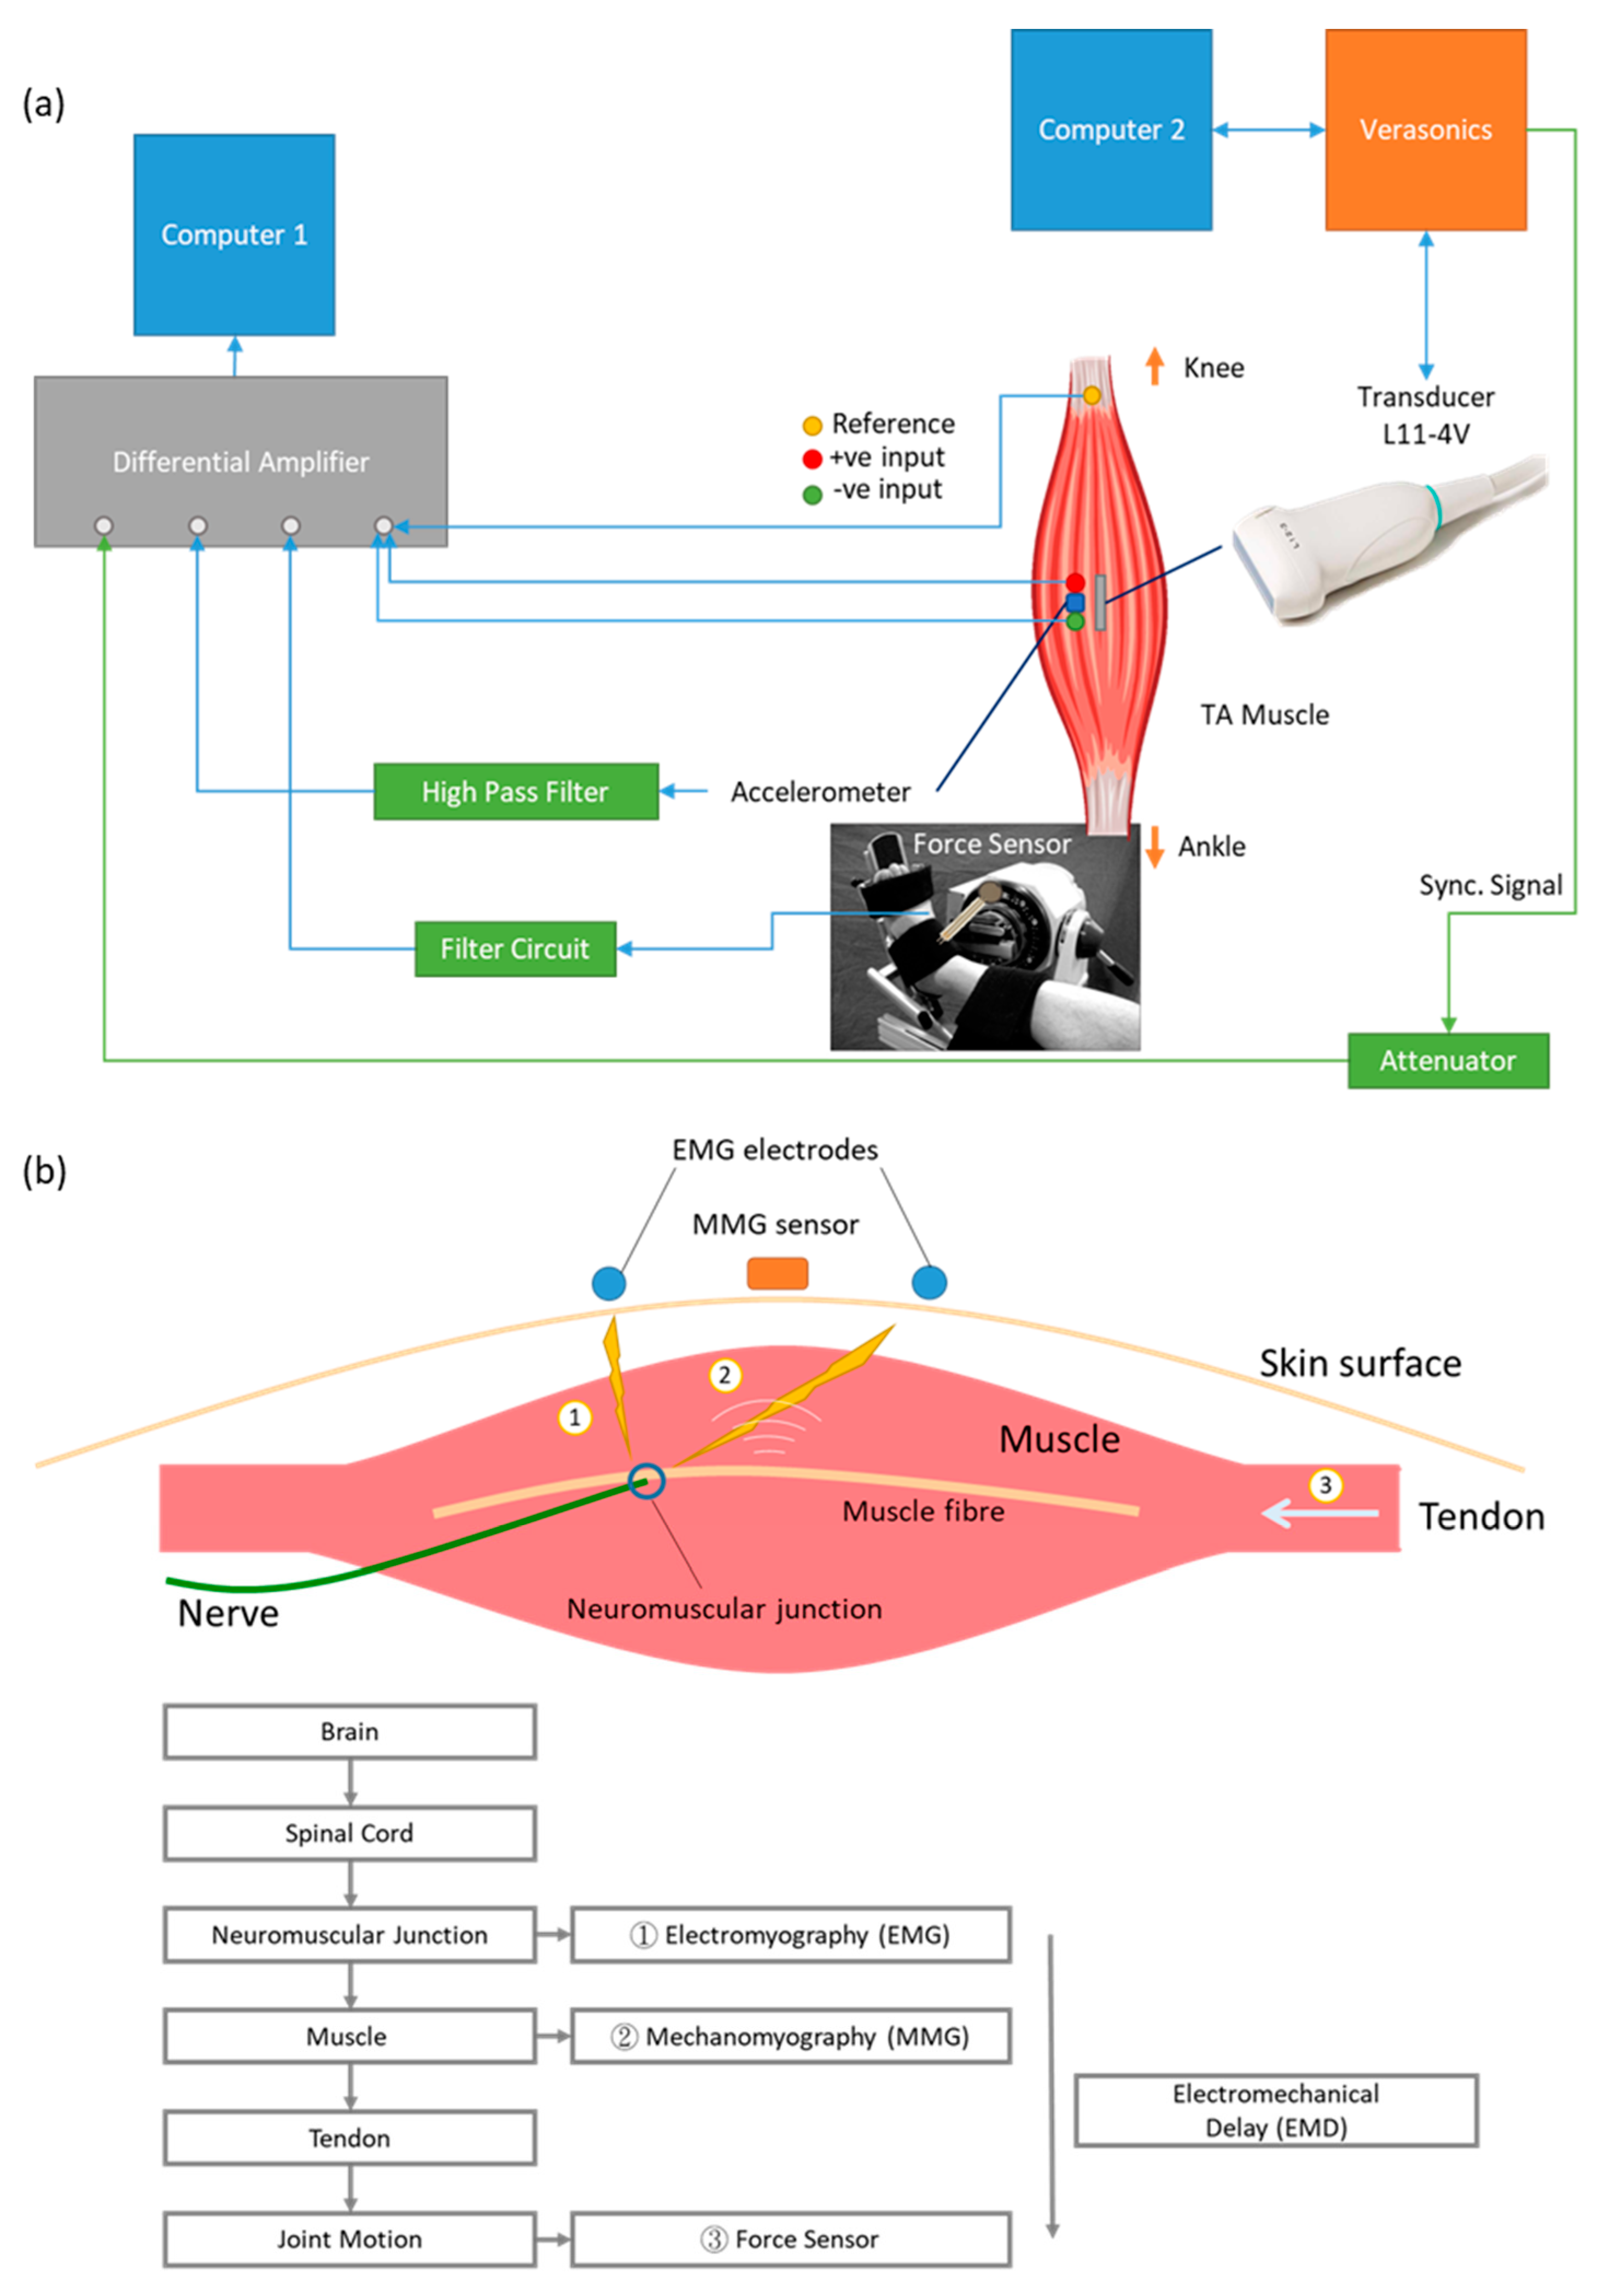
Figure 1a). From the initial idea generated in the brain neurologically to the exertion of muscle force biomechanically, the generation of human motion involves a sequence of events. When action potential passes through the motor neurons and reaches the neuromuscular junction, electrical activities can be detected using either surface or needle electromyography (EMG). When muscle fibers start to contract and the resulting vibration propagates to the skin surface, these tiny vibrations can be detected by surface mechanomyography (MMG). Muscle fiber motion then pulls tendons to generate joint motion and force which can be measured by load cell, pressure sensor and force sensor [
1,
2,
3]. Although arrays of EMG and MMG were developed for two-dimensional measurements in previous studies [
4,
5], they were unfortunately limited only to those bio-signals that could propagate to the skin surface. It has been, however, difficult to show the spatial variation within the muscle with existing technologies and testing protocols.
The elapsed time between onset of the EMG signal and force output is defined as electromechanical delay (EMD) [
2]. EMD has been used as an indicator for tracking the normal electrophysiological events and also as a reliable variable indicator for some pathologies such as spastic cerebral palsy [
6] and ligament laxity [
7]. However, depending on methodological design, the EMD has been shown to have huge inter-individual temporal variations ranging from 45 to 120 ms [
1]. Many attributions can be put forward to reduce this variation, including adipose tissue thickness [
8], skin fold thickness affecting MMG response [
9], location of the sensors [
9] and muscle stiffness [
3]. To match the tissue motion onset from inside the muscle together with the onset of the signals collecting from outside the muscle on the skin surface, efforts have been made by adopting ultrafast ultrasonography [
2,
3].
Ultrasound imaging is acquired based on the reflection of sound waves in tissues and can be used for monitoring muscle architectural change during contraction in real time using a technique called sonomyography (SMG) [
10,
11]. SMG uses an ultrasound frame rate of around 30 frame/s and is thus not able to capture the fast changes inside the muscle, such as muscle motion onset. As muscle structure changes during contraction, the intensity of the reflected sound wave also changes, which can be detected by ultrafast ultrasound imaging, with frame rates larger than 1000 frame/s. This is how the onset of muscle spatial motion can be observed in the image by detecting the intensity change in the ultrasound image. Ultrasound imaging technologies have been used to study skeletal muscle contraction characteristics [
12], neuromuscular disorders and biomechanical material properties [
13].
In terms of onset timing, Vasseljen et al. (2006) showed that the muscle onset detected by ultrasound had a delay and was generally after that of EMG in the back muscle of lumbar multifidus during contraction [
14]. Meanwhile, a later study by the same group reported that the onset difference between intramuscular EMG and concurrent M-mode ultrasound in abdominal muscles varied. Specifically, the EMG onset was detected before the ultrasound onset in obliquus externus abdominis, but such a pattern was found to be reversed in transversus abdominis and obliquus internus abdominis [
15]. This group suggested correcting for such muscle-dependent onset time difference, which was assumed to be a measurement artifact [
15]. However, EMG measures the electrical event, while ultrasound imaging detects the mechanical event of muscle contraction. It is reasonable for the onset time measured by these two different methods to be different from each other. Meanwhile, other studies showed consistent delay from EMG to ultrasound onset and suggested that this time delay could be used for functional assessment of muscle [
2,
3]. Such inconsistency of muscle onset measured by different sensing modalities in the existing literature implies that this topic requires further study.
In terms of spatial variation, Hug et al. (2011) showed that there was no significant difference between the muscle fascicle motion and the myotendinous junction motion in repeatedly stimulated bicep contraction [
16]. However, the recording of images at the muscle and at the tendon was not synchronous in this study, which may have given rise to uncertainties in the results. Dieterich et al. (2017) showed dependence of onset time with regard to the depth within the muscle upon visual analysis [
17]. However, this study did not quantify the result with reference to the muscle structure. Deffieux et al. (2006) demonstrated the detection of axial tissue displacement and velocity in biceps under stimulated contraction using ultrafast ultrasound imaging at 5000 frames per second (fps) [
18] but without the detection of muscle movement concerning both depth and width of a muscle region.
Recent muscle onset-related research mainly focused on onset determination algorithms [
19,
20,
21] and application of the techniques in patients [
22] or in athletes [
23]. This research concerns mostly EMG recordings.
The two-dimensional (2D) spatial variation of muscle fiber onset remains a gap in our knowledge. As the action potential (electro-chemical event) propagates through the muscle fibers, it is expected that the propagation time along this direction generates a mechanical wave with a certain time delay. While the action potential travels away from the innervation zone, where a nerve enters the muscle itself, it is expected to observe a timely changing onset of the generated mechanical wave upon proceeding the action potential. Hence, depicting the onset of the propagating wave (tissue velocity—mechanical event) from more than one location within a muscle in accordance with conduction velocity (electro-chemical event) from electromyography (EMG) has not been investigated so far and merits further study.
This paper introduces a newly developed system for simultaneous recording of surface EMG, MMG, force and ultrafast ultrasound imaging and reports the findings of the time delays between onset of electro-chemical event and mechanical events in relation to force output, while using external sensors including surface EMG, MMG and force in combination with ultrafast ultrasound signals detected from inside the muscle, during step-by-step increases in muscle activity. This study adopts a new method of onset detection for ultrafast ultrasound muscle imaging and identifies the pattern of 2D muscle onset observed in ultrafast ultrasound imaging with reference to anatomical musculoskeletal structure changes. We hereby define the new term sonomechanomyography (SMMG), i.e., sono-mechano-myo-graphy, as using ultrafast ultrasound to depict the mechanical vibration generated in muscle motion.
2. Materials and Methods
The first part of this study investigated how muscle onset measured from EMG, MMG, force and ultrafast ultrasound differed at different strengths of voluntary contractions. To observe the spatial variation of muscle onset measured by ultrafast ultrasound imaging, the second part of this study focused on the muscle motion onset measured in longitudinal and transverse views of the muscle. The findings are reported separately in this paper.
2.1. Subjects
A convenience sampling approach was adopted to recruit 14 healthy subjects aged between 18 and 35 years. Subjects were required not to have undergone any surgical intervention on their right tibialis anterior and the related bones, namely tibia, cuneiform and metatarsal. They were required not to have history of any metabolic, neurologic or orthopedic disease or sequel preserved at the time of investigation. All participants were asked to sign a written informed consent document before the experiment. While subjects demonstrating occasional sports engagement or sedentary lifestyles were included, professional sports players were excluded from this study. Human ethics approval was obtained from the Human Subjects Ethics Sub-Committee (HSESC) of the Hong Kong Polytechnic University (HSESC Reference Number: HSEARS20170716001).
In the first part of the study, the data from 7 (out of 10) subjects (3M + 4F, aged 25.9 ± 1.8 years, height of 171 ± 12 cm, and weight of 68.7 ± 12.1 kg) with a total of 72 trials were available for muscle onset analysis. In the second part of study, the data from 8 (out of 10) subjects (5M + 3F, aged 25.6 ± 1.7 years, height of 172 ± 11 cm, and weight of 66.2 ± 14.0 kg) with a total of 20 trials (11 in transverse view and 9 in longitudinal view) were available for muscle onset analysis.
2.2. System Setup
Figure 1b shows the system diagram of the setup for simultaneous measurement of EMG, MMG, force and ultrafast ultrasound. The system consisted of two computers for control and data acquisition. For the ultrasound imaging machine, the Vantage 128 (Verasonics, Kirkland, WA, USA) was used with the probe L11-4v. The frame rate was set at 20 kHz with an imaging depth of 3.5 cm. A total of 14,000 frames were recorded in each trial. An 8-channel differential amplifier (RM6280, Cheng Yi, China) with a gain of 2000 was used to collect EMG, and the MMG and force data were collected using the same system. The sampling frequency was set to 20 kHz to match the sampling frequency of the ultrasound system. The arbitrary function generator (AFG3021, Tektronix, Beaverton, OR, USA) received an external trigger from the Verasonics and gave a single pulse output as synchronization signal to the differential amplifier. A three-axis accelerometer module (GY-61 DXL335, Analog Devices, Norwood, MA, USA) was used as sensor for surface MMG. Only the motion perpendicular to skin surface was recorded. Button electrodes (Sichiray, China) were used to collect EMG signals from skin. The electrodes on the proximal and distal sides of the accelerometer were connected to the positive and negative inputs of the differential amplifier, respectively. The reference electrode was put on the head of fibula. A force sensor (FlexiForce A201, Tekscan, South Boston, MA, USA) was used to measure the force exerted by the subject’s isometric contraction of TA muscle.
2.3. Experimental Procedure
In the first experiment (Experiment 1), the subject was first asked to sit onto a dynamometer chair (Humac/Norm Testing and Rehabilitation System, Computer Sports Medicine, Inc., Stoughton, MA, USA). After adjustment of the chair, subject was asked to perform a few TA isometric contractions such that the boundaries of the muscle could be marked on the skin. Measurement of muscle length and leg circumference was conducted before placement of EMG, MMG and ultrasound probes. The subject was instructed to perform contraction a few times to check that all signals could be properly recorded. In order to normalize the EMG values, it was necessary to determine the EMG at the maximum voluntary contraction (MVC) level as a reference value. The subjects were asked to perform contraction at their maximum force for three times. The arithmetic mean of the amplitude of the highest signal portion with 3000 ms fixed duration was defined as MVC level. After a rest of around 5 min, the subject performed contraction of 10%, 20%, 30%, 40% and 50% MVC in a randomized sequence when they heard an audio cue (a click sound). Each MVC level contained three trials for each subject. Visual feedback of the force generated during each contraction was provided in real time to guide the subject to reach the required contraction level. There was a resting time of 5 min between each trial. The subject was detached from the dynamometer chair after completion of the 15 trials, when the data collection was complete.
For the second experiment (Experiment 2), a similar protocol was followed and conducted on subjects, but with ultrafast ultrasound imaging recording only. Subjects were asked to contract at their maximum force. Ultrasound images were taken at longitudinal view (where depth of image is the anterior–posterior position and width of image is proximal–distal position) and transverse view (where depth of image is the anterior–posterior position and width of image is medial–lateral position) for 2 trials each.
2.4. Data Analysis for Experiment 1
The MATLAB program (MATLAB 2016a, The MathWorks, Inc., Natick, MA, USA) was used for image reconstruction using algorithms provided by the Verasonics. After image reconstruction, 1000 Hz low pass filter was applied to the time-varying B-mode intensity signal at each pixel (
Figure 2). For each trial, an initial period of resting state was selected as baseline. The standard deviation of the period was calculated. The onset time was determined as the time point at which the signal first rose above or fell below five times the standard deviation (SD) from the baseline value. The threshold of 5SD was determined from a pilot study, and it worked best when compared to the SD of less than five times during the pilot study. Trials with baseline drift were excluded. For each trial, the mean onset at the central 1 cm × 1 cm of the recorded image was calculated as the representative onset time.
A band-pass filter of 50 Hz to 4000 Hz was applied to both the EMG and MMG signals. The standard deviations of the signals at baseline were calculated. The first time point when the signal went above or below five times the standard deviation was considered as the onset time of that signal. A low-pass filter of 1000 Hz was applied to the force signal. The first time point when the signal went above five times the standard deviation was considered as the onset time of force signal. The time point at which a falling edge was detected in synchronization signal was regarded as the time for Verasonics to start recording. An example of onset detection of the above signals is shown in
Figure 2.
Trials with onset of EMG which was found before the synchronization signal (i.e., subject contracted before hearing the audio cue) were excluded from analysis. For a valid subject test, at least 10 valid trials were required in total and more than 1 trial at each MVC level. Otherwise, they would be further excluded from the analysis. Averaged onset time in each physiological measurement for each MVC level was calculated for each subject.
Statistical analysis was done using SPSS Statistics (SPSS Statistics 25, IBM, New York, NY, USA). Two-way analysis of variance (ANOVA) was performed to compare the onset time between different physiological measurements and MVC levels. Further analysis was conducted to quantify the differences between different positions within the imaged area. The imaged area was separated into 25 regions of interest (ROI) in 5-by-5 grids of equal area. The mean onset time for each ROI in each trial was calculated. The mean for each MVC level of each subject was then calculated by averaging the 25 ROIs. Three-way ANOVA was performed to determine the variation of onset time with respect to the MVC level and the location within muscle.
2.5. Data Analysis for Experiment 2
The ultrasound image processing was similar to that in Experiment 1, except that the 1000 Hz low-pass filter was changed to a 50–1000 Hz band-pass filter. The area of tibia and skin in the transverse view were manually removed from data analysis. The ultrasound images and the onset maps (25 ROIs) were then averaged. The variation in onset time along and perpendicular to the middle aponeurosis was then computed. To study the significance of the trend, independent t-test was performed to compare the onset time at each consecutive 5 mm distance.
4. Discussion
This study developed a new system for simultaneous and synchronized recording of surface EMG, MMG, force and ultrafast ultrasound imaging (SMMG); we applied this system to identify the sequential time delays between onset of electro-chemical event (detected by EMG) and mechanical events in relation to force output (detected by MMG and force sensor) and further integrated the ultrafast ultrasound imaging to detect the signal depicted from inside the muscle during step-by-step increases in muscle activity. Several interesting findings related to the onset were observed in this study.
4.1. Feasibility of Using Ultrafast Ultrasound Imaging to Map the Onset Inside Muscle
This study has demonstrated the feasibility of using ultrafast ultrasound imaging to study the onset mapping inside the muscle, which is so far the first study looking into this issue to the best of our knowledge. We defined this new signal about muscle motion as sonomechanomyography (SMMG). With reference to the anatomical musculoskeletal structures, this study observed the pattern of 2D muscle onset from the ultrafast ultrasound image during TA muscle contraction in static position. Specifically, it appears that muscle motion started earlier at the middle aponeurosis and then spread out towards the skin surface and deeper regions in the longitudinal plane. It was also observed that the earliest motion was found at around 4 mm superficially from the aponeurosis in transverse plane. Meanwhile, not much variation in the proximal–distal direction was identified. While some interesting muscle contraction patterns were identified in this study, it is still necessary to refine the method for onset detection for a more accurate measurement and wide applications in the future.
4.2. Onset Time of Physiological Measurements and MVCs
This study detected a mean EMD of 73 ms, which is around half of that measured by Ubeda et al. at 10% MVC in the same muscle [
24]. This difference could be partly caused by the difference in positioning of the electrode, which can lead to 40–60 ms of error in EMD [
25]. Hence, the results obtained in this study can be considered to match those described in previous reports.
Unlike a previous study which observed that, for MVC levels lower than 10%, the EMD was longer when the MVC level was lower [
24], the current study did not observe such an effect. It still remains unknown whether, at lower levels of MVCs, the ultrasound-detected onset would be dependent on MVC levels. Future studies are needed to look into this area for further clarification.
4.3. Accuracy and Reliability of Simultaneous Onset Measurement
The accuracy of onset detection method used for ultrafast ultrasound is subject to the effects of white noise. The amplitude of white noise is almost constant across the field of view in this study. Hence, the signal to noise ratio increased with the ultrasound intensity of each pixel. In other words, white noise tended to delay the onset detected for points with lower intensity. Indeed, we observed earlier onset in many but not all brighter areas. Since the noise in ultrasound image increases with depth, the onset detection in deep muscle is also less sensitive. Alternative onset detection methods such as Teager–Kaiser Energy Operator (TKEO) or Bayesian change point analysis may provide higher accuracy; however, the computation power and time required would be much higher [
20]. Determining an appropriate onset detection method is a very important research topic for future study.
4.4. Insights for Future Ultrafast Ultrasound Onset Measurement
The presence of blood vessels in the field of view would give rise to periodic motions in the area around the vessels in ultrasound images. The motion would be shown as a baseline drift in the ultrasound intensity and affects the onset detection. Applying a high-pass filter could remove the baseline drift, but it would also induce unwanted artificial signal near the start of motion, making the detected onset earlier than the real onset. This problem is yet to be solved.
Since the sizes of human muscles are in general too large when compared to the ultrasound probe, muscle contraction could not be observed with the whole muscle in the field of view due to technological limitations. In addition to further advancing the technologies of ultrasound imaging modalities, this could also be addressed by conducting animal experiments in the future. One of the planned experiments involves recording rats’ gastrocnemius contraction during cortical electrical stimulation, of which the ultrasound recorded muscle motion can be compared with the EMG onset measured though intramuscular electrodes.
The current experimental setting cannot guarantee that the subjects contracted their TA before other muscle contractions. In some trials where the transverse view of muscle was imaged, the subjects contracted their extensor digitorum longus (the muscle lateral to TA) first in performing the requested motion. The motion of other muscles before TA would cause passive motion of TA, represented by a baseline drift in the data. The active and passive motion cannot be separated in this method at this moment.
Upon optimizing the experimental setup, the patterns of muscle onset in patients with muscle disorders are yet to be studied. Granata et al. showed that EMD in patients with spastic cerebral palsy is shorter than that in normal subjects in reflex response [
6]. The amplitude of EMG signal normalized to MVC level is also higher in the patient group. It is expected that the pattern of onset time observed in ultrafast ultrasound would also be different in these patients. Ultrafast ultrasound provides a new way of studying how neuromuscular diseases affect muscle motions. Studying how these onset patterns differ in different neuromuscular diseases may offer new insights into the diseases and ways to improve patients’ motion.


