1. Introduction
The core engine system is composed of multi-stage rotors. The superposition of residual stress and assembly stress makes the distribution of stress fields at different positions and depths of the rotor components more complicated. The assembly quality of rotors at all levels has a great impact on the performance of aero-engines [
1,
2,
3]. The unevenly distributed stress field will have a significant impact on the fatigue strength and structural deformation of the rotor, which will lead to the coaxiality error of the assembled rotor exceeding the standard. In the case of high-speed rotation, the imbalance response caused by the coaxiality error will be amplified, resulting in engine vibration and causing friction between the blade and the casing [
4]. According to statistics, more than 70% of aero-engine faults are caused by vibrations and about 20% of aero-engine faults are caused by friction [
5,
6]. Therefore, it is necessary to realize the precise control of stress at different depths in the rotor end face through accurate measurements [
7,
8,
9] and then improve the uniformity of the stress field distribution to reduce the coaxiality error of the assembled rotor, so as to improve the safety and reliability of the aero-engine.
The measurement of stress includes three kinds of methods: non-destructive, micro-damage, and damage [
10,
11,
12,
13,
14]. Both damage and micro-damage measurement methods can cause damage to the measured part and these damages are fatal to the finished parts or the workpieces in service. Therefore, the damage and micro-damage methods cannot effectively reflect the stress state of the measured parts. Moreover, they cannot measure or monitor the stress in a service state in real time. The non-destructive measurement method gives information on the magnitude, direction, and position of stress without damaging or affecting the performance of the measured part. Among the non-destructive measurement methods, the ultrasonic method has many advantages such as no radiation damage to the human body, a high spatial resolution, and a large range of measurement depths [
15,
16,
17,
18,
19], which has always been the focus of scholars’ research. Ultrasonic stress measurement mainly includes longitudinal and transverse wave methods, the surface wave method, guided wave method, non-linear method, and longitudinal critically refracted (LCR) wave method.
Compared with other ultrasonic stress measurement methods, the LCR wave method is sensitive to the stress field and is less affected by the effect of material structures. It has outstanding advantages in the non-destructive measurement of residual stress. Therefore, the LCR wave method is currently the focus of research in various countries and the main development direction of ultrasonic stress measurement in the future [
20,
21].
In terms of the simulation study of the sound field characteristics of LCR waves, Pei [
22] used the finite element method to simulate and study the LCR waves of electromagnetic ultrasonic transducers when measuring residual stress. Chaki [
23] conducted a numerical simulation and experimental analysis of the LCR wave beam profile in a homogeneous and isotropic elastic solid medium. Through the study, the composition of the refracted sound field and the energy distribution of the LCR wave at different incident angles were obtained. The results of this study provide useful information for optimizing the incident angle of sound waves to obtain the optimal excitation energy of LCR waves. In the application study, Qozam uses the LCR wave to measure the welding stress of P355 steel. First, the acoustoelastic constants of the tissues at different distances from the weld were calibrated separately. Then, the stress of different tissues were measured, respectively. The measured stress distribution is very consistent with the data obtained by the blind hole method [
24]. Yashar studied the LCR wave method in the axial and hoop stress measurement of austenitic stainless steel tubes. The LCR waves of different frequencies were used to measure the stress at different depths. Finally, the accuracy of the measurement was verified by a finite element simulation and blind hole method [
25].
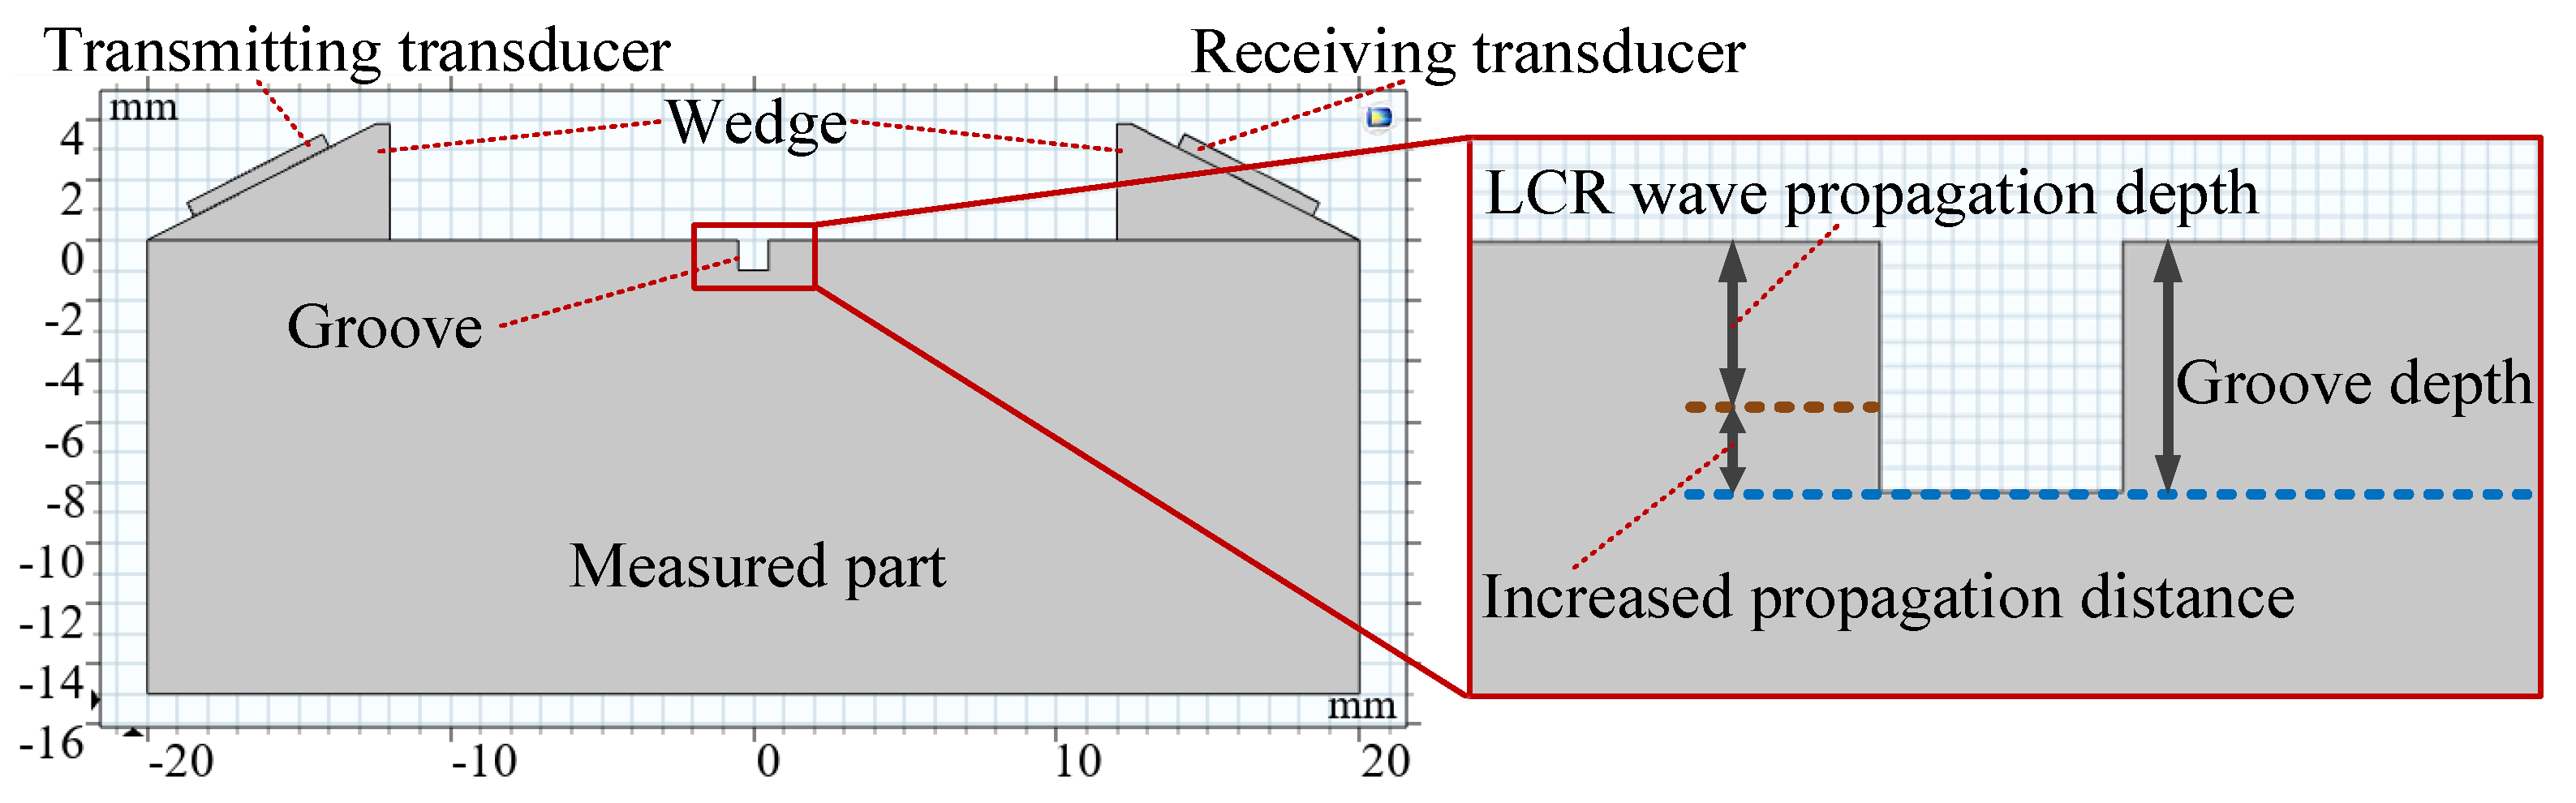
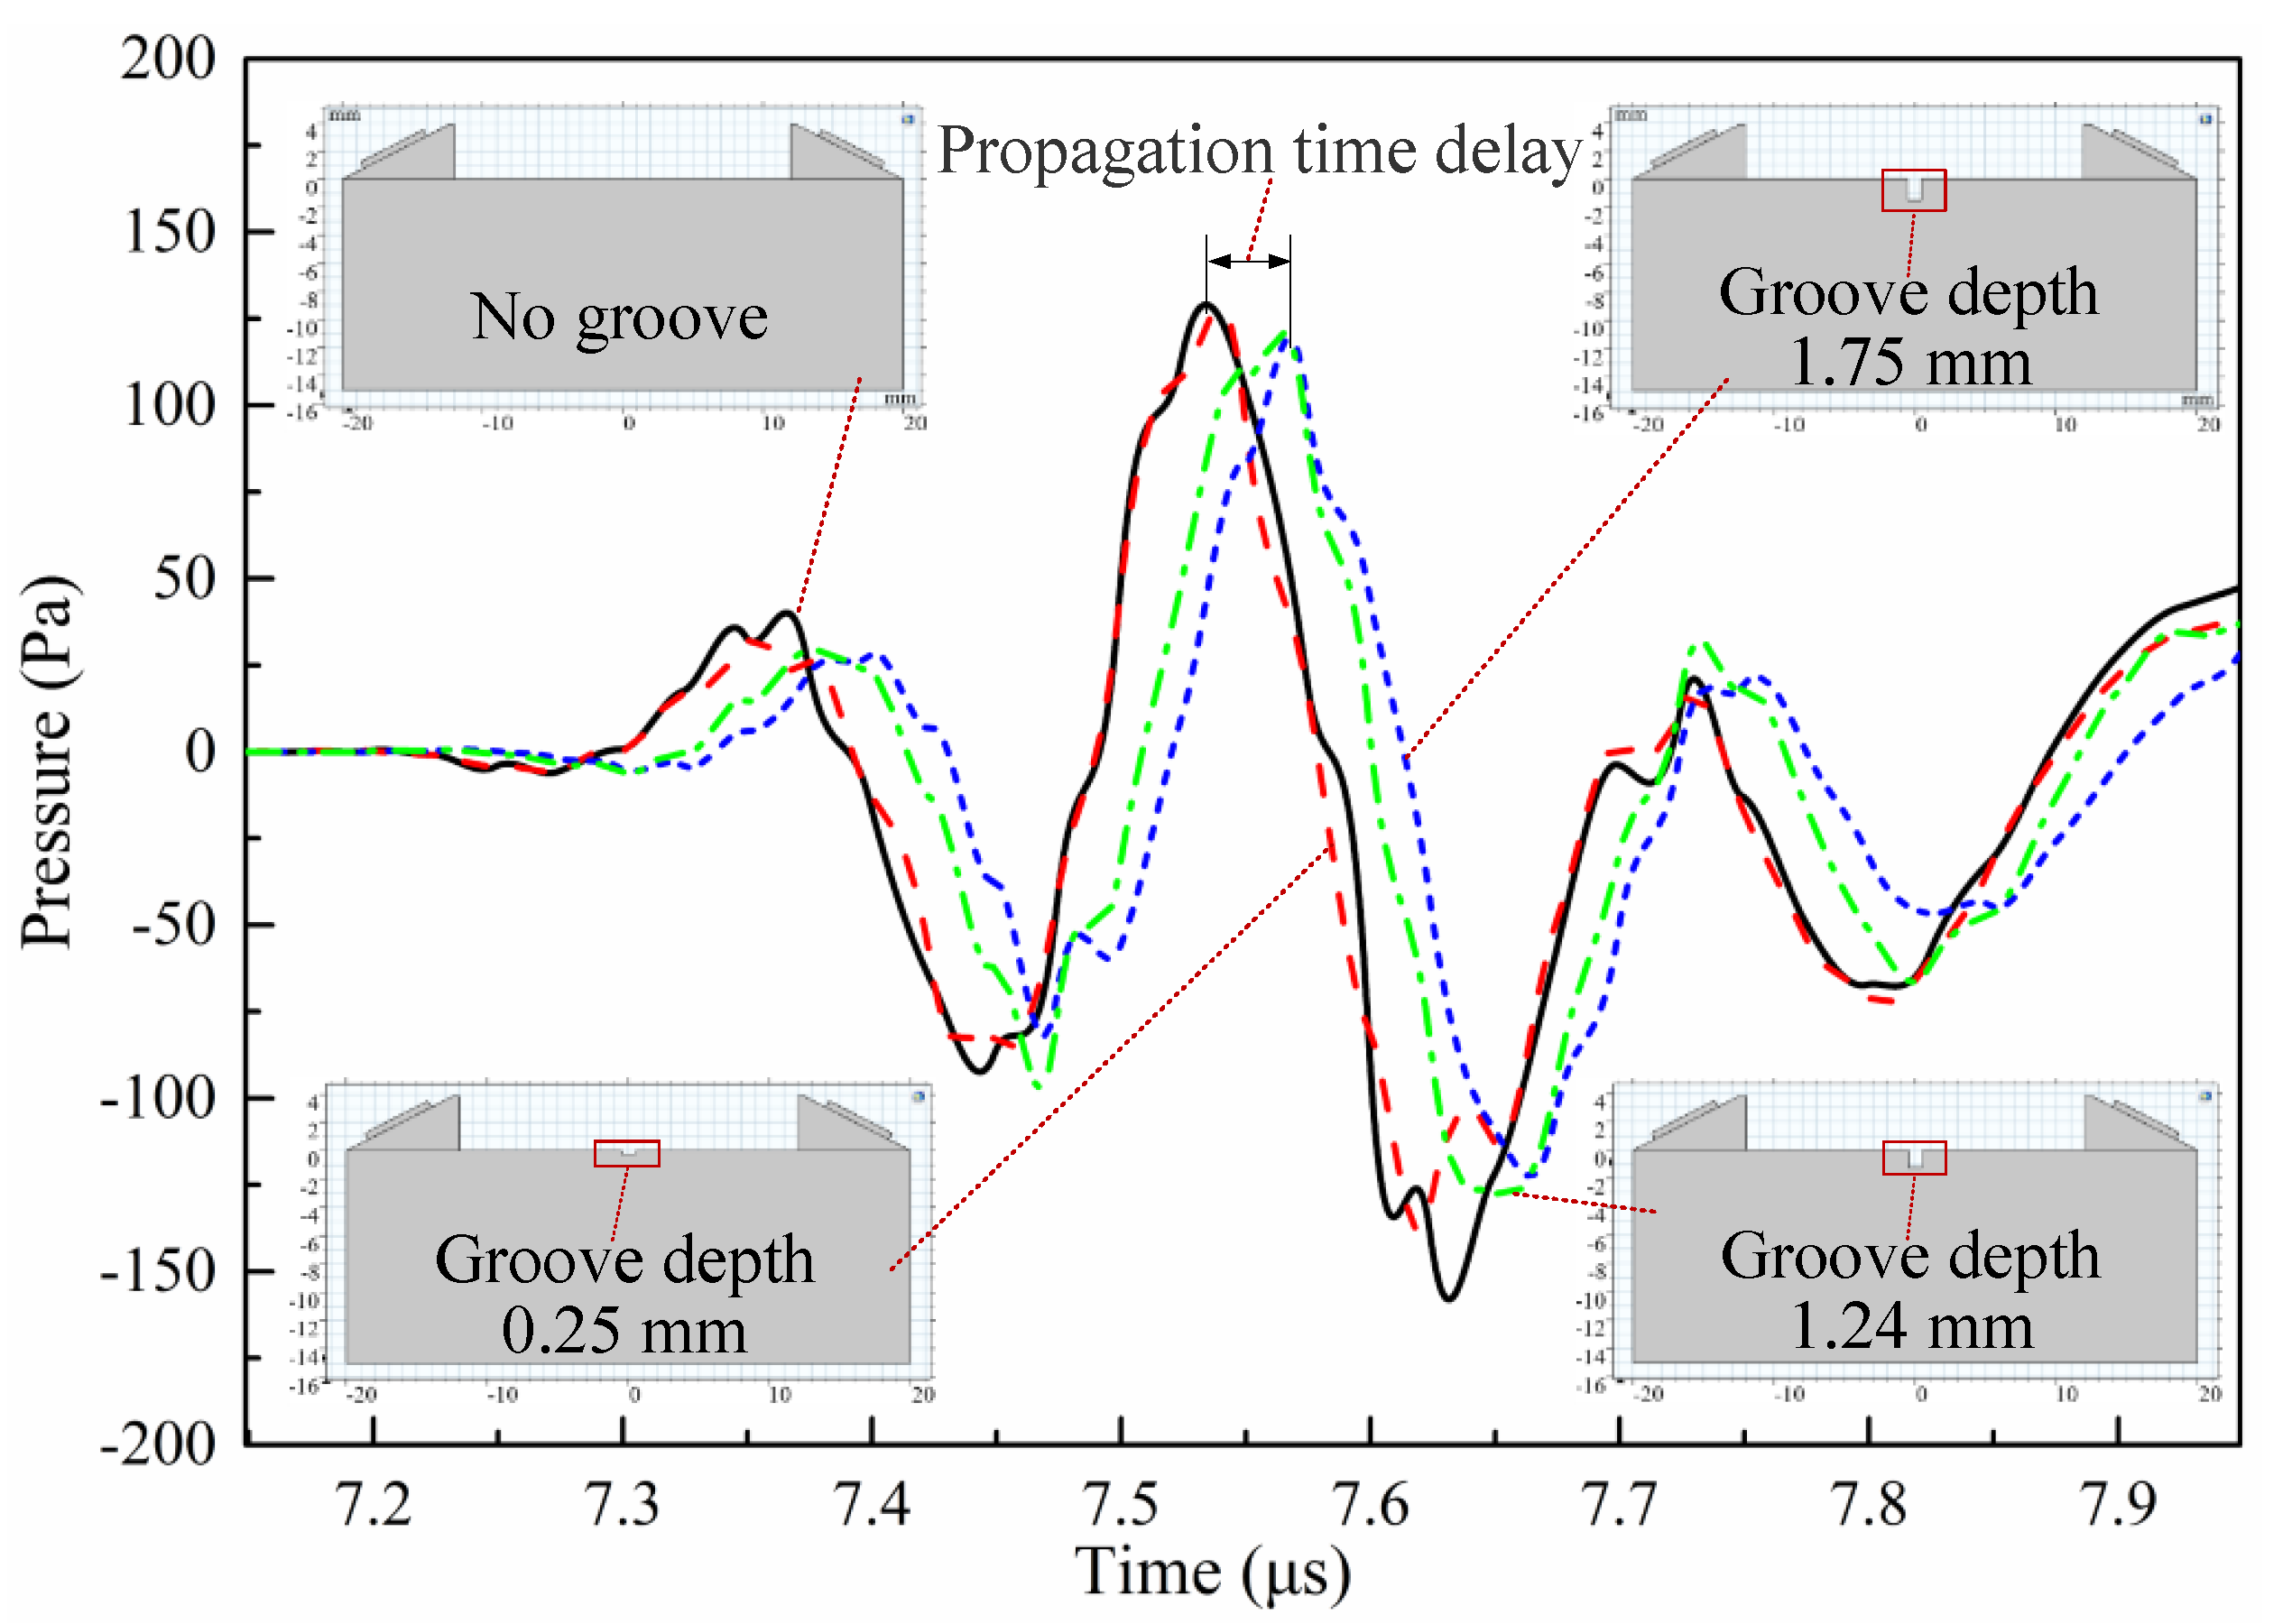
The accurate measurement of the propagation depth of LCR waves at different frequencies is a prerequisite for improving the spatial resolution of stress measurement and is essential for obtaining the true stress distribution state at different depths within the measured part. However, there is no definite theoretical formula for the relationship between the propagation depth of LCR waves and frequency, and it is currently mainly measured by the experiment in [
26]. The measurement method is to mill a groove of a certain depth between the transmitting and receiving transducers on the measured part to hinder the propagation of LCR waves. The propagation depth of the LCR wave is determined by analyzing the received signals at different groove depths.
There are some problems in measuring the propagation depth of LCR waves by experiment:
(a) When milling the groove, stress will concentrate around the groove. The stress will change the propagation velocity of the ultrasonic wave, so the time of receiving the LCR wave signal may be affected by stress.
(b) When acquiring LCR wave signals at different groove depths, the repeated installation of ultrasonic transmitting and receiving transducers makes it difficult to keep the coupling state consistent. The change of coupling state will lead to the delay or advancement of the received signal. The propagation velocity of the ultrasonic wave in the most commonly used couplant is 1620 m/s. If the thickness of the couplant changes by 1 μm, a propagation time difference of 0.62 ns will be caused. Therefore, the change of couplant thickness has a great influence on the measurement of the propagation depth of LCR waves.
(c) The milled groove inevitably has dimensional errors, which will affect the measurement accuracy of the propagation depth of the LCR wave.
All the factors above will lead to an inaccurate measurement of the propagation depth of LCR waves. Only by obtaining an accurate LCR wave propagation depth model can the stress of different depths be measured more accurately. Then, the stress distribution in different depths in the end face of the rotor parts can be obtained and the corresponding control measures can be taken. To overcome the shortcomings of the experimental method to study the propagation depth of LCR waves, an ideal finite element numerical model is established to simulate the propagation depth of LCR waves. By this method, the influence of factors such as stress concentration, coupling state error, and machining error can be eliminated. The theoretical formula including frequency is established to solve the problem of the lack of an accurate LCR wave propagation depth model, so as to improve the measurement accuracy of LCR wave propagation depth. Thus, the spatial resolution of stress measurement at different depths in the end face of the aero-engine rotor parts can be improved.
The novelty of this study is to combine the idea of the groove method to determine the propagation depth of LCR wave with the advantages of a finite element simulation, thus providing an accurate method to determine the propagation depth of LCR waves. Through this method, the propagation depth of LCR waves in different materials can be studied, which provides a theoretical and technical reference for the measurement of stress at different depths under the surface of different materials. At the same time, changing the wedge material, piezoelectric element diameter, and excitation voltage parameters to study the change of LCR wave propagation depth is conducive to an accurate measurement and control of LCR wave propagation depth, and also guides the selection of ultrasonic stress measurement devices and their parameters.
2. Principle of LCR Wave Measuring Stress at Different Depths
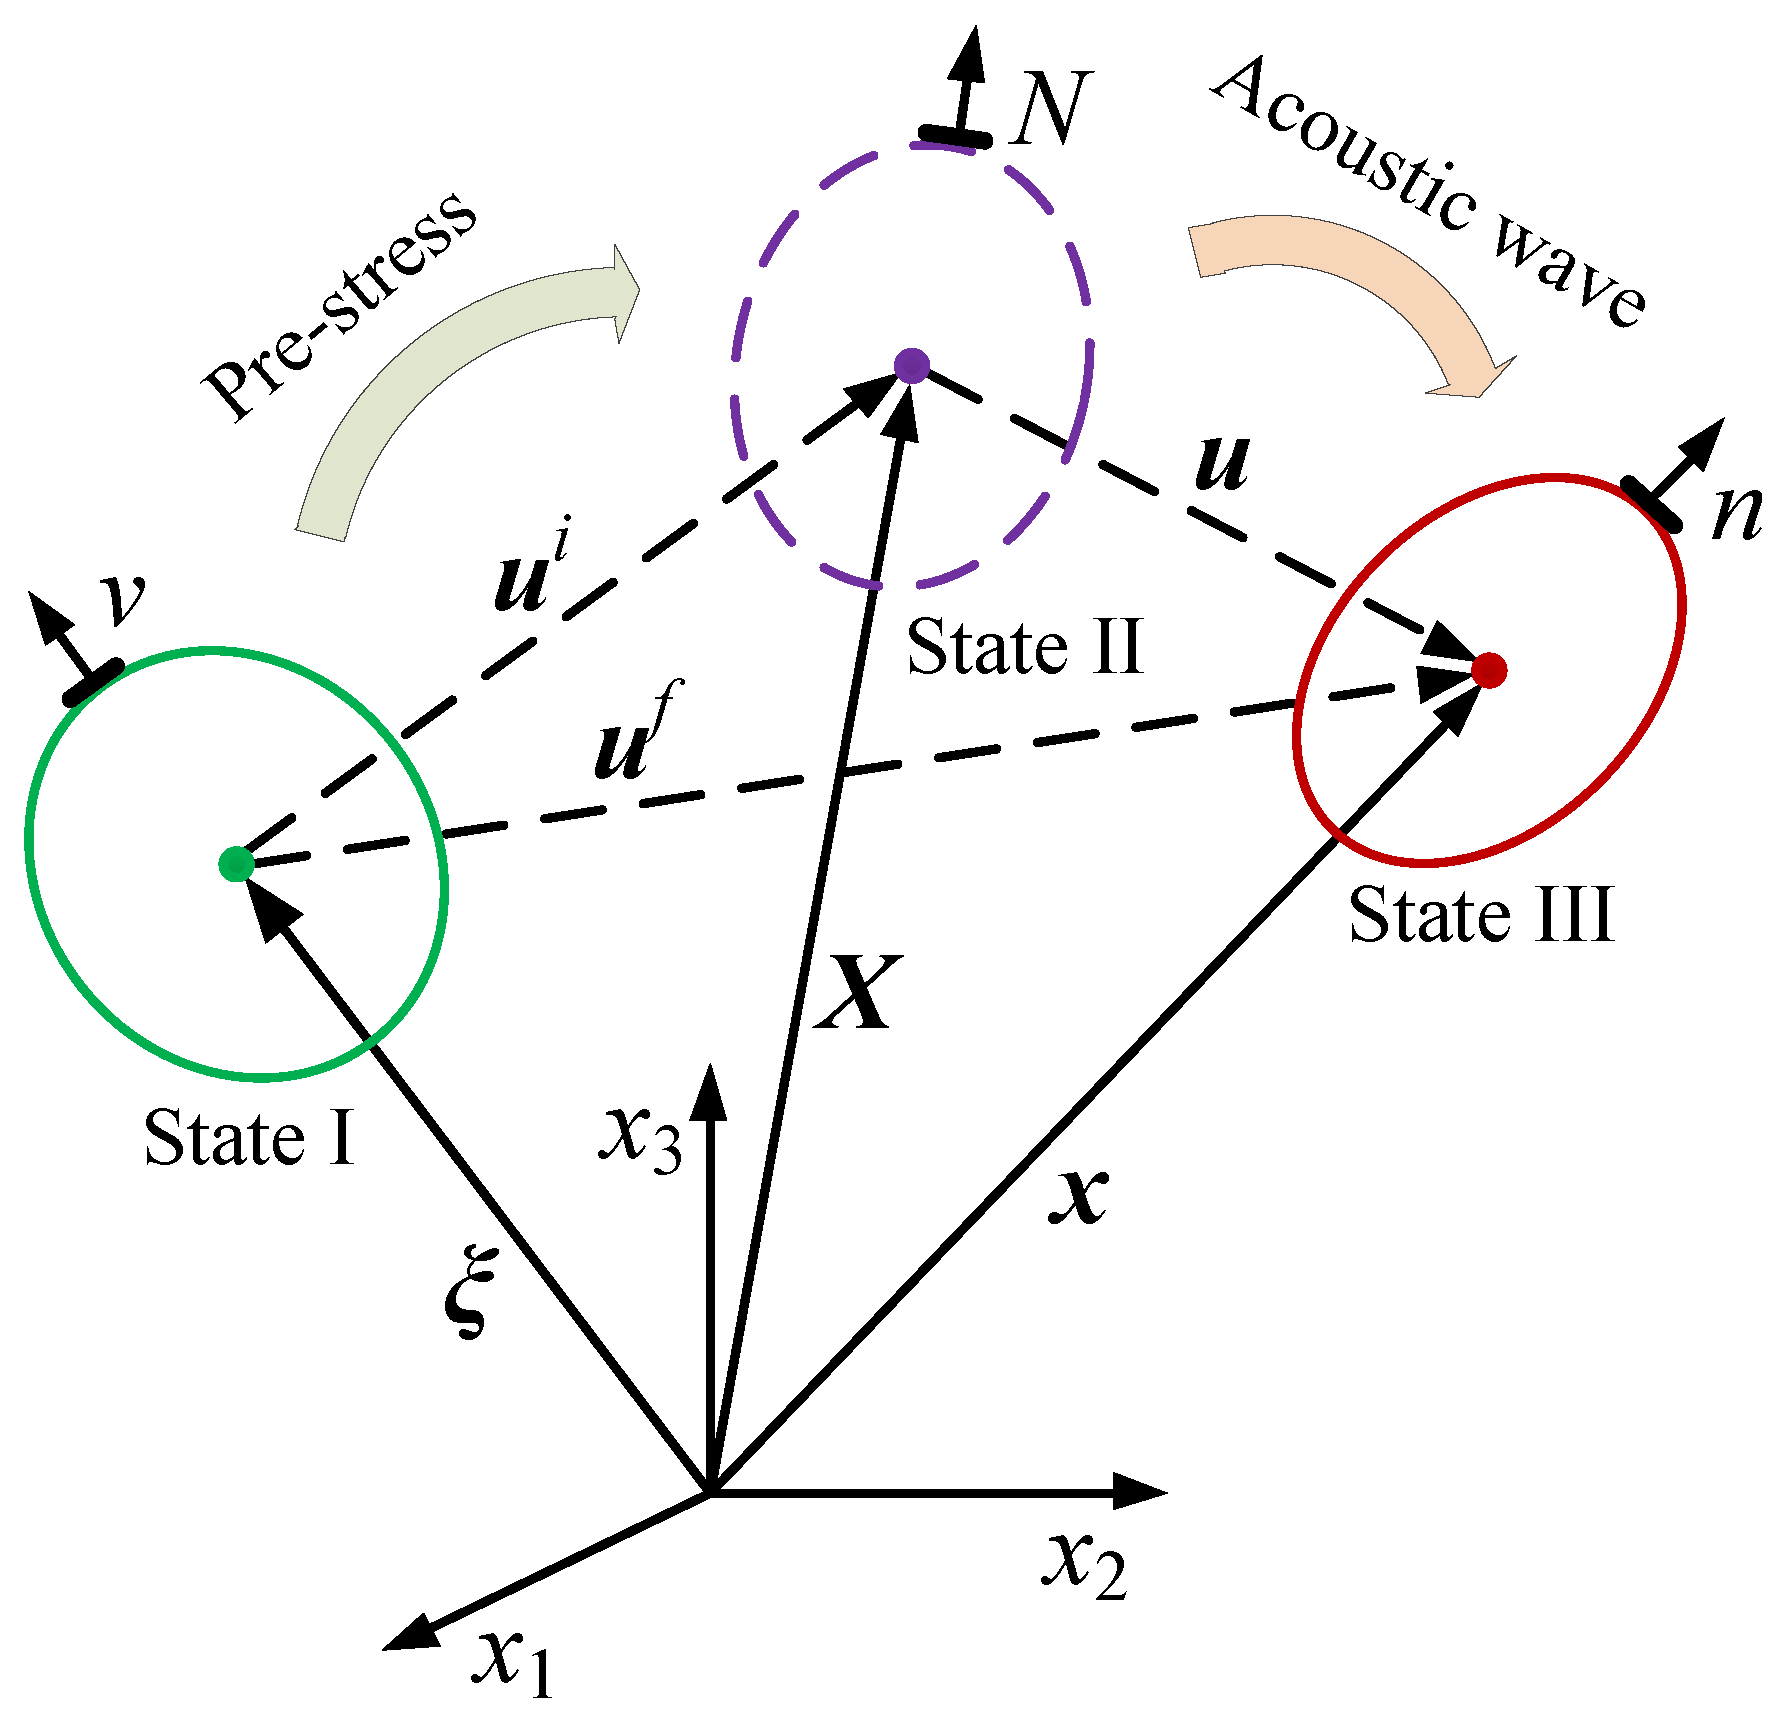
The state of the solid material without stress and strain is called the natural state (state I), as shown in
Figure 1. The state of the solid material when it has been deformed or is under a certain load is called the pre-deformed state (state II). A small acoustic disturbance is superimposed on the pre-deformed solid material to further deform the material to the final state—that is, the ultrasonic detection state (state III) [
27,
28].
In the initial coordinates, considering the influence of the stress on the medium and the attenuation of ultrasonic propagation, the equation of the elastic wave in the solid material is:
where
δIK is the Kronecker delta function,
is the pre-strain tensor,
ρ0 is the density of the solid material in natural coordinates,
γ is the sound attenuation coefficient in the solid material,
F is the external force, and
CIJKL(
I,
J,
K,
L = 1, 2, 3) is the stiffness coefficient matrix of the material.
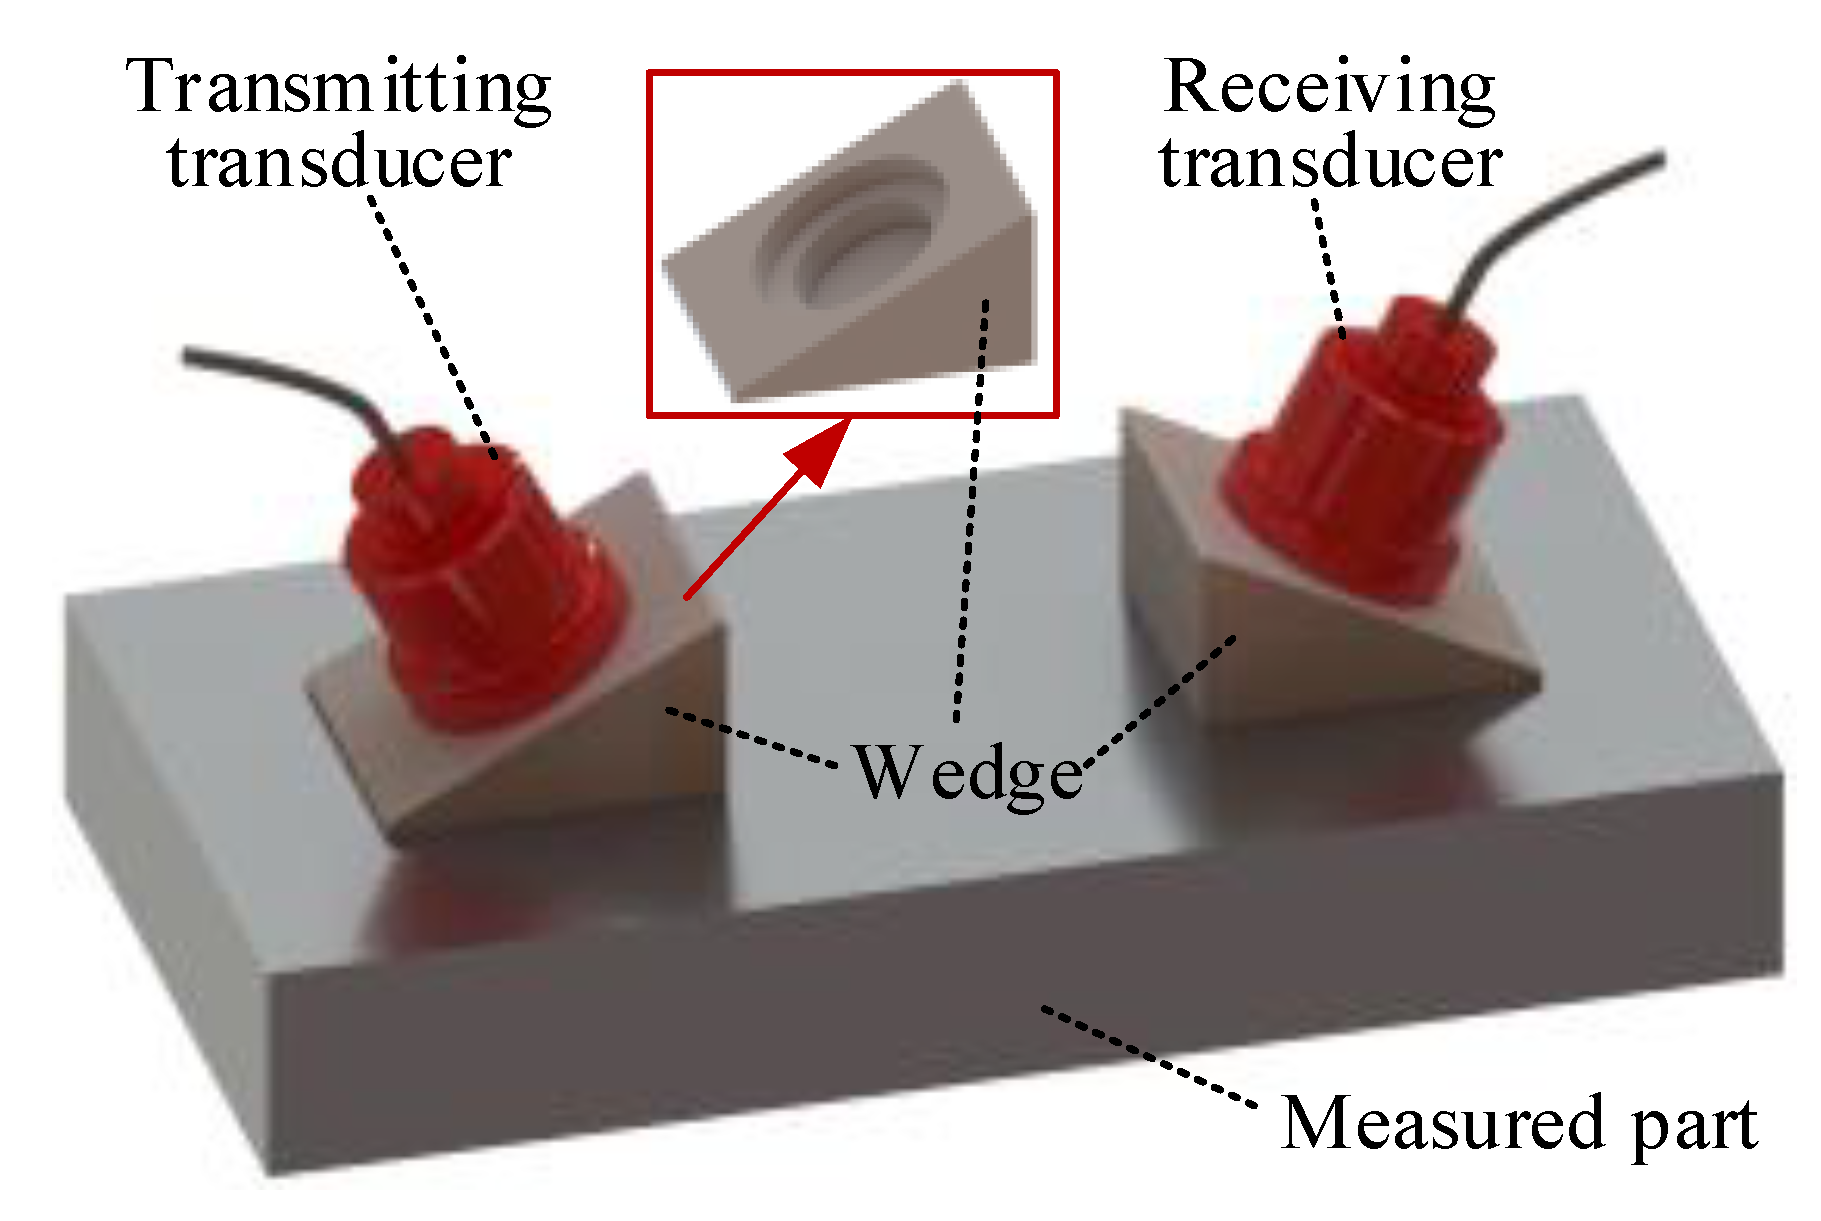
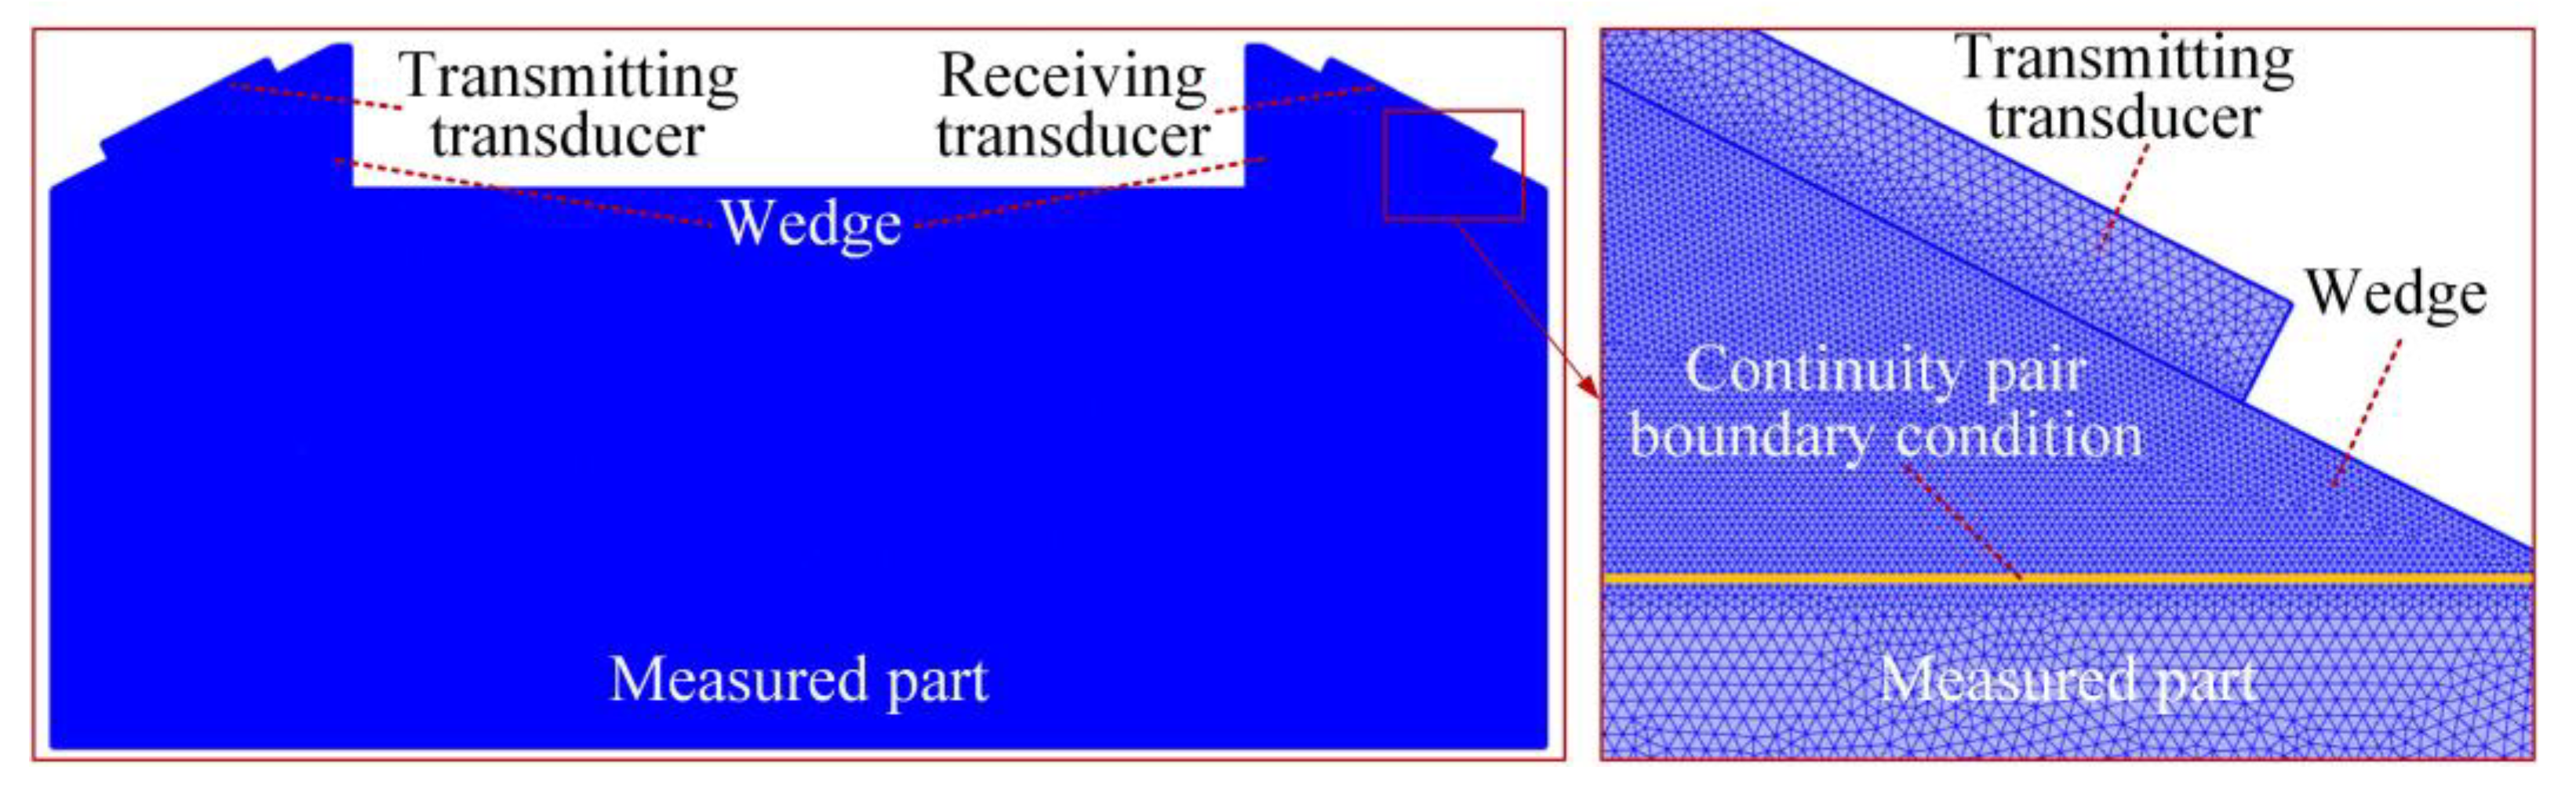
When an LCR wave is used to measure stress, the wedge should be designed to allow the ultrasonic transducer to be installed obliquely. The angle of the inclined plane of the wedge is the first critical angle calculated according to Snell’s law. There is a circular groove on the inclined plane for installing the ultrasonic transducer, as shown in
Figure 2. Polymethyl methacrylate (PMMA) and polystyrene (PS) are commonly used materials for making LCR wave wedges.
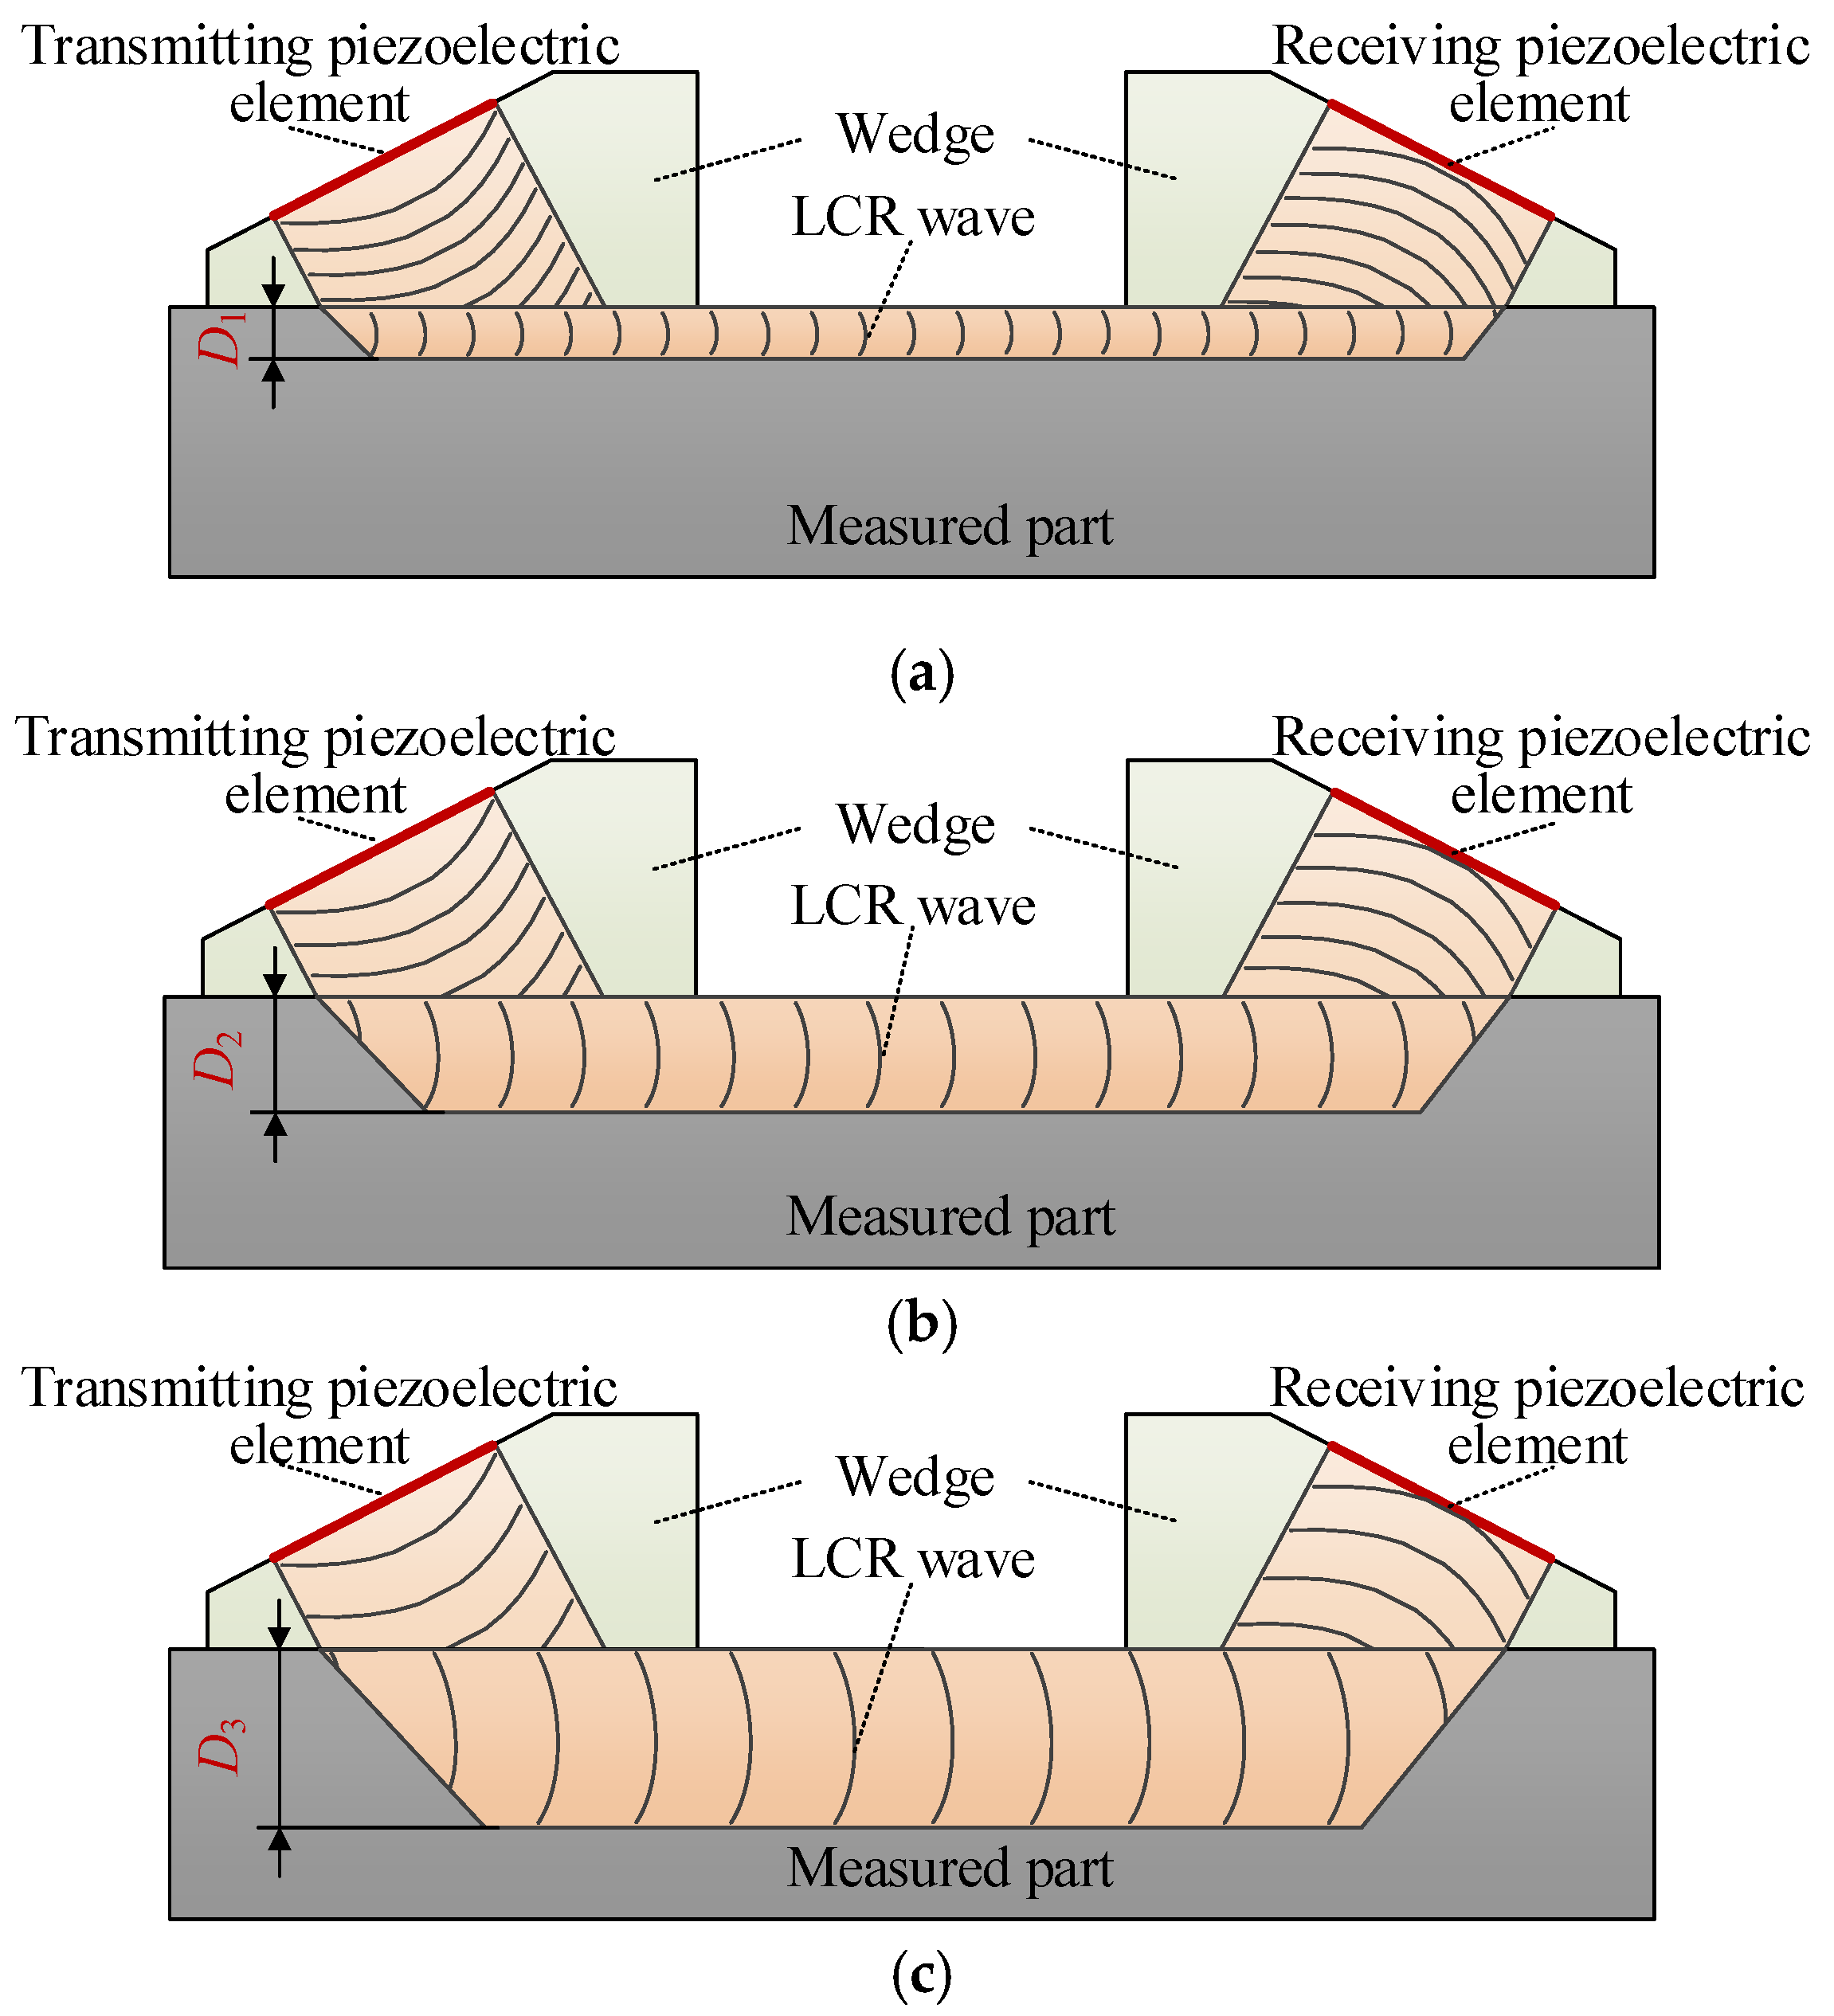
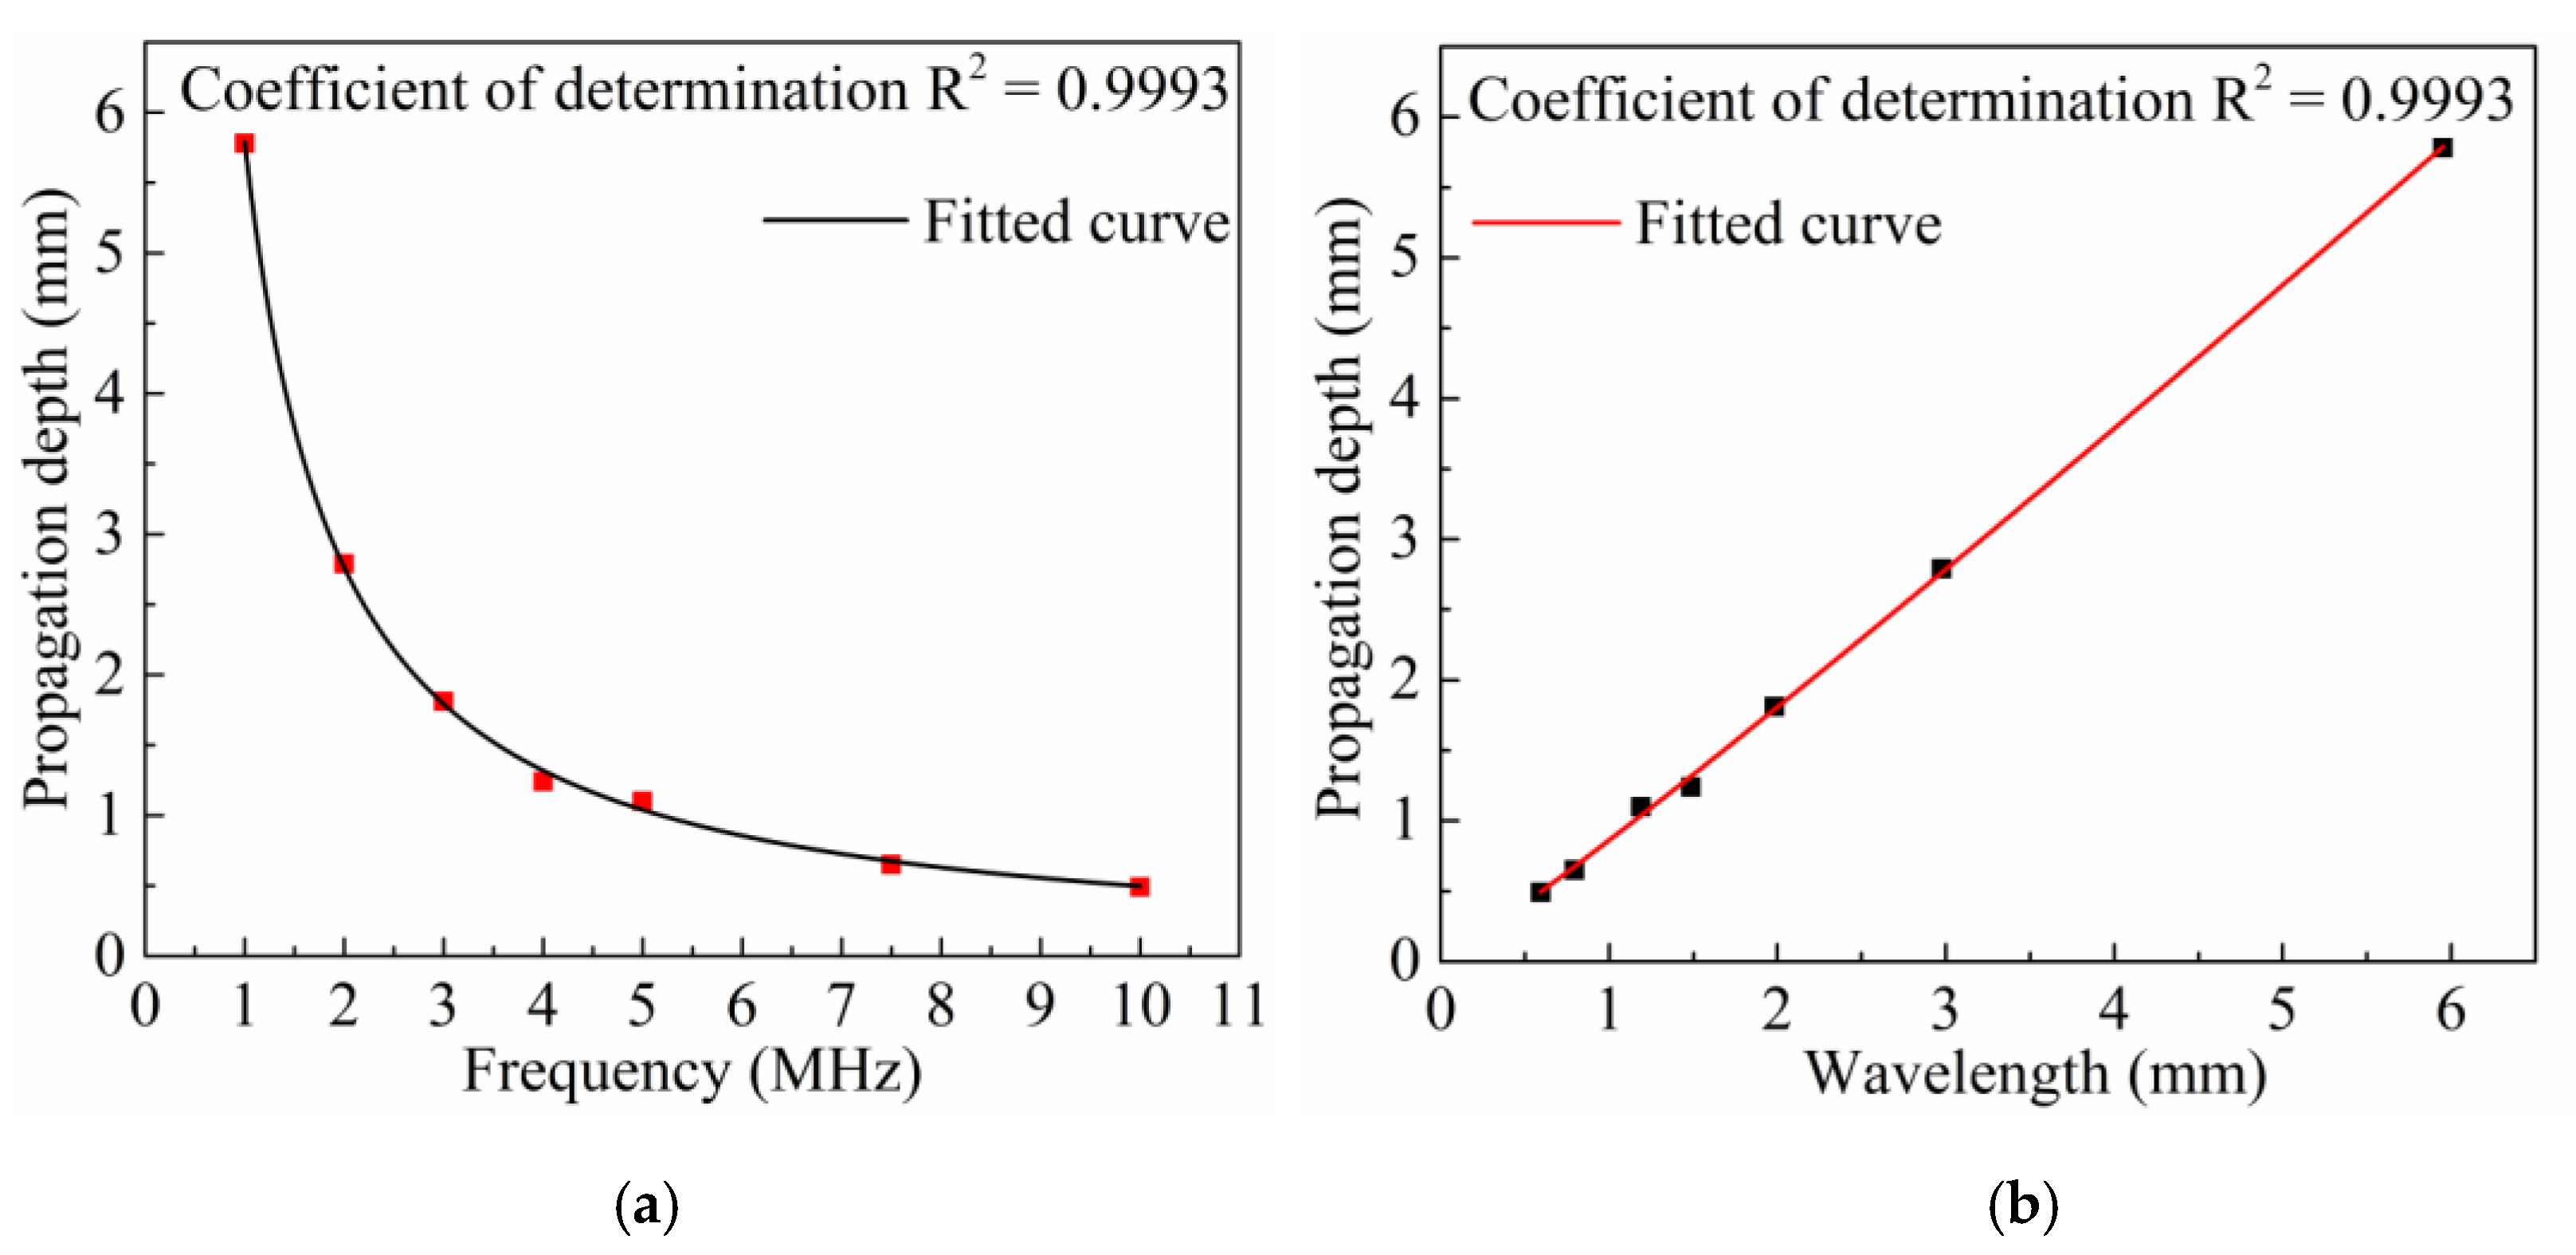
The propagation depth of the LCR wave in the measured medium is related to the excitation frequency of the ultrasonic transducer, as shown in
Figure 3. In the figure, the excitation frequency relationship of the ultrasonic transducer is
f1 >
f2 >
f3. According to the existing research, the relationship between the propagation depth of the LCR wave is
D1 <
D2 <
D3 [
25].
The LCR waves propagating at different depths below the material surface can be obtained by changing the excitation frequency of the transducer. Then, according to the influence of stress at different depths of LCR wave velocity and the correlation model between stress and wave velocity, the stress distribution at different depths below the material surface can be finally determined.
5. Discussions
In addition to the influence of frequency, whether the propagation depth of LCR wave is related to other factors, such as the material of wedge, the diameter of the piezoelectric element and the value of excitation voltage, etc., remains to be studied. Therefore, in this section, the influence of the wedge material, piezoelectric element diameter, and excitation voltage on the propagation depth of LCR waves is studied by changing relevant parameters. In addition, the significant challenges in the measurement of the stresses of rotors with complex geometries are also analyzed in this section.
5.1. Effect of Wedge Material on Propagation Depth of LCR Waves
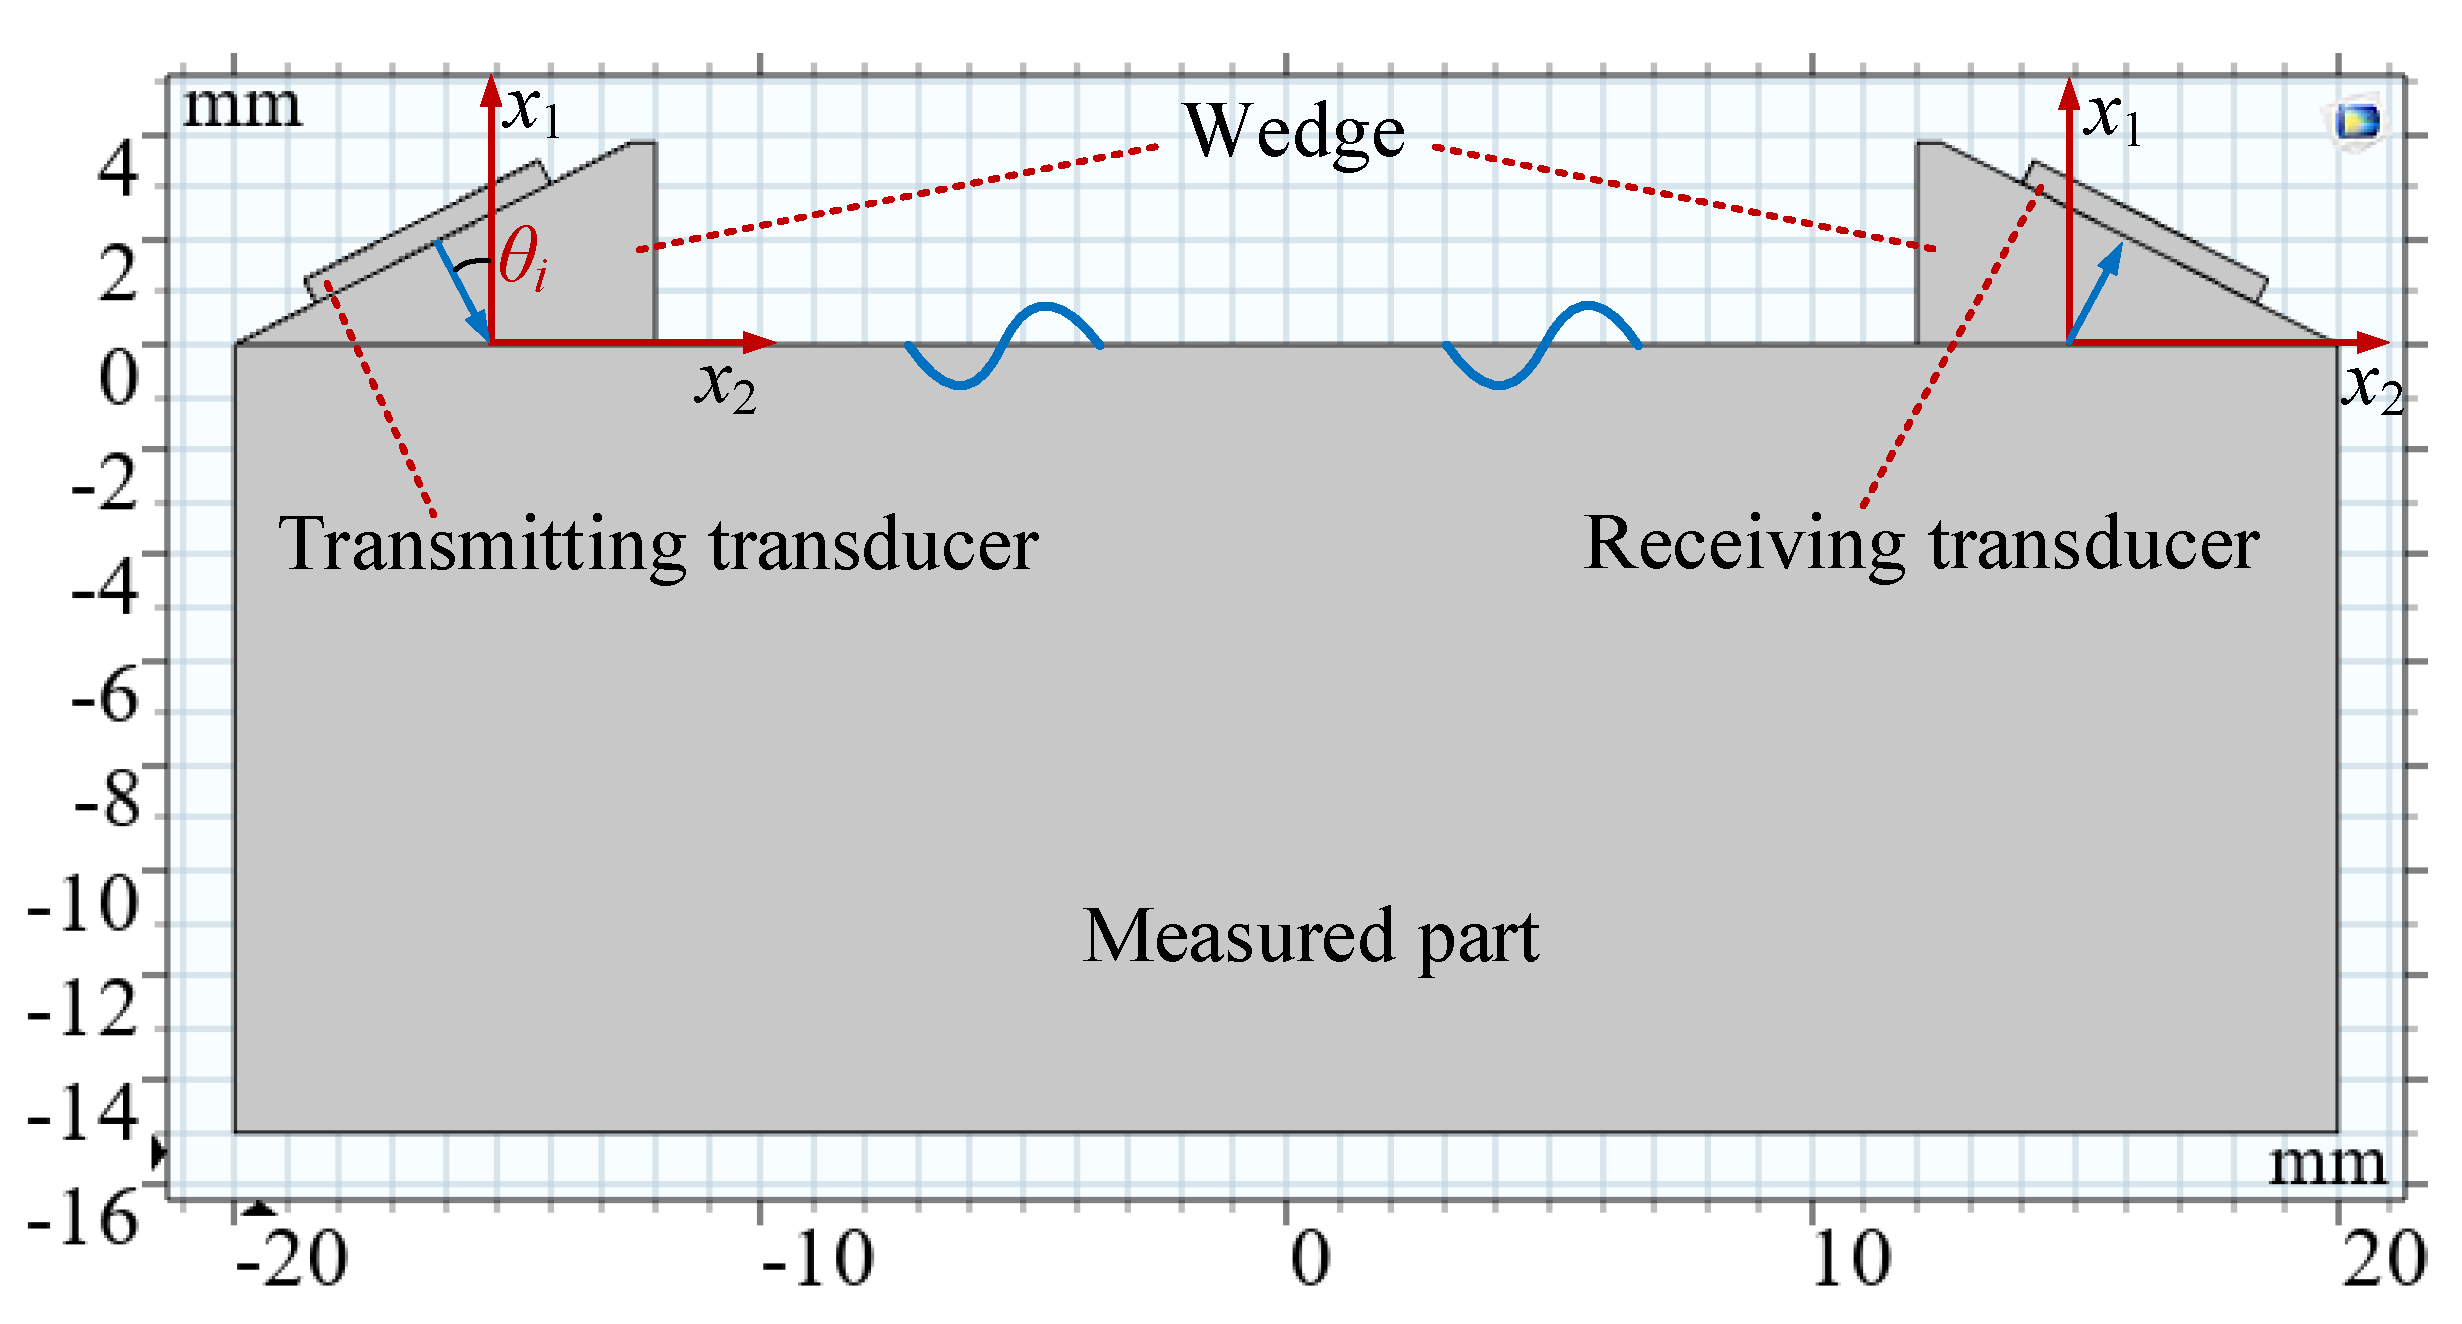
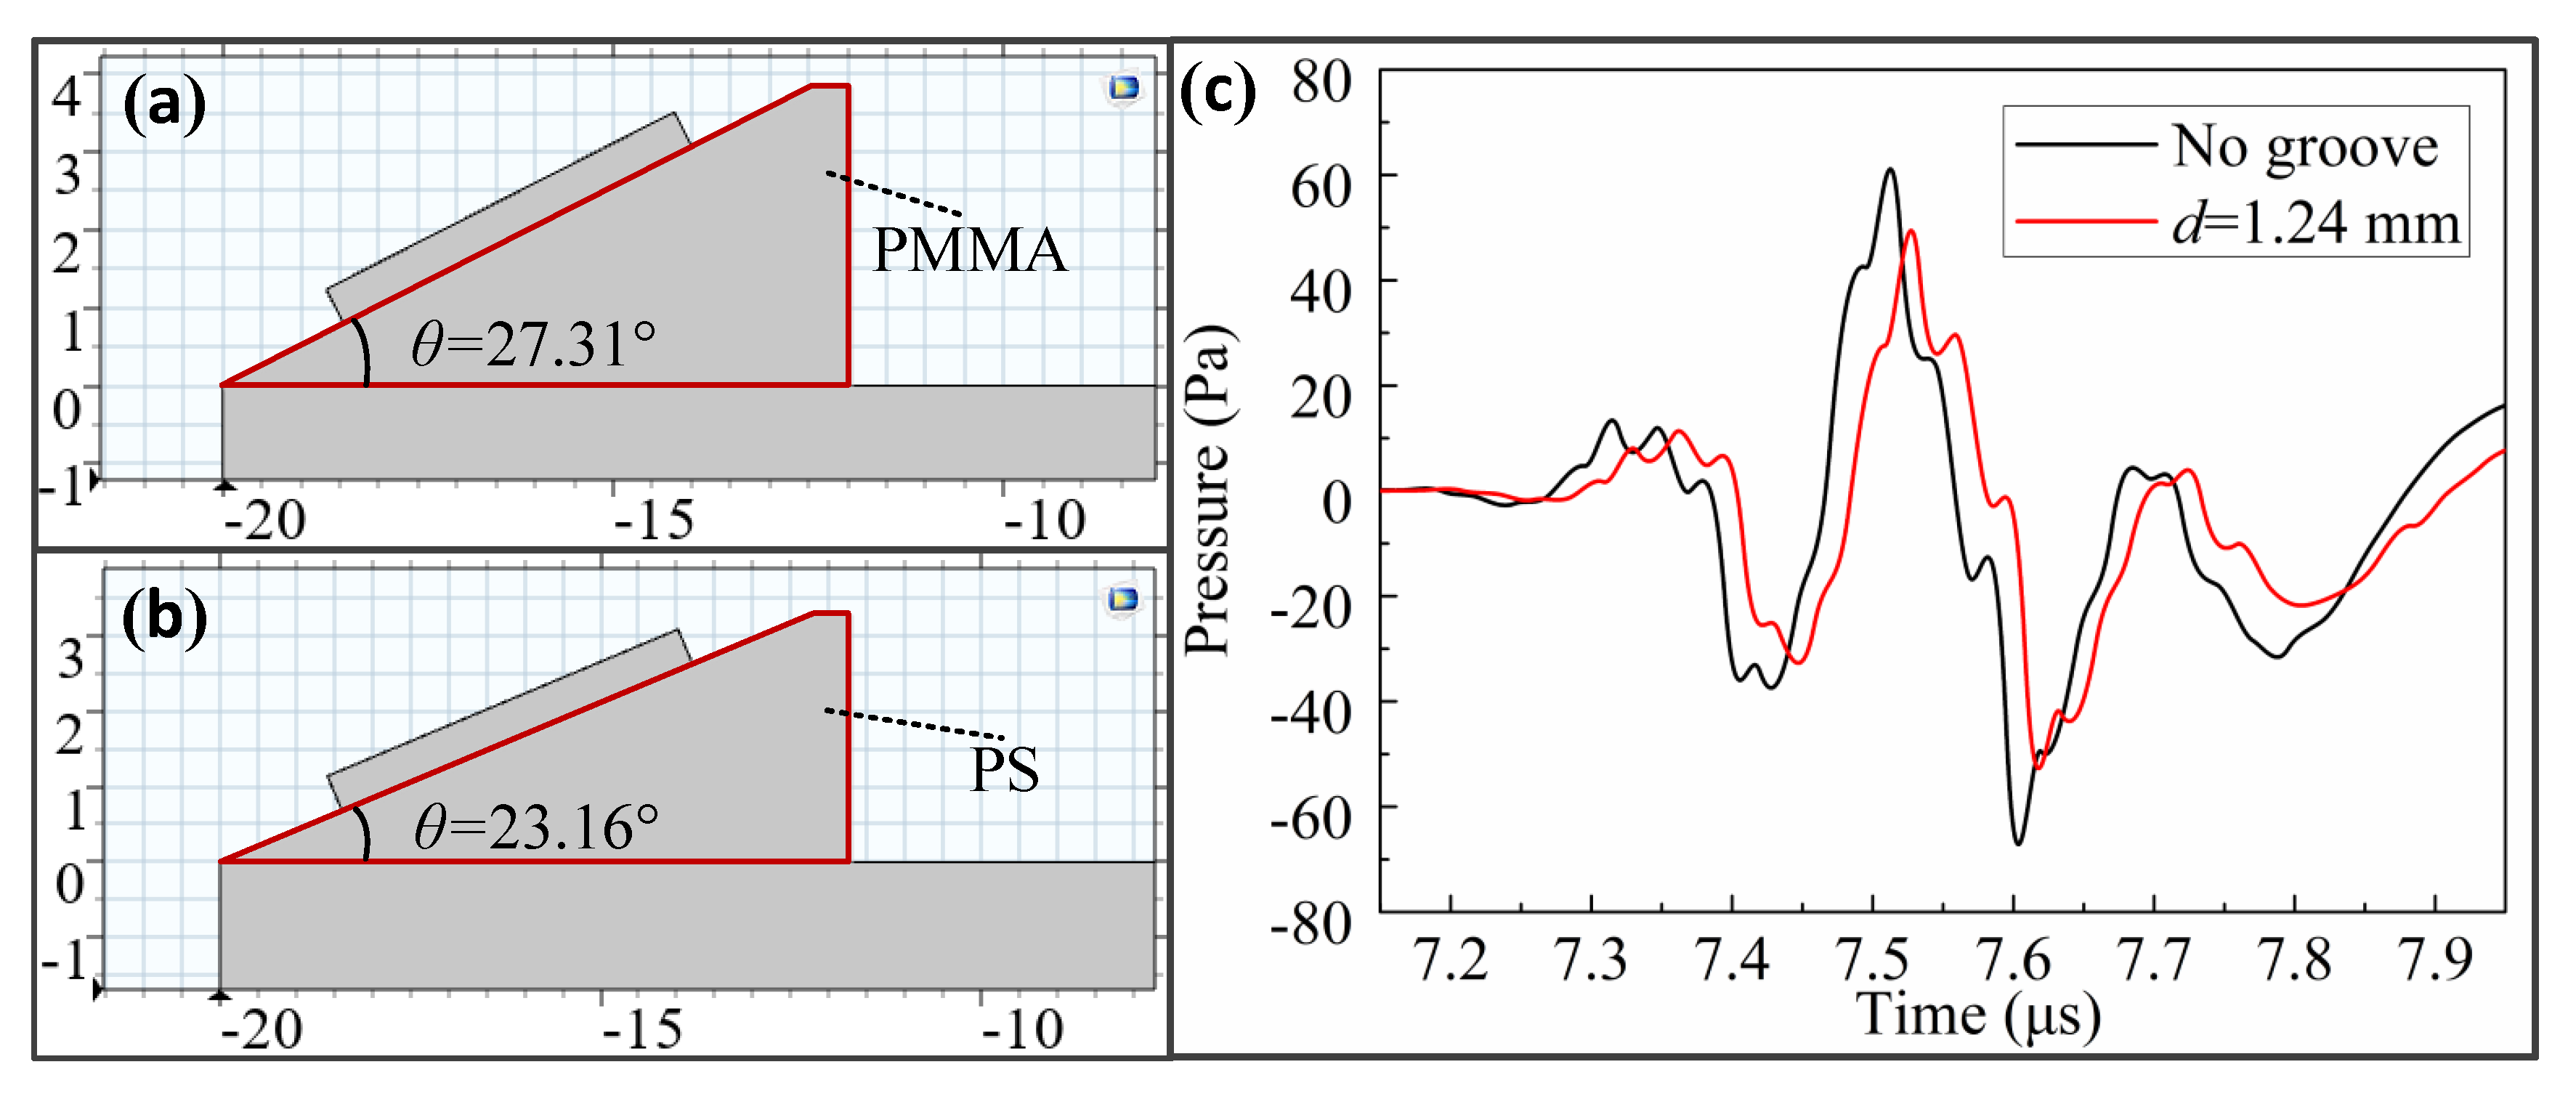
The LCR wave was generated by the longitudinal ultrasonic wave incident on the measured part from the wedge at the first critical angle. Therefore, it is necessary to calculate the first critical angle by Snell’s law and design the wedge to make the ultrasonic longitudinal wave incident on the measured part at the first critical angle. The wedge material should have the properties of a low sound velocity, small sound attenuation coefficient, and easy processing. PMMA and PS are two commonly used wedge materials.
In this paper, PMMA was used as the wedge material in the simulation analysis of the relationship between the propagation depth of LCR wave and frequency, as shown in
Figure 11a. To study the influence of wedge material on the propagation depth of LCR waves, PS was selected for the simulation and comparative analysis. According to Snell’s law, the first critical angle is 23.16° when using PS as the wedge, as shown in
Figure 11b. When using PMMA as the wedge material, the LCR propagation depth at a frequency of 4 MHz is 1.24 mm. Therefore, as shown in
Figure 11c, we directly analyzed the amount of LCR wave propagation time extension caused by the 1.24 mm groove when the PS was used as a wedge. By comparing this extension with that when using PMMA as the wedge, it can be determined as to whether the wedge material affects the propagation depth of LCR waves.
Using the cross-correlation algorithm, it can be seen that when the PS was used as the wedge, the propagation time extension of the LCR wave generated by 1.24 mm groove is 12.60 ns. When using PMMA, it is 12.51 ns. Therefore, the change rate of the propagation time extension after changing the wedge material is only 0.72%. It can be considered that the propagation depth of the LCR wave with a frequency of 4 MHz when using PS as the wedge is still 1.24 mm; that is, the propagation depth of the LCR wave does not change after the wedge material is changed.
By comparing
Figure 9 and
Figure 11c, it can be concluded that the amplitude of the LCR wave when using PS as the wedge is smaller than that using the PMMA. This is because the acoustic impedance of PMMA is greater than that of PS, so the reflectivity of the PMMA–steel interface is less than that of the PS–steel interface. The low reflectivity of ultrasonic waves means that the energy loss is small.
5.2. Effect of Piezoelectric Element Diameter on Propagation Depth of LCR Wave
According to the stress measurement model based on the LCR wave in
Section 2, the diameter of the piezoelectric element of the ultrasonic transducer determines the spatial resolution of the stress measurement. The smaller the diameter of the piezoelectric element, the smaller the measurement area, so the higher the spatial resolution of the stress measurement. Conversely, if the diameter of the piezoelectric element is larger, it means that the spatial resolution of the stress measurement is lower.
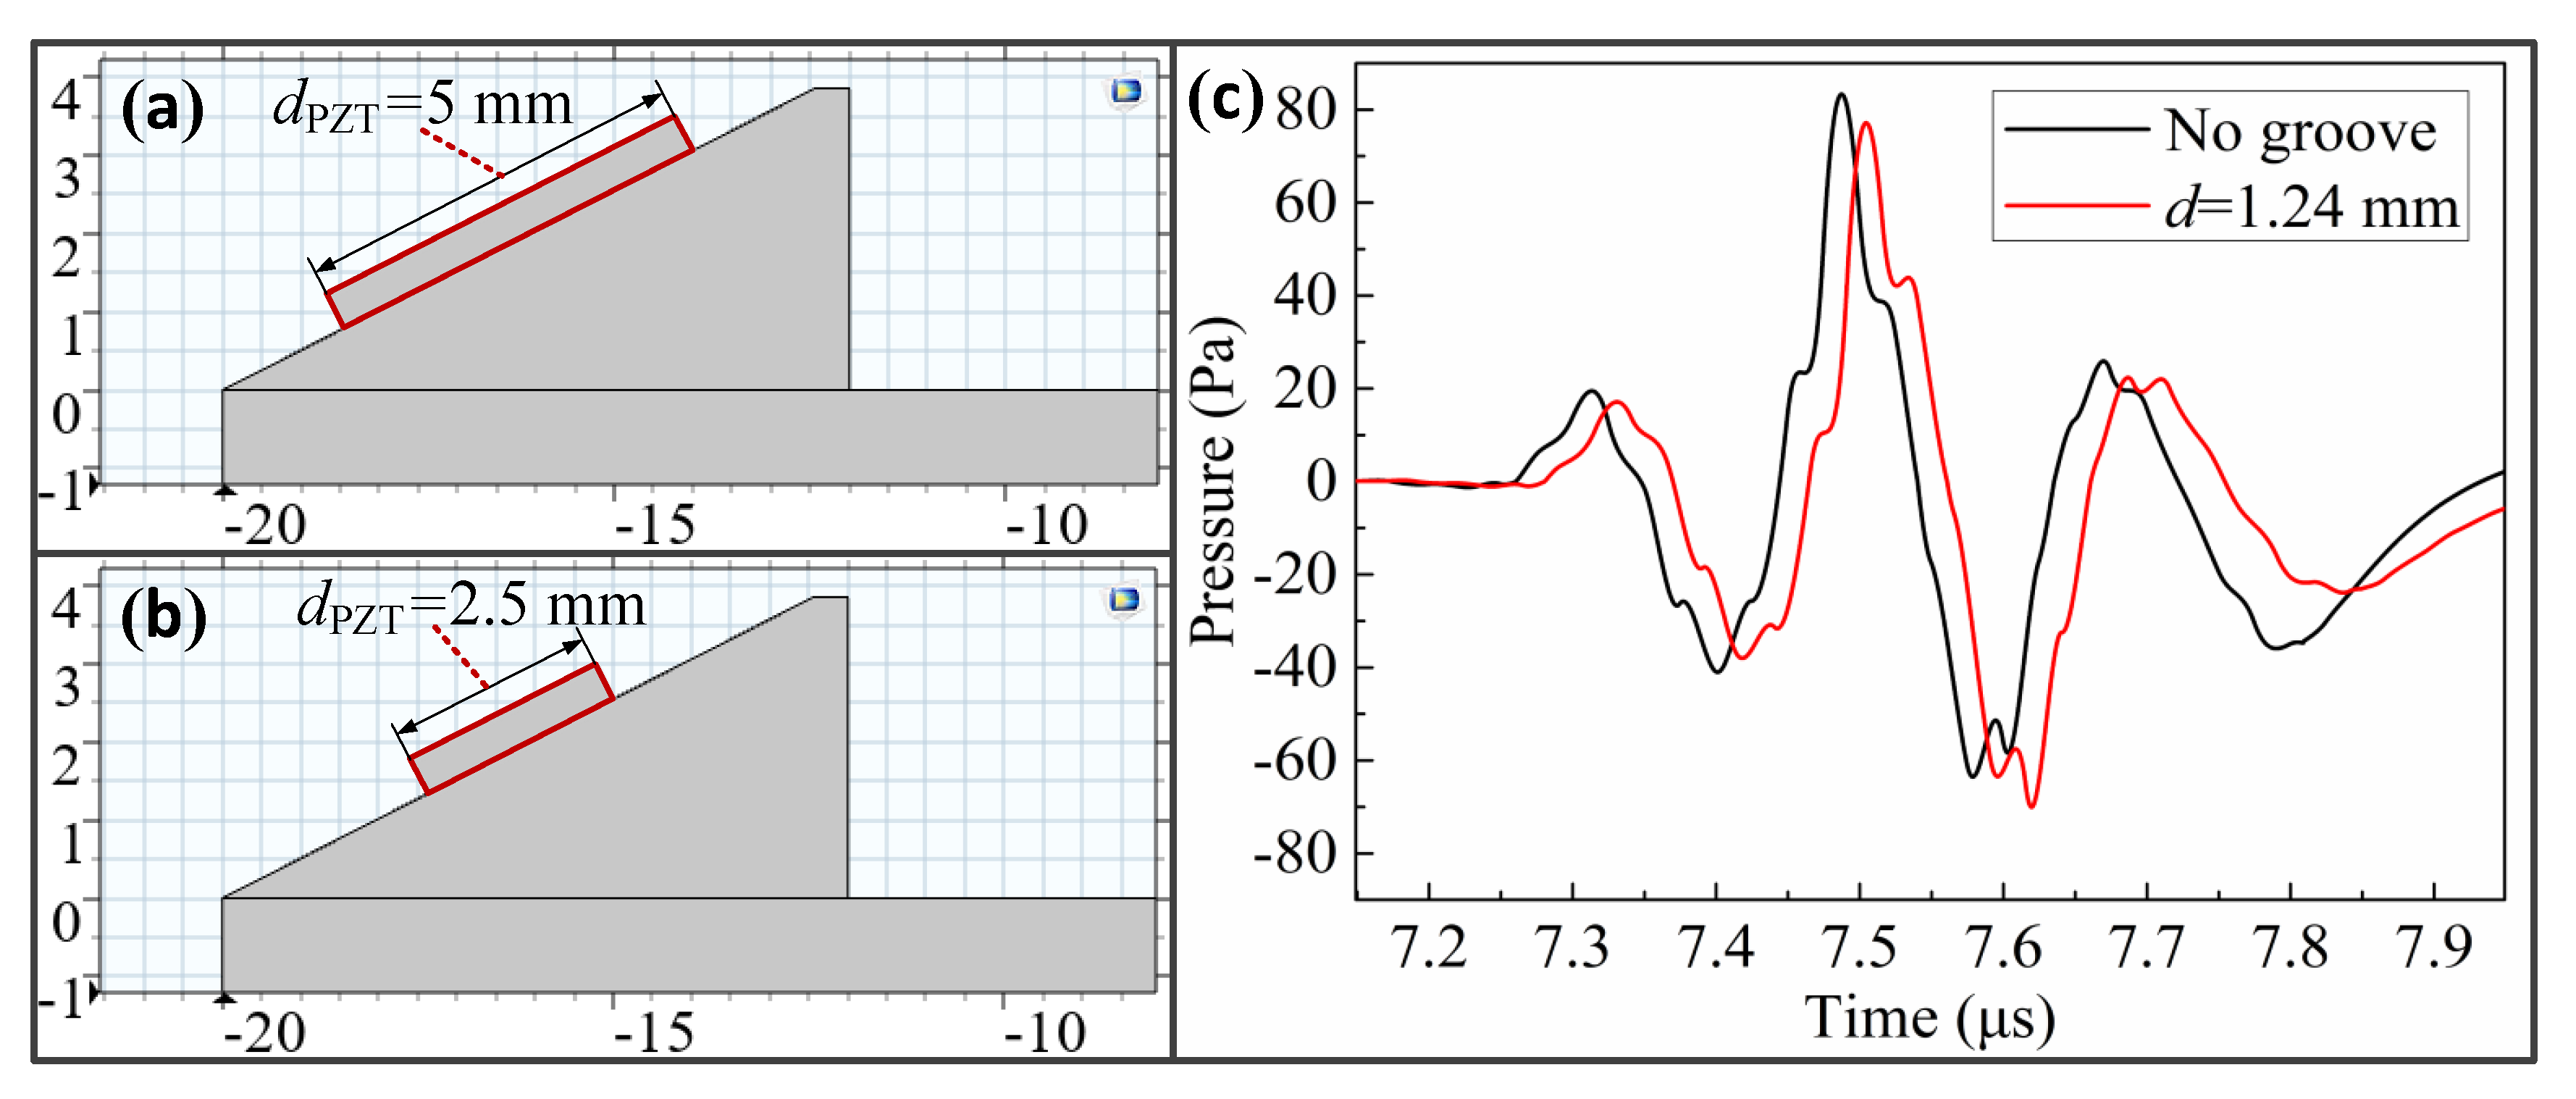
In this paper, the diameter of the piezoelectric element used in the simulation study of the relationship between the propagation depth of LCR wave and the frequency was 5 mm, as shown in
Figure 12a. To study the effect of piezoelectric element size on the propagation depth of LCR, a piezoelectric element with a diameter of 2.5 mm was selected for simulation and comparative analysis, as shown in
Figure 12b. When using a piezoelectric element with a diameter of 2.5 mm, the LCR wave propagation time extension caused by the 1.24 mm groove was directly analyzed, as shown in
Figure 12c. By comparing this extension with the extension when the diameter of the piezoelectric element was 5 mm, it can be determined whether the piezoelectric element diameter affects the propagation depth of LCR wave.
Using the cross-correlation algorithm, it can be seen that when the 2.5 mm diameter piezoelectric element was used, the propagation time extension of the LCR wave generated by the 1.24 mm groove is 12.56 ns. The difference is 0.05 ns compared to when using a piezoelectric element with a diameter of 5 mm. Therefore, the change rate of the propagation time extension after changing the diameter of the piezoelectric element is only 0.40%. It can be considered that the propagation depth of LCR waves with a frequency of 4 MHz is still 1.24 mm when the piezoelectric element with a diameter of 2.5 mm is used; that is, the propagation depth of LCR waves does not change after the change of piezoelectric element diameter.
By comparing
Figure 9 and
Figure 12c, it can be concluded that the sound pressure amplitude of the LCR wave when using a piezoelectric element with a diameter of 2.5 mm is smaller than that using a piezoelectric element with a diameter of 5 mm. This is because the sound pressure amplitude is positively related to the diameter of the piezoelectric element. The larger the diameter of the piezoelectric element, the larger the sound pressure amplitude of the LCR wave.
5.3. Effect of Excitation Voltage on the Propagation Depth of LCR Waves
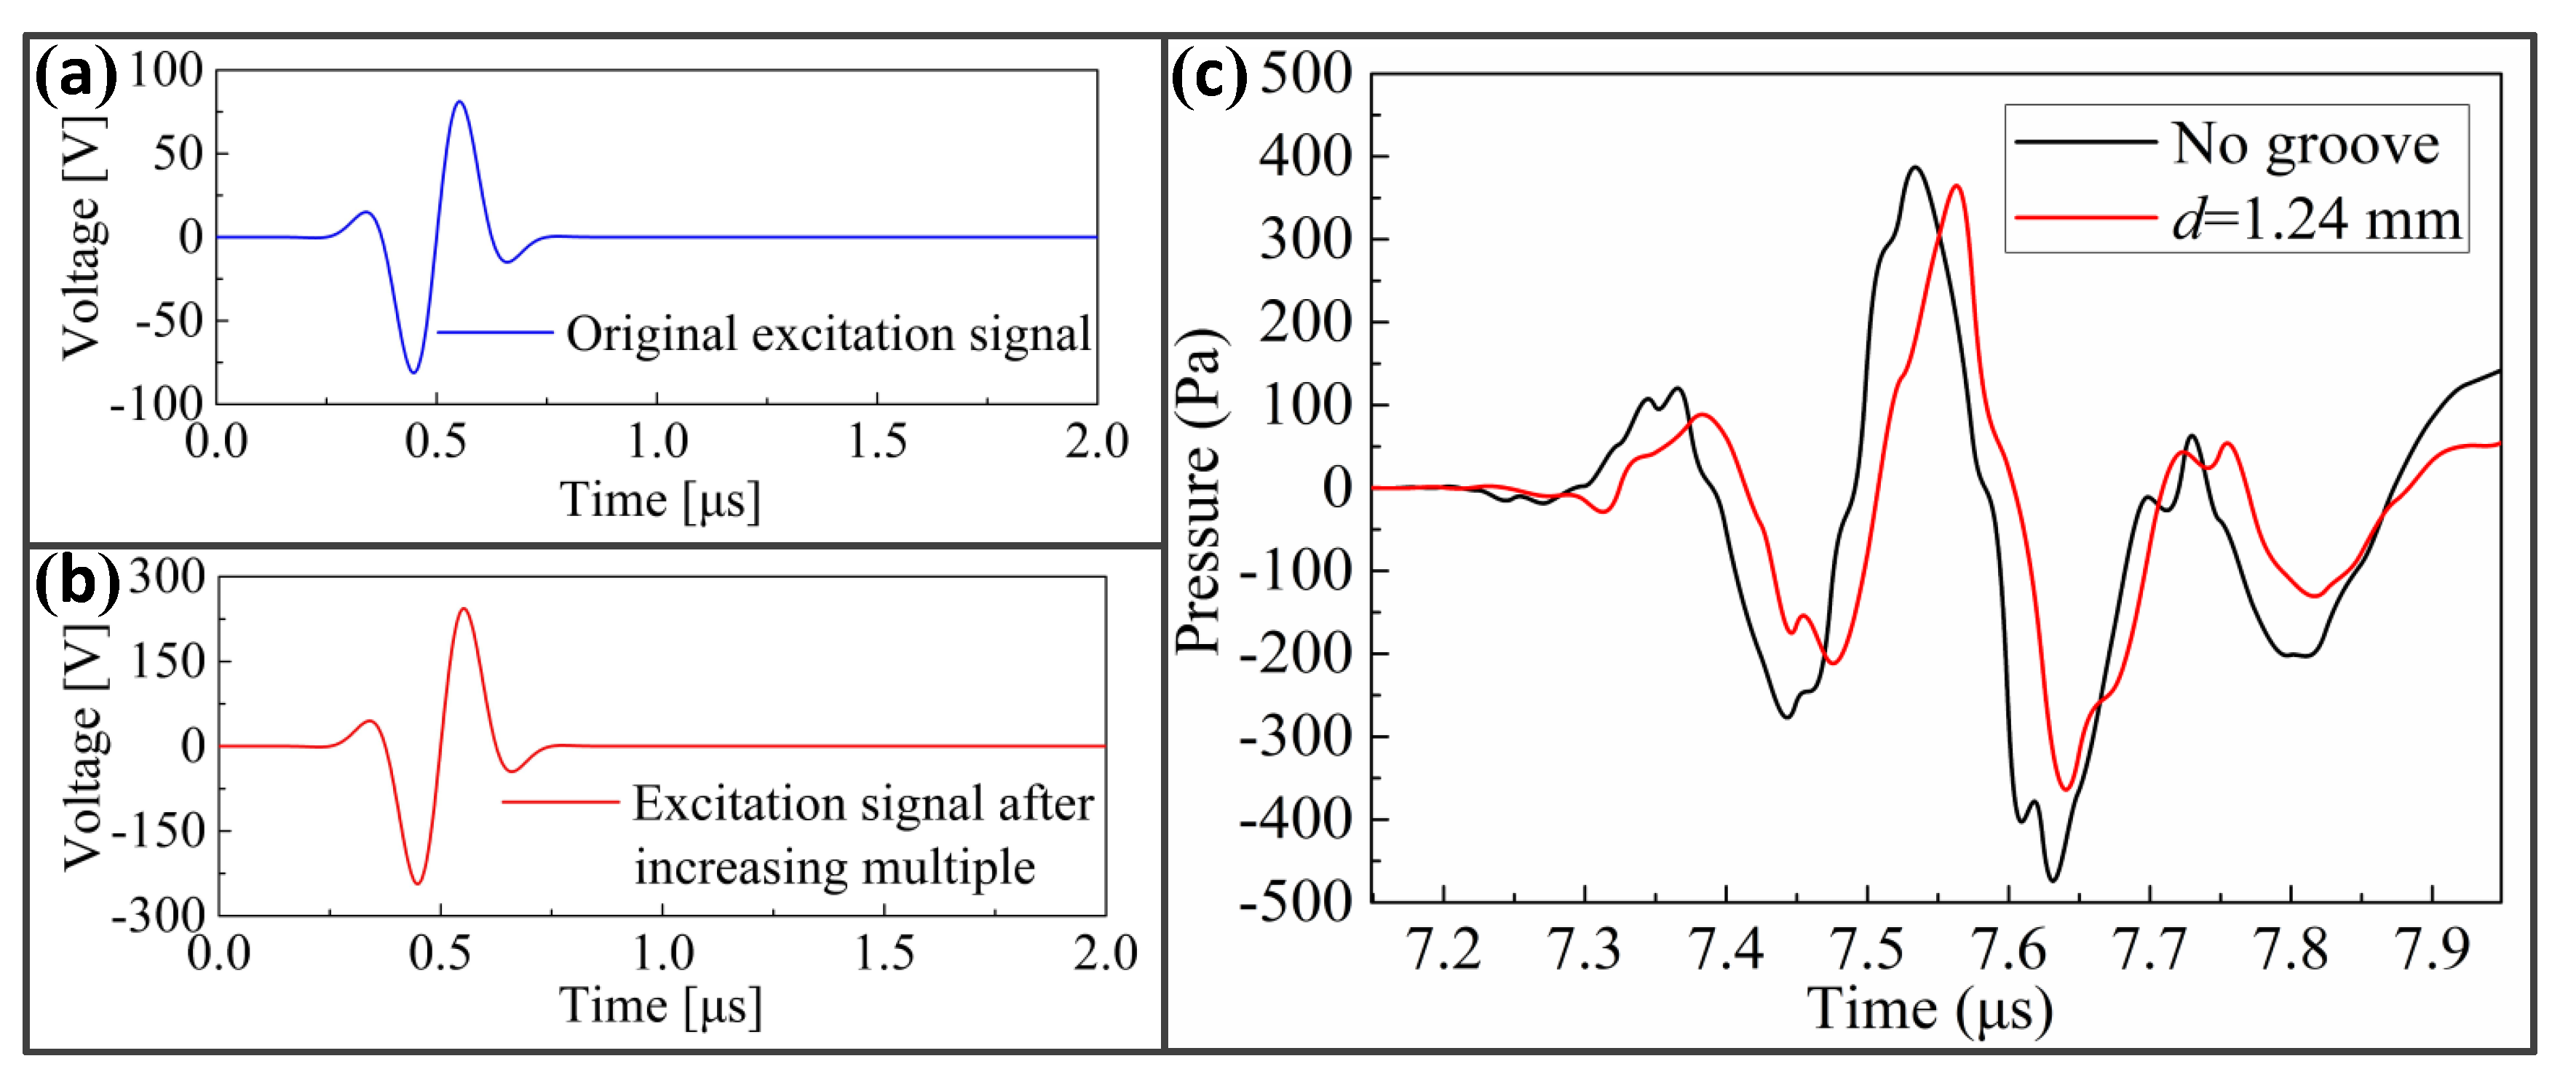
There is a positive correlation between the sound pressure amplitude of the LCR wave and the excitation voltage of the ultrasonic transducer, so the corresponding excitation voltage can be used according to the measurement requirements. In order to study whether different excitation voltages will affect the propagation depth of the LCR wave and thus affect the spatial range of stress measurements, it is necessary to carry out the corresponding simulation and comparative analysis.
In this paper, the excitation signal
was used in the simulation study of the relationship between the propagation depth of LCR wave and frequency, as shown in
Figure 13a. To study the effect of the excitation voltage value on the propagation depth of the LCR wave,
was selected for simulation and comparative analysis, as shown in
Figure 13b.
S2(
t) has the same waveform as
S1(
t), and its value is three times that of
S1(
t). When
S2(
t) was used as the excitation signal, the propagation time extension of the LCR wave caused by a 1.24 mm groove was analyzed directly, as shown in
Figure 13c. By comparing this extension with that when the excitation signal
S1(
t) was used, it can be judged whether the excitation voltage influences the propagation depth of the LCR wave.
Using the cross-correlation algorithm, it can be seen that when the excitation signal
S2(
t) was used, the propagation time extension of LCR wave generated by the 1.24 mm groove is 12.51 ns. It is the same as that when the excitation signal
S1(
t) was used. Therefore, when the excitation signal
S2(
t) was used, the propagation depth of the LCR wave with a frequency of 4 MHz is still 1.24 mm; that is, the propagation depth does not change after the excitation voltage is increased. By comparing
Figure 9 and
Figure 13c, it can be concluded that the sound pressure amplitude of the LCR wave generated by the excitation signal
S2(
t) is exactly three times that generated by
S1(
t). This means that as the value of the excitation signal increases, the sound pressure amplitude also increases proportionally.
5.4. Significant Challenges in Stress Measurement of Rotors with and Complex Geometries
Modern aero-engine rotors generally have complex geometries such as a curved surface, which brings great challenges to rotor stress measurements based on LCR waves. First of all, the curvature of the rotor surface will cause the ultrasonic beam to scatter and focus, so how to accurately and reliably project the ultrasonic beam to the area to be measured is the primary challenge in the stress measurement of complex structures. Secondly, changes in curvature lead to changes in the profile of the measured surface. Therefore, the mechanical mechanism needs to adjust and control the attitude of the transducers in real time, so that the transducers can track the contour during the measurement process to ensure an accurate transmission and reception of acoustic signals. Finally, the commonly used piezoelectric elements have a certain size (diameter 6–12 mm), so when the rotor surface curvature is large, it is more difficult to arrange the transducer.


