An Integrated Front-end Circuit Board for Air-Coupled CMUT Burst-Echo Imaging


Abstract
:1. Introduction
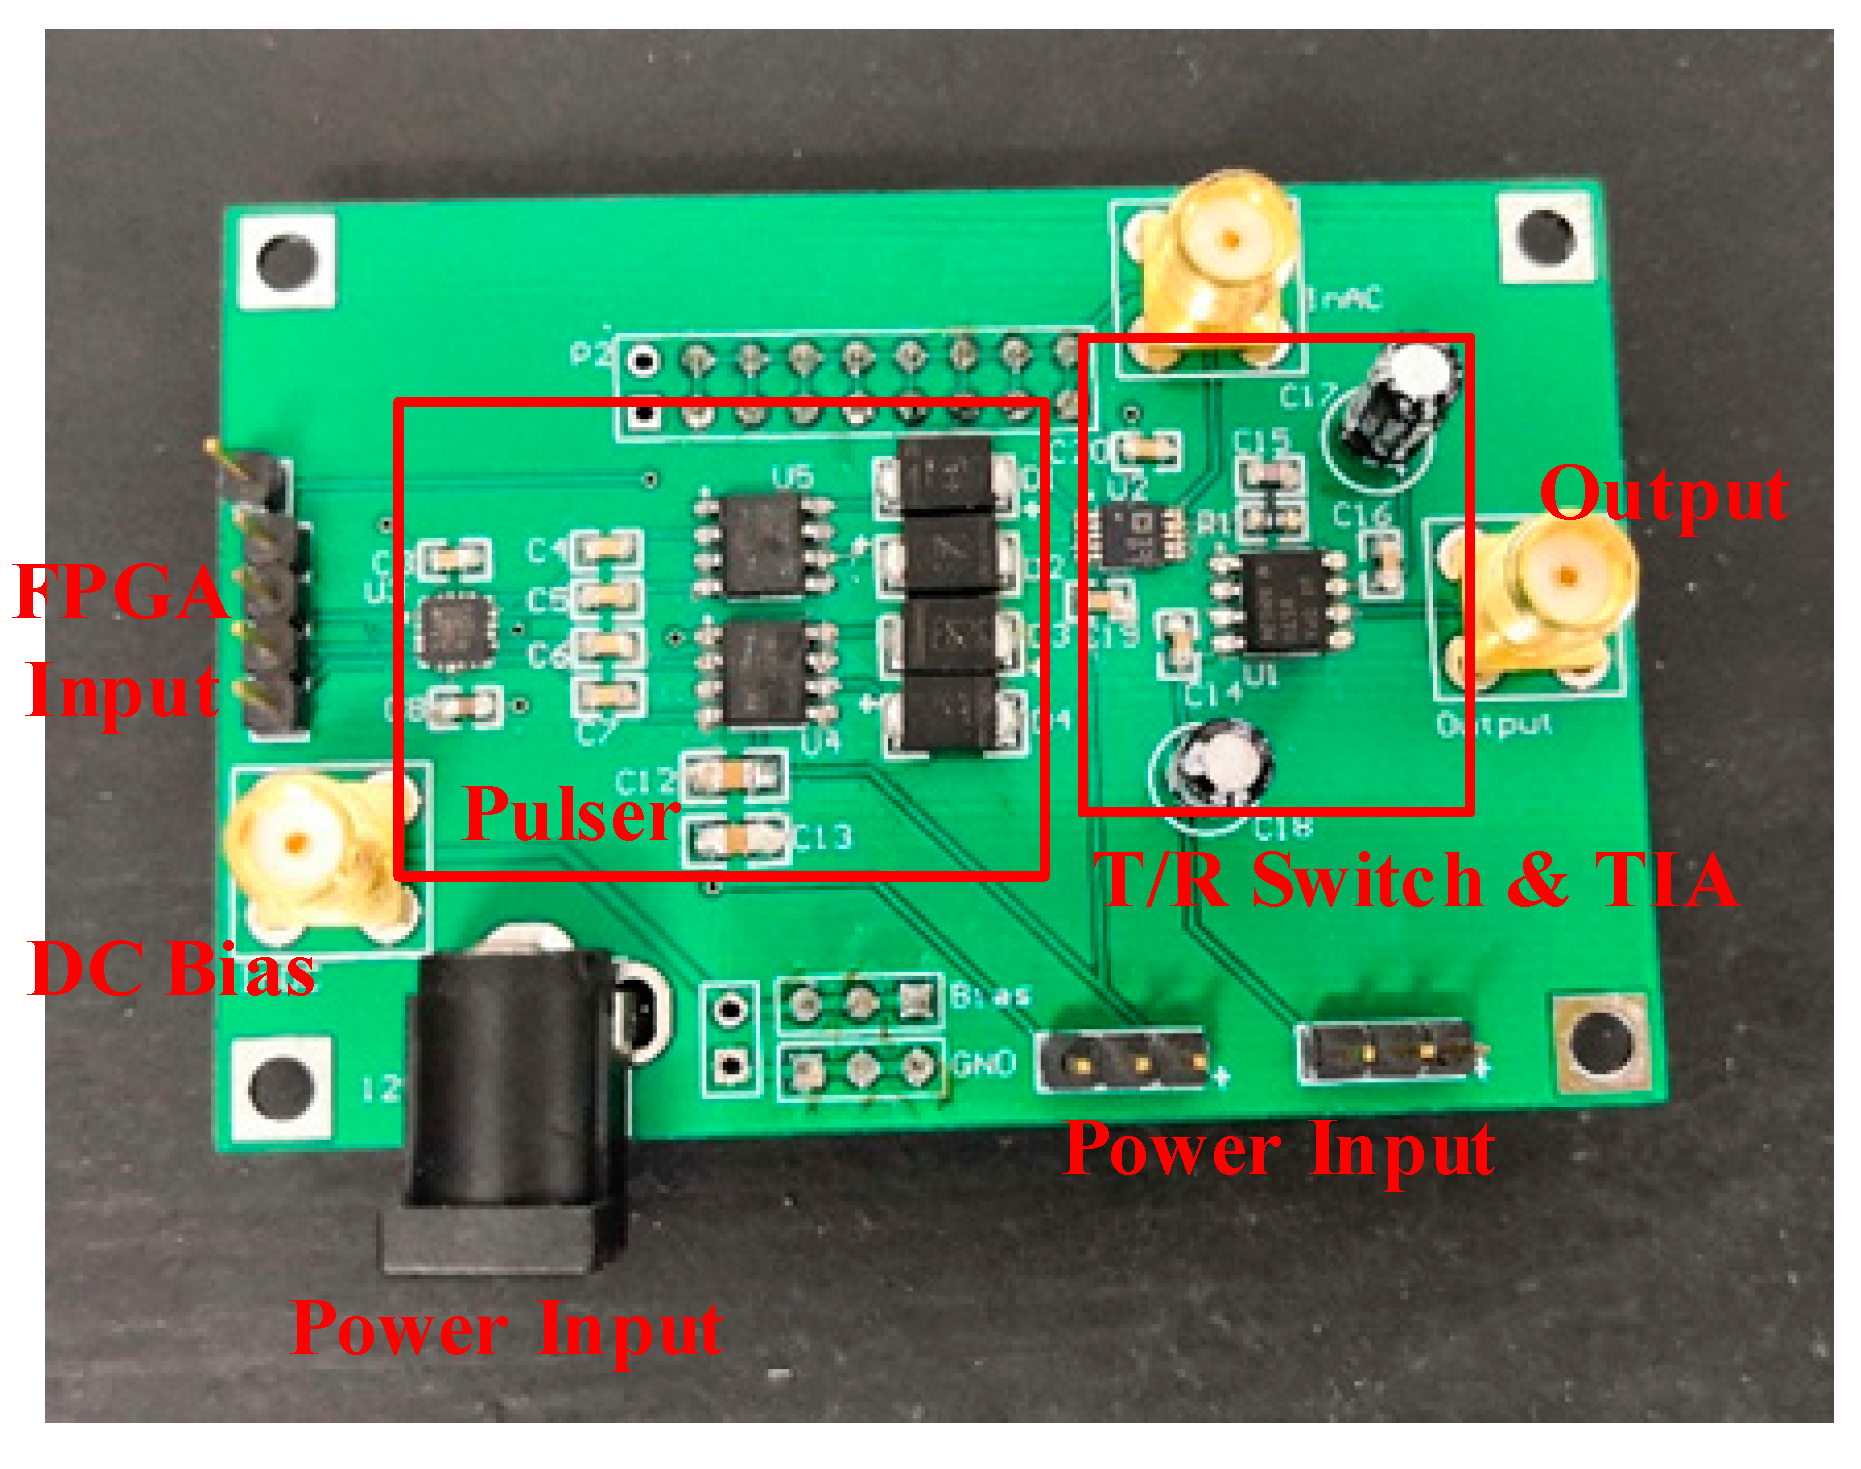
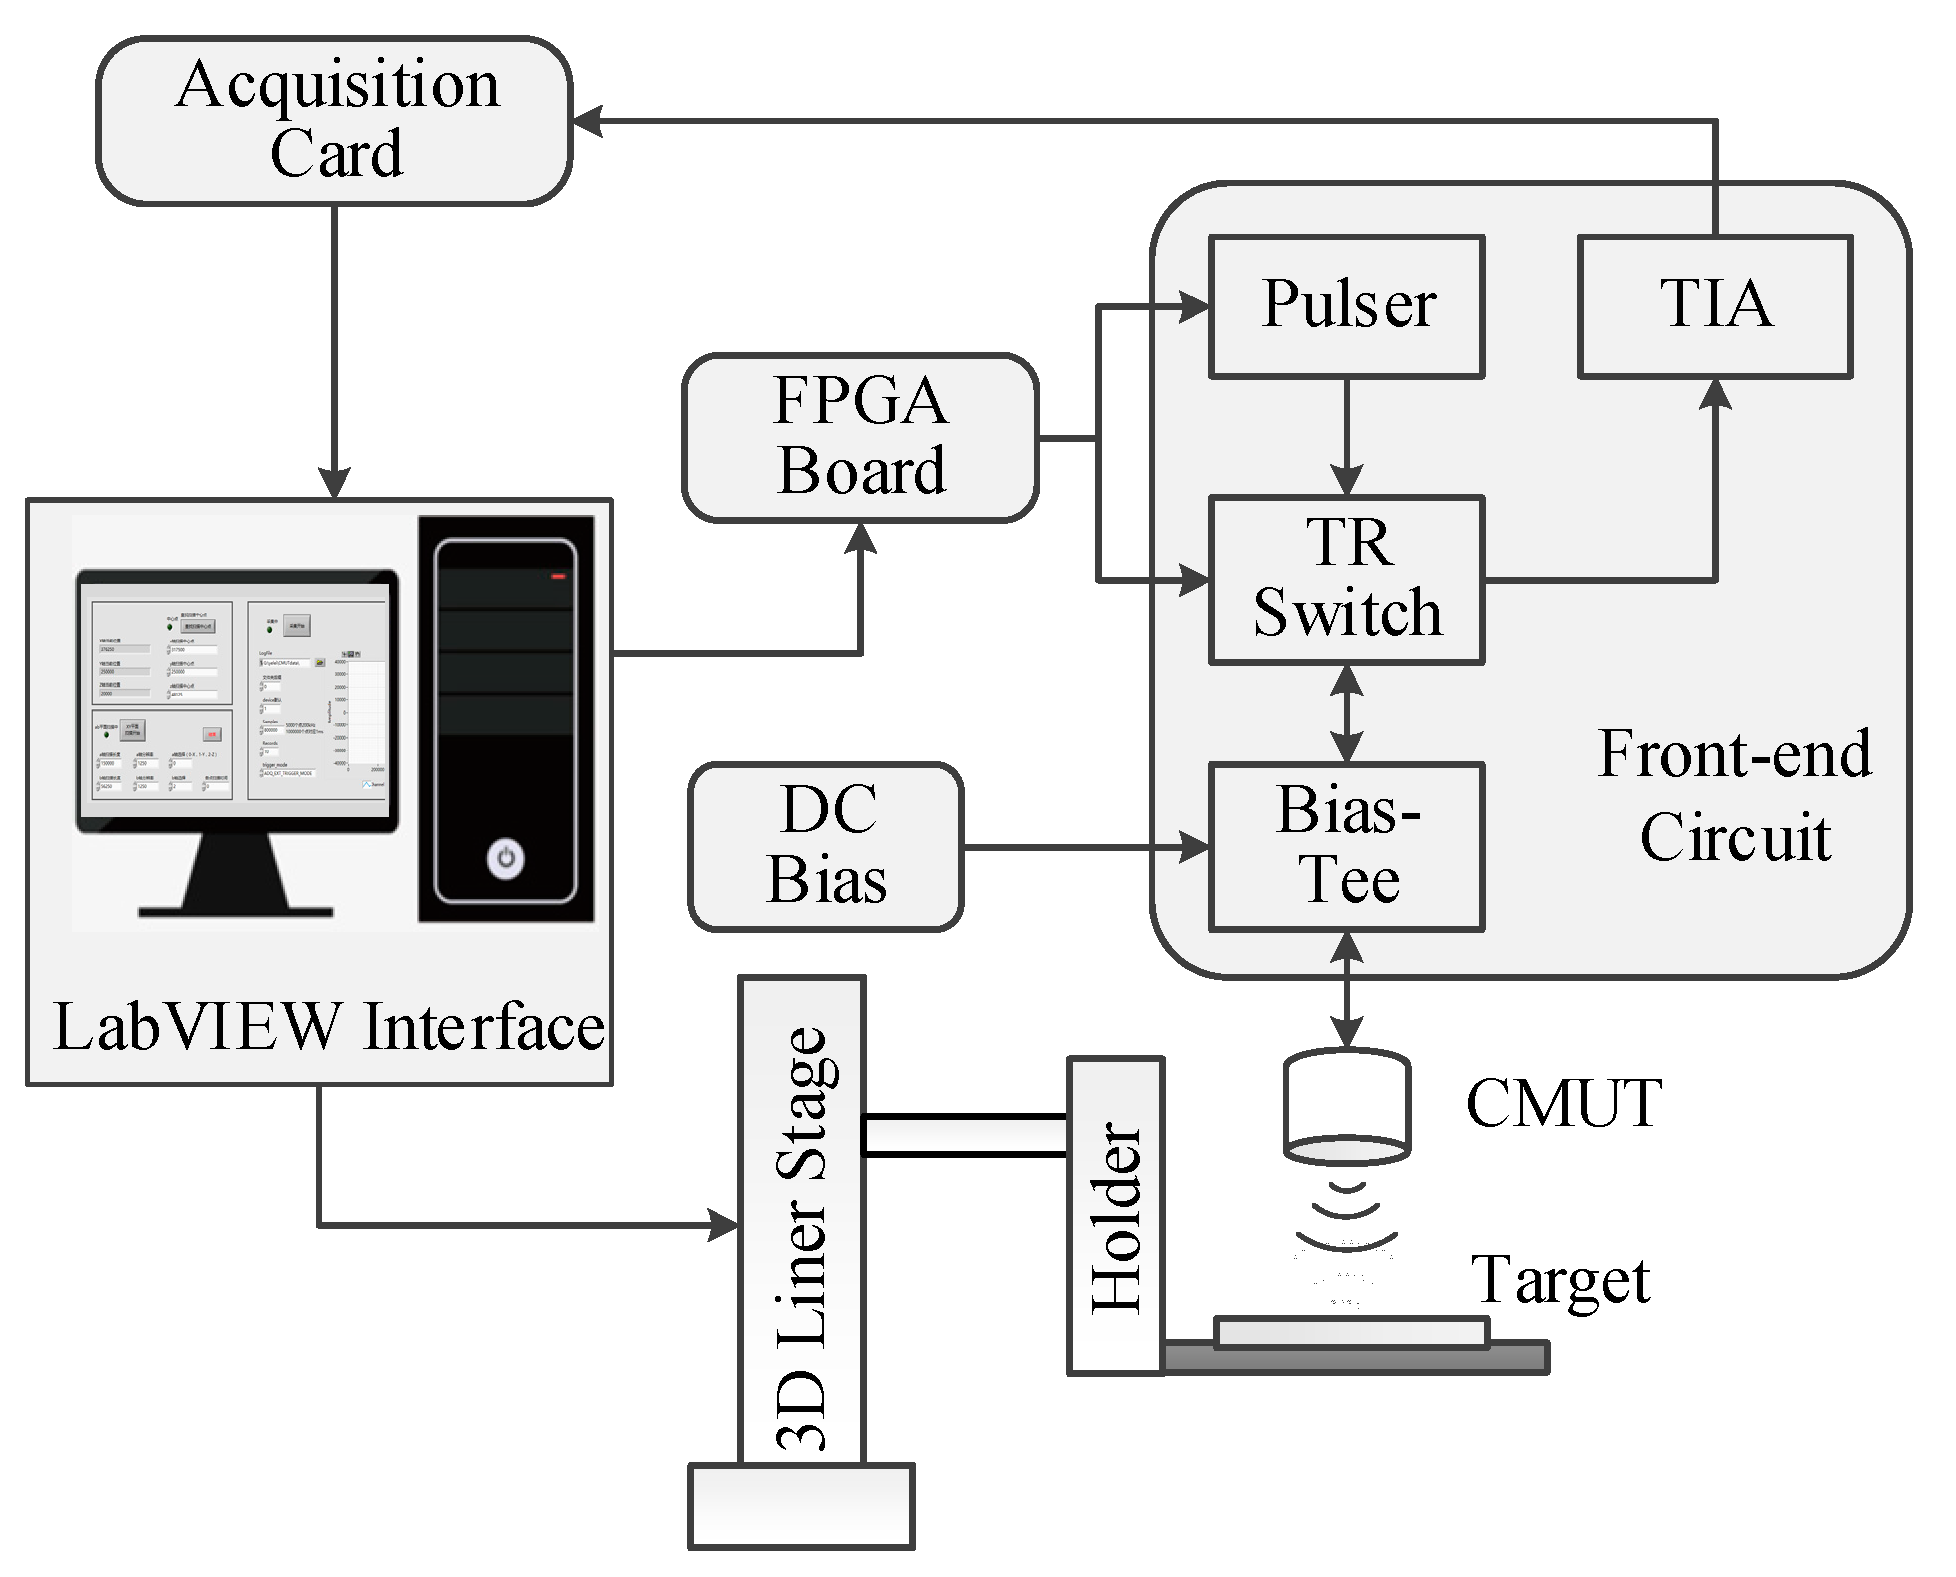
2. Circuit Design
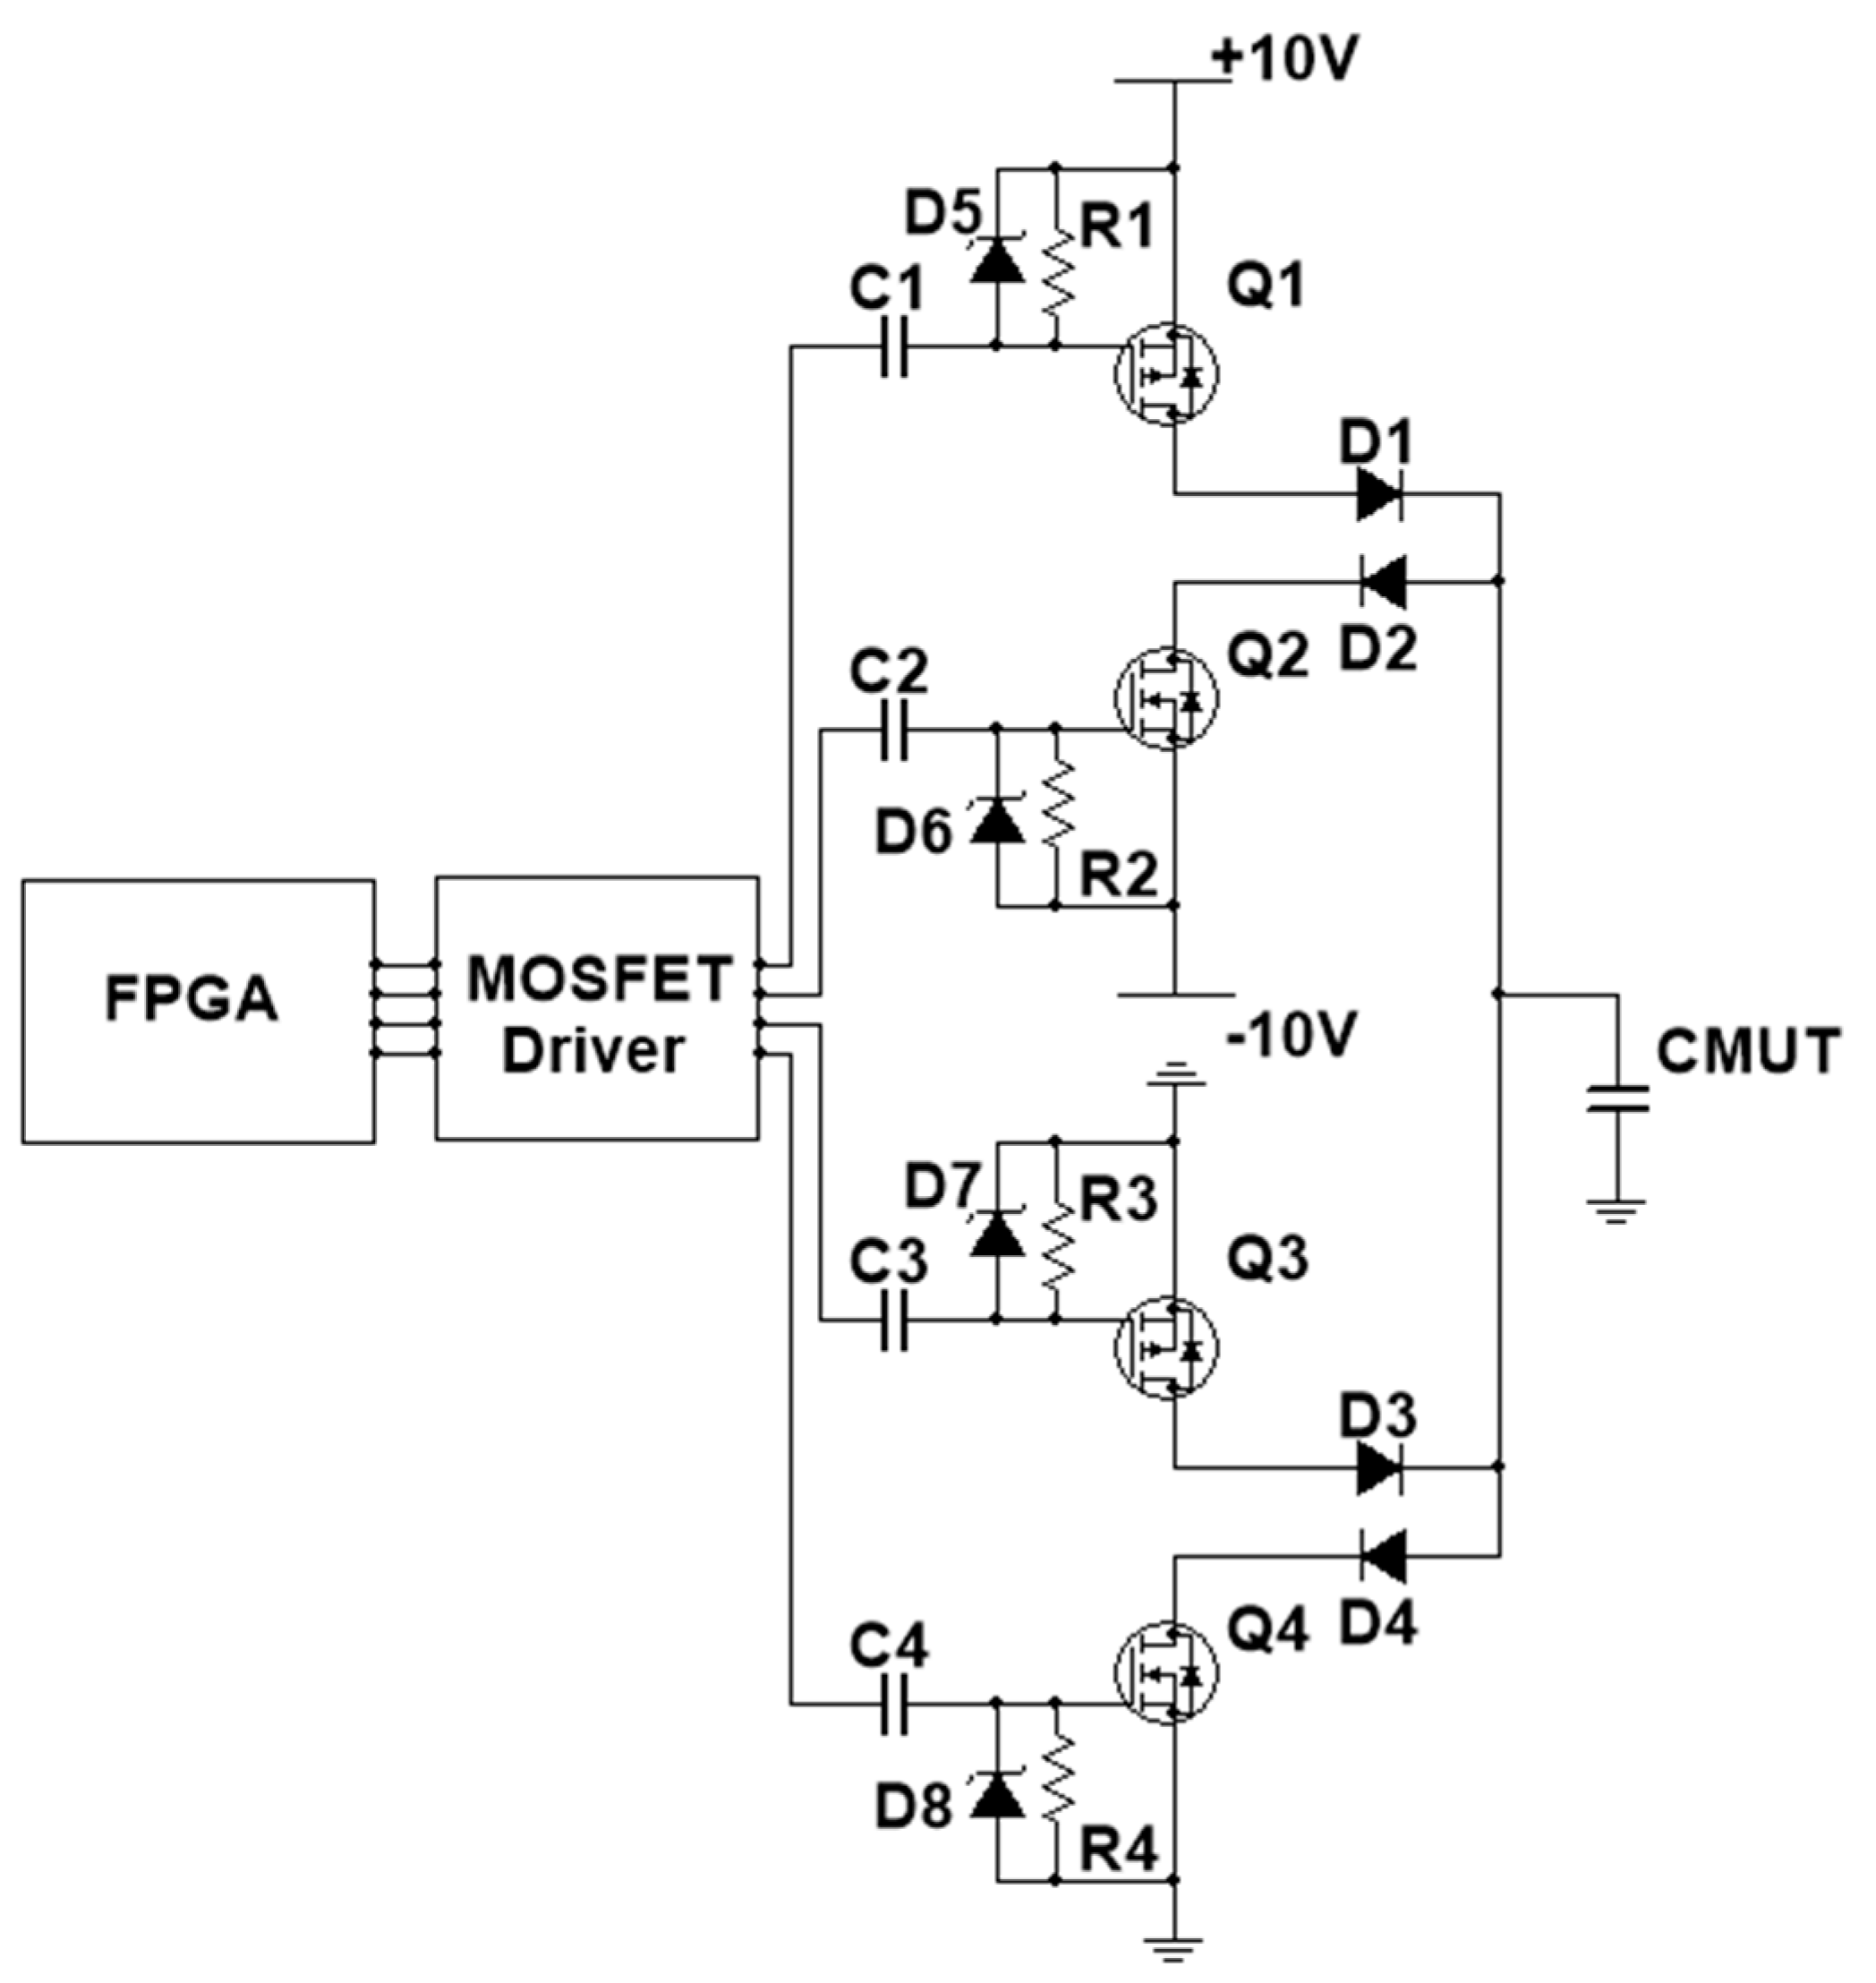
2.1. On-Board Pulser
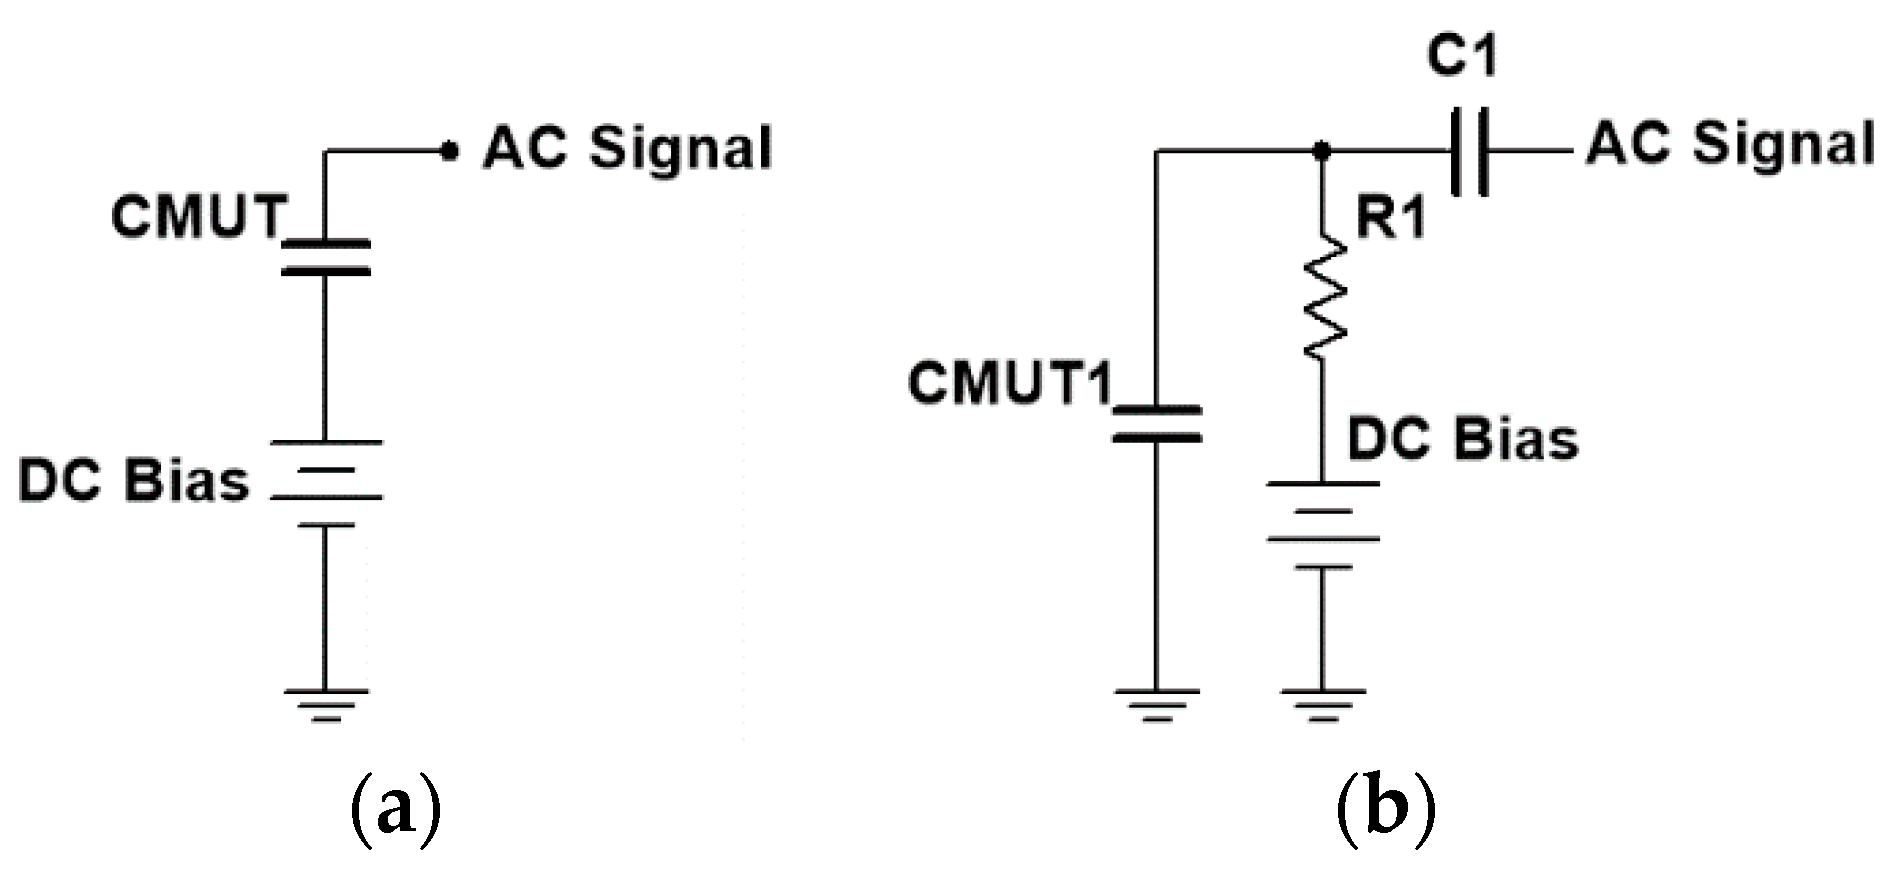
2.2. Bias-Tee
2.3. T/R Switch
2.4. Amplifier
3. Circuit Characterization
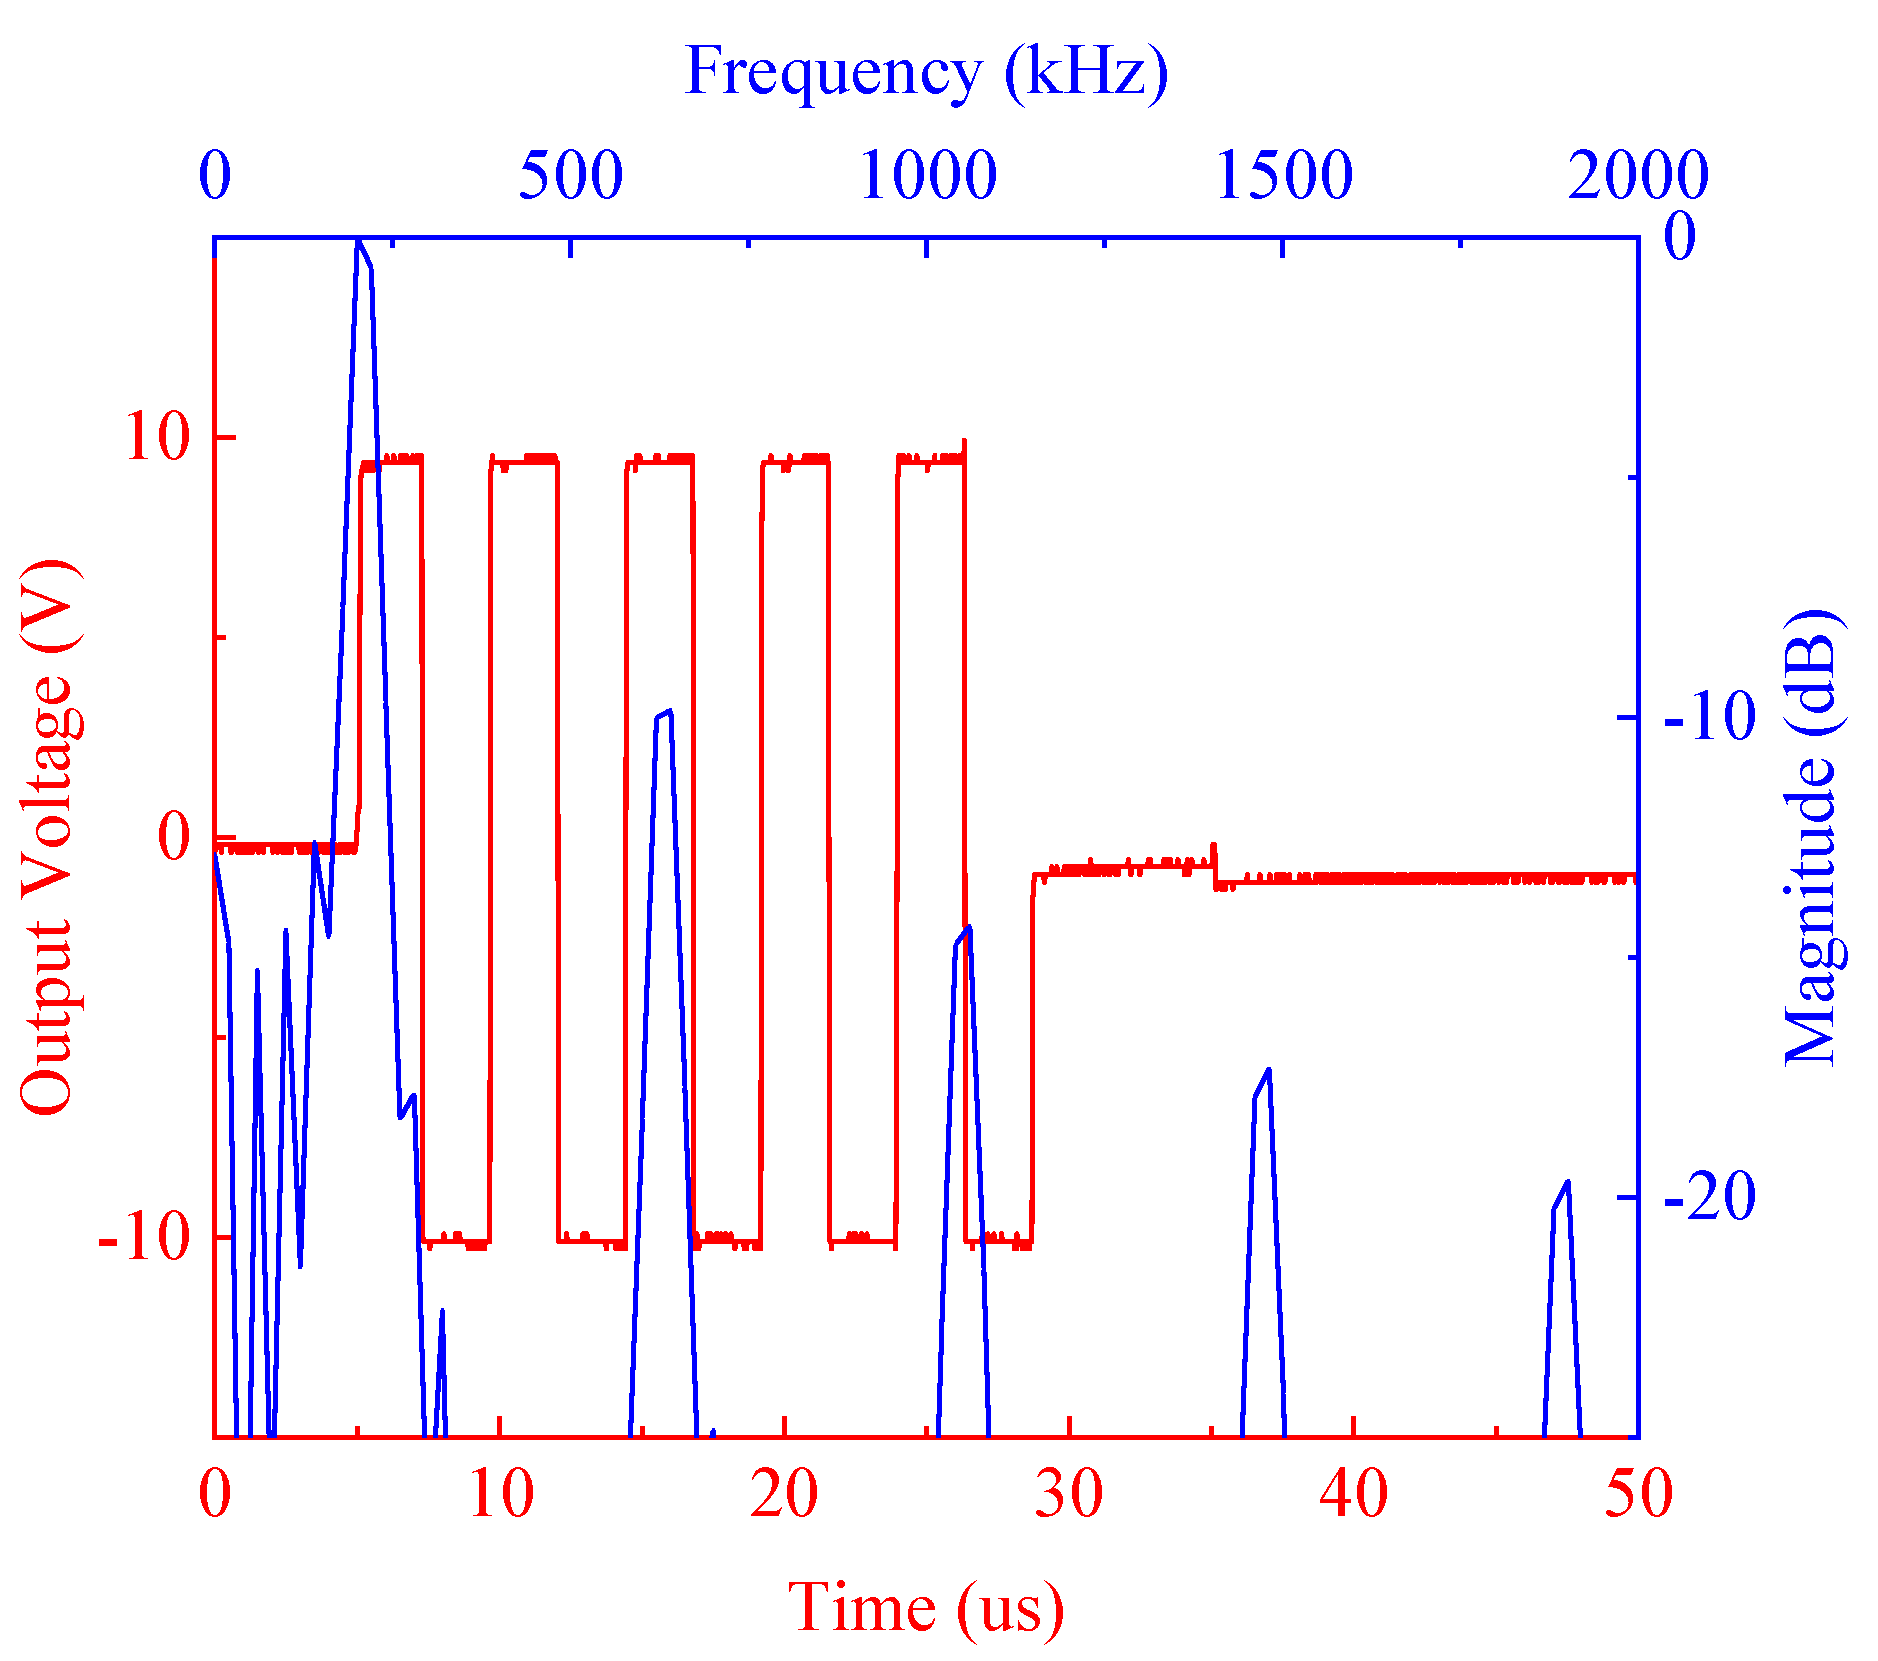
3.1. Pulser Characterization
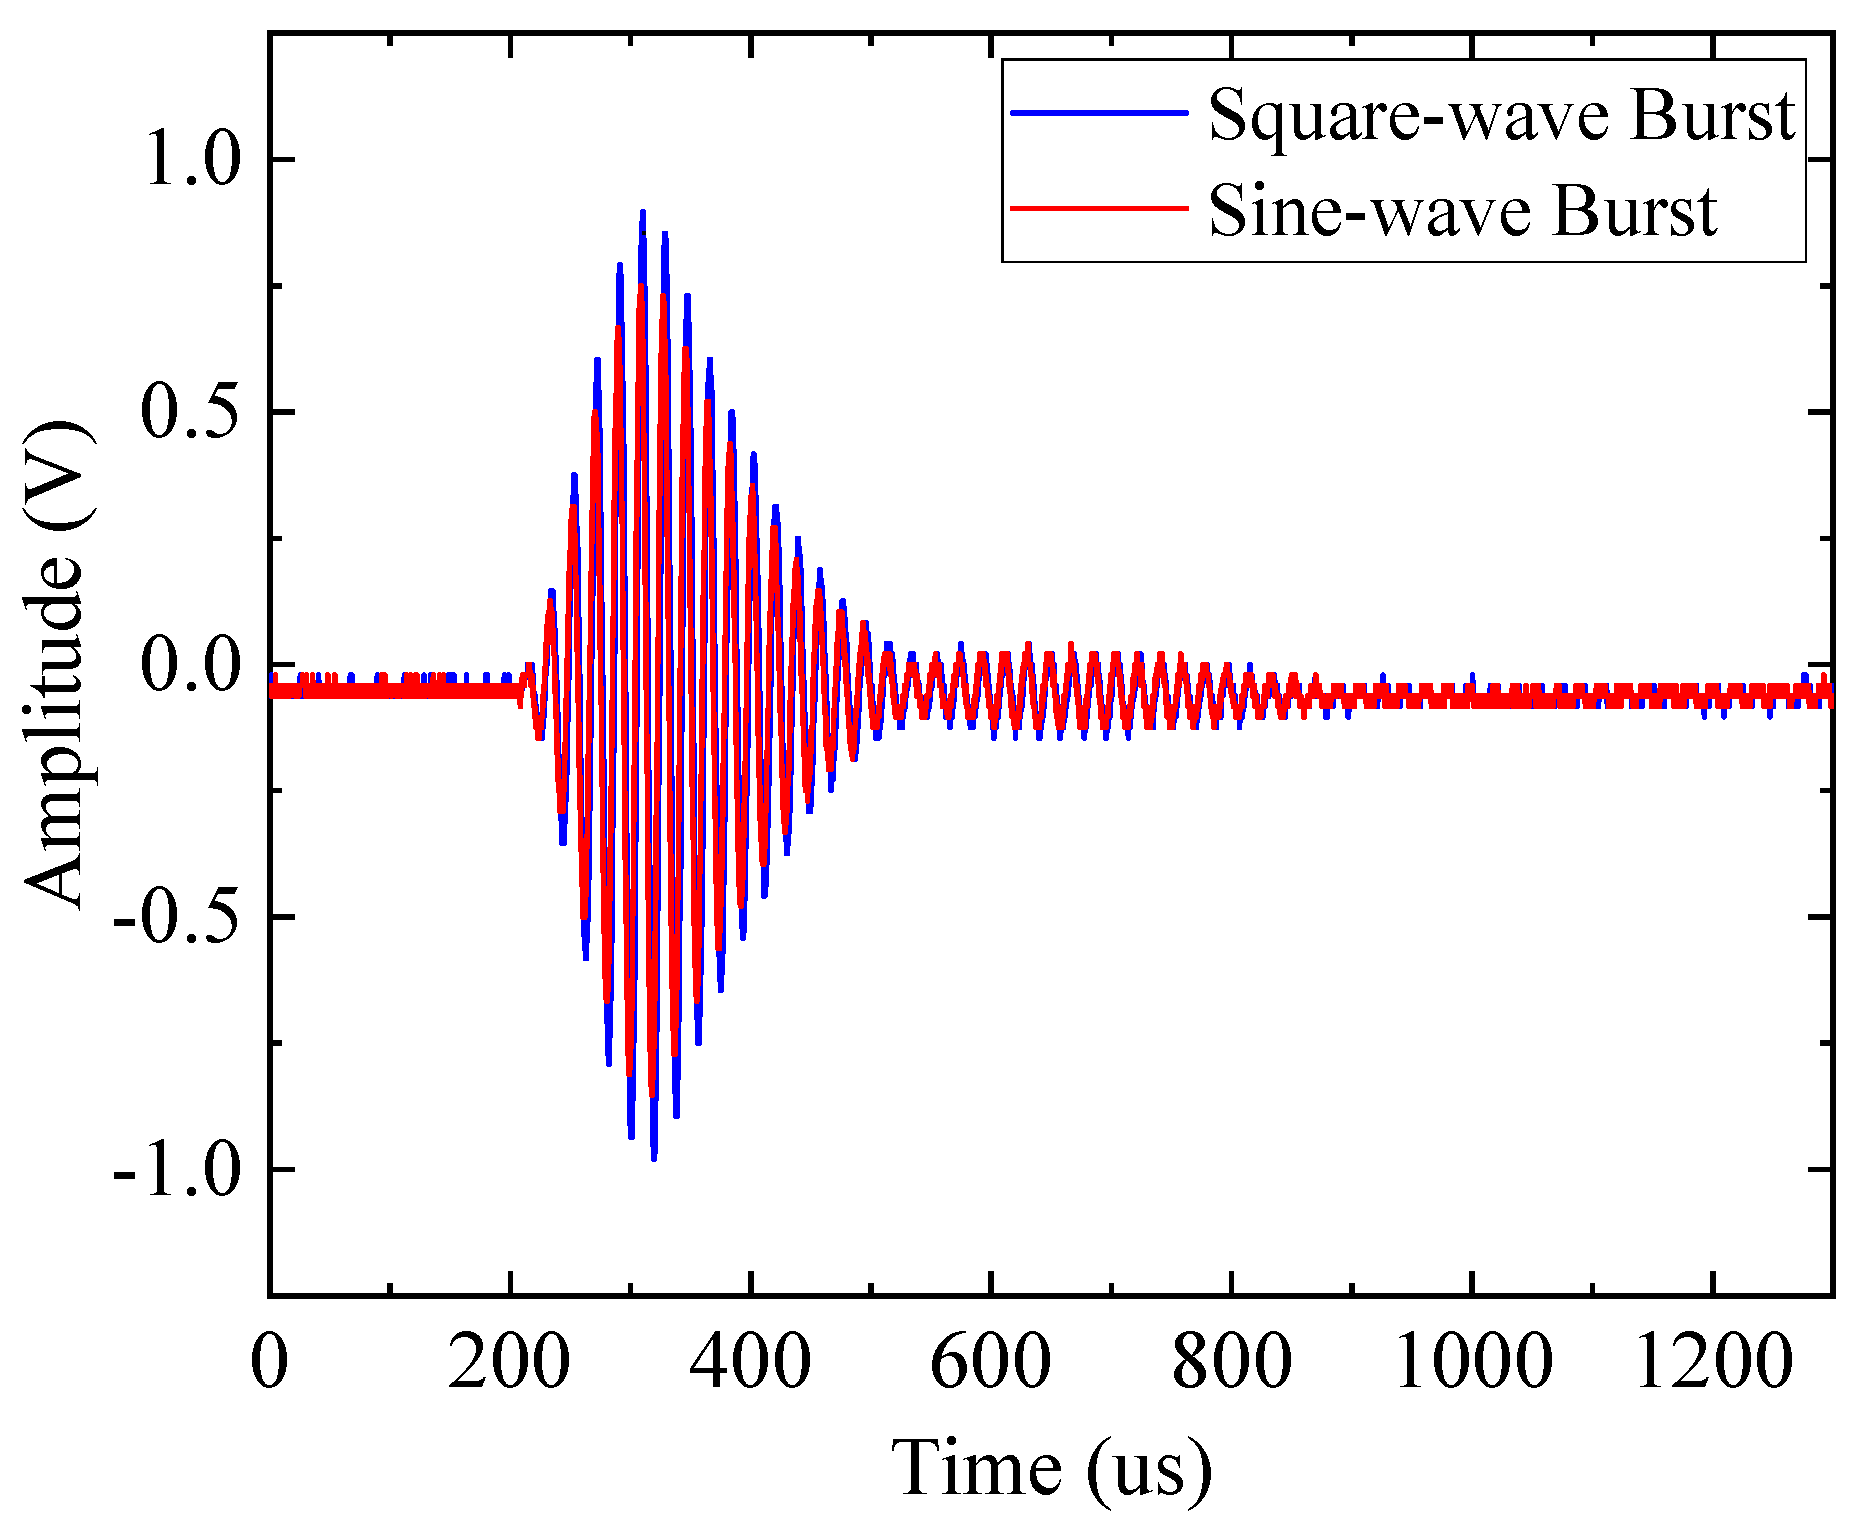
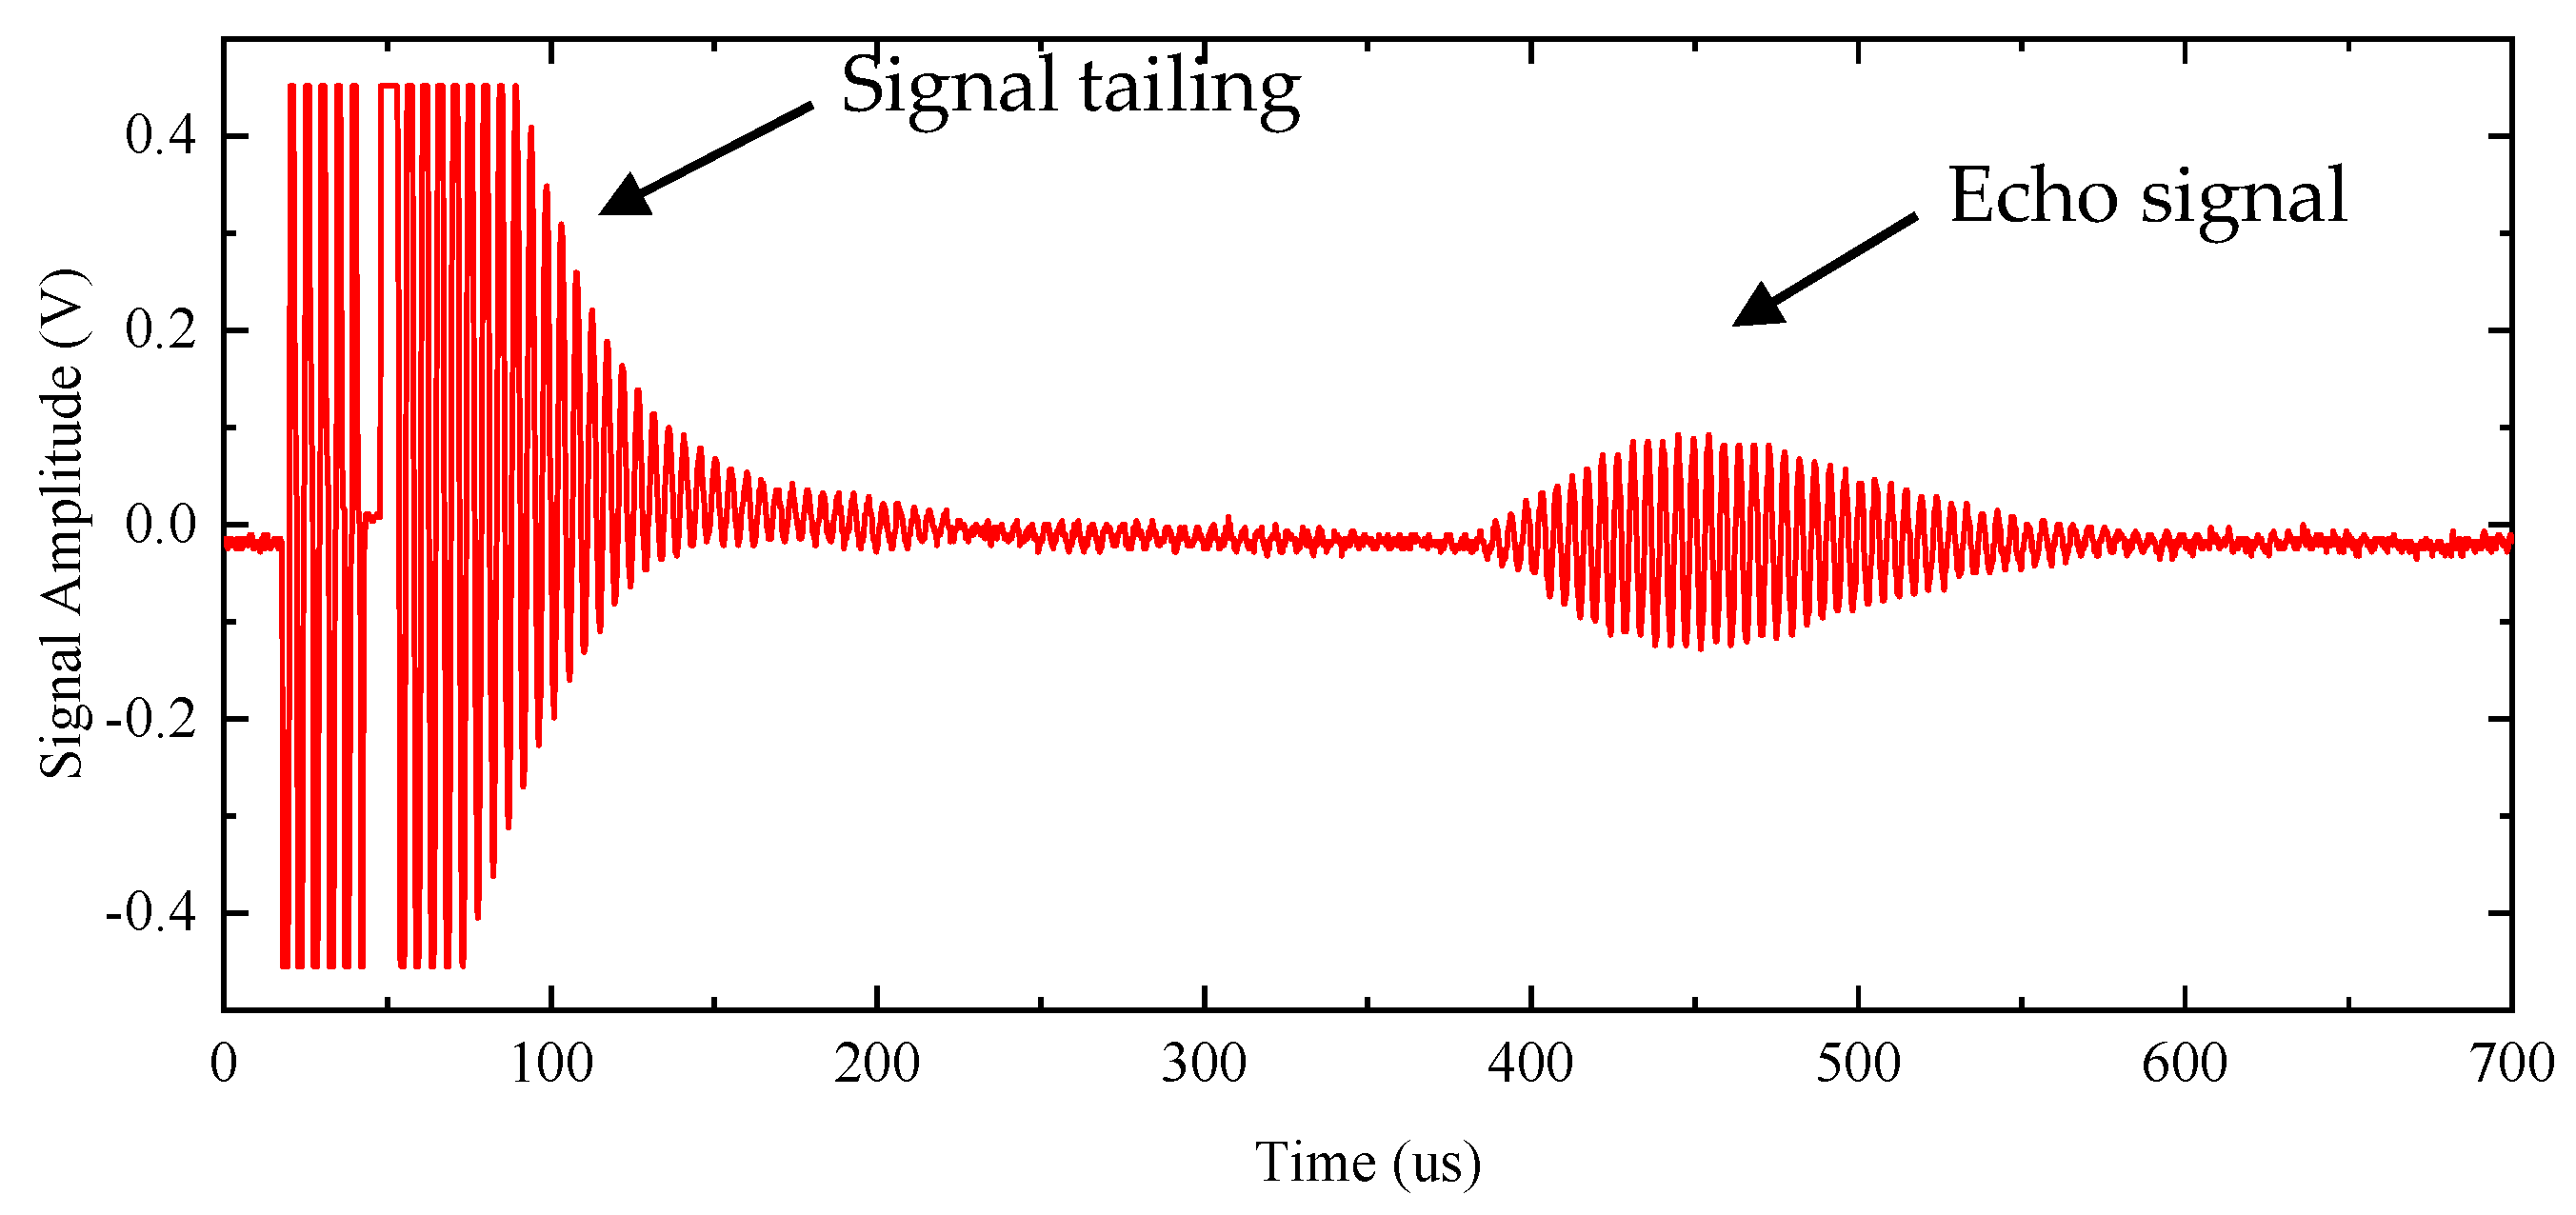
3.2. Burst-Echo Characterization
3.3. SNR Characterization
4. Imaging
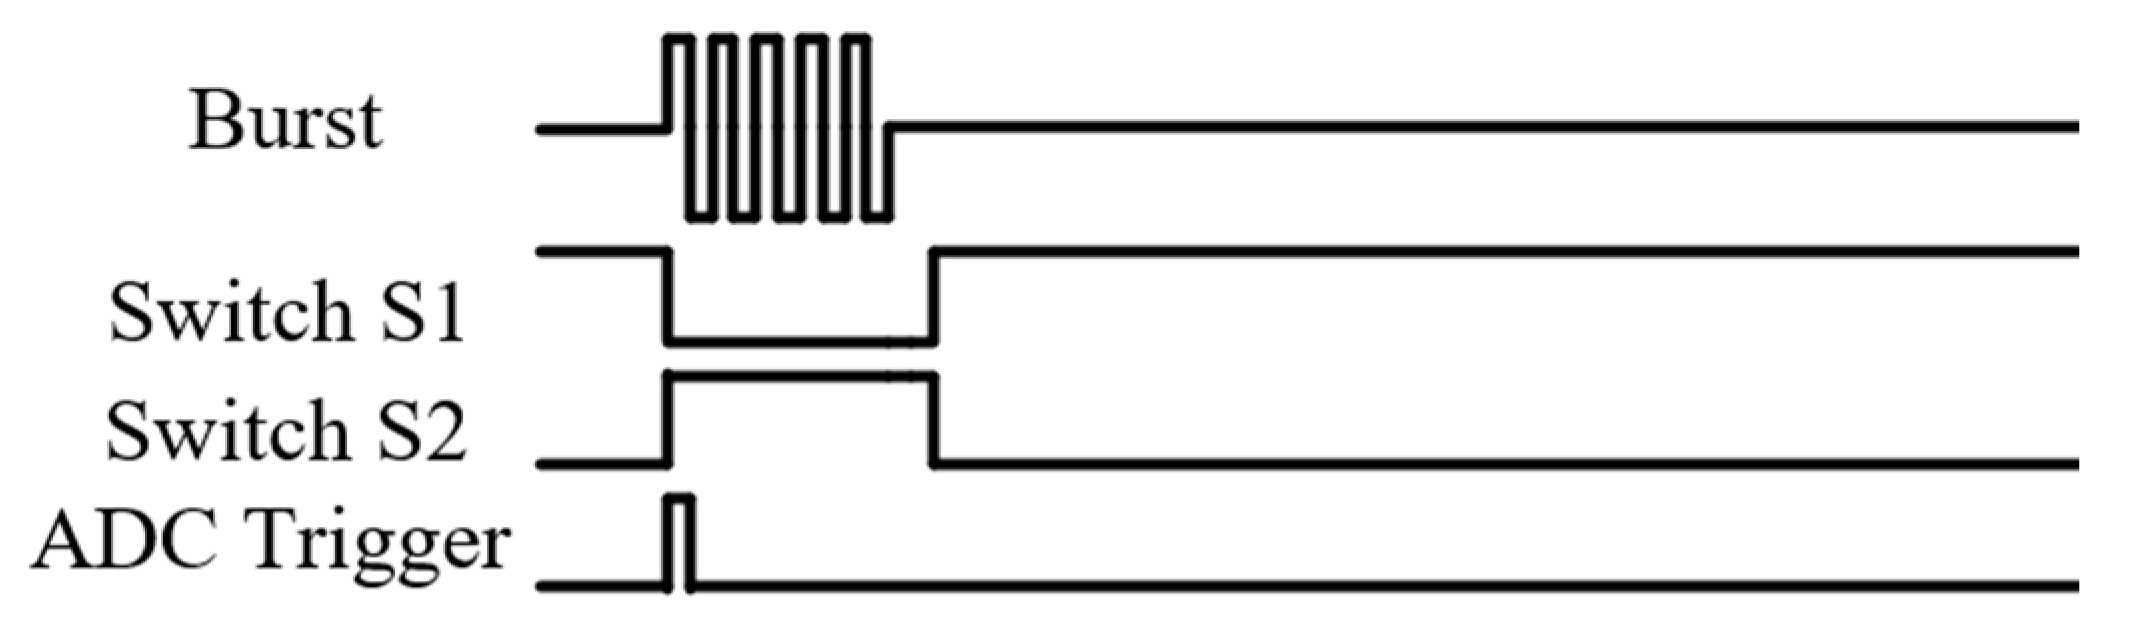
4.1. Imaging Method
4.2. Imaging Result
4.3. Imaging Range
5. Conclusions
Author Contributions
Funding
Conflicts of Interest
References
- Boulmé, A.; Ngo, S.; Minonzio, J.G.; Legros, M. A Capacitive Micromachined Ultrasonic Transducer Probe for Assessment of Cortical Bone. IEEE Trans. Ultrason. Ferroelectr. Freq. Control 2014, 61, 710–723. [Google Scholar] [CrossRef] [Green Version]
- Livings, A.; Dayal, V.; Barnard, D. Damage Detection in a Multi-Layered, Multi-Material Composite Using Air-Coupled Ultrasonic Resonance Imaging. J. Nondestruct. Eval. 2011, 35, 55. [Google Scholar] [CrossRef]
- Dahl, T.; Ealo, J.L.; Bang, H.J.; Holm, S.; Khuri-Yakub, P. Applications of airborne ultrasound in human-computer interaction. Ultrasonics 2014, 54, 1912–1921. [Google Scholar] [CrossRef] [PubMed]
- Sunarsa, T.Y.; Aryan, P.; Jeon, I.; Park, B.; Liu, P.; Sohn, H. A reference-free and non-contact method for detecting and imaging damage in adhesive-bonded structures using air-coupled ultrasonic transducers. Materials 2017, 10, 1402. [Google Scholar] [CrossRef] [PubMed] [Green Version]
- Ergun, A.S.; Temelkuran, B.; Ozbay, E.; Atalar, A. A new detection method for capacitive micromachined ultrasonic transducers. IEEE Trans. Ultrason. Ferroelectr. Freq. Control 2001, 48, 932–942. [Google Scholar] [CrossRef] [PubMed] [Green Version]
- Vallet, M.; Varray, F.; Boutet, J.; Dinten, J.M.; Caliano, G. Quantitative comparison of PZT and CMUT probes for photoacoustic imaging: Experimental validation. Photoacoustics 2017, 8, 48–58. [Google Scholar] [CrossRef] [PubMed]
- Wang, H.L.; Wang, X.J.; He, C.D.; Xue, C.Y. Design and performance analysis of capacitive micromachined ultrasonic transducer linear array. Micromachines 2014, 5, 420–431. [Google Scholar] [CrossRef] [Green Version]
- Senlik, M.N.; Olcum, S.; Köymen, H.; Atalar, A. Bandwidth, Power and Noise Considerations in Airborne cMUTs. In Proceedings of the IEEE International Ultrasonics Symposium, Roma, Italy, 20–23 September 2009. [Google Scholar]
- Kupnik, M.; Ho, M.C.; Vaithilingam, S.; Khuri-Yakub, B.T. CMUTs for air coupled ultrasound with improved bandwidth. In Proceedings of the IEEE International Ultrasonics Symposium, Orlando, FL, USA, 18–21 October 2011. [Google Scholar]
- Park, K.K.; Khuri-Yakub, B.T. 3-D airborne ultrasound synthetic aperture imaging based on capacitive micromachined ultrasonic transducers. Ultrasonics 2013, 53, 1355–1362. [Google Scholar] [CrossRef] [PubMed]
- Na, S.; Chen, A.I.H.; Wong, L.L.P.; Li, Z.H.; Macecek, M.; Yeow, J.T.W. Capacitive micromachined ultrasonic transducers based on annular cell geometry for air-coupled applications. Ultrasonics 2016, 71, 152–160. [Google Scholar] [PubMed]
- Shanmugam, P.; Iglesias, L.; Michaud, J.F.; Dufour, I. CMUT Based Air Coupled Transducers for Gas-Mixture Analysis. In Proceedings of the IEEE International Ultrasonics Symposium, Kobe, Japan, 22–25 October 2018. [Google Scholar]
- Zhang, H.; Liang, D.M.; Wang, Z.C.; Ye, L.; Rui, X.B.; Zhang, X.L. Fabrication and Characterization of a Wideband Low-frequency CMUT Array for Air-coupled Imaging. IEEE Sens. J. 2020. [Google Scholar] [CrossRef]
- Wang, H.L.; Tong, Y.F.; Wang, X.J.; He, C.D.; Xue, C.Y. Experimental investigation of the influence of excitation signal on radiation characteristics of capacitive micromachined ultrasonic transducer. Microsyst. Technol. Micro Nanosyst. Inf. Storage Process. Syst. 2018, 24, 5055–5063. [Google Scholar] [CrossRef]
- Cicek, I.; Bozkurt, A.; Karaman, M. Design of a front-end integrated circuit for 3D acoustic imaging using 2D CMUT arrays. IEEE Trans. Ultrason. Ferroelectr. Freq. Control 2005, 52, 2235–2241. [Google Scholar] [CrossRef] [PubMed]
- Yamaner, F.Y.; Bozkurt, A. Front-end IC Design for 2D cMUT Arrays: Modeling and Experimental Verification. In Proceedings of the IEEE Ultrasonics Symposium Proceeding, New York, NY, USA, 28–31 October 2007. [Google Scholar]
- Caronti, A.; Caliano, G.; Savoia, A.; Carotenuto, R.; Pappalardo, M. A Low-Noise, Wideband Electronic System for Pulse-Echo Ultrasound Imaging with CMUT Arrays. In Proceedings of the IEEE Ultrasonics Symposium, Montreal, QC, Canada, 23–27 August 2004. [Google Scholar]
- Behnamfar, P.; Mirabbasi, S. Design of a high-voltage analog front-end circuit for integration with CMUT arrays. In Proceedings of the Biomedical Circuits and Systems Conference, Paphos, Cyprus, 3–5 November 2010. [Google Scholar]
- Gurun, G.; Hasler, P.; Degertekin, F.L. Front-end receiver electronics for high-frequency monolithic CMUT-on-CMOS imaging arrays. IEEE Trans. Ultrason. Ferroelectr. Freq. Control 2011, 58, 1658–1668. [Google Scholar] [CrossRef] [PubMed] [Green Version]
- Zhang, L.; Wu, X.L. On the application of cross correlation function to subsample discrete time delay estimation. Digit. Signal Process. 2006, 16, 682–694. [Google Scholar] [CrossRef]


| Noise or Signal | Effective Value (mV) |
|---|---|
| Noise of amplifier | 0.70 |
| Noise of amplifier and switches | 3.80 |
| Noise of amplifier, switches and CMUT | 3.40 |
| Noise of amplifier, switches, CMUT and DC bias | 3.80 |
| Signal of echo | 53.30 |
Publisher’s Note: MDPI stays neutral with regard to jurisdictional claims in published maps and institutional affiliations. |
© 2020 by the authors. Licensee MDPI, Basel, Switzerland. This article is an open access article distributed under the terms and conditions of the Creative Commons Attribution (CC BY) license (http://creativecommons.org/licenses/by/4.0/).
Share and Cite
Ye, L.; Li, J.; Zhang, H.; Liang, D.; Wang, Z. An Integrated Front-end Circuit Board for Air-Coupled CMUT Burst-Echo Imaging. Sensors 2020, 20, 6128. https://doi.org/10.3390/s20216128
Ye L, Li J, Zhang H, Liang D, Wang Z. An Integrated Front-end Circuit Board for Air-Coupled CMUT Burst-Echo Imaging. Sensors. 2020; 20(21):6128. https://doi.org/10.3390/s20216128
Chicago/Turabian StyleYe, Lei, Jian Li, Hui Zhang, Dongmei Liang, and Zhuochen Wang. 2020. "An Integrated Front-end Circuit Board for Air-Coupled CMUT Burst-Echo Imaging" Sensors 20, no. 21: 6128. https://doi.org/10.3390/s20216128